land-use change, tropical biodiversity, and ecosystem services – southeast … · 2012-01-09 ·...
TRANSCRIPT

Land-use change, tropical biodiversity, and ecosystem services –
Southeast Asian amphibians and reptiles in focus
Thomas Cherico Wanger
Born 31st May 1981 in Marburg a.d. Lahn, Germany
A thesis submitted to the
University of Adelaide,
Australia
in fulfilment of the requirements for the degree of
Doctor of Philosophy
December 2010

To my parents.
“The fire had been violent, and now only smouldering black stumps
remained. The aspect of the land was desolate. The great trees had toppled
down, tearing up the soil and making deep pits. All the landscape was soiled
with ash and soot. Smouldering trunks lay everywhere.”
Madelon H. Lulofs – Rubber. 1931
“Sometimes all it takes is a tiny shift of perspective to see something familiar
in a totally new light”
Dan Brown – The Lost Symbol. 2009

I
Table of Content
Table of content…………………………………………………………………………… I
Summary ……………………………………………………………………………... II
Originality statement……………………………………………………………………... IV
Acknowledgements……………………………………………………………………….. V
Introduction. Conserving Southeast Asian forest biodiversity and their services
provided in human-modified landscapes ……………………...................... 1
Chapter 1. Land-use change affects community composition of tropical amphibians
and reptiles in Sulawesi (Indonesia)………………………………………. 11
Chapter 2. Conservation value of cacao agroforestry for amphibians and reptiles in
Southeast Asia: combining correlative models with follow-up field
experiments………………………………………………………………… 32
Chapter 3. Amphibians and reptiles of the Lore Lindu National Park area, Sulawesi
(Indonesia)…………………………………………………………………. 61
Chapter 4. Endemic predators, invasive prey, and native biodiversity; biocontrol by an
endemic toad……………………………………………………………….. 80
Chapter 5. Pesticides and tropical biodiversity……………………………………….. 100
Conclusions ……………………………………………………………………………... 105
Appendix ……………………………………………………………………………... 107
Bibliography ……………………………………………………………………………... 134
List of publications as listed in this thesis………………………………………………. 153
Complete list of publications including all resulting from this PhD work……………. 154

II
Summary
In the tropics, global food demand and population growth have already led to conversion of
more than 50 % of formerly forested areas into agricultural landscapes. Across all tropical
regions, Southeast Asia suffers from the highest deforestation rates, where land-use change is
mainly driven by rapid expansion of biofuel and cash crops such as cacao. The ecological
effects of agricultural expansion on biodiversity and ecosystem services are little known, in
particular, in chronically understudied areas like Sulawesi (Indonesia), the third largest cacao
producer globally. Moreover, certain taxonomic groups such as amphibians and reptiles
remain particularly poorly studied, yet are the most threatened vertebrate groups on the planet.
My thesis targets the impact of land-use change on Southeast Asian amphibian and reptile
diversity as well as their ecosystem services provided.
After an introduction to the research context, the first chapter shows how land use
change from pristine forest to open areas impacts amphibians and reptiles. I use Bayesian
modelling to examine environmental predictors of diversity patterns to then derive the first
assessment of how amphibians and reptiles are affected by cacao farming in Sulawesi. In the
second chapter, I assess the conservation value of cacao agroforest based on a two-step
approach: (i) multi model inference is used to identify environmental predictors of
herpetological diversity patterns in cacao agroforests; then (ii) a large scale experimental
approach is used to test whether these predictors can realistically be implemented on a large
scale by local farmers. In the third chapter, I compiled, for the first time, an extant species list,
to make best use of the information on amphibians and reptiles in the region. I discuss how
such species lists can be used by National Park authorities and local researchers to facilitate
ecotourism and research activities. In the fourth chapter I show how endemic toads can
control highly invasive “yellow crazy ants” and the likely implications this interaction may
have for cacao yield. In the final chapter, I argue that pesticide use is a major driver of tropical
biodiversity loss that currently has not received the attention it deserves.

III
In conclusion, this thesis revealed that there is still much to be learned about the
impact of land-use change on amphibians and reptiles in Southeast Asia, their conservation,
and the ecosystem services they can provide. Future research efforts need to incorporate
pesticide impacts on amphibians and reptiles, to give realistic management recommendations
for sustainable agricultural landscapes. In addition, the monetary value of herpetological
ecosystem services must be identified in these secondary habitats. Only then, local small-scale
farmers may be supportive of biodiversity conservation.

IV
Originality statement
This work contains no material which has been accepted for the award of any other degree or
diploma in any university or other tertiary institution to Thomas Cherico Wanger and, to the
best of my knowledge and belief, contains no material previously published or written by
another person, except where due reference has been made in the text.
I give consent to this copy of my thesis when deposited in the University Library,
being made available for loan and photocopying, subject to the provisions of the Copyright
Act 1968. I acknowledge that copyright of published works contained within this thesis (as
listed below) resides with the copyright holder(s) of those works.
I also give permission for the digital version of my thesis to be made available on the
web, via the University’s digital research repository, the Library catalogue, the Australasian
Digital Theses Program (ADTP) and also through web search engines, unless permission has
been granted by the University to restrict access for a period of time.
Thomas Cherico Wanger Date: 10/12/2010

V
Acknowledgments
I would like to thank my supervisors Barry Brook, Navjot Sodhi, and Teja Tscharntke, who
provided me with all the help, feedback, and freedom a PhD student can hope for. They
substantially refined my scientific toolbox needed in the world out there.
Being based in Australia, Singapore, Germany, and Indonesia, this PhD offered a
unique opportunity to meet a wide variety of people to do (crazy) things that influenced me in
many ways. From the Adelaidians, I would especially like to thank Bert Harris, Lochran Traill
and Nerissa Haby for discussions, climbing days, cultural dinners, tunes, and the snake on the
beach. In Singapore, Janice Lee made the horrible mistake to introduce me to Little India (or
LI) in my very first week; from this day onwards I have been addicted to the Indian cuisine.
Sam Howard, Lainie Qie Lan, and Anne Devan introduced me to the Sing wildlife including
Pythons. Enoka Kudavidanage was my first tourist guide and fortunately the journey with
MANY enjoyable trips to LI and great conversations will not end any time soon. Trina Chua
introduced me to the convenient Sing way of life and convinced me that a squash ball fits my
eye socket perfectly. Brett Scheffers and Luke Gibson make the lab a crazy place, and keep
ideas rolling and art sessions alive. When in Germany, Jochen Fründ, Carmen Börschig,
David Gladbach, Christoph Scherber, Georg Everwand, Max FuN, Arno Wielgoss, and Yann
Clough where there whenever I wanted to bounce work and non-work related ideas, needed
excessive climbs, a BBQ at the lake, party non-stop (even in places where you would never (!)
expect a party to happen), or a place to stay. In Indonesia, I am indebted to the staff of the
Center of Tropical Forest Margins at Tadulako Universiti, Palu for logistic and mental support
in various situations (in particular Pak Abdul Rauf, Anti, Pak Gauk, and Pak Bahso). Djoko T.
Iskandar provided invaluable expertise on the research area, the amphibians and reptiles of
Sulawesi, and let me stay with his nice family in Bandung. I also thank my counterpart
Shahabuddin Saleh for support. Wolfram Lorenz was of great help to me whenever things had
to be organized or contacts to be established in Indonesia. Special words of gratitude deserve

VI
my field assistants in Sulawesi (Metu, Abeh, Basran, Ahdan, and many more) – I could not
have done this without their helping hands. Through this project I learned a lot about the local
culture and traditions in Central Sulawesi – I am very grateful for this and sincerely thank
Rajap, Pak Naphtali, Pak Aceh Lagimpu, and Masarakat Toro. One person in particular, Pak
Said, changed my view on very many things. I am grateful to “Abeh” Akbar Saro for his
enthusiasm and for finally telling me (only in 2010!!) the true meaning of the hole in the
stone. I thank Kevin Darras for being the MESS man, showing me the Jura – for being my
friend.
I would like to thank the Indonesian State Ministry of Research and Technology
(RISTEK) for approving the project and issuing the relevant permits. In particular, Pak Sri
Wahyono, Ibu Tina and Ibu Yetti were always extremely helpful and competent when I had
questions. The project was generously funded by the German Science Foundation (DFG), the
University of Göttingen, Germany, an Endeavour International Postgraduate Scholarship, and
a University of Adelaide scholarship.
I consider myself very lucky to know Iris Motzke – thank you for your love and
friendship, support, and our time together. Nothing of what I have done so far would have
been possible without the continuous support of my parents and friends, Rosemarie and Hans-
Uwe Wanger - thank you so much for everything!

1
Land-use change, tropical biodiversity, and ecosystem services – Southeast Asian amphibians and reptiles in focus
T.C. Wanger
Introduction
CONSERVING SOUTHEAST ASIAN FOREST BIODIVERSITY IN HUMAN-DOMINATED LANDSCAPES
N.S. Sodhi1, L.P. Koh2, R. Clements3, T.C. Wanger4, J.K. Hill5, K.C. Hamer6, Y. Clough7, T.
Tscharntke7, M.R.C. Posa1, T.M. Lee8
1Department of Biological Sciences, National University of Singapore, 14 Science Drive 4, Singapore 117543, Republic of Singapore
2ETH Zürich, Institute of Terrestrial Ecosystems, Ecosystems Management Group, CHN G74.2, Universitätstrasse 16, 8092 Zürich, Switzerland
3World Wide Fund for Nature-Malaysia, 49, Jalan SS23/15, 47400 Petaling Jaya, Selangor, Malaysia
4Environment Institute, University of Adelaide, Adelaide, SA 5005, Australia 5Department of Biology, University of York, PO Box 373, York, Y010 5YW, UK
6Institute of Integrative and Comparative Biology, 7.10J LC Miall Building, Faculty of Biological Sciences, University of Leeds, Leeds LS2 9JT, UK.
7Agrarökologie, Georg-August-Universität, Waldweg 26, D-37073 Göttingen, Germany
8Ecological, Behaviour and Evolution Section, Division of Biological Sciences, University of California, San Diego, 9500 Gilman Drive, MC 0116, La Jolla, CA 92092, USA
Biological Conservation – 2010, 143, 2375-2384

2
STATEMENT OF AUTHORSHIP CONSERVING SOUTHEAST ASIAN FOREST BIODIVERSITY IN HUMAN-DOMINATED LANDSCAPES Biological Conservation – 2010, 143, 2375-2384 Wanger, T.C. (Candidate) Wrote amphibian and reptile section and contributed to the general discussion of the paper. I hereby certify that the statement of contribution is accurate.
Signed Date 12/11/2010 Sodhi, N.S. Wrote introduction and research recommendations, organized the paper and general discussion, and acted as corresponding author. I hereby certify that the statement of contribution is accurate and I give permission for the inclusion of the paper in the thesis.
Signed .Date 12/11/2010 Koh, L.P. Wrote introduction and research recommendations, and organized the paper as well as general discussion. I hereby certify that the statement of contribution is accurate and I give permission for the inclusion of the paper in the thesis.
Signed Date 12/11/2010

3
Clements, R. Wrote mammals section and contributed to the general discussion of the paper. I hereby certify that the statement of contribution is accurate and I give permission for the inclusion of the paper in the thesis.
Signed Date 12/11/2010 Hill, J.K. Wrote invertebrate section and contributed to the general discussion of the paper. I hereby certify that the statement of contribution is accurate and I give permission for the inclusion of the paper in the thesis.
Signed Date 12/11/2010 Hamer, K.C. Wrote invertebrate section and contributed to the general discussion of the paper. I hereby certify that the statement of contribution is accurate and I give permission for the inclusion of the paper in the thesis.
Signed Date 12/11/2010 Clough, Y. Wrote the ecosystem functioning section and contributed to the general discussion of the paper. I hereby certify that the statement of contribution is accurate and I give permission for the inclusion of the paper in the thesis.
Signed Date 12/11/2010

4
Tscharntke, T. Wrote the ecosystem functioning section and contributed to the general discussion of the paper. I hereby certify that the statement of contribution is accurate and I give permission for the inclusion of the paper in the thesis.
Signed Date 12/11/2010 Posa, M.R.C. Wrote introduction and research recommendations and contributed to the general discussion of the paper. I hereby certify that the statement of contribution is accurate and I give permission for the inclusion of the paper in the thesis.
Signed Date 23/11/2010 Lee, T.M. Wrote introduction and research recommendations and contributed to the general discussion of the paper. I hereby certify that the statement of contribution is accurate and I give permission for the inclusion of the paper in the thesis
Signed Date 12/11/ 2010
5
Introduction - Conserving Southeast Asian forest biodiversity and their
services provided in human-modified landscapes
Tropical biodiversity has been suffering substantially from habitat loss (Dirzo & Raven 2003),
with the highest deforestation rates in Southeast Asia across all tropical regions (Sodhi et al.
2004; Sodhi & Brook 2006; Sodhi et al. 2010a). While – if unabated – this may result in
massive extinctions (Brook et al. 2003; Cardillo et al. 2006; Lee & Jetz 2008), most of the
region’s residual biodiversity will be confronted with living in human-modified habitats such
as agricultural areas (Ziegler et al. 2009). In fact, human population density correlates with
deforestation and species endangerment in Southeast Asia (Sodhi et al. 2010a). Therefore, in
addition to protecting relatively undisturbed forests, conservation biologists have to also
develop strategies to make human-dominated areas more hospitable for forest biodiversity
(Gardner et al. 2009; Koh & Gardner 2010; Peres et al. 2010). However, our current
knowledge of how to facilitate biodiversity and ecosystem service conservation in these
habitats differs vastly between taxonomic groups. In the following overview, I will look at the
impact of agricultural intensification on invertebrates, birds, mammals, amphibians, and
reptiles.
Agricultural intensification and animal biodiversity
Invertebrates comprise a dominant component of tropical diversity in terms of richness,
abundance and biomass (Dunn 2005) and perform many important ecological functions (e.g.
pollination). Due to their short generation times and rapid growth rates they are likely to
respond quickly to habitat changes (Sodhi et al. 2009b). The response of invertebrates to
forest disturbance is well studied for lepidopterans and seems to be dependent on the spatial
scale considered (increasing richness and diversity at smaller spatial scale while the contrary
is true for larger spatial scales; Spitzer et al. 1997; Hamer & Hill 2000; Vu 2009). Traits that

6
predict sensitivity are known but they differ between groups (Holloway et al. 1992). For less-
studied groups, the responses are heterogeneous and generalizations seem difficult. In dung
beetle assemblages, for example, selective logging had little effect on the diversity or
community composition even six years after logging (Holloway et al. 1992). However,
diversity was lower in logged compared to primary forest (Davis et al. 2001). Stingless bees
were not affected within logged forest (Eltz et al. 2002; Samejima et al. 2004). In oil palm
plantations, ants, bees, and moths had higher species richness compared to primary forest
(Danielsen et al. 2009). However these data were not corrected for sampling effort and may
likely reflect higher rates of species accumulation within oil palm. Other studies suggest that
for example butterfly richness is reduced in oil palm plantations (Koh & Wilcove 2008).
Across a land-use intensification gradient in Sulawesi, from rainforest to different
agroforestry types, species richness of bees, wasps and their parasitoids peaked at
intermediate levels of canopy cover, whereas canopy beetles and ants showed no significant
correlation with canopy cover (Steffan-Dewenter et al. 2007; Clough et al. 2010).
Birds are the best studied taxonomic group in Southeast Asia with the highest estimate
of long-term loss of forest species due to deforestation (Castelletta et al. 2000). A total of 274
forest bird species are confined to the lowlands of the Sundaic region (excluding Palawan),
out of which 109 are adversely affected by forest disturbance (Lambert & Collar 2002). While
disturbed forests support higher species richness of birds than undisturbed forests, this is
likely due to common forest edge species (Johns 1996). Endemic forest species, understorey
insectivores, terrestrial insectivores, large canopy frugivores and/or bark foragers, are
disproportionately affected by forest disturbance (Lambert 1992; Posa & Sodhi 2006; Cleary
et al. 2007). Depending on the considered communities, birds tend to recover several decades
after disturbance (Yap et al. 2007). Agricultural habitats are often lower in species richness
and communities are very dissimilar to forests (Peh et al. 2005; Sodhi et al. 2005b;
Aratrakorn et al. 2006). Few studies have been conducted to determine the effects of forest

7
disturbance on montane birds, but available data shows that their richness and density declines
in human-dominated areas such as tree plantations and urban areas (Soh et al. 2006).
Mammals are generally more sensitive to forest disturbance than invertebrates and
birds (Sodhi et al. 2009a). Agricultural practises, in particular those that involve burning of
habitat needed for crop farming, and associated fragmentation of once-contiguous landscapes,
have led to the substantial decline of large mammals in Southeast Asia (Kinnaird & O'Brien
1998). This has, for example, caused a reduction of 84% and 70% in Sumatran elephant and
tiger populations in Riau, respectively (Uryu et al. 2008). In Indonesia, the encroachment and
unregulated expansion of agroforestry plantations into National Parks are considered major
threats to mammals (e.g. rhinos, tigers, elephants and orang-utans); this is through poaching
and illegal logging activities, but also disruption of movement patterns around forest edges
(Kinnaird et al. 2003; Wich et al. 2008). In agricultural landscapes, mammalian richness was
found to be lower compared to pristine habitats (Laidlaw 2000; Fitzherbert et al. 2008).
Compared to other vertebrate taxa in Southeast Asia and work conducted in the
Neotropics and Africa, few studies have addressed the impacts of human-dominated
landscapes on the herpetofauna of Southeast Asia (Fig. I). These studies report declines in
amphibian species richness, as habitat disturbance — or fragmentation (Alcala et al. 2004) —
increases, while reptile species richness remains similar or increases (Inger & Colwell 1977;
Gillespie et al. 2005; Wanger et al. 2009; for contrasting results see Alcala et al. 2004;
Bowman et al. 1990; Inger 1980). Species composition was distinctly different in pristine
habitats but similar between disturbed habitats (Inger & Colwell 1977; Gillespie et al. 2005).
Habitats studied include secondary forests, rubber and cacao plantations, traditional gardens,
rice fields and open areas, but rapidly expanding oil palm plantations have received no
attention in herpetological studies. As in the Neotropics (e.g., Whitfield et al. 2007; Luja et al.
2008), species responses are mostly attributed to changes in leaf-litter thickness and
temperature through reduced canopy cover (Inger 1980; Alcala et al. 2004; Wanger et al.

8
2009; Wanger et al. 2010a). Overall, resilience of forest herpetofauna to habitat disturbance
seems to be lower in amphibians than reptiles and depends on sufficient pristine habitat
remaining in the area (Gillespie et al. 2005; Wanger et al. 2009; Wanger et al. 2010a).
Improving the conservation value of disturbed habitats for herpetological diversity appears to
be scale dependent; for amphibians and reptiles, modifications at the plantation level and
landscape level, respectively, have been suggested (Gillespie et al. 2005; Wanger et al. 2009;
Wanger et al. 2010a).
CS America Africa SE Asia Australia India
Num
ber o
f pub
lishe
d st
udie
s
0
5
10
15
20
25
studies 1945 - 2006additional studies until 2009
Figure I – Number of published studies on the impact of land-use change on
amphibians and reptiles between 1945 and 2006/2009. I used the same search string in
the ISI Web of Science as a comprehensive review on the topic in 2006 (Gardner et al.
2007) to make results comparable. I combined studies from Madagascar with Africa
and those from the Philippines with Southeast Asia (SE Asia). CS America = Central
and South America.

9
Habitat disturbance and ecosystem-functioning losses
Conservation strategies should aim to protect not only rainforests and biodiversity but also
ecosystem services, i.e., the benefits people obtain from ecosystems (MEA 2005). Managing
ecosystem services in human-dominated landscapes poses a major challenge because, rather
than being independent, they interact (e.g., optimizing reforestation will reduce food
production; Rodriguez et al. 2006). To ensure the maintenance of these multiple services, a
landscape perspective is required (Chazdon et al. 2009). Agricultural land use is often focused
on few species and local processes, but in dynamic, human-dominated landscapes, species
diversity will substantially enhance resilience (i.e. the capacity to re-organize after
disturbance). Hence, biodiversity and associated ecosystem services can be maintained only in
complex landscapes with near-natural habitat supporting a minimum number of species
dispersing across natural and managed systems (Tscharntke et al. 2005). This is exemplified
by one of the best known ecosystem service, pollination, provided by bees. In Indonesian
agroforestry systems, high levels of pollination and yield in coffee and pumpkin depend on a
high diversity of bee species (Klein et al. 2003a; Hoehn et al. 2008), which is only available
in heterogeneous environments including nearby forests providing natural bee habitats (Liow
et al. 2001).
In a land use change context, we know little about the factors affecting amphibians
and reptiles in particular in Southeast Asia. Even less is known about the services that these
taxa provide. However, realistic management recommendations for sustainable agricultural
landscapes require a good and general knowledge of the effects of land-use changes on
biodiversity. Besides other factors, the effects of pesticide use on biodiversity are poorly
known but must urgently be evaluated. I, therefore, conducted my research in Central
Sulawesi (Indonesia), an equatorial island region of importance both for its exceptionally high
endemism and because it is the second largest cacao producer globally. This combination
implies an urgent need to understand land-use change impacts on Sulawesi’s little studied
10
native fauna. In the following chapters, I will first focus on the response of amphibians and
reptiles to different aspects of land-use change. Since very little is known about the
herpetofauna of Sulawesi, I also review the literature and combine these findings with my
own field research to the first species list of Central Sulawesi. This work clearly demarcates
the region as a herpetological endemism hotspot. I then look into amphibians and reptiles as
ecological service providers in Sulawesi’s cacao plantations. Finally, I discuss the importance
of pesticides for tropical biodiversity conservation in general.
11
Land-use change, tropical biodiversity, and ecosystem services – Southeast Asian amphibians and reptiles in focus
T.C. Wanger
Chapter 1
EFFECTS OF LAND USE CHANGE ON COMMUNITY COMPOSITION OF TROPICAL AMPHIBIANS AND REPTILES IN SULAWESI, INDONESIA
T.C. Wanger1, D.T. Iskandar2, I. Motzke3, B.W. Brook1, N.S. Sodhi4, Y. Clough3, T.
Tscharntke3
1Environment Institute, University of Adelaide, Adelaide, SA 5005, Australia 2Department of Biology, School of Life Sciences and Technology, Bandung, Indonesia
3Agrarökologie, Georg-August-Universität, D-37073 Göttingen, Germany
4Department of Biological Sciences, National University of Singapore, Singapore 117543, Singapore
Conservation Biology – 2010, 24, 795-802
12
STATEMENT OF AUTHORSHIP EFFECTS OF LAND USE CHANGE ON COMMUNITY COMPOSITION OF TROPICAL AMPHIBIANS AND REPTILES IN SULAWESI, INDONESIA Conservation Biology – 2010, 24, 795-802 Wanger, T.C. (Candidate) Prepared and conducted the data collection, analysed the data, interpreted the results, wrote the paper and acted as corresponding author. I hereby certify that the statement of contribution is accurate.
Signed Date. 12/11/2010 Iskandar, D.T. Helped with species identification and gave recommendations for proper sampling of the animals in the field. Also discussed and commented on the manuscript. I hereby certify that the statement of contribution is accurate and I give permission for the inclusion of the paper in the thesis.
Signed Date 18/11/2010 Motzke, I. Helped with the field sampling of amphibians and reptiles and handling, and discussed and commented on the manuscript. I hereby certify that the statement of contribution is accurate and I give permission for the inclusion of the paper in the thesis.
Signed Date 12/11/2010

13
Brook, B.W. Provided support when analysing the data and discussed and commented on the manuscript. I hereby certify that the statement of contribution is accurate and I give permission for the inclusion of the paper in the thesis.
Signed Date 15/11/2010 Sodhi, N.S. Helped with writing and discussing the manuscript. I hereby certify that the statement of contribution is accurate and I give permission for the inclusion of the paper in the thesis.
Signed Date 12/11/2010 Clough, Y. Contributed to the discussion of the manuscript and helped in the field and initial preparations in Indonesia I hereby certify that the statement of contribution is accurate and I give permission for the inclusion of the paper in the thesis.
Signed Date 12/11/2010 Tscharntke, T. Helped with initial preparations, site selection, writing and discussing the manuscript. I hereby certify that the statement of contribution is accurate and I give permission for the inclusion of the paper in the thesis.
Signed Date 12/11/2010

14
Chapter 1 - Land-use change affects community composition of tropical amphibians and reptiles in Sulawesi (Indonesia)
Abstract
Little is known about the effects of anthropogenic land-use change on the amphibians and
reptiles of the biodiverse tropical forests of Southeast Asia. I studied a land-use modification
gradient stretching from primary forest, secondary forest, natural-shade cacao agroforest,
planted-shade cacao agroforest to open areas, in central Sulawesi (Indonesia). I determined
species richness and abundance, turnover, and community composition in all habitat types,
and related these to environmental correlates, such as canopy heterogeneity and leaf litter
thickness. Amphibian species richness decreased systematically along the land-use
modification gradient, but reptile richness and abundance peaked in natural-shade cacao
agroforests. Species richness and abundance patterns across the disturbance gradient were best
explained by canopy cover and leaf litter thickness in amphibians, and canopy heterogeneity
and cover in reptiles. I found amphibians to be more severely affected by forest disturbance in
Sulawesi than reptiles. Heterogeneous canopy cover and thick leaf litter should be maintained
in cacao plantations to facilitate their conservation value for both groups. For long-term and
sustainable use of plantations, pruned shade trees should be permanently kept to allow
rejuvenation of cacao and, thus, to prevent repeated forest encroachment.

15
Introduction
Increasing deforestation rates and subsequent land-use change in the tropics will force the
surviving tropical biodiversity to reside in human-dominated landscapes such as agricultural
areas (Bawa et al. 2004; Foley et al. 2005). The conservation value of agricultural habitats can
be assessed by first comparing diversity-patterns across land-use modification gradients (i.e.
open to pristine habitats) (e.g., Barlow et al. 2007) and then examining the factors driving
diversity patterns within agricultural habitats (e.g., Clough et al. 2009b). Most scientific
studies are, however, regionally and taxonomically restricted, with Southeast Asian
amphibians and reptiles being the most poorly studied (Gardner et al. 2007; Sodhi et al.
2010a). Among the most threatened vertebrate taxa globally (30 % and 31 % of all evaluated
species until 2008; IUCN 2009), tropical amphibians and reptiles are highly sensitive to
habitat modifications and climate change (Sodhi et al. 2008; Wake & Vredenburg 2008; Huey
et al. 2009; IUCN 2009). This makes mitigating the effects of land-use change on
herpetological diversity in Southeast Asia a high conservation priority.
For better preservation of biodiversity in modified habitats, it is crucial to understand
the environmental drivers of species responses to land-use changes (Koh 2008). Although
most studies on amphibians and reptiles in Southeast Asia have found canopy cover and leaf
litter thickness to be the most important drivers (e.g., Inger & Colwell 1977; Wanger et al.
2009), canopy cover may not be the most appropriate parameter to measure. For example,
lizards thermoregulate by basking in open areas and, hence, several open patches in the
canopy may sustain higher abundances than just one large open patch. Specific canopy
heterogeneity (i.e., many small open patches vs. one large open patch in the canopy) may,
thus, be a better predictor for species richness and abundance patterns in lizards.
Contrastingly, a crude measure of canopy cover may be sufficient for amphibians as tropical
frogs generally avoid direct sun exposure.

16
Here I determine the patterns in amphibian and reptile species richness, abundance,
and community composition across a land-use modification gradient in Sulawesi. Bayesian
model selection was used to identify the best environmental predictors for amphibian and
reptile species richness and abundance, including the lacunarity index as a measure for canopy
heterogeneity. Based on my results, I provide recommendations for conserving amphibians
and reptiles in cacao plantations.
Material and Methods
Study region
I conducted this study in Central Sulawesi (Indonesia; Fig. 1.1), with an annual average (±
SD) temperature of 24.0 (± 0.16) °C, a monthly average rainfall of 143.7 (± 22.74) mm, and
no pronounced climatic seasons (equatorial wet tropics). The study area was located around
the village of Toro, Kulawi valley (1°30’24“ S, 120°2’11“ E) surrounded by Lore Lindu
National Park (231,000 ha pristine forest), old (> 10 years) cacao plantations of different
farming intensity, and open areas for cattle grazing. Hence, this locality comprised a habitat
gradient with increasing disturbance and a sufficiently large control area.
Plot characteristics and environmental variables
I sampled 31 plots (40 × 40 m) in five habitat categories: primary forest (6 plots), secondary
forest (7), natural-shade cacao agroforest (with forest trees) (7), planted-shade cacao
agroforest (with planted trees) (6), and open areas (5). Unbalanced replicates resulted from
difficulties with some locations (e.g., a church was built on one of the open area plots). All
habitat categories were classified based on canopy cover and heterogeneity, annual pesticide
use, leaf litter cover and thickness, number of logs, shrub volume, and the number of trees in
the plots (Tab. 1.1). Here I refer to secondary forest as degraded primary forest, where large
trees had been cut in the past and for example rattan, and fire wood was extracted. In complex

17
Figure 1.1 – Location of the study area around the Lore Lindu National Park on
three different scales (in Southeast Asia (A); Sulawesi (B), and Central Sulawesi (C)).
The map shows the mountainous terrain of Central Sulawesi with the two highest peaks,
both inside (Mount Nokilalaki, 2357 m: white dot) and outside the LLNP (Mount Rore
Katimbu 2610 m; star). Maps are oriented northwards.
natural-shade cacao agroforest, shade was provided by rainforest trees, with higher canopy
cover than in simple planted-shade cacao agroforest. In the latter, shade trees were mostly
planted legume or fruit trees (e.g., Gliricidia sp. and Musa sp.). In Sulawesi cacao trees are
not only planted as undergrowth within near-primary forests, but also into secondary forest,
coffee agroforests, clove plantations or annual cultures. Open area plots were an unshaded
mosaic of grass and bare soil. All plots of one habitat type were surrounded by similar habitat

18
Table 1.1 – Habitat characteristics of all sampled habitats. Variables are as described in the text; Shrub Volume = shrub density * shrub height;
Number of trees = number of trees in a plot with a diameter at breast height ≥ 50 cm. Values are means (SD) per habitat. NS-cacao agroforest =
natural shaded cacao agroforest; PS-cacao agroforest = planted-shaded cacao agroforest
Canopy
Cover [%]
Annual pesticide
use [ml/plot]
Leaf litter
cover [%]
Leaf litter
thickness [cm]
Number of
logs Shrub Volume
Number of
trees
Canopy
heterogeneity
Primary forest 94.93 (1.17) 0 (0.00) 72.5 (27.59) 2.13 (0.97) 6.17 (2.71) 408.67 (228.01) 11.50 (5.99) 2.49 (0.27)
Secondary forest 87.01 (2.20) 21.43 (56.69) 70.29 (20.87) 2.40 (0.73) 9.43 (3.78) 370.57 (252.29) 9.00 (4.00) 2.72 (0.46)
NS-cacao agroforest 77.83 (4.41) 81.43 (103.51) 37.29 (19.54) 1.65 (0.94) 6.29 (4.68) 289.51 (217.74) 3.85 (3.52) 3.14 (0.26)
PS-cacao agroforest 65.95 (3.79) 145.00 (136.05) 29.00 (25.16) 1.02 (0.57) 6.67 (5.05) 240.93 (240.28) 2.67 (2.62) 2.63 (0.52)
Open areas 0.00 (0.00) 384.00 (411.01) 0.00 (0.00) 0.00 (0.00) 3.20 (1.64) 61.04 (24.91) 0.00 (0.00) 1.17 (0.00)
19
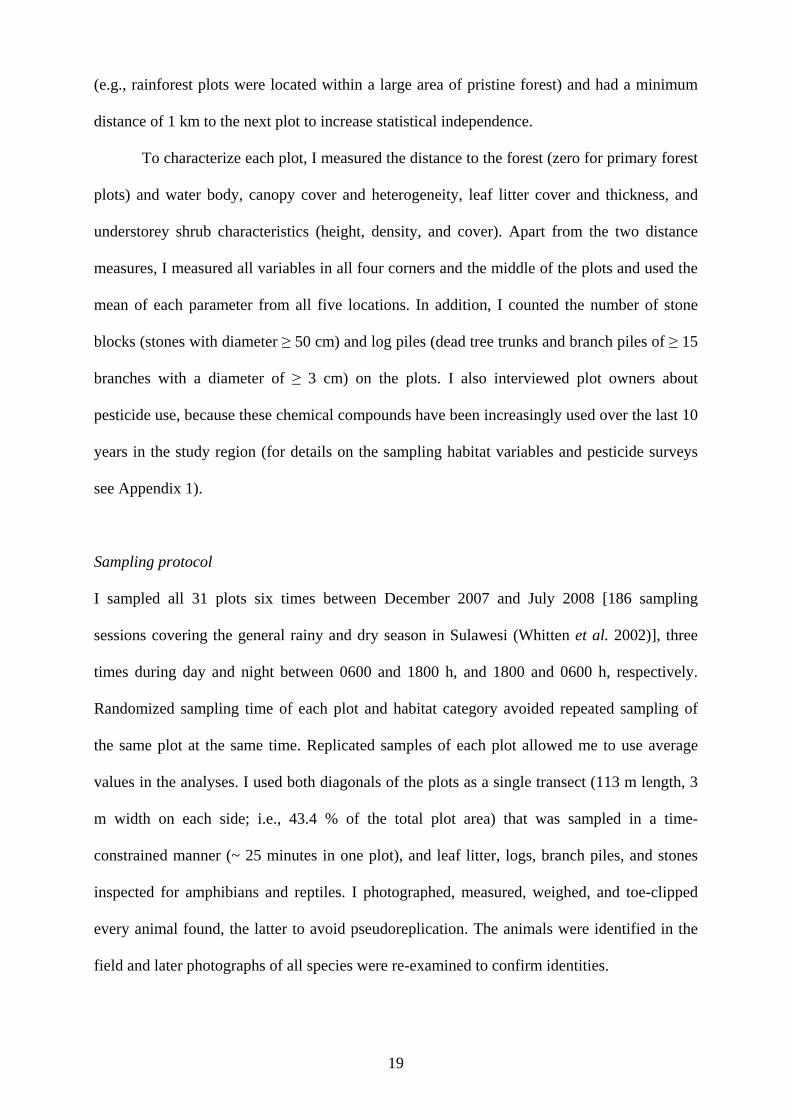
(e.g., rainforest plots were located within a large area of pristine forest) and had a minimum
distance of 1 km to the next plot to increase statistical independence.
To characterize each plot, I measured the distance to the forest (zero for primary forest
plots) and water body, canopy cover and heterogeneity, leaf litter cover and thickness, and
understorey shrub characteristics (height, density, and cover). Apart from the two distance
measures, I measured all variables in all four corners and the middle of the plots and used the
mean of each parameter from all five locations. In addition, I counted the number of stone
blocks (stones with diameter ≥ 50 cm) and log piles (dead tree trunks and branch piles of ≥ 15
branches with a diameter of ≥ 3 cm) on the plots. I also interviewed plot owners about
pesticide use, because these chemical compounds have been increasingly used over the last 10
years in the study region (for details on the sampling habitat variables and pesticide surveys
see Appendix 1).
Sampling protocol
I sampled all 31 plots six times between December 2007 and July 2008 [186 sampling
sessions covering the general rainy and dry season in Sulawesi (Whitten et al. 2002)], three
times during day and night between 0600 and 1800 h, and 1800 and 0600 h, respectively.
Randomized sampling time of each plot and habitat category avoided repeated sampling of
the same plot at the same time. Replicated samples of each plot allowed me to use average
values in the analyses. I used both diagonals of the plots as a single transect (113 m length, 3
m width on each side; i.e., 43.4 % of the total plot area) that was sampled in a time-
constrained manner (~ 25 minutes in one plot), and leaf litter, logs, branch piles, and stones
inspected for amphibians and reptiles. I photographed, measured, weighed, and toe-clipped
every animal found, the latter to avoid pseudoreplication. The animals were identified in the
field and later photographs of all species were re-examined to confirm identities.

20
I did not use pitfall traps in this study because the diminishing accumulation of species
numbers does not trade-off well against the resources required to maintain the trap setup (e.g.,
Roedel & Ernst 2004). For a discussion of the species I likely have missed see chapter 3.
Species accumulation curves – assessment of sampling effort
I computed species accumulation curves based on 50 randomly added sampling sessions of
the original data and calculated a bootstrap resampling estimator to determine the total species
richness in the assemblage (see Magurran 2004). Bootstrapping provides a measure of error in
the total species richness estimated from a given number of iterations and is, therefore,
considered more robust than other analytical estimators (Magurran 2004). To evaluate
effectiveness of sampling effort, I used a Bayesian regression model to estimate the
correlation between the randomized original and the bootstrap estimator data, for each sample.
A strong correlation in all habitat classes suggests that it is appropriate to use the original data
for subsequent analyses (Shahabuddin et al. 2005), because this indicates no deviation of the
estimator data from the distribution of the original data.
Analysis of the habitat gradient
I calculated species richness for each plot as response variable in my linear models to quantify
the differences of amphibian and reptile species richness between habitat classes. For the
analysis, I used a Bayesian hierarchical regression analysis that allows subdivision of variance
in finer scales using hyper-parameters; this approach allows intuitive graphical evaluation of
the results (Qian & Shen 2008). I referred to an effect, trend, and no effect, if the credibility
intervals did not overlap, overlap, and were centered on zero, respectively. The same model
structure was used to investigate changes in amphibians and reptile species abundance. For a
brief introduction to Bayesian model evaluation see Appendix 2.
21
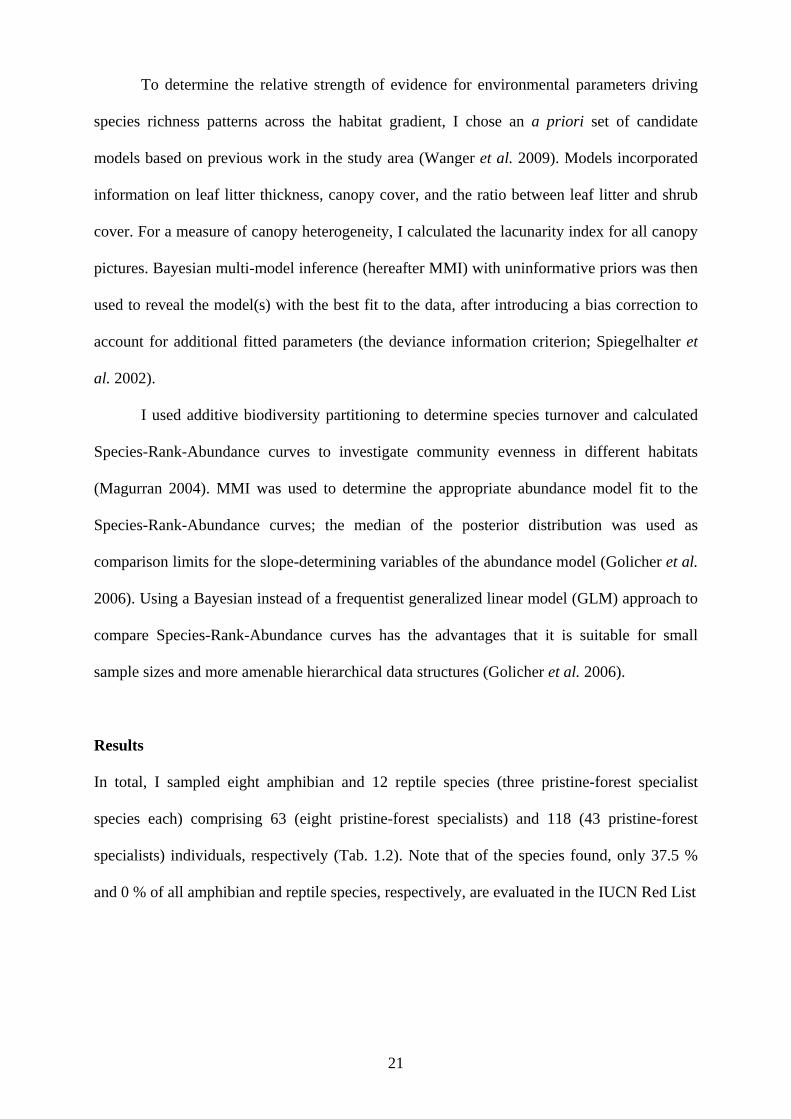
To determine the relative strength of evidence for environmental parameters driving
species richness patterns across the habitat gradient, I chose an a priori set of candidate
models based on previous work in the study area (Wanger et al. 2009). Models incorporated
information on leaf litter thickness, canopy cover, and the ratio between leaf litter and shrub
cover. For a measure of canopy heterogeneity, I calculated the lacunarity index for all canopy
pictures. Bayesian multi-model inference (hereafter MMI) with uninformative priors was then
used to reveal the model(s) with the best fit to the data, after introducing a bias correction to
account for additional fitted parameters (the deviance information criterion; Spiegelhalter et
al. 2002).
I used additive biodiversity partitioning to determine species turnover and calculated
Species-Rank-Abundance curves to investigate community evenness in different habitats
(Magurran 2004). MMI was used to determine the appropriate abundance model fit to the
Species-Rank-Abundance curves; the median of the posterior distribution was used as
comparison limits for the slope-determining variables of the abundance model (Golicher et al.
2006). Using a Bayesian instead of a frequentist generalized linear model (GLM) approach to
compare Species-Rank-Abundance curves has the advantages that it is suitable for small
sample sizes and more amenable hierarchical data structures (Golicher et al. 2006).
Results
In total, I sampled eight amphibian and 12 reptile species (three pristine-forest specialist
species each) comprising 63 (eight pristine-forest specialists) and 118 (43 pristine-forest
specialists) individuals, respectively (Tab. 1.2). Note that of the species found, only 37.5 %
and 0 % of all amphibian and reptile species, respectively, are evaluated in the IUCN Red List

22
Table 1.2 – Amphibian and reptile species encountered in all habitats. Red List
classifications are as follows: NT = near threatened; LC = least concern; NE = not evaluated
by the IUCN; Specialist [Y/N] = species considered pristine-forest specialist / disturbance-
tolerant species; Habitat encountered abbreviations: PF = Rainforest; SF = secondary forest;
NAF = Natural-shade cacao agroforest; PAF = Planted-shade cacao agroforest; OA = Open
areas.
Species Red List Specialist* Habitat encountered
Amphibians
Hylarana celebensis LC N PF, SF
Ingerophrynus celebensis LC N PF, SF, NAF, PAF, OA
Kaloula pulchra LC N PF
Limnonectes n. sp. 1 NE Y PF
Limnonectes n. sp. 2 NE Y PF
Limnonectes n. sp. 3 NE N PF, SF
Limnonectes n. sp. 4 NE Y NAF
Oreophryne n. sp. NE N PF, SF
Reptiles
Boiga irregularis NE N NAF
Cyrtodactylus famosus NE Y PF
Eutropis grandis NE N SF, NAF, PAF, OA
Eutropis multifasciatus NE N PAF, OA
Eutropix rudis NE N PF, NAF, PAF
Parvoscincus sp. NE N PF, SF, NAF, PAF
Sphenomorphus textus NE N PF, NAF, PAF, OA
Psammodynastes pulverulentus pulverulentus NE N SF
Rhabdophis callistus NE N SF
Sphenomorphus nigrilabris NE Y PF, SF, NAF, PAF
Sphenomorphus variegatus NE Y PF, SF, NAF, OA
Xenopeltis unicolor NE N NAF, PAF *References: (Manthey & Grossmann 1997; de Lang & Vogel 2005; Gillespie et al. 2005; McKay
2006; D.T. Iskandar unpublished data)

23
Table 1.3 – Environmental determinants of amphibian and reptile species richness
(aSPR and rSPR, respectively) and abundance (aABD and rABD). The deviance
information criterion (DIC) is a Bayesian measure of relative model ranking; pD = number of
effective parameters; % Dev = percent deviance explained (structural adequacy of model);
Dhat = point estimate of the posterior deviance. Predictor parameter abbreviations are as
follows: CAC = canopy cover; LLT = leaf litter thickness; HET = canopy heterogeneity; RAT
= ratio between shrub and leaf litter cover. Null represents the mean (intercept) model.
Amphibians richness Dhat pD DIC ∆DIC %Dev
aSPR ~ CAC 79.2 1.9 83.1 0.0 10.5
aSPR ~ CAC + LLT 80.2 2.0 84.3 1.2 9.4
aSPR ~ CAC + HET 79.1 2.8 84.7 1.6 10.6
aSPR ~ HET 82.8 1.9 86.6 3.5 6.5
aSPR ~ RAT 84.6 1.9 88.4 5.3 4.4
Null 88.5 1.0 90.5 7.4 0.0
Amphibians abundance Dhat pD DIC ∆DIC %Dev
aABD ~ CAC + LLT 114.7 3.0 120.6 0.0 10.7
aABD ~ CAC 118.5 2.0 122.4 1.8 7.7
aABD ~ CAC + HET 116.9 2.9 122.8 2.2 8.9
aABD ~ HET 123.1 2.0 127.0 6.4 4.2
Null 128.4 1.0 130.4 9.8 0.0
aABD ~ RAT 128.5 1.0 130.5 9.9 -0.1
Reptiles richness Dhat pD DIC ∆DIC %Dev
rSPR ~ HET 115.2 1.2 117.2 0.0 0.1
Null 115.3 1.0 117.5 0.3 0.0
rSPR ~ RAT 116.0 1.3 118.7 1.5 -0.6
rSPR ~ HET + CAC 116.2 2.1 120.5 3.3 -0.8
rSPR ~ CAC 123.5 1.1 125.7 8.5 -7.1
rSPR ~ LLT + CAC 121.7 2.1 125.8 8.6 -5.6
Reptiles abundance Dhat pD DIC ∆DIC %Dev
rABD ~ HET 167.2 1.9 170.9 0.0 3.6
rABD ~ HET + CAC 163.8 3.6 171.0 0.1 5.6
rABD ~ RAT 172.0 1.7 175.4 4.5 0.9
Null 173.5 1.0 175.5 4.6 0.0
rABD ~ CAC 175.1 1.1 177.4 6.5 -0.9
rABD ~ LLT + CAC 172.7 2.5 177.7 6.8 0.5

24
Table 1.4 – Results of the Multi Model Inference for the two abundance models (Log
normal and gamma)
Amphibians Dhat pD DIC ΔDIC
Lognormal 53.0 21.3 95.6 0.0
Gamma 87.5 18.9 125.3 29.7
Reptiles Dhat pD DIC ΔDIC
Gamma 114.8 26.9 168.5 0.0
Lognormal 114.5 36.2 186.8 18.3
assessments. As the original and the bootstrap estimator data were highly correlated for both
groups in all habitat types (Appendix 3), I used the original data for further analyses.
For amphibians, mean species richness declined from structurally complex habitats
towards structurally simple habitats (Fig. 1.2). I found a positive effect and trend of rainforest
and secondary forest on species richness, respectively, and a negative effect and trend of
planted-shade cacao agroforest and open areas, respectively. Abundance was also higher in
structurally complex habitats compared to simpler habitats (I found effects of secondary forest
and planted-shade cacao agroforest, and trends of primary forest and open areas, whereas
natural-shade cacao agroforest did not lead to any response). Reptile species richness was
highest in natural-shade cacao agroforest and showed only marginal changes in the other
habitats (Fig. 1.2). Abundance, however, showed a negative effect in secondary forests and
strong positive and negative trends in primary forest and open areas, and planted-shade cacao
agroforest, respectively. Natural-shade cacao agroforest had no effect on abundance.
Patterns in amphibian species richness and abundance were best explained by models
incorporating canopy cover (DIC weight (w) = 0.44), and canopy cover and leaf litter
thickness (w = 0.56), respectively (Tab. 1.3). Canopy heterogeneity was only included in the
third best model for amphibian richness (w = 0.20). Reptile species richness and abundance

25
were best explained by a model only including canopy heterogeneity (w = 0.39 and w = 0.45,
respectively). Canopy heterogeneity and canopy cover were included in the second best model
to explain reptile abundance (w = 0.43; Tab. 1.3). Note that in reptile species richness, the null
model was the second most parsimonious model. Given the low ΔDIC value and percent
deviance explained compared to the null model, the heterogeneity model cannot be considered
robust. While canopy heterogeneity plays a more important role for reptiles, canopy cover is
most relevant to amphibians.
Amphibian alpha diversity was highest in the primary forest (25 % of total γ-diversity)
and declined towards disturbed habitats (5 %); this was paralleled by an increase in beta
diversity (75 to 95 %). Reptile alpha diversity peaked in agroforestry systems (23 %) but was
similar in all other habitat types (14.1 to 16.7 %). Beta diversity was, in contrast to
amphibians, only lower in agroforestry (77 %) but remained the same in all other habitats
(83.3 – 85.9 %; Fig. 1.3).
Amphibian and reptile species-rank-abundance curve evaluation was based on the
commonly used log-normal and gamma abundance model, respectively (Fig. 1.4; Tab. 1.4). I
refer to an effect or trend, if the credibility intervals do not overlap or overlap with the
reference line, respectively. Amphibian curves showed strong positive and negative trends of
sigma values in rainforest and open areas, respectively. This suggests a relatively even
abundance for species in pristine habitats, whereas in disturbed habitats a few species
predominate. Reptile curves indicated a strong negative trend and effect for rainforest and
open areas, respectively, and positive trends for the remaining habitats. Hence, abundance was
even across species in rainforest and open areas, but over-dominated by a few species
otherwise.

26
Species richness
-2.0 -1.5 -1.0 -0.5 0.0 0.5 1.0 1.5
Open areas
PS-cacao agroforest
NS-cacao agroforest
Secondary forest
Primary forestSpecies richness
-1.5 -1.0 -0.5 0.0 0.5 1.0 1.5
Abundance
Habitat effect-3 -2 -1 0 1 2 3
Open areas
PS-cacao agroforest
NS-cacao agroforest
Secondary forest
Primary forestAbundance
Habitat effect-3 -2 -1 0 1 2 3
Standard deviation0.2 0.4 0.6 0.8 1.0 1.2
HabitatResiduals
Standard deviation0.0 0.2 0.4 0.6 0.8 1.0 1.2 1.4 1.6 1.8
Standard deviation0.4 0.6 0.8 1.0 1.2 1.4 1.6 1.8 2.0
HabitatResiduals
Standard deviation 0.0 0.5 1.0 1.5 2.0 2.5 3.0 3.5
Reptiles Amphibians
Habitat effectHabitat effect
Mean habitat effect Credibility interval
Figure 1.2 –Amphibian and reptile species richness and abundance changes across
land-use gradient. The more the credibility intervals of the habitat effect means separate,
the stronger is the difference between habitats; a wide overlap with zero means that the
habitat had no effect on the investigated metric. The small sections show variance
partitioning between habitat effects (Habitat) and residuals (Residuals). Abbreviations in
all figures: NS-cacao agroforest = natural shaded cacao agroforest; PS-cacao agroforest
= planted-shaded cacao agroforest

27
Reptiles
Primary
fores
t
Secon
dary
fores
t
NS-caca
o agro
fores
t
PS-caca
o agro
fores
t
Open a
rea
Gam
ma
dive
rsity
[%]
0
20
40
60
80
100
120
Amphibians
0
20
40
60
80
100
120Alpha diversityBeta diversity
Figure 1.3 – Diversity partitioning of amphibian and reptile diversity in all habitat types.
Gamma diversity (i.e., the total diversity in the assemblage) is separated between mean alpha
diversity per habitat (mean species richness of all replicate plots in a habitat category) and
beta diversity (difference between gamma- and alpha-diversity). Beta-diversity is an
indication of species turnover among habitat types.

28
log alpha0.01 0.1 1 10
Open areas
PS-cacao agroforest
NS-cacao agroforest
Secondary forest
Primary forest
Reptiles
log sigma0.1 1 10 100
Open areas
PS-cacao agroforest
NS-cacao agroforest
Secondary forest
Primary forest
Mean posterior distributionCredibility intervals
Amphibians
Figure 1.4 – Species rank-abundance plots comparison for amphibians and reptiles
among habitat types. For amphibians and reptiles, the log-normal and gamma model,
respectively, provided the best fit in the model selection; thus, I compared the parameters σ
and α (black dots) for the log-normal model and the gamma model, respectively. A smaller
and larger parameter value indicates a flatter and steeper curve, respectively. The former,
hence, represents a community with even species abundance and the latter with few dominant
species. Interpretation is as in Fig. 1.2.

29
Discussion
My results show that amphibians in Sulawesi were more strongly impacted by land-use
changes than reptiles. Amphibian species richness and abundance declined parallel to the
land-use modification gradient. Reptile species richness peaked in natural-shaded cacao
agroforest between mildly (secondary forest) and strongly (planted-shade cacao agroforest)
disturbed habitats. Abundance was high in pristine forest and open areas with different species
composition, but low in secondary forest and planted-shade cacao agroforest. Similar
responses of the two groups to humid forest disturbance are found in other studies, mostly
from the Neotropics (Faria et al. 2007; but see King et al. 2007; Suaz-Ortuno et al. 2008).
These patterns are often explained by changes in leaf litter thickness and, thus, in
microhabitats (humidity and food-source abundance; Whitfield et al. 2007) or heat-exposure
changes as canopy cover decreases (Pineda et al. 2005; Luja et al. 2008).
I found that canopy cover was included in all models as a predictor of amphibian
species richness and abundance patterns. For reptile species richness and abundance, canopy
heterogeneity was represented in the best supported models. This may be explained by
different modes of thermoregulation; while amphibians do not bask, this behavior is crucial
for tropical lizards in open areas (Huey et al. 2009). Using a crude measure of canopy cover
may, hence, be sufficient for amphibians because as canopy cover decreases, their sensitivity
increase. For lizards, in contrast, the canopies of two separate plots may have the same cover,
but differ in heterogeneities (spatial aggregation of closed and open areas). The one with
higher heterogeneity will provide more basking spots that are also close to shady retreats, and
hence, support more home ranges than the homogenous one. In snakes, this effect often
depends on the size of the species; larger snakes (e.g., Brown tree snake [Boiga irregularis])
often are top predators and, hence, do not occur in high abundances, whereas medium sized
species may do so (e.g., Boettger’s Keelback [Rhabdophis callistus]). Based on my results I
posit that canopy heterogeneity is a more useful attribute to measure than only canopy cover,

30
for reptiles and lizards in particular. I caution, however, that the canopy heterogeneity model
determining reptile species richness still leaves much of the between-plot deviance
unexplained and so should not be relied upon as the primary measure of habitat suitability.
Species turnover is an important indicator for conservation planning. High beta
diversity was characteristic for amphibians, with disturbed habitats dominated by a few
species. This suggests that conservation decisions predicated on species diversity and
functionality must consider the whole landscape (Clough et al. 2007) rather than just
plantation scales (Pineda & Halffter 2004). In contrast, similar beta diversity across habitat
types implies that conservation strategies on the plantation level may be sufficient. This is the
case in reptiles, where natural-shade cacao agroforestry harbors more species with equal
abundance, suggesting that reptiles may already benefit from being able to use natural-shade
cacao agroforestry in addition to primary and secondary forest. Differences in beta diversity
between the two species groups may be explained by lower disturbance sensitivity of reptiles
(Wanger et al. 2009), leading to species homogenization across the landscape. Note, however,
that not using pitfall traps may have led to missing more species in some but not other
habitats. Depending on the strength of this effect, it may have biased my estimates of additive
diversity.
For both groups, natural-shade cacao agroforestry may enhance resilience against
extensive species loss, at least if sufficient pristine habitats remain in the landscape in my
study region; for reptiles, it may provide a valuable habitat on its own. However,
herpetological studies on land-use gradients find different results within and between taxa.
This makes it difficult to generalize conservation management recommendations for both
groups (Gardner et al. 2007). In addition, a recent experimental study on cacao agroforestry
habitats in my study region identified leaf litter thickness, logs, a ratio between plant and leaf
litter cover, and temperature as main drivers of herpetological diversity patterns (Wanger et
al. 2009). Taken together with the identified abiotic drivers for herpetological species richness

31
and abundance from my study, herpetological diversity patterns are not necessarily driven by
the same variables across and within habitats. Hence, results from both approaches are most
valuable when integrated.
Conclusions
Sulawesi provides 65% of Indonesia’s cacao (Perkebunan 2008) and cacao comprises an
important part of local farmer income. Cacao plantations cover almost a million ha on the
island (Perkebunan 2008) and thus constitute important potential secondary habitats. I could
show that in order to sustain herpetological diversity, complex canopy from natural shade
trees and leaf litter cover in the plantations is essential. Recommending establishment of
cacao plantations in the understorey inside the forest instead of burning areas for new
plantations may not be sustainable for herpetofaunal diversity. This is because shade trees are
essential only for young cacao trees but later cut because shade reduces yield in older
plantations. Farmers then further encroach into the forest as yields decrease in aging
plantations (Clough et al. 2009a). Thus low-intensity cacao agroforests with natural-shade
trees need to be supported, e.g. by premium prices to offset yield declines. Moreover, farmers
need to be trained to maintain yields in shaded conditions and to rejuvenate plantations on
site.
The very low evaluation rate in the IUCN Red List assessments of all species
considered here suggest that little is still known about the Sulawesi herpetofauna. However, if
habitats are not sufficiently preserved and managed, many species may vanish before they are
properly studied.
32
Land-use change, tropical biodiversity, and ecosystem services – Southeast Asian amphibians and reptiles in focus
T.C. Wanger
Chapter 2 CONSERVATION VALUE OF CACAO AGROFORESTRY FOR AMPHIBIANS AND REPTILES IN SOUTHEAST ASIA: COMBINING CORRELATIVE MODELS WITH
FOLLOW-UP FIELD EXPERIMENTS
T.C. Wanger1, A. Saro2, D.T. Iskandar3, B.W. Brook1, N.S. Sodhi4, Y. Clough5, T. Tscharntke5
1Environment Institute, University of Adelaide, Adelaide, SA 5005, Australia
2Fakultas Pertanian, Universitas Tadulako, Palu, Indonesia 3Department of Biology, School of Life Sciences and Technology, Bandung, Indonesia
4Department of Biological Sciences, National University of Singapore, Singapore 117543, Singapore
5Agrarökologie, Georg-August-Universität, D-37073 Göttingen, Germany
Journal of Applied Ecology – 2009, 46, 823-832

33
STATEMENT OF AUTHORSHIP CONSERVATION VALUE OF CACAO AGROFORESTRY FOR AMPHIBIANS AND REPTILES IN SOUTHEAST ASIA: COMBINING CORRELATIVE MODELS WITH FOLLOW-UP FIELD EXPERIMENTS Journal of Applied Ecology – 2009, 46, 823-832 Wanger, T.C. (Candidate) Prepared and conducted the data collection, analysed the data, interpreted the results, wrote the paper and acted as corresponding author. I hereby certify that the statement of contribution is accurate.
Signed Date 12/11/2010 Saro, A. Helped with the field sampling of amphibians and reptiles and coordinating the experiment. I hereby certify that the statement of contribution is accurate and I give permission for the inclusion of the paper in the thesis.
Signed Date 12/11/2010 Iskandar, D.T. Helped with species identification and gave recommendations for proper sampling of the animals in the field. Also discussed and commented on the manuscript. I hereby certify that the statement of contribution is accurate and I give permission for the inclusion of the paper in the thesis.
Signed Date 18 November 2010

34
Brook, B.W. Provided support when analysing the data and discussed and commented on the manuscript. I hereby certify that the statement of contribution is accurate and I give permission for the inclusion of the paper in the thesis.
Signed Date 15/11/2010 Sodhi, N.S. Helped with writing and discussing the manuscript. I hereby certify that the statement of contribution is accurate and I give permission for the inclusion of the paper in the thesis.
Signed Date 12/11/2010 Clough, Y. Contributed to the discussion of the manuscript and helped in the field and initial preparations in Indonesia I hereby certify that the statement of contribution is accurate and I give permission for the inclusion of the paper in the thesis.
Signed Date 12/11/2010 Tscharntke, T. Helped with initial preparations, site selection, and discussing the manuscript. I hereby certify that the statement of contribution is accurate and I give permission for the inclusion of the paper in the thesis.
Signed Date 12/11/2010

35
Chapter 2 - Conservation value of cacao agroforestry for amphibians and
reptiles in Southeast Asia: combining correlative models with follow-up
field experiments
Abstract
Although agricultural expansion is a primary threat to tropical biodiversity, experimental
studies evaluating the conservation value of tropical agricultural habitats are scarce. In
particular, little is known about the sensitivity of amphibians and reptiles to habitat
disturbance in areas of very high diversity such as Southeast Asia. I used a two-step approach
to determine the relationship between habitat complexity and conservation value of cacao
agroforestry for herpetological diversity in Sulawesi (Indonesia). Indonesia is the third largest
cacao-exporting country globally and forest conversion to cacao plantations is a major threat
to its biodiversity. I first sampled 43 cacao plantations six times to determine the
environmental variables that best explained herpetofaunal diversity patterns using a Bayesian
model selection approach. Based on these results, I experimentally manipulated leaf-litter
thickness (LLT), number of branch piles (LOGS), and LLT + LOGS combinations in the
cacao plots. The experimental data were analysed using Bayesian hierarchical regression. The
best-supported correlative models incorporated LLT, LOGS, air temperature, and the ratio
between leaf litter and shrub cover, showing the importance of habitat heterogeneity and
suggesting climate change sensitivity. The subsequent structural manipulation of these
attributes changed amphibian and reptile species richness, and reptile abundance, but only
addition of leaf litter did so in a biologically meaningful way, providing microhabitat
resources. However, the main beneficiaries were common disturbance-tolerant reptiles. The
different results from the correlative model and the independent manipulative experiments
showed how important such a combined approach is to derive adequate conservation
36
management recommendations. Increasing leaf litter in cacao agroforestry will work best if
implemented on a landscape scale to incorporate sufficient environmental variation and
species life histories. This will mainly enhance the richness and abundance of disturbance-
tolerant species, which still may maintain ecosystem functions such as pest removal.
Particularly for rare species, native forests remain critical for herpetological richness. The
direct temperature sensitivity suggests that future climate change impacts may be severe for
herpetological diversity in plantation habitats and, hence, demand further research.

37
Introduction
Depending on the level of the world’s future environmental resource consumption and overall
population growth, global cropland may expand between 0.3 and 1.8 billion ha by 2050
(Kitzes et al. 2008). This additional land clearance for agriculture will occur mainly in the
tropical developing countries (Tilman et al. 2001). The resulting loss in biodiversity (Brook,
Sodhi & Bradshaw 2008) will be paralleled by a decline in associated ecosystem functions
and services (e.g. crop pollination; Tscharntke et al. 2005), and a weakened resilience against
other threats such as climate change (Hooper et al. 2005). Understanding the value of the
agricultural landscape for native biodiversity, therefore, not only assists sustainable
management, but also poverty alleviation through changing crop yields (Steffan-Dewenter et
al. 2007; Perfecto & Vandermeer 2008).
Most research on the impact of agriculture on biodiversity in humid forests comes
from the Neotropics (Perfecto et al. 2007; Philpott et al. 2008), whilst Southeast Asian case
studies, where deforestation and associated land-use change increased by 25 % from 1990 –
2005, are still few (Sodhi & Brook 2006; Koh 2007). While Indonesia, for example,
comprises two global biodiversity hotspots (Myers et al. 2000) and contains most of Southeast
Asia’s old growth forests, it is also the third largest cacao Theobroma cacao Linné producer
in the world with an annual net forest loss of 0.3 % (Koh 2007; ICCO 2008). Thus, studies
targeting the poorly documented conservation value of cacao agroforests are needed, to
understand how best to mitigate its negative impacts on biodiversity. Given that Southeast
Asia’s forest biota are highly sensitive to forest disturbance (Sodhi et al. 2009a), they are
expected to be negatively affected by extensive cacao expansion.
Most studies determining the effects of agriculture on tropical biodiversity focus on
birds or invertebrates, and highlight the importance of rainforest trees or nearby presence of
pristine habitats to sustain high diversity (Klein et al. 2003b; Bos et al. 2007; Schroth &
Harvey 2007a). In contrast, studies on amphibians and reptiles are scarce in Southeast Asia

38
and the limited results from other tropical regions revealed equivocal and regionally variable
results (Gardner et al. 2007). This makes it difficult to develop sensible, evidence-based
management recommendations – a cause for concern given that amphibians and reptiles are
both the most threatened vertebrate taxa on the planet and particularly susceptible to habitat
destruction and climate change (Gibbons et al. 2000; Whitfield et al. 2007; Sodhi et al. 2008).
In this study, I assess the conservation value of cacao agroforestry for the herpetofauna
of Sulawesi (Indonesia). This large equatorial island is an ideal study area requiring urgent
attention, because 76 % and 33 % of its amphibian and reptile species, respectively, are
globally endemic (Whitten et al. 2002). In addition, 55 % of the available land is threatened
by an ever increasing human immigration pressure (Sodhi et al. 2005a). Some migrants have
been converting primary forest to cacao plantations in central Sulawesi (Steffan-Dewenter et
al. 2007; Weber et al. 2007). Such land-use changes are likely to affect amphibians and
reptiles severely (Gillespie et al. 2005; Wanger et al. 2010a).
Numerous correlative studies have been conducted to identify environmental variables
conducive for species and communities (Garnett & Brook 2007; Koh 2008) but few
experimental studies have pin-pointed causality (e.g., Yap et al. 2002). Here, I integrate a
correlative and manipulative approach at various spatial scales (Hewitt et al. 2007). In a
Bayesian model-selection approach I first identify the environmental parameters that best
describe herpetological diversity patterns in 43 cacao plantations in central Sulawesi. Eight
different a priori candidate models address predictors at three different scales (plantation,
landscape, and a mixture of both) and capture former hypotheses (Schroth & Harvey 2007a)
posed to explain diversity patterns in different taxa. Secondly, I experimentally manipulate the
best predictor variables derived from the correlative models on the plantation scale to test
cause-effect relationships on herpetological diversity patterns (i.e. changes in community
structure, species richness and abundance). My overarching aim is to determine whether local-
scale alteration of habitat complexity can enhance the conservation value of cacao
39
agroforestry for tropical amphibians and reptiles. I then discuss how habitat modifications can
be successfully implemented at the landscape scale.
Materials and Methods
Study region
The study area is located in the Kulawi (167292.444 E; 9831667.769 N) and Palolo
(174486.085 E; 9869691.209 N) valleys in Central Sulawesi, Indonesia (see Fig. 1.1). This
region lacks clearly defined seasonal variation in climate with relatively constant annual
average (± SD) temperatures and monthly average (± SD) rainfall (24.0 (± 0.16) °C and 143.7
(± 22.7) mm, respectively. Besides rice cultivation, cacao farming is the major source of
income; small-scale farmers transform pristine forests into cacao agroforests and use large
rainforest trees to provide shade for cacao tree seedlings. Shade trees are later removed to
increase plantation productivity.
Plot characteristics and environmental variables
I sampled 43 plots (40 x 40 m) in cacao plantations, heterogeneous in environmental variables
relevant to ground dwelling and arboreal amphibians and reptiles, but each surrounded by
structurally similar habitat. For each plot, distance to the nearest intact forest patch was
obtained from recent GIS maps based on satellite imagery, while distance to the nearest water
body was measured in the field. I also determined mean percentage canopy cover, the mean
percentage leaf litter cover, mean leaf litter thickness (LLT), and mean percentage
understorey shrub cover in all plots. The importance of different above-ground strata was
measured as the ratio of shrub cover to leaf litter cover (COVER). Moreover, I counted the
number of stone blocks and log piles (LOGS; dead tree trunks and branch piles) on the plots.
Mean annual temperature in the plantations was obtained from Thermochron® data loggers

40
(DS1921G-F5#, Maxim, Dallas, USA) in the lower canopy of the cacao trees (for details on
environmental variables see Appendix 1)
Sampling protocol
All plots were sampled six times between December 2007 and July 2008 (258 total sampling
sessions) covering the general rainy and dry season in Sulawesi, respectively (Whitten et al.
2002). Sampling was conducted three times during day and night always between 6.00 and
18.00 h, and 18.00 and 6.00 h, respectively. I randomized sampling time of each plot and
treatment category to avoid repeated sampling of the same plot at the same time. Six
replicated samples of each plot allowed me to use average values in the analyses; to avoid
pseudoreplication I did not add results of each sampling. Because of the manipulation I used
only the first four sampling sessions in the Poisson regression analysis to determine
environmental predictors of herpetological diversity patterns.
In the experimental approach, I evaluated temporal changes 26 days before (third and
fourth sampling session) and 26 days after (fifth and sixth sampling session) the manipulation.
This time period between manipulation and re-sampling reflects the time between monthly
management activities in the plantations (leaf litter removal, tree pruning, and weeding; Y.
Clough unpublished data). Extension of this time period may have either resulted in repeated
disturbance through plantation management or in unrealistically stable habitat conditions.
Additionally, I found several species in the plots even hours after management activities have
ceased (T.C. Wanger unpublished data). I, therefore, assumed that the assemblage requires a
relatively short time to recover from disturbance and that the timeframe was suitable.
I used both diagonals of the plots as a single transect (113 m) with a width of 3 m on
each side (i.e. 43.4 % of the total plot area). While transects were sampled in a time-
constrained manner (~ 25 minutes per plot), I thoroughly searched the leaf litter and turned
logs, branch piles, and stones. Animals found were photographed, measured, and toe-clipped,

41
the latter to avoid pseudoreplication. After the animals were identified to species in the field,
photographs of all species were later examined by D.T. Iskandar to confirm identities; this
double identification process re-confirmed correct identification.
Assessment of sampling effort
Sampling effort was assessed with species accumulation curves for all sampling sessions,
randomly re-shuffled 50 times to smooth curves and account for environmental variation
(Colwell & Coddington 1994). I also fitted models based on the Michaelis-Menten equation
SPR = (a*x)/(b+x),
a negative exponential equation
SPR = a*(1-e-b*x),
and a logistic-model
SPR = b*log(x)-a
(for all equations; SPR= species richness; x = number of sampling sessions; a = asymptotic
value; b = constant value) to the data for curve extrapolation and used the Deviance
Information Criterion (DIC) in a Bayesian Multi Model Inference (hereafter “model
selection”) procedure to assess the best model fit. The first two equations were chosen
because they are the most commonly used ones to extrapolate species accumulation curves,
whilst the third was based on an educated guess given the apparent shape of the distribution.
After calculating seven species richness estimators in EstimateS (Chao 1 & 2 estimators,
Abundance-based Coverage Estimator, Incidence-based Coverage Estimator, Jacknife 1 & 2
estimators, and Bootstrap estimator; see Magurran 2004; EstimateS website at
http://purl.oclc.org/estimates (accessed Sept. 2008)) sampling effort was evaluated based on
the percentage sampled compared to the estimate of the best fitting equation and the species
richness estimators. Sampling effort was truncated to fit a sensible scale between 0 and 100
%.

42
Identification of environmental variables
I use observed species richness as a response variable in a Bayesian Poisson regression to
capture the community response to disturbance. Species richness facilitates comparability
between studies because it is widely used as a diversity surrogate and is an indicator for
ecosystem change when used for multiple taxa (Sodhi et al. 2009a). I defined a priori a set of
eight candidate models that can be subdivided into three groups, also incorporating previous
hypotheses on factors driving diversity patterns in agroforestry systems. The first incorporates
only variables relevant at the plantation scale (LLT, LOGS, stone blocks, COVER). The
second incorporates variables relevant at the landscape scale (distance to the nearest forest
patch and water body), and the third incorporates a mixture of both. In terms of hypotheses,
results from agroforestry systems in the Neotropics showed increasing herpetological
diversity when percentage canopy cover and proximity to pristine habitats increase (Schroth
& Harvey 2007b). Diversity responses were also assumed to be related to temperature
changes under the canopy (Perfecto et al. 2007). The eight candidate models were then
challenged in a DIC-based model selection.
I used an individual variable ranking method to avoid over-parameterisation of the
models but to still determine the relative deviance explained by each variable in the data
(Garnett & Brook 2007). Each variable is first dropped from the saturated model and then
added to the null model. For both, changes in deviance explained relative to the saturated and
null model are calculated and then summed as total deviance. Total deviance is rescaled to
sum up to one (relative deviance) and variables are ranked according to the relative deviance
explained.
Manipulation

43
I manipulated LLT and LOGS based on the results from the model selection. I expected that
increasing structural complexity will enhance species richness; abundance of species should
increase and decrease in the adding and removal treatments, respectively, following the
availability of microhabitats. Although the predictor variable COVER was included in the
best models, I did not manipulate it as it would have drastically reduced sample size per
treatment. As shrub ground cover changes quickly, manipulation of this variable would have
been extremely difficult.
I randomly excluded one plot for a balanced dataset and then used a full factorial
design with 42 plots divided into six treatments (removal of (rem) LLT, rem-LOGS, rem-LLT
& LOGS, addition of (add) LLT, add-LOGS, and add-LLT & LOGS) and a spatial control
(controlling for manipulation effects per se), with six plot replicates each. The plots for the
manipulation were selected a priori and plots of each category were equally distributed across
the study region. I incorporated information about the individual plots (species richness; LLT,
COVER, stone blocks, canopy cover, etc.) from the first two sampling sessions in December
2007 to balance spatial variation in these characteristics equally across categories. I then
prepared the plots according to the following standard protocol:
Removal of LLT: to achieve effects that would have sufficient impact as to be
measurable on a short-return time scale but within the natural scale of plantation
management, I removed all leaf litter from the plots so that only shrubs and bare soil
remained on the plot. The leaf litter was packed in rice bags and stored for a maximum time
period of two nights to use the same leaf litter for the addition of LLT treatment. In total I
removed 408 and 398 rice bags with leaf litter from the Palolo and Kulawi valley cacao plots,
respectively. Branches from the pruning were removed whilst old branches remained in the
plot. Addition of LLT: 67 rice bags with leaf litter were allocated to each addition of LLT plot
at random, to avoid effects that were related to the leaf litter of a particular plot per se. In
particular, to avoid animal exchange of the target groups and their prey species (arthropods)

44
between plots, leaf litter was sieved before transferring it between plots (see section below). I
removed branches from the pruning but kept old ones in the plot. Removal of LOGS: For this
treatment, I cleared each removal of LOGS plot from all branches and logs resulting from the
pruning and those already on the plot. Leaf litter was rearranged. Addition of LOGS: I used
branches from the pruning to erect 10 x 1 m3 piles on each addition of LOGS plot, as several
reptiles were previously found in similar microhabitats (T.C. Wanger unpublished data). In
addition, all other branches and logs remained on the plot. The leaf litter was rearranged.
Removal of LLT & LOGS and addition of LLT & LOGS were additive treatments of the
individual treatments. Control: in the control plots, all treatments were conducted and then
restored to normal as far as this was possible, given temporal constrains with the
manipulation. Leaf litter was raked and rearranged but not removed and added again. For the
LOGS treatments, trees were pruned the same way in the control plots and in the treatment
plots, and old LOGS rearranged. I then removed the cutting and left the old and rearranged
LOGS in the plantations.
As I was interested in changes in herpetological diversity related to treatment effects I
used a 4 m² wooden frame with a wire mesh (mesh diameter = 3.5 cm; hereafter “shaking
frame”) to shake the leaf litter. This removed organisms before transferring leaf litter between
plots. In addition to testing one rice bag of each removal plot, I tested 12 more bags from 12
different locations; in total I validated the shaking frame with 24 rice bags. Leaf litter was
raked from a 5 x 5 m area in different microstructural habitats differing in (i) distance to
forest, (ii) distance to the nearest rainforest tree in the plantation, and (iii) leaf litter thickness
towards a plastic cover on which the shaking frame was placed. This allowed larger animals
such as spiders and lizards to leave the leaf litter piles. The leaf litter was then evenly spread
(~10 cm thickness) on the shaking frame and shaken for 60 seconds. However, I found that
even shaking for 30 seconds yielded a 100 % removal rate for most groups. I then
immediately searched the leaf litter on the plastic cover with two people and evaluated the

45
rough number of all animals found. The animal numbers found were used as the pre–value for
the shaking frame validation. After removing all fall out leaf litter from the plastic cover and
carefully checking for remaining animals, the leaf litter from the shaking frame was
transferred onto the plastic cover and searched for remaining animals (by the same two
people). The animal number found was used as the post–value for the shaking frame method.
On average (± SD), I had removal success of 98 (± 3) % (Appendix 4).
I measured LLT before and after the removal and addition of the LLT treatment in all
four corners and in the middle of the plot. My LLT treatments resulted in strong manipulation
effects: on average (± SD), LLT was 77.4 (± 109.6) times lower and 4.5 (± 2.6) times higher
after removal and addition of leaf litter, respectively.
To quantify the experimental treatment effects on amphibian and reptile species
richness, I calculated pre- and post-manipulation species richness for each plot and used the
pair-wise difference as response variable in my Bayesian hierarchical regression model. This
approach allows subdivision of variance in finer scales using “hyper-parameters” and
adjustment of the model to the data (Gelman & Hill 2006; Qian & Shen 2008). The same
model structure was used to investigate changes in abundance patterns.
To visualize changes in relative abundance before and after the manipulation, I show
the three most abundant species per treatment level. Changes in beta diversity across all
treatment groups were haphazard compared to alpha diversity (probably the number of
replicates was too small to reliably calculate turnover) and, therefore, results are not included
here.
Results
General pattern
I found 6 amphibian and 17 reptile species comprising 90 (5 pristine-forest specialists) and
374 (39 pristine-forest specialists) individuals, respectively. Based on all sampling sessions on

46
all plots, an average (± SD) of 1.0 (± 1.0) amphibian species was found (min = 0; max = 3)
and mean amphibian abundance was 2.1 (± 2.7) individuals (min = 0; max = 12) per plot. Of
these six amphibian species, three were pristine-forest specialists. Reptile species richness
was higher, comprising an average of 3.3 (± 1.5) species (min = 1; max = 7) and an average
reptile abundance of 8.7 (± 5.3) individuals (min = 1; max = 22) per plot. Four reptile species
were exclusive pristine-forest specialists (Tab. 2.1).
Evaluation of sampling effort
Model selection revealed that the Michaelis-Menten and the logistic model fitted the
amphibian and reptile species richness data best, respectively (Fig. 2.1; Tab.2.2). The
estimated asymptote for amphibian richness is marginally above the observed number of
detected species (a = 6.2), whilst the credibility intervals reveal 86 to 100 % detection (95 %
CI = 5.6 to 7.0). The eight estimates for species richness suggest sampling completeness was
between 64 % and 100 % (mean (±SD) = 86 (±15) %). In reptiles, the asymptote was
estimated at 18.3 species with the credibility intervals revealing 89 to 97 % detection (95 %
CI = 17.5 to 19.0). The species richness estimators revealed a completeness of sampling effort
between 68 % and 100 % (mean (± SD) = 85 (± 13) %; Appendix 5). The completeness of
sampling effort was, therefore, similar between the groups. Overall, both curves suggest that
sampling of the species assemblages probably was not exhaustive, but due to the same relative
sampling effort in all 43 plots, results are directly comparable.

47
Table 2.1 – Species list and characteristics (G = disturbance tolerant generalist; S = pristine
forest specialist); Reproduction of all amphibians is aquatic and that of reptiles terrestrial.
Evaluation based on Manthey & Grossmann 1997; de Lang & Vogel 2005; Gillespie et al.
2005; McKay 2006; data base from Sodhi et al. 2008; D. T. Iskandar unpublished data;
Wanger et al. unpublished data).
Species Habitat Reproduction Amphibians
Bufonidae Duttaphrynus melanosticus G aquatic Ingerophrynus celebensis G aquatic
Ranidae Hylarana celebensis G aquatic
Microhylidae Limnonectes sp. nov. S aquatic Limnonectes sp. nov S aquatic Limnonectes sp. nov S aquatic
Reptiles Agamidae
Bronchocela celebensis G terrestrial Gekkonidae
Cyrtodactylus cf. famosus S terrestrial Cyrtodactylus jellesmae S terrestrial
Scincidae Eutropis grandis G terrestrial Eutropis multifasciatus G terrestrial Eutropis rudis G terrestrial Eutropis sp. G terrestrial Eutropis sp. G terrestrial Parvoscincus sp. nov G terrestrial Parvoscincus sp. G terrestrial Sphenomorphus cf. textus G terrestrial Sphenomorphus nigrilabris S terrestrial Sphenomorphus variegatus S terrestrial
Colubridae Ahaetulla prasina G terrestrial Dendrelaphis pictus pictus G terrestrial Rhabdophis callistus G terrestrial
Xenopeltidae Xenopeltis unicolor G terrestrial

48
Table 2.2 – DIC based model selection for the species accumulation curve equations.
Model selection parameters are as follows: Dhat = point estimate of the Bayesian posterior
deviance; DIC = Deviance Information Criterion; ∆DIC = Difference between the model with
the lowest DIC value and the model of interest; pD = number of effective parameters.
Amphibians Dhat DIC ∆DIC pD
Michaelis Menten equation 883.30 887.20 0.00 2.0
Logistic model 884.00 887.30 0.10 1.6
Exponential rise function 934.00 937.80 50.60 1.9
Reptiles Dhat DIC ∆DIC pD
Logistic model 1181.00 1185.00 0.00 1.8
Michaelis Menten equation 1185.00 1189.00 4.00 2.0
Exponential rise function 1371.00 1375.00 190.00 2.0
Identification of environmental parameters
The most parsimonious model explaining the variation in amphibian species richness included
the number of branches and log piles in the plantations (LOGS), leaf litter thickness (LLT),
and the ratio between leaf litter cover and shrub cover (COVER; Tab. 2.3). While the best
model explained 9.59 % of the deviance in the amphibian species richness, the second most
parsimonious model including the average annual temperature of the plots explained 9.65 %
of the deviance. The variable ranking revealed that COVER, LLT, and distance to the nearest
river explained 51, 41.13, and 8.49 % relative deviance, respectively (Tab. 2.4). The
remaining variables explained less than 5 % relative deviance. In reptile species richness, the
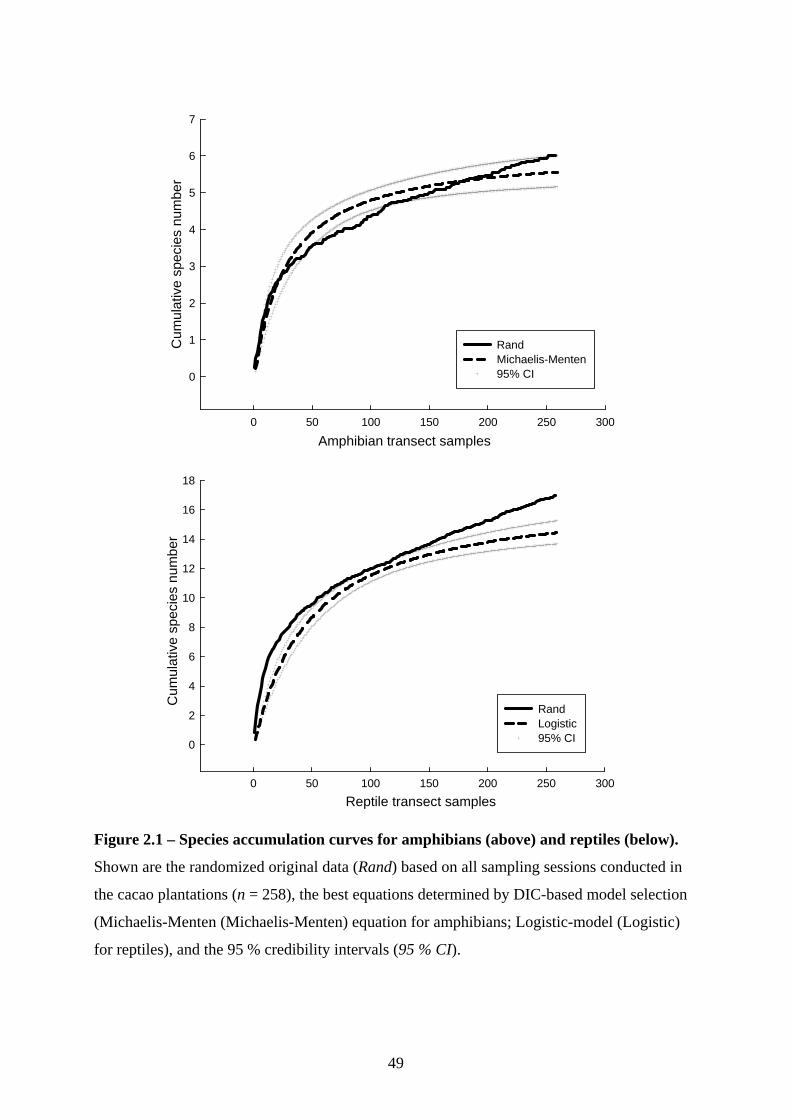
49
Amphibian transect samples0 50 100 150 200 250 300
Cum
ulat
ive
spec
ies
num
ber
0
1
2
3
4
5
6
7
RandMichaelis-Menten95% CI
0 50 100 150 200 250 300
0
2
4
6
8
10
12
14
16
18
RandLogistic95% CI
Reptile transect samples
Cum
ulat
ive
spec
ies
num
ber
Figure 2.1 – Species accumulation curves for amphibians (above) and reptiles (below).
Shown are the randomized original data (Rand) based on all sampling sessions conducted in
the cacao plantations (n = 258), the best equations determined by DIC-based model selection
(Michaelis-Menten (Michaelis-Menten) equation for amphibians; Logistic-model (Logistic)
for reptiles), and the 95 % credibility intervals (95 % CI).

50
Table 2.3 – Amphibian (aSPR) and reptile species richness (rSPR) in the Bayesian model
selection. The best-supported models are in bold/italics. The saturated model includes all
predictor variables while the null model only includes the interaction term. Abbreviations are
as follows: COVER = ratio between leaf litter cover and shrub cover; LLT = leaf litter
thickness; LOGS = number of logs and branches; TEMP = mean annual temperature in the
plantation; STB = number of stone blocks; Dist2Water = distance to the nearest water body;
Dist2Forest = distance to the nearest forest patch; CanCov = canopy cover; Model selection
parameters are as follows: Dhat = point estimate of the Bayesian posterior deviance; DIC =
Deviance Information Criterion; ∆DIC = Difference between the DIC values of the model of
interest and the best-supported model; pD = number of effective parameters; %Dev =
percentage deviance explained, indicating structural goodness-of-fit.
Amphibians
Model Dhat DIC ∆DIC pD %Dev
aSPR ~ LOGS + LLT + COVER 87.67 95.48 0.00 3.9 9.59
aSPR ~ LOGS + LLT + COVER + TEMP 87.61 97.32 1.84 4.9 9.65
aSPR ~ LOGS + LLT + STB 90.74 98.51 3.03 3.9 6.42
Null model 96.97 98.98 3.50 1.0 0.00
aSPR ~ LOGS + LLT + STB + COVER + TEMP 87.68 99.19 3.71 5.8 9.58
aSPR ~ Dist2Forest + Dist2Water 96.80 102.7 7.22 2.9 0.18
Saturated model 86.35 103.3 7.82 8.5 10.95
aSPR ~ CanCov + Dist2Water + Dist2Forest 96.84 104.6 9.12 3.9 0.13
Reptiles
Model Dhat DIC ∆DIC pD %Dev
rSPR ~ LOGS + LLT + COVER + TEMP 145.10 155.00 0.00 4.9 6.81
rSPR ~ LOGS + LLT + COVER 147.90 155.90 0.90 4.0 5.01
rSPR ~ LOGS + LLT + COVER + STB + TEMP 145.10 156.90 1.90 5.9 6.81
Null model 155.70 157.70 2.70 1.0 0.00
rSPR ~ LOGS + LLT + STB 153.60 161.60 6.60 4.0 1.35
rSPR ~ Dist2Forest + CanCov 155.60 161.60 6.60 3.0 0.06
Saturated model 144.30 162.00 7.00 8.8 7.32
rSPR ~ Dist2Forest + Dist2Water + CanCov 155.00 162.90 7.90 4.0 0.45

51
Table 2.4 – Individual explanatory strength of predictor variables. Variables were deleted
from the saturated model and added to the null model; the changes in deviance (% Dev) were
then summed and rescaled to give the explained relative deviance (Rel. Deviance) as
indication of variable explanatory strength. The three parameters with the largest contribution
to the relative deviance are in bold / italics. Variable abbreviations and description of Dhat are
as in Tab. 2.3. Negative deviances indicate a poorer fit than the null model.
Amphibians Variable deletion Variable addition
Variable Dhat % Dev Dhat % Dev Rel deviance
COVER 89.36 3.10 89.65 7.55 0.511
LLT 88.31 2.02 90.61 6.56 0.411
Dist2Water 87.84 1.54 96.74 0.24 0.085
LOGS 86.49 0.14 96.94 0.03 0.009
STB 86.41 0.06 96.97 0.00 0.003
Dist2Forest 86.30 -0.05 97.03 -0.06 -0.005
TEMP 86.21 -0.14 96.95 0.02 -0.006
CanCov 86.22 -0.13 96.99 -0.02 -0.007
Reptiles Variable deletion Variable addition
Variable Dhat % Dev Dhat % Dev Rel deviance
COVER 148.00 2.38 148.10 4.88 0.526
TEMP 147.10 1.80 152.00 2.38 0.302
LLT 144.40 0.06 154.00 1.09 0.084
Dist2Forest 145.00 0.45 155.70 0.00 0.033
Dist2Water 144.30 0.00 155.10 0.39 0.028
STB 144.30 0.00 155.30 0.26 0.019
LOGS 144.30 0.00 155.60 0.06 0.004
CanCov 144.30 0.00 155.60 0.06 0.004
most parsimonious model included the parameters LOGS, LLT, COVER, and annual
temperature of the plots (Tab. 2.3). The second and third model, excluding annual temperature
of the plots and including stone blocks, respectively, were still plausible models for
explaining variation in reptile species richness (i.e. ΔDIC ≤ 2). As for amphibian species
richness, the most parsimonious models all contained LOGS, LLT, and COVER. Ranking of

52
the environmental variables revealed that COVER, annual temperature of the plots, and LLT
explained 52.57, 30.2, and 8.4 %, respectively, of the relative deviance in reptile species
richness. The other variables explained less than 5 % (Tab. 2.4). Notably, all models
incorporating landscape effects (such as distance to forest and to the nearest water body) were
ranked lowest in both animal groups. In the variable ranking, however, distance to the nearest
water body was the third most important variable in amphibians.
While COVER values >> 1 indicate benefits of taller above-ground cover and
potential protection from predators, values << 1 stress the importance of the leaf litter stratum
and its microclimate. For both groups, COVER had a negative coefficient in the variable
ranking (-1.9 ± 1.5 credibility intervals (95 %; CI); 1 ± 0.7 CI, respectively).
Manipulation
The three most abundant species for each treatment before and after the experimental
manipulations show distinct patterns (Fig. 2.2). For amphibians, Ingerophrynus celebensis
(Günther), Duttaphrynus melanostictus (Schneider), and Hylarana celebensis (Peters) were
the most abundant species across all treatments, both before and after the manipulation (Fig.
2.2 above). All of these species were disturbance-tolerant. Before the manipulation, D.
melanostictus was the most abundant species in most add-treatment plots whilst I. celebensis
was dominant in all rem-treatment plots. After the manipulation, I. celebensis dominated in all
but the add LLT & LOGS plots and the control. The abundance patterns are similar before and
after the manipulation for add-LLT and add-LOGS and rem-LLT, but entirely different for
abundance distributions for all other treatments and the control. For reptiles, Eutropis grandis
Howard et al., Parvoscincus spp., Sphenomorphus cf. textus (Müller) and Eutropis
multifasciatus (Kuhl) were the most abundant species before the manipulation with E. grandis
being the most abundant species in all treatment groups (Fig. 2.2 below). All of these species

53
+ LLT
+ LLT
LOGS
+ LOGS
Contro
l- L
LT
- LLT
LOGS
- LOGS
0.0
0.2
0.4
0.6
0.8
E
Sv
E
P
Em
EE
E
E
E
Sv
P
Sn
Sv Sv
St Em P P
+ LLT
+ LLT
LOGS
+ LOGS
Contro
l- L
LT
- LLT
LOGS
- LOGS
0.0
0.2
0.4
0.6
0.8
1.0
E E
EE
E E
E
EsPP
PP
P
P
St
EmEm Em Em
EmA
Reptiles
Rel
ativ
e ab
unda
nce
+ LLT
+ LLT
LOGS
+ LOGS
Contro
l- L
LT
- LLT
LOGS
- LOGS
0.0
0.2
0.4
0.6
0.8
1.0
1.2
D
H I D
H II
I
DH
I
I L1
Amphibians
+ LLT
+ LLT
LOGS
+ LOGS
Contro
l- L
LT
- LLT
LOGS
- LOGS
0.0
0.2
0.4
0.6
0.8
1.0
1.2
I L2 H
D
D
I
I I
D
L1
I
D H
ID
H
I
P
Rel
ativ
e ab
unda
nce
Before
Before After
After
Figure 2.2 - Amphibian and reptile abundance before and after the experimental
manipulation. Black, grey, and white bars represent species with 1st, 2nd, and 3rd highest
abundance, respectively. Abbreviations for the treatments are LLT = leaf litter thickness;
LOGS = branches and logs; LOGS LLT = additive treatment of both factors; +/- =
addition/removal of treatment. Species codes on top of the bars are the same for all graphs
and defined as follows: H = Hylarana celebensis; D = Duttaphrynus melanostictus, I =
Ingerophrynus celebensis; L1 = Limnonectes sp. nov; L2 = Limnonectes sp. nov; E =
Eutropis grandis; Es = Eutropis sp.; P = Parvoscincus spp.; Em = Eutropis multifasciatus;
A = Ahaetulla prasina; St = Sphenomorphus cf. textus; Sv = Sphenomorphus variegatus;
Sn = Sphenomorphus nigrilabris.

54
Amphibian species richness
-0.8 -0.6 -0.4 -0.2 0.0 0.2 0.4 0.6 0.8
+ LOGS
+ LLT
+ LOGS LLT
- LOGS
- LLT
- LOGS LLT
ControlReptile species richness
-3 -2 -1 0 1 2
Amphibian abundance
-1.5 -1.0 -0.5 0.0 0.5 1.0 1.5
+ LOGS
+ LLT
+ LOGS LLT
- LOGS
- LLT
- LOGS LLT
ControlReptile abundance
-4 -3 -2 -1 0 1 2 3 4
0.0 0.1 0.2 0.3 0.4 0.5 0.6 0.7 0.8
Treatment
Residuals
Standard deviation0.2 0.4 0.6 0.8 1.0 1.2 1.4
0.0 0.2 0.4 0.6 0.8 1.0 1.2 1.4 1.6 1.8 2.0
Treatment
Residuals
0 1 2 3 4 5
Treatment effect Treatment effect
Standard deviation
Treatment effect Treatment effect
Standard deviationStandard deviation
Figure 2.3 – Manipulation results for amphibian and reptile species richness and
abundance. Small sections of the graphs represent variance explained by residuals and
treatment effects. Dots represent means of the posterior distribution of the treatment effect
for each treatment. Error bars are 95 % credibility intervals. For abbreviations of the
treatments (y-axis) see Fig. 2.2.

55
were disturbance-tolerant. After the manipulation, pristine-forest specialists (Sphenomorphus
variegatus (Peters) and Sphenomorphus nigrilabris (Günther)) increased in all but two
treatments (add LLT & LOGS plots and the control). Whilst before the manipulation three
species were mostly co-dominant, E. grandis was mostly over-dominant after the
manipulation.
I found a decreasing trend of the individual removal treatments on amphibian species
richness. All other treatments did not cause a detectable effect (upper sections Fig. 2.3).
Reptile species richness decreased following the combined removal LOGS and LLT treatment
and increased in response to the add-LLT treatment; all other treatments did not show an
effect. Whilst amphibian abundance did not change when the plots were manipulated, reptile
abundance decreased in response to the rem-LOGS and the combined removal treatment, and
increased when LLT was added. The other treatments did not cause effects. Overall, treatment
effects explained considerably less variance in the data than was contained in the residuals
(lower sections Fig. 2.3).
I analysed data separately for pristine-forest specialists but given their absence in
several treatments and low abundance in others, results of the analysis were statistically
nonsensical. I, therefore, do not present these results here.
Discussion
I used a two-step, correlative-to-manipulative approach, to reveal the factors determining the
conservation value of cacao agroforestry in Sulawesi, Indonesia. I first conducted surveys and
identified the predictors of amphibian and reptile diversity patterns with a Bayesian modelling
approach. I then manipulated the variables identified to be most important to determine the
causal relationship between habitat complexity and changes in herpetological diversity.

56
Modelling environmental determinants
A model selection approach may – in the best-case scenario – give clear directions to improve
the conservation value of agroforestry habitats. Candidate models hypothesizing that
microstructure components (i.e., leaf litter thickness, logs and branches, and the ratio between
leaf litter and shrub cover [LLT, LOGS, and COVER, respectively]) enhance amphibian and
reptile diversity clearly fit the data better than models pointing towards landscape effects. This
contrasts with other studies stressing the importance of landscape effects (e.g. distance to the
nearest forest patch; Gillespie et al. 2005; Schroth & Harvey 2007b). The responses found
here could have been expected given the ecological preferences of most disturbance-tolerant
species found (e.g., Manthey & Grossmann 1997).
Mean annual temperature of the cacao plantations was always included in the most
parsimonious models and explained most of the deviance of all favourable candidate models;
therefore, temperature is a driving force for species richness patterns when land-use is
intensified. Other studies also suggest temperature sensitivity of amphibians and reptiles in
plantation habitats (Perfecto et al. 2007; Luja et al. 2008). Mechanistically, for example skin
brightness of species increases from pristine habitats to disturbed open canopy habitats (as
found in my study area; T.C. Wanger unpublished data). Darker pristine-forest specialist
species have to commit more physiological performance for acclimatization in open-canopy
environments and less for feeding or mating. Hence, as canopy opens, species get more
exposed to heat stress, which intensifies as future climatic conditions intensify. These findings
stress the importance of monitoring the impacts of climate change in plantation habitats.
My results provide recommendations that can be readily implemented by local
farmers, because leaf litter removal and cacao tree pruning are common practice in plantation
management. This would, hence, allow easy adjustment of LLT and LOGS, and – when
incorporated with weeding – COVER. However, findings of the manipulation approach

57
suggest that the choice of management actions are species-specific and general
recommendations based on model predictions are difficult to make.
Large scale manipulation experiment
Large scale experimental approaches in tropical agricultural habitats are scarce, despite
offering important insights into ecological and conservation theory (but see Cruz-Angon et al.
2008; Greenberg et al. 2008). Difficulties arise in complex habitats, where results may be
obscured by strong temporal and spatial variation (Hewitt et al. 2007; Dumbrell et al. 2008).
My results show that manipulation of structural complexity on the plantation level can modify
amphibian and reptile species richness. Whilst reptile abundance followed the changes in
reptile species richness, amphibian abundance remained similar to pre-manipulation levels.
Effects on amphibian species richness were restricted to individual removal
treatments. The absence of a response to the combined removal treatment may be explained
by the differential disturbance tolerance of species. Half of the six species found are
disturbance-tolerant, two of which are toads and one is a frog. The combined treatment may
have had a negative effect on the more sensitive ranid species (H. celebensis) that was then
readily replaced by one of the robust toad species (e.g. D. melanostictus is invasive in Bali
and occurs in strongly disturbed habitat; McKay 2006), thus obscuring effects of the treatment
on species richness. In the individual removal treatments, however, sensitive Limnonectes
species were not found and then replaced by other species after the manipulation. In terms of
abundance, the toads (I. celebensis and D. melanostictus) appear to benefit from disturbance
even when structural complexity is reduced. The same relative abundance of these species in
all treatments may result from migration patterns of the common bufonids following their
prey (Ryall & Fahrig 2006), as was shown in birds and carabid beetles (Winder et al. 2001;
Fink et al. 2009). This is probably the case in these common amphibians (T.C. Wanger

58
unpublished data). Given the high abundance of common disturbance-tolerant species, they
seem to have an overriding effect on patterns observable in specialized species.
Reptile species richness response patterns were paralleled by less clear patterns in
abundance. The removal of LOGS & LLT and adding LLT decreased and increased species
richness, respectively. In reptiles, four of the 17 species found are specialized on primary
habitats. Manipulation of a single structural component alone may not be sufficient to
decrease occurrence of strongly disturbance-tolerant species (e.g. E. multifasciatus and E.
grandis, although the latter was described as a rare obligate arboreal species; Howard et al.
2007). An explanation that species richness only increased after addition of LLT, but not in
the LOGS treatment, may be competitive exclusion. If all available niches are already
occupied by the most abundant species (E. grandis and E. multifasciatus), immigration of new
species is difficult (for examples on skinks and tropical snakes see Langkilde & Shine 2004;
Luiselli 2006). Surprisingly, Sphenomorphus spp. were found in most treatments only after
the manipulation. Given that these lizards are considered forest species, this may have
resulted from a change in prey abundance or other temporal variation.
Although model setup and study design were carefully planned to incorporate and
minimize temporal and spatial variation, I make a caveat that indirect abiotic changes (e.g.
climatic conditions), varying resource availability (Hewitt et al. 2007), and processes such as
facilitation, inhibition, and competition (Bruno et al. 2003) between plots and sampling events
may have slightly altered control treatment effects. This may, hence, have influenced
manipulation results. I am, however, confident that detection probability was not
compromised through the treatment effects but eventually through variation in shrub cover
between plots. As the latter was randomly spread between plots of the different treatment
groups and the control, this should not have influenced my results.
Taken together, the addition of LLT was the only treatment that caused the expected
effect on reptile diversity at sufficient magnitude to be detected, whilst amphibian diversity
59
was not enhanced by any treatment. LLT has been shown to be an important determinant for
tropical amphibians and reptiles by providing important microhabitat resources (e.g. humidity
and prey; Whitfield et al. 2007). However, the manipulation approach may be obscured by
temporal and spatial variation. My results suggest further that disturbance-tolerant species are
dominant in the plantations and, therefore, determine the response to the manipulation.
Conclusions
Low species richness and abundance paralleled by exceptionally high endemism distinguish
Sulawesi from other tropical regions. An additional difference is reflected in the results of my
observational modelling where, in contrast to other studies, plantation rather than landscape-
environmental factors enhance the value of cacao agroforests for herpetological diversity.
Implementation of the correlative results in field experiments has revealed reduced pristine-
forest specialist diversity in plantations; as disturbance-tolerant species dominate the
assemblage, improving the conservation value of cacao agroforestry for herpetological
diversity will, therefore, mostly benefit these common species. The limited presence of
pristine-forest specialists is not ideal, and implies that even cacao agroforests managed for
biodiversity cannot replace natural habitat. However, common species probably fulfil – and
their conservation thus assures maintenance of – important ecosystem functions (Gaston &
Fuller 2008). Abundant lizards, for example, help to control insect pest species in coffee
plantations (Borkhataria et al. 2006). In strongly modified habitats, where forest specialists
are less abundant, sustaining functionality through the preservation of abundant species is
crucial.
The environmental predictors found to be important on the plantation scale are easily
implemented by the local farmers during management practices. However, my manipulation
approach suggested that large scale variation prevented, in part, detection of a clear pattern.
Therefore, to make cacao agroforests more hospitable to herpetological diversity, plantation-

60
scale modifications focused on increasing leaf litter thickness have to be integrated at a larger
scale with many farmers participating in such an approach. For pre-emptive buffering of
climate change impacts, canopy cover in plantations should be supplemented with fast
growing leguminous trees (e.g. Gliricidia Gliricidia sepium), to maintain a suitable
microclimate. Although more studies are needed for sound management recommendations,
such habitat changes may positively affect the adaptation potential of plantations towards
future climate change impacts (Scherr & McNeely 2008). Predictive modelling approaches
incorporating field data of climate-driven changes in these habitats should be used to lay the
path for successful future management recommendations.

61
Land-use change, tropical biodiversity, and ecosystem services – Southeast Asian amphibians and reptiles in focus
T.C. Wanger
Chapter 3
AMPHIBIANS AND REPTILES OF THE LINDU NATIONAL PARK AREA, SULAWESI (INDONESIA)
T.C. Wanger1, I. Motzke2, Shahabuddin3, D.T. Iskandar4
1Environment Institute, University of Adelaide, Adelaide, SA 5005, Australia
2Agrarökologie, Georg-August-Universität, D-37073 Göttingen, Germany
3Agrotechnology, Faculty of Agriculture, University of Tadulako Palu, Indonesia
4Department of Biology, School of Life Sciences and Technology, Bandung, Indonesia
Salamandra – 2010, in press

62
STATEMENT OF AUTHORSHIP AMPHIBIANS AND REPTILES OF THE LINDU NATIONAL PARK AREA, SULAWESI (INDONESIA) Salamandra – 2010, in press Wanger, T.C. (Candidate) Prepared and conducted the data collection, compiled the species lists, conducted the literature review, interpreted the results, wrote the paper and acted as corresponding author. I hereby certify that the statement of contribution is accurate.
Signed Date 12/11/2010 Motzke, I. Helped with the field sampling of amphibians and reptiles and handling, and discussed and commented on the manuscript. I hereby certify that the statement of contribution is accurate and I give permission for the inclusion of the paper in the thesis.
Signed Date 12/11/2010 Shahabuddin Helped with data compilation, commented and discussed the manuscript I hereby certify that the statement of contribution is accurate and I give permission for the inclusion of the paper in the thesis.
Signed Date 12/11/2010 Iskandar, D.T. Helped with species identification and gave recommendations for proper sampling of the animals in the field. Helped sourcing the literature and discussed and commented on the manuscript. I hereby certify that the statement of contribution is accurate and I give permission for the inclusion of the paper in the thesis.

63
Signed Date 18/11/2010

64
Chapter 3 - The amphibians and reptiles of the Lore Lindu National Park area, Sulawesi (Indonesia)
A Wanger, T.C., Motzke, I., Shahabuddin, & Iskandar, D.T. (2011) Amphibians and reptiles of the Lindu National Park area, Sulawesi (Indonesia). Salamandra, v. 47(1), pp. 17-29
A NOTE:
This publication is included on pages 64-79 in the print copy of the thesis held in the University of Adelaide Library.
A NOTE
Published article is titled: 'The amphibians and reptiles of the Lore Lindu National Park area, Central Sulawesi, Indonesia'.

80
Land-use change, tropical biodiversity, and ecosystem services –
Southeast Asian amphibians and reptiles in focus
T.C. Wanger
Chapter 4
ENDEMIC PREDATORS, INVASIVE PREY, AND NATIVE DIVERSITY
T.C. Wanger1, A.C. Wielgoss2, I. Motzke2, Y. Clough2, B.W. Brook1, N.S. Sodhi3, T. Tscharntke2
1Environment Institute, University of Adelaide, Adelaide, SA 5005, Australia
2Agrarökologie, Georg-August-Universität, D-37073 Göttingen, Germany
2Department of Biological Sciences, National University of Singapore, Singapore 117543, Singapore
Proceedings of the Royal Society - B – 2010, online early (doi: 10.1098/rspb.2010.1512)

81
STATEMENT OF AUTHORSHIP ENDEMIC PREDATORS, INVASIVE PREY; AND NATIVE DIVERSITY Proceedings of the Royal Society - B – 2010, online early (doi: 10.1098/rspb.2010.1512) Wanger, T.C. (Candidate) Prepared and conducted the data collection, analysed the data, interpreted the results, wrote the paper and acted as corresponding author. I hereby certify that the statement of contribution is accurate.
Signed Date 12/11/2010 Wielgoss, A.C. Helped with species identification and gave recommendations for proper ant sampling. Also discussed and commented on the manuscript. I hereby certify that the statement of contribution is accurate and I give permission for the inclusion of the paper in the thesis.
Signed Date 15/11/2010 Motzke, I. Helped with the field sampling of ants, site preparation, and discussed and commented on the manuscript. I hereby certify that the statement of contribution is accurate and I give permission for the inclusion of the paper in the thesis.
Signed Date 12/11/2010

82
Brook, B.W. Provided support when analysing the data and discussed and commented on the manuscript. I hereby certify that the statement of contribution is accurate and I give permission for the inclusion of the paper in the thesis.
Signed Date 15/11/2010 Sodhi, N.S. Helped with writing and discussing the manuscript. I hereby certify that the statement of contribution is accurate and I give permission for the inclusion of the paper in the thesis.
Signed Date 12/11/2010 Clough, Y. Commented and discussed the manuscript I hereby certify that the statement of contribution is accurate and I give permission for the inclusion of the paper in the thesis.
Signed Date 12/11/2010 Tscharntke, T. Helped with initial preparations, writing and discussing the manuscript. I hereby certify that the statement of contribution is accurate and I give permission for the inclusion of the paper in the thesis.
Signed Date 12/11/2010

83
Chapter 4 - Endemic predators, invasive prey, and native diversity; biocontrol by an
endemic toad
Abstract
Interactions between native diversity and invasive species can be more complex than currently
understood. Invasive ant species often substantially reduce native ant diversity that act as
natural control agents for pest insects. In Indonesia (on the island of Sulawesi), the third
largest cacao producer worldwide, I show that a predatory endemic toad (Ingerophrynus
celebensis) controls invasive ant (Anoplolepis gracilipes) abundance, and positively affects
native ant diversity. I call this the invasive-naïvety effect, an opposite of enemy-release,
whereby alien species may not harbour anti-predatory defences against a novel native
predator. A positive effect of the toads on native ants may facilitate their predation on insect
vectors of cacao diseases. Hence toads may increase crop yield but further research is needed
on this aspect. Ironically, amphibians are globally the most threatened vertebrate class and are
strongly impacted by the conversion of rain forest to cacao plantations in Sulawesi. It is,
therefore, crucial to manage cacao plantations to maintain these endemic toads, as they may
provide critical ecosystem services, such as invasion resistance and preservation of native
insect diversity.

84
Introduction
Cacao is the largest international trade commodity after petroleum and coffee, and currently
covers eight million ha in the tropics (FAO 2009). Cacao plantations, despite their structural
similarities to natural tropical forests, harbour reduced biodiversity, especially when shade
trees are removed to maximise crop yields (Schroth & Harvey 2007b; Clough et al. 2009a).
The effects of land use change can be further intensified when these agricultural areas are
subsequently colonised by invasive species, particularly on remote islands with high
endemism (Roemer et al. 2002; Wagner & Van Driesche 2010). Structural simplification in
plantations can also compromise the ecosystem services provided by native biodiversity.
Natural ant diversity, for example, has been shown to regulate insect vectors of cacao pests
and decrease the risk of disease outbreaks (Philpott & Armbrecht 2006). Introductions of the
Yellow Crazy Ant (Anoplolepis gracilipes) are known to affect native biodiversity and
ecosystem processes on islands (O'Dowd et al. 2003; McNatty et al. 2009). As a result,
Anoplolepis gracilipes is ranked amongst the top 100 invasive species worldwide (GISD
2007).
An ubiquitous yet expensive and often unsuccessful approach to controlling invasive ant
species in poor, developing countries is the heavy application of pesticides, which can also
damage native biodiversity and human health (Wanger et al. 2010b). Theoretically, native
diversity could provide free services by controlling invasive ants and mitigating pesticide use
(Chivian & Bernstein 2008). This requires that native predators become effective predators of
invasive ants (Fig. 4.1). Further, the native predator should be abundant, ground living, and
ideally, be ant specialist. The Common Celebes Toad (Ingerophrynus celebensis), and a skink
(Eutropis grandis), are the most abundant ground-living vertebrates in the cacao plantations
of Sulawesi (Wanger et al. 2009). To assess their role as an invasive ant control agent, I first
determined dietary preferences of these two species and then experimentally excluded ant
predating specialists (the toads) from cacao plantations. I tested the hypothesis that an
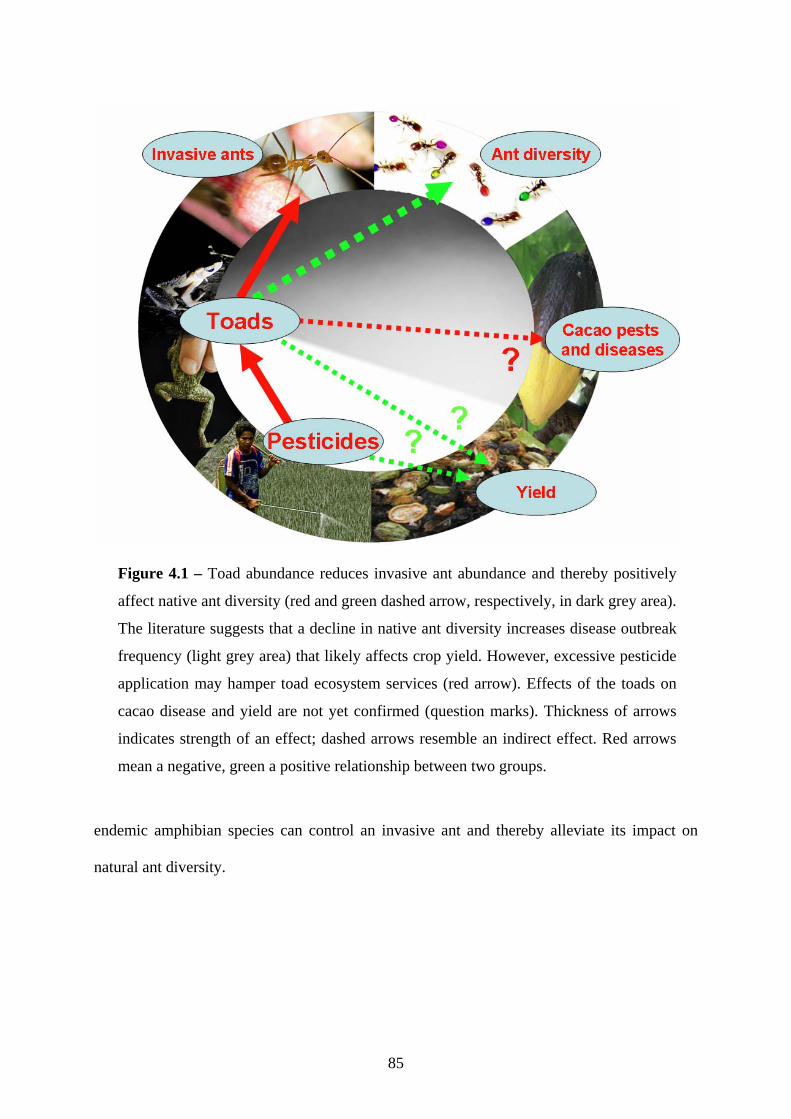
85
endemic amphibian species can control an invasive ant and thereby alleviate its impact on
natural ant diversity.
Figure 4.1 – Toad abundance reduces invasive ant abundance and thereby positively
affect native ant diversity (red and green dashed arrow, respectively, in dark grey area).
The literature suggests that a decline in native ant diversity increases disease outbreak
frequency (light grey area) that likely affects crop yield. However, excessive pesticide
application may hamper toad ecosystem services (red arrow). Effects of the toads on
cacao disease and yield are not yet confirmed (question marks). Thickness of arrows
indicates strength of an effect; dashed arrows resemble an indirect effect. Red arrows
mean a negative, green a positive relationship between two groups.

86
Material and Methods
Amphibian, reptile, and ant sampling
To predict toad and lizard abundances by different ant species abundances and richness, I
collected data from 43 cacao plots (40 x 40 m; 21 cacao agroforest and 22 cacao monoculture
plantations) around the Lore Lindu National Park in Central Sulawesi (Indonesia; Fig. 1.1).
Amphibians and reptiles were sampled three times during day and night with visual and
acoustic encounter surveys (Wanger et al. 2009). Ants were sampled with observation plates
(10 on the ground and 10 in the trees) on each plantation, baited with tuna and sugar solution.
For ant recruitment rates (hereafter I refer to ‘ant abundance’ for clarity) and species richness,
I counted the number of ant individuals and species on each plate every 15 minutes for 1h. I
used the mean maximum number of all plates as a measure of ant abundances per plot. For ant
diversity, I used the total number of species encountered in the plot (Wielgoss et al. 2010).
Biomass analysis – faeces and reference data from the cacao plantations
I collected faeces samples of amphibians and reptiles between December 2007 and August
2009 and analysed arthropod species composition. All individuals captured in the 43 plots
were kept in plastic containers for 12 h and faeces were collected. I identified the prey items
found in faeces samples to order whenever identifiable species parts were available, and
where possible I quantified individual numbers (e.g., counting the number of heads, thoraxes,
etc.). I equated hymenopterans with ants, because I mainly identified ant remnants in the
faeces; thus, I assume that bees and wasps are less likely prey items for these lizard and toad
species. I used five Barber traps randomly placed within a plot equipped with a 1:1
ethylene:glycol solution. The traps were emptied twice (once every four weeks) over a period
of two months. I identified the samples to taxonomic order and measured dry weight. The
summed biomass of all traps within a plot was used for standardisation of the faeces biomass.

87
Toad exclosure
The toads migrate through the plantations to form calling choruses in the rice fields roughly
every three months. They stay in the plantations for an average of one week where their
abundance can reach up to 300 toads per hectare (T.C. Wanger and I. Motzke pers. observ.).
In contrast to the control plots, I expected that by excluding the toads from treatment plots,
Anoplolepis abundance would increase due to a lack of toad predation. If this is a long lasting
effect, removal of the exclosure would not change ant abundance patterns when few or no
toads are present in the plantations. Therefore exclosures were removed.
For the fence exclosure experiment, 14 plots (10 x 10 m; for environmental details see
Tab. 4.1) with Anoplolepis present were sampled four times in cacao agroforests. Ant
abundances were determined once in the evening and morning over seven days; on the first
day before an exclosure fence had been established, the third and fifth day after the fence had
been established, and on the seventh day after the fence had been removed. Seven plots were
randomly assigned to treatment and control groups. While the control plots were only
disturbed on the edges for all sampling sessions, I built 50 cm tall exclosures of 3 mm wide
plastic mesh on the treatment plots. Fences and exclosures were maintained every day and
checked every night for toads inside the fence. In all plots and sampling sessions, ant diversity
and Anoplolepis abundance – as the only invasive species present – was determined with four
sampling plates per plot, baited with tuna and sugar solution (Wielgoss et al. 2010). I only
used four plates because increasing the number of plates may have resulted in unrealistic
abundances due to overabundant food sources. Time frames were chosen so that the evening
sample was conducted before the toads moved through the experimental area and the morning
sampling was after the toads had finished feeding in the area. For the analysis, I pooled
abundance data from morning and evening sampling sessions for higher robustness of samples
(e.g., climatic variation between morning and evening sessions may potentially lead to
changes in ant abundances).

88
Table 4.1 – Characteristics of the 14 sample sites. Variable definitions and acquisition: C – Control plot; T – treatment plot; SD – Standard
deviation; No. cacao trees – counted number of cacao trees in the plots; Distance to forest – distance to the nearest forest edge, measured in the
field; Distance to rice field – distance to the nearest rice field; Leaf litter thickness – thickness of leaf litter layer in the plot, measured with a ruler;
No. logs – number of branch piles in the plot; plant density – counted number of plant stems in five 1 x 1 m subplots in the plots; No. trees – number
of trees other than cacao in the plot.
Treatment/Control plot No. cacao trees
Distance to forest[m]
Distance to rice field [m]
Leaf litter thickness [cm] No. logs
Plant density[No. / m2] No. trees
C 8 200 8 2 2 32 1 C 10 170 16 3.5 1 18 0 C 8 230 2 2.5 1 1 1 C 6 140 3 0.5 1 8 0 C 8 80 12 2 3 39 2 C 8 80 8 2 2 48 2 C 9 90 5 2.5 1 25 0 Mean 8.1 141.4 7.7 2.1 1.6 24.4 0.9 SD 1.2 60.9 5.0 0.9 0.8 16.8 0.9 T 9 200 8 1.5 1 45 0 T 8 180 13 3.5 1 25 0 T 9 150 12 2 1 17 0 T 9 190 6 4 1 12 0 T 9 200 2 3 0 3 1 T 6 140 2 1 1 4 1 T 8 75 15 1 2 43 1 Mean 8.3 162.1 8.3 2.3 1.0 21.3 0.4 SD 1.1 45.1 5.3 1.2 0.6 17.3 0.5

89
I sampled the plots for one week to minimize confounding climatic effects in the field
rather than accounting for it in the models with limited sample size. Only 14 sites were
sampled because each site had to fulfil a strict set of requirements for a robust sampling
design: 1) toads had not moved through the cacao plot prior the first sampling session (all
candidate sites were checked every night over a 3 month period); 2) toads were moving
through the plots until the third sampling session was completed; 3.) climatic conditions were
suitable and similar for the ants (i.e., no rain or wet soil) to minimize confounding climatic
effects on the results.
Analysis
I used Bayesian linear modelling with multi-model inference to determine whether individual
ant species abundances and general fossorial ant diversity were drivers for toad and lizard
abundance. I defined three a priori main hypotheses that were challenged in a Bayesian Multi
Model Inference approach (i.e., that either (a) cumulative abundance of large ants [of
Anoplolepis gracilipes, Paratrechina longicornis, Pheidologeton sp., Philidris sp.], (b)
individual large ant abundances, or (c) ground dwelling ant species richness, drive abundance
patterns in the most common amphibian and reptile species). For an introduction of Bayesian
model evaluation, see McCarthy (2007) and Appendix 2.
The exclosure experiment and its impact on ant diversity was analysed with a
Bayesian repeated-measures ANOVA, where the first sampling session was specified as
reference level, and site was coded as a random effect to account for spatial differences not
accounted for in the fixed effects. The treatment effect was modelled as an interaction with
sampling session, because I was interested in the exclosure effects over time and not a
treatment effect per se. To reduce the predictors in the model, I used the relative abundance
and relative native ant species richness (i.e., difference between treatment and control plots)
as response variables.
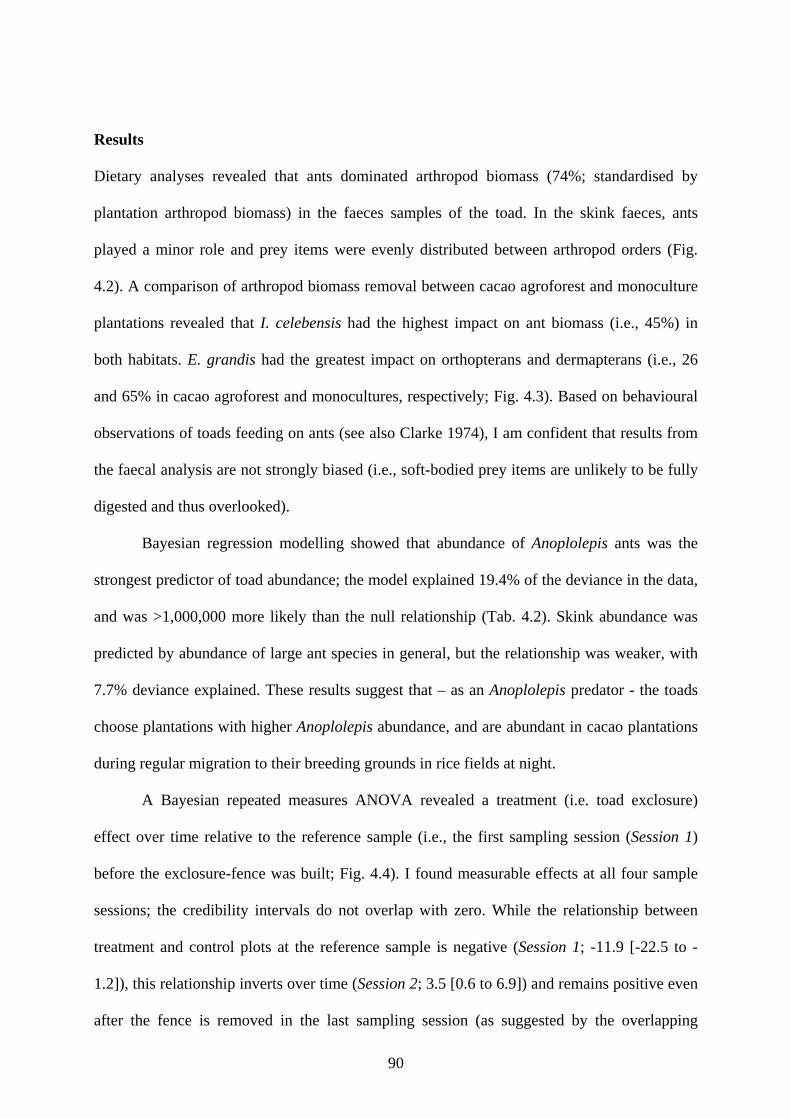
90
Results
Dietary analyses revealed that ants dominated arthropod biomass (74%; standardised by
plantation arthropod biomass) in the faeces samples of the toad. In the skink faeces, ants
played a minor role and prey items were evenly distributed between arthropod orders (Fig.
4.2). A comparison of arthropod biomass removal between cacao agroforest and monoculture
plantations revealed that I. celebensis had the highest impact on ant biomass (i.e., 45%) in
both habitats. E. grandis had the greatest impact on orthopterans and dermapterans (i.e., 26
and 65% in cacao agroforest and monocultures, respectively; Fig. 4.3). Based on behavioural
observations of toads feeding on ants (see also Clarke 1974), I am confident that results from
the faecal analysis are not strongly biased (i.e., soft-bodied prey items are unlikely to be fully
digested and thus overlooked).
Bayesian regression modelling showed that abundance of Anoplolepis ants was the
strongest predictor of toad abundance; the model explained 19.4% of the deviance in the data,
and was >1,000,000 more likely than the null relationship (Tab. 4.2). Skink abundance was
predicted by abundance of large ant species in general, but the relationship was weaker, with
7.7% deviance explained. These results suggest that – as an Anoplolepis predator - the toads
choose plantations with higher Anoplolepis abundance, and are abundant in cacao plantations
during regular migration to their breeding grounds in rice fields at night.
A Bayesian repeated measures ANOVA revealed a treatment (i.e. toad exclosure)
effect over time relative to the reference sample (i.e., the first sampling session (Session 1)
before the exclosure-fence was built; Fig. 4.4). I found measurable effects at all four sample
sessions; the credibility intervals do not overlap with zero. While the relationship between
treatment and control plots at the reference sample is negative (Session 1; -11.9 [-22.5 to -
1.2]), this relationship inverts over time (Session 2; 3.5 [0.6 to 6.9]) and remains positive even
after the fence is removed in the last sampling session (as suggested by the overlapping

91
Table 4.2 – Effect of ant species abundances and richness on amphibian and reptile
abundance. Common Celebes Toad (Ingerophrynus celebensis) abundance was best
predicted by Yellow Crazy Ant (Anoplolepis gracilipes) abundance. Large ant species
abundances were the best predictor for the common lizard (Eutropis grandis). The best
models, selected based on the smallest Deviance Information Criterion (DIC) statistic, are
indicated in bold-italics. The saturated model (Saturated) comprises all, the null model (Null)
none of the explanatory variables tested. Model variables: ICA – toad abundance; EGA –
lizard abundance; an – Anoplolepis gracilipes abundance; pe – Pheidologethon sp.
abundance; p – Paratrechina longicornis abundance; ph – Philidris sp. abundance; foss.spr –
large fossorial ant species richness. Model selection parameters: Dbar – point estimate of the
deviance; DIC – deviance information criterion; ΔDIC – difference between the DIC values of
the model of interest and the best supported model; pD - number of effective parameters;
%Dev - percentage deviance explained, indicating a structural goodness of fit.
Ingerophrynus celebensis abundance Dbar DIC ΔDIC pD %Dev
ICA ~ an 120.9 122.9 0.0 2.0 19.4
ICA ~ Saturated 119.7 125.3 2.4 5.6 20.2
ICA ~ pe + ph + p + an 120.9 125.6 2.7 4.8 19.4
ICA ~ pe 147.5 149.3 26.4 1.9 1.7
ICA ~ ph 148.7 150.7 27.8 2.0 0.8
ICA ~ foss.spr 149.0 150.9 28.0 1.9 0.7
ICA ~ Null 150.0 150.9 28.0 1.0 0.0
ICA ~ p 150.8 152.7 29.8 2.0 -0.5
Eutropis grandis abundance Dbar DIC ΔDIC pD %Dev
EGA ~ pe + ph + p + an 200.2 205.1 0.0 4.9 7.7
EGA ~ Saturated 200.1 206.1 1.0 6.0 7.8
EGA ~ an 206.3 208.4 3.2 2.0 4.9
EGA ~ foss.spr 208.7 210.7 5.5 2.0 3.9
EGA ~ ph 213.7 215.7 10.6 2.0 1.5
EGA ~ Null 217.0 218.0 12.9 1.0 0.0
EGA ~ p 217.0 218.9 13.8 1.9 0.0
EGA ~ pe 217.6 219.7 14.5 2.1 -0.3
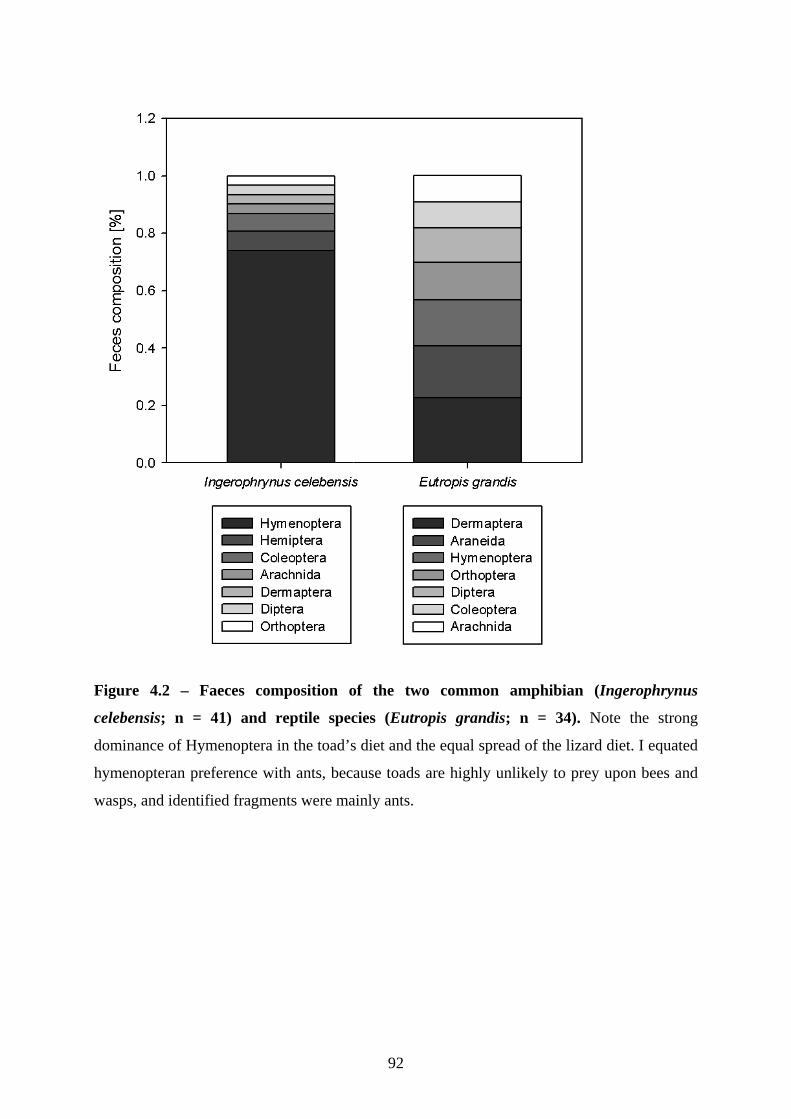
92
Figure 4.2 – Faeces composition of the two common amphibian (Ingerophrynus
celebensis; n = 41) and reptile species (Eutropis grandis; n = 34). Note the strong
dominance of Hymenoptera in the toad’s diet and the equal spread of the lizard diet. I equated
hymenopteran preference with ants, because toads are highly unlikely to prey upon bees and
wasps, and identified fragments were mainly ants.

93
Figure 4.3 – Biomass removal of Eutropis grandis and Ingerophrynus celebensis between
cacao agroforest and cacao monocultures. The skink is rather a generalist feeder whilst the
toad is specialized on ants (hymenopterans; shown are the three most encountered arthropod
orders). I equated hymenopteran preference with ants, because toads are highly unlikely to
prey upon bees and wasps, and identified fragments were mainly ants. The two habitat types
were defined from the 43 cacao plantations; cacao monocultures had a canopy cover of less
than 25 %.
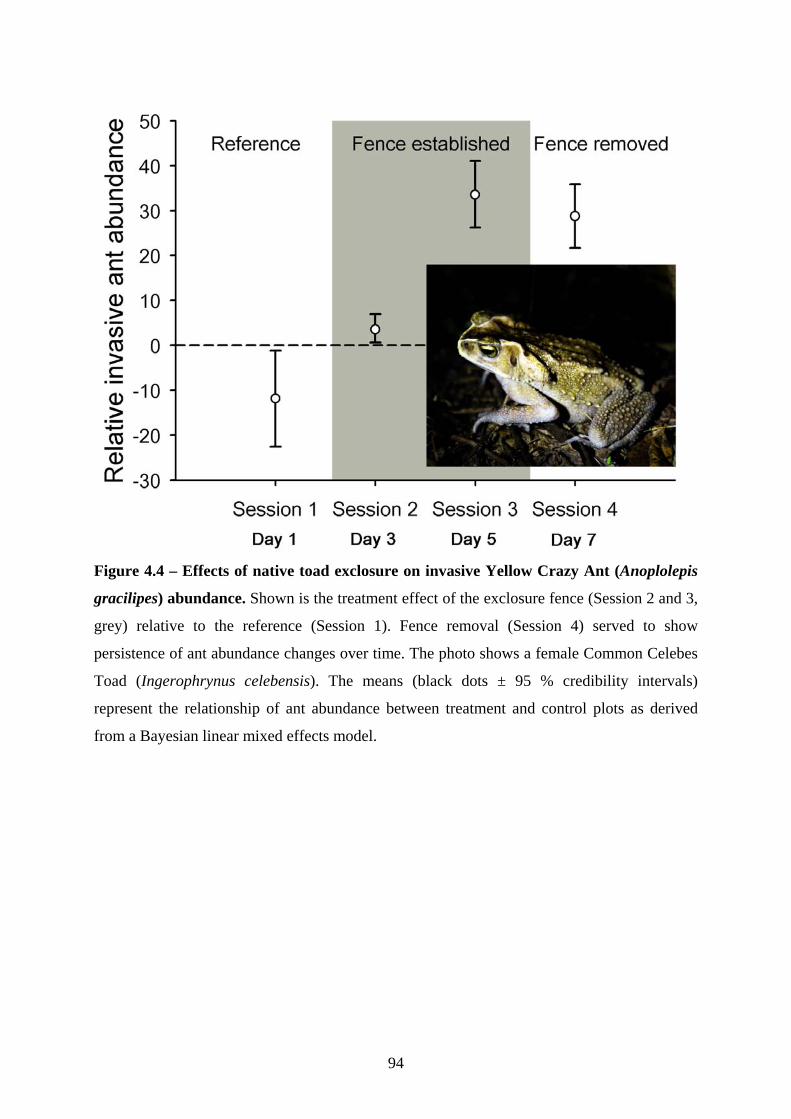
94
Figure 4.4 – Effects of native toad exclosure on invasive Yellow Crazy Ant (Anoplolepis
gracilipes) abundance. Shown is the treatment effect of the exclosure fence (Session 2 and 3,
grey) relative to the reference (Session 1). Fence removal (Session 4) served to show
persistence of ant abundance changes over time. The photo shows a female Common Celebes
Toad (Ingerophrynus celebensis). The means (black dots ± 95 % credibility intervals)
represent the relationship of ant abundance between treatment and control plots as derived
from a Bayesian linear mixed effects model.

95
Figure 4.5 – Anoplolepis activity in the study region over night. I determined Anoplolepis
abundance at six sites for one hour for each time step (i.e., at 18h, 0h, 6h). Throughout the
day, however, activity patterns were found to be constant (Suwabe et al. 2009).
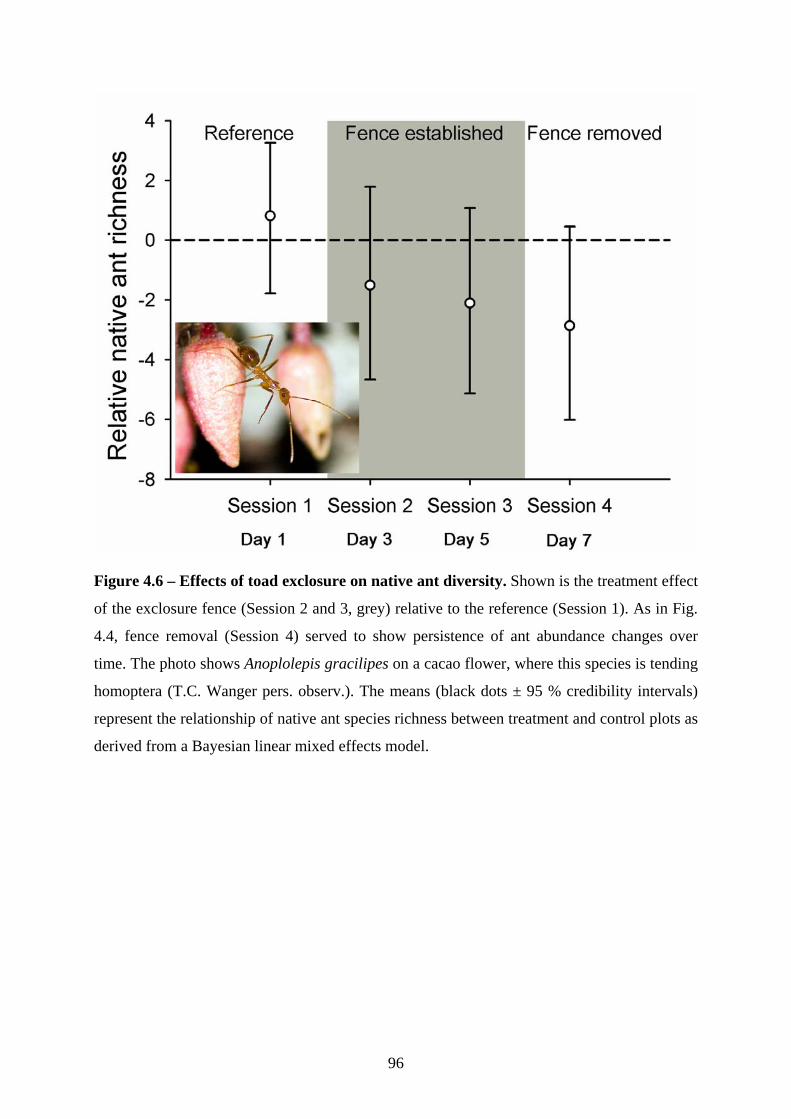
96
Figure 4.6 – Effects of toad exclosure on native ant diversity. Shown is the treatment effect
of the exclosure fence (Session 2 and 3, grey) relative to the reference (Session 1). As in Fig.
4.4, fence removal (Session 4) served to show persistence of ant abundance changes over
time. The photo shows Anoplolepis gracilipes on a cacao flower, where this species is tending
homoptera (T.C. Wanger pers. observ.). The means (black dots ± 95 % credibility intervals)
represent the relationship of native ant species richness between treatment and control plots as
derived from a Bayesian linear mixed effects model.
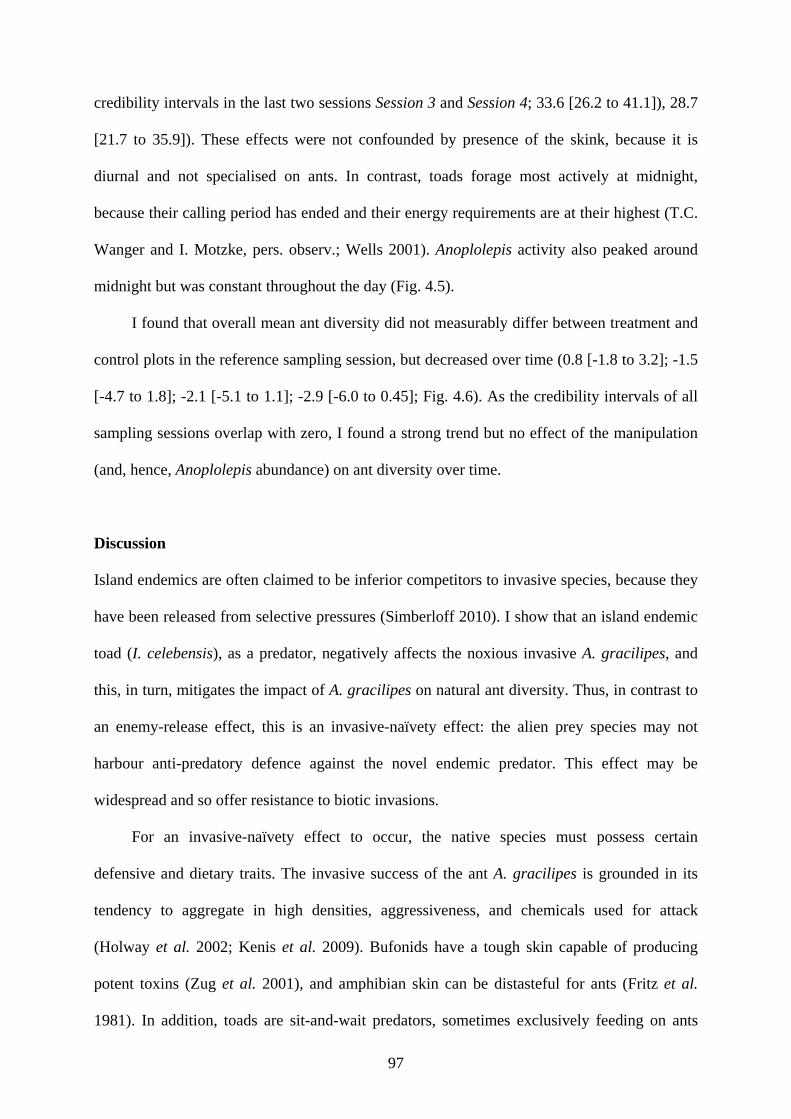
97
credibility intervals in the last two sessions Session 3 and Session 4; 33.6 [26.2 to 41.1]), 28.7
[21.7 to 35.9]). These effects were not confounded by presence of the skink, because it is
diurnal and not specialised on ants. In contrast, toads forage most actively at midnight,
because their calling period has ended and their energy requirements are at their highest (T.C.
Wanger and I. Motzke, pers. observ.; Wells 2001). Anoplolepis activity also peaked around
midnight but was constant throughout the day (Fig. 4.5).
I found that overall mean ant diversity did not measurably differ between treatment and
control plots in the reference sampling session, but decreased over time (0.8 [-1.8 to 3.2]; -1.5
[-4.7 to 1.8]; -2.1 [-5.1 to 1.1]; -2.9 [-6.0 to 0.45]; Fig. 4.6). As the credibility intervals of all
sampling sessions overlap with zero, I found a strong trend but no effect of the manipulation
(and, hence, Anoplolepis abundance) on ant diversity over time.
Discussion
Island endemics are often claimed to be inferior competitors to invasive species, because they
have been released from selective pressures (Simberloff 2010). I show that an island endemic
toad (I. celebensis), as a predator, negatively affects the noxious invasive A. gracilipes, and
this, in turn, mitigates the impact of A. gracilipes on natural ant diversity. Thus, in contrast to
an enemy-release effect, this is an invasive-naïvety effect: the alien prey species may not
harbour anti-predatory defence against the novel endemic predator. This effect may be
widespread and so offer resistance to biotic invasions.
For an invasive-naïvety effect to occur, the native species must possess certain
defensive and dietary traits. The invasive success of the ant A. gracilipes is grounded in its
tendency to aggregate in high densities, aggressiveness, and chemicals used for attack
(Holway et al. 2002; Kenis et al. 2009). Bufonids have a tough skin capable of producing
potent toxins (Zug et al. 2001), and amphibian skin can be distasteful for ants (Fritz et al.
1981). In addition, toads are sit-and-wait predators, sometimes exclusively feeding on ants

98
(Clarke 1974). As endemic toads likely have been ant specialists before the invasion occurred,
their prey search image may be “pre-set” for an Anoplolepis-type of prey. Density dependence
predation of the toads on the abundant invasive ants may be a likely explanation of the
reduction of A. gracilipes abundance. In addition, there may be nutritious preferences for the
invasive to the native ants such as essential amino acid composition. A preference for A.
gracilipes may lead to reduction in their abundance due to toad predation. Based on skin
defences and potential predefined feeding preference of many toads, there may be a general
potential for bufonids as biocontrol agents; this area of conservation and invasion biology
needs further research.
Intuitively, toads can only provide useful ecosystem services if they are abundant – yet,
(endemic) amphibians are the most threatened vertebrates on the planet (Rowley et al. 2009).
If toad populations are reduced as a result of land-use change and pesticide use (Relyea 2005;
Wanger et al. 2010a), my results suggest that A. gracilipes can flourish as “ecosystem
transformer” (Fig. 4.1). In Sulawesi, rapid expansion of these ants drastically depletes natural
ant diversity (Bos et al. 2008). This may have a real economic impact because native ants in
Southeast Asia have been shown to provide various ecosystem functions, including biocontrol
of insect-mediated cacao pests (see Table 1 in Philpott & Armbrecht 2006). On other islands,
A. gracilipes affects litter decomposition and nutrient cycling (Dunham & Mikheyev 2010),
trophic cascades (O'Dowd et al. 2003) and even the tourism industry (via displacement of a
bird species; Feare 1999). These negative impacts may, however, take several decades to
unfold fully; on Christmas Island, Yellow Crazy Ant populations exploded 60 years after its
introduction (Abbott 2005).
The economic magnitude of the toad’s biocontrol service in cacao agroforestry systems
is, however, conditional on parameters affecting cacao yield and Anoplolepis’ effectiveness as
a predator of cacao pest insect vectors. In Sulawesi, both pest and disease occurrence are
important determinants of cacao yield (Juhrbandt et al. 2010). Thus, the less effective

99
Anoplolepis is as a predator on disease vectors relative to the native ant species, intuitively
more economical it is to have the toads in cacao plantations. It is possible that the time period
to detect an effect of invasive ants on the native ant species in my study may be too short.
However, it has previously been shown that A. gracilipes depletes native ant diversity in
Sulawesi’s cacao plantations (Bos et al. 2008); thus, I believe that my results indicate effects
that will be evident over the long term.
Clearly then, it is important to maintain toads and other amphibian populations in
cacao plantations to sustain ecosystem services in the future. Plantation management for leaf
litter cover, and maintenance of intact canopy structure to buffer against temperature
fluctuations, will benefit amphibian diversity (Wanger et al. 2009). This will also facilitate
toad abundance in cacao agroforest and, hence, translate into ant biomass removal. In
contrast, A. gracilipes invasions are facilitated by thinned canopy, which alters microclimatic
conditions in cacao plantations and enhances the frequency of cacao disease outbreaks (Bos et
al. 2008). It is through the beneficial effect for the toads in cacao agroforest that biomass
removal of ants will increase. Managed sensibly, native biodiversity offers great potential to
provide invasion resistance (Carlsson et al. 2009) and likely contributes to sustainable,
pesticide-reduced crop production.

100
Land-use change, tropical biodiversity, and ecosystem services –
Southeast Asian amphibians and reptiles in focus
T.C. Wanger
Chapter 5
PESTICIDES AND TROPICAL BIODIVERSITY
T.C. Wanger1, A. Rauf2, S. Schwarze3
1Environment Institute, University of Adelaide, Adelaide, SA 5005, Australia 2Fakultas Pertanian, Universitas Tadulako, Palu, Indonesia
3Agricultural Economics and Rural Development, University of Göttingen, Göttingen, Germany
Frontiers in Ecology and the Environment – 2010, 4,178-179
101
STATEMENT OF AUTHORSHIP PESTICIDES AND TROPICAL BIODIVERSITY Frontiers in Ecology and the Environment – 2010, 4,178-179 Wanger, T.C. (Candidate) Collected the pesticide information in Indonesia, had the initial idea, wrote the paper, and acted as corresponding author. I hereby certify that the statement of contribution is accurate.
Signed Date 12/11/2010 Rauf, A. Contributed to the general discussion of the manuscript and helped to establish contacts with the relevant institutions to gather pesticide information. I hereby certify that the statement of contribution is accurate and I give permission for the inclusion of the paper in the thesis.
Signed Date 15/11/2010 Schwarze, S. Supervised household surveys, analysed data on pesticide expenditures, and contributed to the general discussion of the manuscript. I hereby certify that the statement of contribution is accurate and I give permission for the inclusion of the paper in the thesis.
Signed Date 12/11/2010

102
Chapter 5 - Pesticides and tropical biodiversity
The UN declared 2010 as the “International Year of Biodiversity” to raise awareness of both
the value of biodiversity for improved human well-being, and human impacts on the world’s
ecosystems (www.cbd.int/2010/welcome/). Besides informing readers about threats to
biodiversity such as climate change and habitat loss, the website provides recommendations
on how various stakeholders and interested parties can help protect biodiversity. Wise
consumption choices – using products obtained through sustainable production – is listed as a
top priority.
Actions such as the “International Year of Biodiversity” and articles about the tropical
biodiversity crisis (Bradshaw et al. 2009) are invaluable for communicating related threats
and addressing potential mitigation. However, the debate has so far largely neglected one
issue that is gaining greater importance in tropical ecosystems – namely, increased pesticide
application. Pesticide expenses in tropical countries with the highest deforestation rates
increased from US$2 million in 1980 to US$73.1 million in 2006 (FAO 2009). Small-scale
farmers in the tropics may be more likely to use pesticides excessively if, for instance,
pesticide prices remain stable or decrease in parallel because producers often sell pesticides
with expired patents at low cost. In Sulawesi (Indonesia) between 2000 and 2006, pesticide
prices remained stable (US$3.30 L–1; Balai Penelitian Teknologi Pertanian Palu, pers. comm.)
but pesticide use increased (US$7.20 to US$9.00 ha–1; n = 279 households; unpublished data).
As a result, pesticides may be applied as often as once every 2 weeks, while application is
recommended by the manufacturer once every 4 months (Fig. 5.1). Such intensified pesticide
use has substantial negative impacts on the early reproductive stages of non-target organisms
(Relyea 2005), and may also counteract the beneficial effects of tree-shaded crop production
that can be of high conservation value for maintaining biodiversity.
In expanding tropical agricultural lands, such as those devoted to cacao, oil palm, or
soy, pesticides are likely to play a key role for “biodiversity friendly” production. In the

103
tropical biodiversity debate, pesticide effects are, however, critically under-represented. To
my knowledge, through an ISI Web of Science search
(http://thomsonreuters.com/products_services/science/science_products/a-z/web_of_science,
performed on 31 March 2010), 36 published studies have investigated pesticide effects on –
mostly invertebrate – tropical biodiversity, and only two such studies have been conducted in
Southeast Asia. The benefits to biodiversity from tree-shaded cacao production are well
known. However, future management recommendations should include results from
experimental studies evaluating the dosage or application threshold of pesticides in tropical
agricultural landscapes, for a more realistic assessment of the biodiversity–pesticide
relationship. Ultimately, farmers should pursue organic crop production to preserve some of
the remaining biodiversity and related ecosystem services. Nevertheless, these efforts must
yield better prices than non-organic production and succumb to stringent control of the
producer so that further cropland expansion is less likely.

104
Figure 5.1 – Pesticide applications in cacao plantations in Sulawesi, Indonesia.

105
Conclusions
In summary, this work shows that land-use change has a profound impact on amphibians and
reptiles, with the former more sensitive and heavily impacted than the latter. If shade and leaf-
litter structure of the plantations are properly maintained, they substantially facilitate
protection of herpetological diversity. However, the increasing use of pesticides poses a
substantial threat beyond structural habitat modification, because non-target organisms are
poisoned outright and killed, and, hence, plantations loose conservation value for biodiversity.
From studies conducted in temperate regions, amphibians, and reptiles to a lesser extent, are
sensitive to pesticide application. It has been shown, for example, that application of the
commonly used pesticide atrazine is a powerful endocrine disruptor (e.g., it de-masculinizes
male frogs) and, hence, it interferes with population structure (Hayes et al. 2010). Glyphosate,
the most commonly used herbicide, has led to substantial mortality in amphibians and is also
known to cause genetic damage in reptiles at higher concentrations (e.g., Relyea 2005;
Sparling et al. 2006).
A recently conducted pilot study in Sulawesi indicated severe negative pesticide
effects on both taxa; even moderate herbicide application of >2.5 l/ha and >0.5 l/ha
substantially depleted richness and dominant species abundance of amphibians and reptiles,
respectively. Experimental trials revealed that amphibians are unable to persist in plantation
habitats if either herbicide or insecticides are applied. The same is true for reptiles, but this
taxon seems to be less sensitive towards insecticides (Wanger et al. in prep). Besides
increasing knowledge of how amphibians and reptiles respond to land-use change, I strongly
recommend the targeting of pesticide effects when structural improvements of agricultural
plantations are assessed. Otherwise, effective preparation of agricultural landscapes for
biodiversity conservation will be very difficult, if not impossible.

106
I also show for the first time that amphibians control invasive ants with effects on native ant
diversity. These predator-prey interactions in Sulawesi’s cacao plantations may potentially
have implications for crop yield. If future research activities can experimentally establish the
link between endemic toads and cacao yield, it provides an even more important argument for
amphibian conservation than this study does. While valuing nature is not without criticism
and can only be part of the conservation puzzle (e.g., Redford and Adams 2009), its use
depends on the region and specific situation. Sulawesi’s unique herpetofauna is of little
interest for smallholder farmers primarily interested in increasing their monthly income from
cacao. If anything is to change in the perception of local people, then biodiversity must have
an obvious (economic) value to them. To date, the main benefit from amphibians to humans
has been in the nature of a genetic resource. For instance, they are used as model organisms in
the laboratory and they provide skin peptides to produce medical products (Smith & Stoskopf
2007). In addition to addressing the effects of pesticide use on amphibians and reptiles, much
more research is needed on the ecosystem services that they provide to humanity.
107
Appendix
Appendix 1 – Acquisition of environmental variables
Distance to forest was evaluated based on recent GIS maps while distance to the nearest water
body (i.e., flowing water body with a width >50 cm) was measured in the field. To evaluate
the percentage of canopy cover, I took five 180º photographs of the canopy using a fisheye
lens on a digital camera (Canon Powershot, 5 megapixels). The camera was set up on a 1.70
m tripod and pointed directly towards the sky. Pictures were then analyzed using the ImageJ
software (http://rsbweb.nih.gov/ij). I determined canopy heterogeneity using the lacunarity
measure of the same pictures using the FracLac plug-in in ImageJ. Percent leaf litter cover
was estimated visually in these five patches by two people independently, and results
compared afterwards; an area was classified as having 0 % leaf litter cover if only the bare
ground was visible – conversely, an area had 100 % leaf litter cover if no ground was visible.
Other percentages were rated between these two extremes. To measure leaf litter thickness,
leaf litter was removed down to the soil from a 10 cm patch within these five areas and the
distance from the soil to the top of the leaf litter measured with a ruler. To estimate shrub
height from these five locations, I used the average height of 10 representative plants. For an
estimate of shrub density I counted the number of plants in a 50 x 50 cm square in corner of
the plot and used the mean of all five locations. I estimated shrub cover as – 0 % shrub cover
means no plants in the locations and only leaf litter and/or bare soil is visible. In contrast, 100
% shrub cover means no leaf litter and bare soil are visible in the locations. Again, other
percentages were rated between these two extremes. For 12 plots, leaf litter and shrub cover
estimates were validated with 180º photographs of the five locations. I only counted stones for
the stone block variable when the diameter was ≥ 50 cm.
Pesticide-use interviews - details
108
Plot owners were asked for the pesticide brand used and the number of pesticide container
caps applied per month per plot. I then asked the owner to show me the original container and
checked (1) the amount of pesticide per cap of the container; (2) the amount of caps / 10 liters
of water as indicated in the manual; and (3) dosage instructions. Based on these values, I
calculated the amount of pesticide applied per plot per year.

109
Appendix 2 – Bayesian model evaluation – a brief overview
Although Bayesian methods are increasingly used in ecology, I feel that many readers may
not be familiar with the interpretation of my results and, therefore, provide a short overview.
The smallest Deviance Information Criterion (DIC) value indicates the model that best (i.e.,
most parsimoniously) approximates reality based on a set of a priori candidate models given
the data to hand and any prior information (Spiegelhalter et al. 2002). Here, I used
uninformative priors due to lack of relevant previous work in this area, such that these
assessments were strictly data based. The ∆DIC is the difference between the DIC values of
the “best” model and the model of interest. Similar to the Akaike Information Criterion (AIC),
a ∆DIC ≤ 2 indicates good support for a model relative to others in the model set (Burnham &
Anderson 2002; McCarthy 2007).
The results of the hierarchical regression are displayed graphically as recommended by Qian
and Shen (2008), because it allows easier assessment of manipulation changes. Points
represent the mean of the posterior distribution (“mean” in this paragraph) while lines are
95% credibility intervals. When evaluating the results of the hierarchical regression, the
difference of the mean and credibility intervals (the interval within which there is a 95%
probability that the true value resides), in relation to zero, is important. The further the mean
is away from zero, the stronger the tendency (trend) of an effect. When credibility intervals do
not overlap zero, a true effect can be confidently assigned. For more details on Bayesian
statistics see for example McCarthy (2007).

110
Appendix 3 – Results of the Bayesian correlation of the randomized original data (Sobs)
and the Bootstrap species richness estimator (Boot)Л.
Amphibians Reptiles
mean Low95%CI Up95%CI mean Low95%CI Up95%CI
Primary forest CorCoef 0.989 0.9316 0.9997 0.5348 -0.4547 0.9617
mSobs 3.699 1.864 5.417 0.8079 0.3682 1.241
mBoot 5.913 2.921 8.697 0.9944 0.5405 1.445
Secondary forest CorCoef 0.7816 0.2066 0.9752 0.9721 0.8608 0.9979
mSobs 3.142 2.162 4.133 4.619 2.874 6.406
mBoot 4.064 3.039 5.096 6.982 4.623 9.392
NS-cacao agroforest CorCoef 0.9836 0.9149 0.9988 0.9131 0.5696 0.9915
mSobs 2.131 1.381 2.86 5.867 3.828 7.847
mBoot 2.908 1.992 3.797 8.085 5.801 10.32
PS-cacao agroforest CorCoef 0.6355 -0.1659 0.9591 0.933 0.5995 0.9969
mSobs 0.7393 0.3959 1.086 4.575 2.427 6.718
mBoot 1.065 0.6382 1.499 7.15 4.095 10.18
Open areas CorCoef 0.5348 -0.4547 0.9617 0.8931 0.2907 0.9981
mSobs 0.8079 0.3682 1.241 2.805 1.489 4.02
mBoot 0.9944 0.5405 1.445 3.92 2.016 5.707
Л Interpretation of the results; high positive values of the correlation coefficient (CorCoef) indicate a
positive correlation between the two variables of interest. To assess the strength of the correlation
between two variables, the overlap of the credibility intervals (Low95%CI and Up95%CI) is of
interest; the higher the overlap of the intervals, the stronger the correlation. NS-cacao agroforest =
natural shaded cacao agroforest; PS-cacao agroforest = planted-shaded cacao agroforest

111
Appendix 4 – Validation of LLT treatment. Removal success of all groups found, based on 24 rice bags.
Reptilia Amphibia Hymenoptera Coleoptera Lepidoptera Myriapoda Arachnida TotalMean removal success [%] 100% 100% 94% 97% 100% 100% 97% 98% SD 0% 0% 6% 6% 0% 0% 8% 2%

112
Appendix 5
Figure A1 – Species richness estimators (Abundance-based Coverage Estimator (ACE),
Incidence-based Coverage Estimator (ICE), Chao 1 estimator (Chao1), Chao 2 estimator
(Chao2), Jacknife 1 estimator (Jack1), Jacknife 2 estimator (Jack2), and Bootstrap estimator
(Boot)) and the randomized original amphibian data (Rand).
0
2
4
6
8
RandACE
0
2
4
6
8
10
12
RandICE
0
1
2
3
4
5
6
7
RandChao1
0
2
4
6
8
RandChao2
Cum
ulat
ive
spec
ies
num
ber
0
2
4
6
8
10
RandJack1
Amphibian transect samples0 50 100 150 200 250 300
0
2
4
6
8
RandBoot
Cum
ulat
ive
spec
ies
num
ber
Cum
ulat
ive
spec
ies
num
ber
Cum
ulat
ive
spec
ies
num
ber
Amphibian transect samples0 50 100 150 200 250 300
0
2
4
6
8
10
RandJack 2
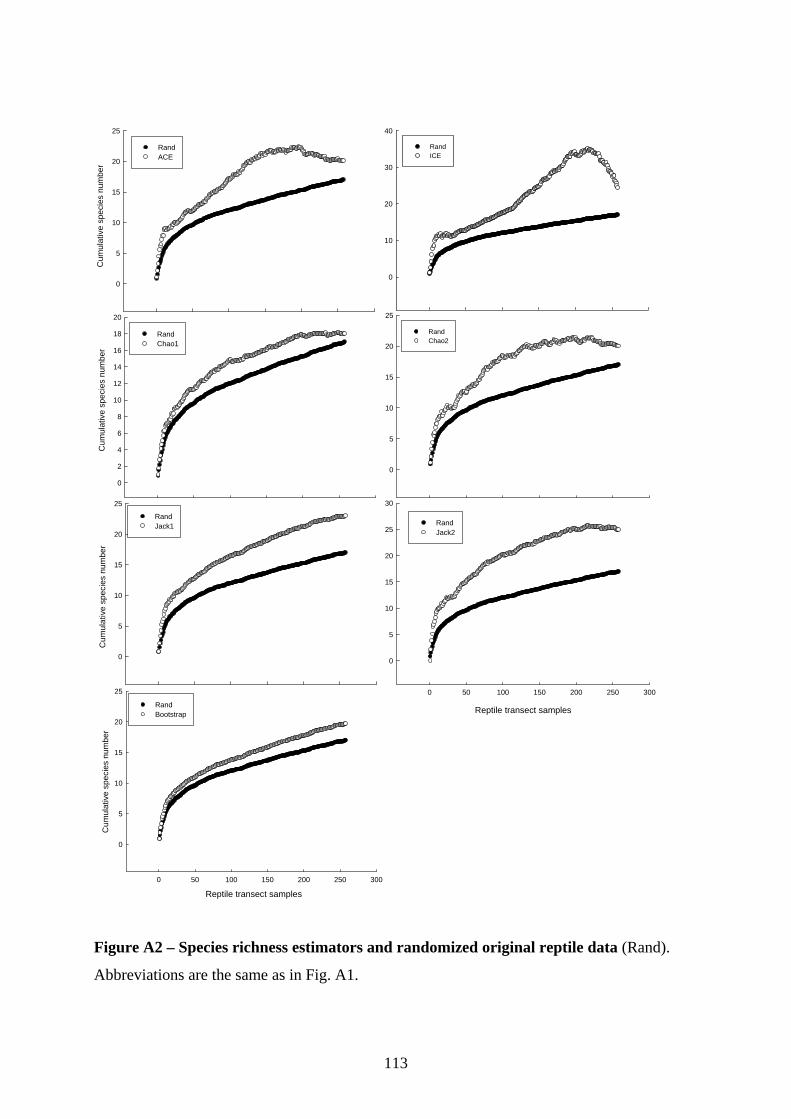
113
0
5
10
15
20
25
RandACE
0
10
20
30
40
RandICE
Sampling Session
0
2
4
6
8
10
12
14
16
18
20
RandChao1
0
5
10
15
20
25
RandChao2
0
5
10
15
20
25
RandJack1
0 50 100 150 200 250 300
Cum
ulat
ive
spec
ies
num
ber
0
5
10
15
20
25
RandBootstrap
Cum
ulat
ive
spec
ies
num
ber
Cum
ulat
ive
spec
ies
num
ber
Cum
ulat
ive
spec
ies
num
ber
Reptile transect samples
0 50 100 150 200 250 300
0
5
10
15
20
25
30
RandJack2
Reptile transect samples
Figure A2 – Species richness estimators and randomized original reptile data (Rand).
Abbreviations are the same as in Fig. A1.

114
Appendix 6
Panel 1 - Bufonidae: A = Duttaphrynus melanostictus; B = Ingerophrynus celebensis
(juvenile); Microhylidae: C = Callulops n. sp.; D = Kaloula baleata; E = Kaloula
pulchra (West Malaysia; Photo by U. Manthey); F = Oreophryne n. sp.1; G =
Oreophryne n. sp.2; Dicroglossidae: Fejervarya cancrivora
NOTE: This image is included on page 114 of the print copy of the thesis held in the University of Adelaide Library.

115
Panel 2 – Dicroglossidae: A = Limnonectes cf. modestus; B = Limnonectes cf.
arathooni; C = Limnonectes cf. heinrichi; D = Fejervarya limnocharis; E = Occidozyga
semipalmata; Ranidae: F = Hylarana celebensis; G = Hylarana erythraea; H =
Hylarana macrops.

116
Panel 3 – Ranidae: A = Hylarana mocquardii; Rhacophoridae: B = Polypedates
leucomystax; C = Rhacophorus sp. (Photo by J.A. McGuire)
NOTE: This image is included on page 116 of the print copy of the thesis held in the University of Adelaide Library.
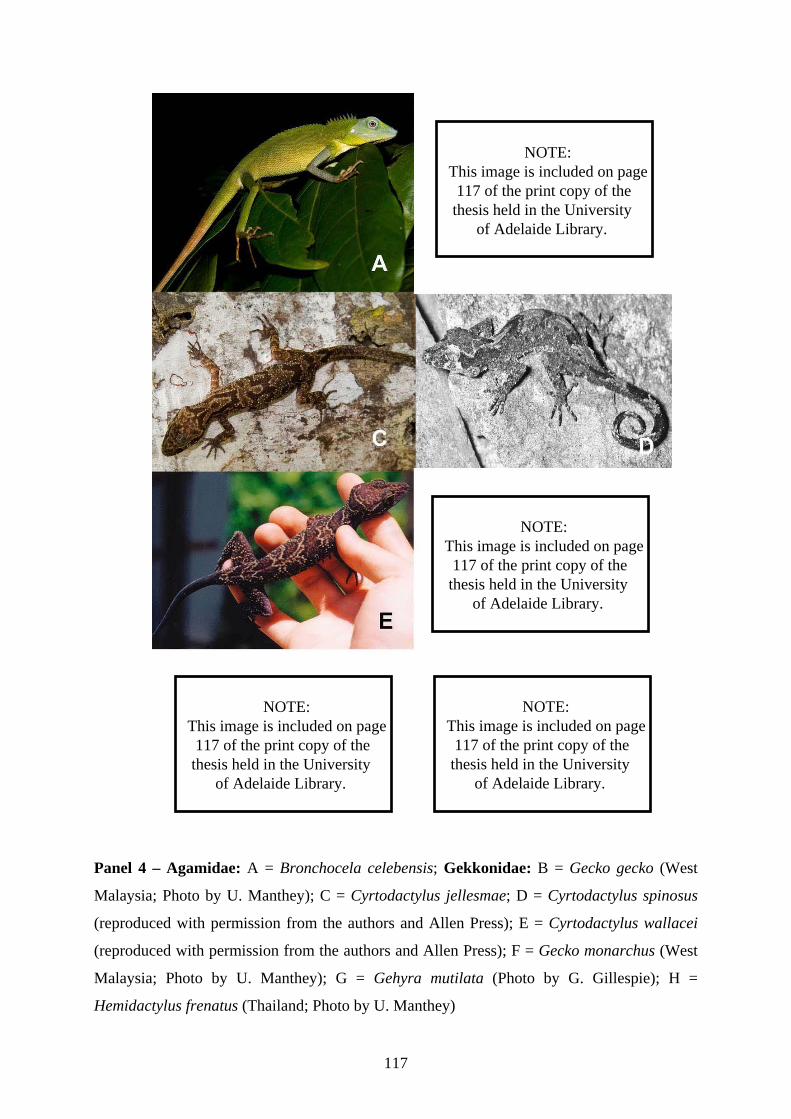
117
Panel 4 – Agamidae: A = Bronchocela celebensis; Gekkonidae: B = Gecko gecko (West
Malaysia; Photo by U. Manthey); C = Cyrtodactylus jellesmae; D = Cyrtodactylus spinosus
(reproduced with permission from the authors and Allen Press); E = Cyrtodactylus wallacei
(reproduced with permission from the authors and Allen Press); F = Gecko monarchus (West
Malaysia; Photo by U. Manthey); G = Gehyra mutilata (Photo by G. Gillespie); H =
Hemidactylus frenatus (Thailand; Photo by U. Manthey)
NOTE: This image is included on page 117 of the print copy of the thesis held in the University of Adelaide Library.
NOTE: This image is included on page 117 of the print copy of the thesis held in the University of Adelaide Library.
NOTE: This image is included on page 117 of the print copy of the thesis held in the University of Adelaide Library.
NOTE: This image is included on page 117 of the print copy of the thesis held in the University of Adelaide Library.
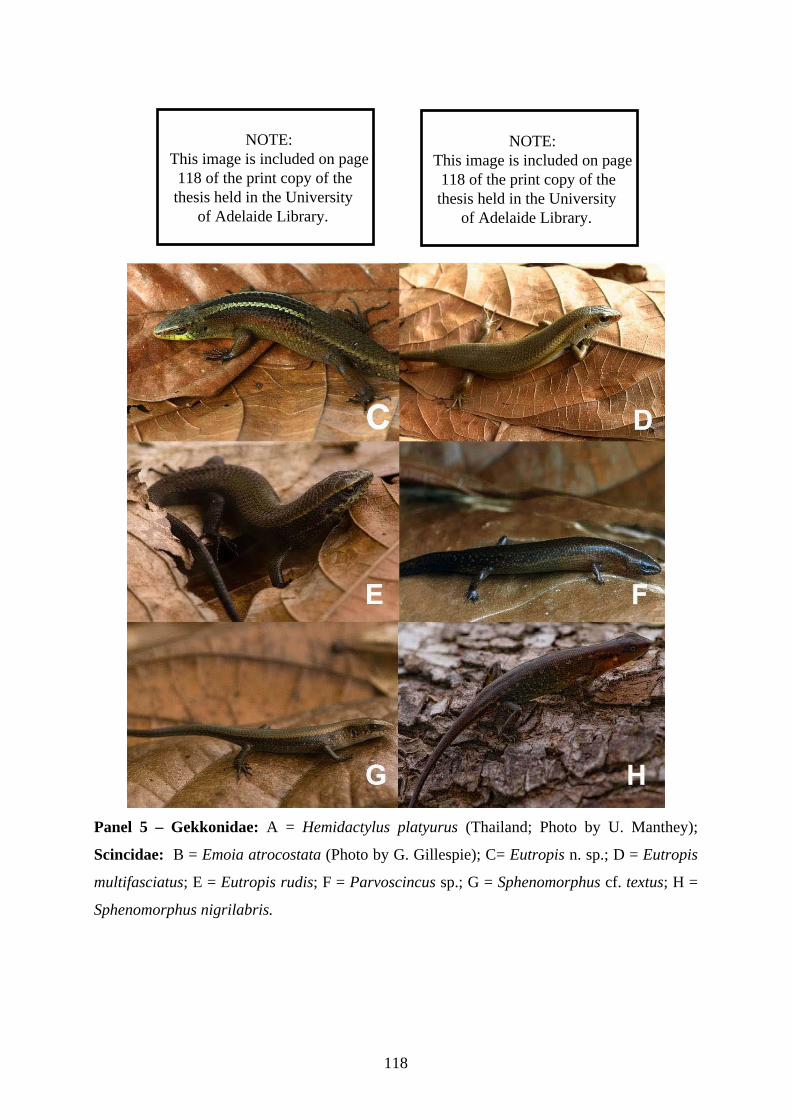
118
Panel 5 – Gekkonidae: A = Hemidactylus platyurus (Thailand; Photo by U. Manthey);
Scincidae: B = Emoia atrocostata (Photo by G. Gillespie); C= Eutropis n. sp.; D = Eutropis
multifasciatus; E = Eutropis rudis; F = Parvoscincus sp.; G = Sphenomorphus cf. textus; H =
Sphenomorphus nigrilabris.
NOTE: This image is included on page 118 of the print copy of the thesis held in the University of Adelaide Library.
NOTE: This image is included on page 118 of the print copy of the thesis held in the University of Adelaide Library.
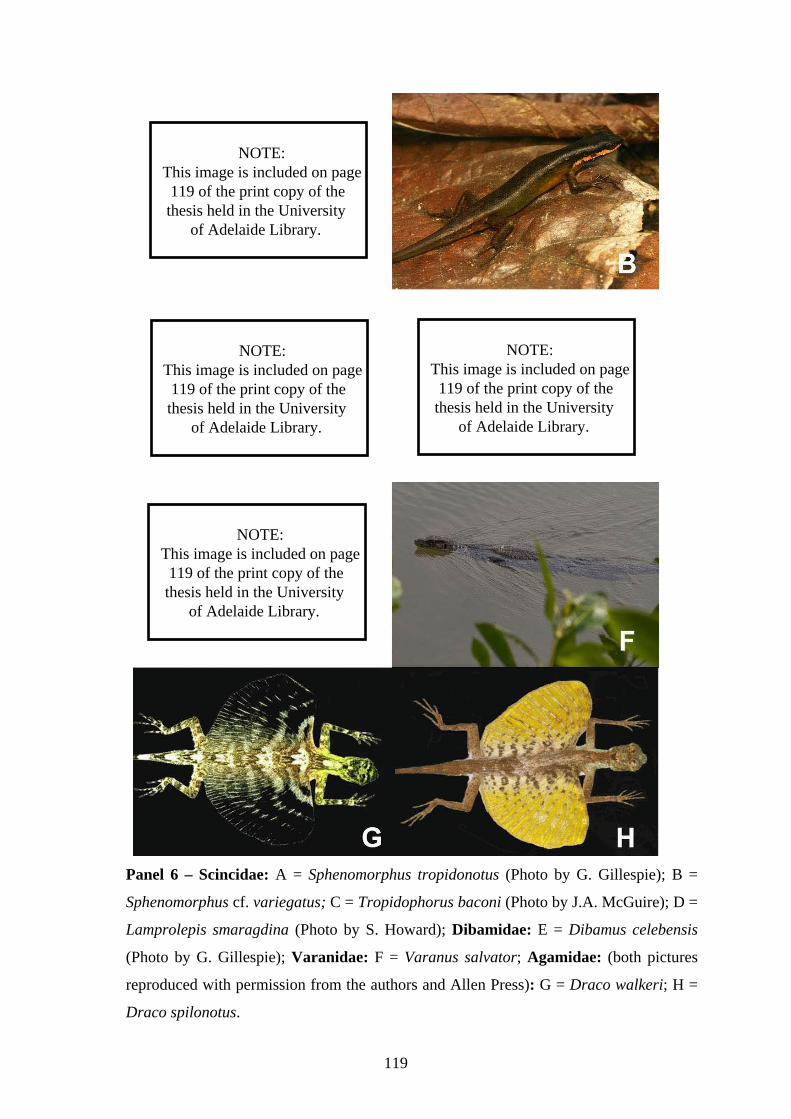
119
Panel 6 – Scincidae: A = Sphenomorphus tropidonotus (Photo by G. Gillespie); B =
Sphenomorphus cf. variegatus; C = Tropidophorus baconi (Photo by J.A. McGuire); D =
Lamprolepis smaragdina (Photo by S. Howard); Dibamidae: E = Dibamus celebensis
(Photo by G. Gillespie); Varanidae: F = Varanus salvator; Agamidae: (both pictures
reproduced with permission from the authors and Allen Press): G = Draco walkeri; H =
Draco spilonotus.
NOTE: This image is included on page 119 of the print copy of the thesis held in the University of Adelaide Library.
NOTE: This image is included on page 119 of the print copy of the thesis held in the University of Adelaide Library.
NOTE: This image is included on page 119 of the print copy of the thesis held in the University of Adelaide Library.
NOTE: This image is included on page 119 of the print copy of the thesis held in the University of Adelaide Library.

120
Appendix 7 – Journal Cover of Journal of Applied Ecology. Chapter 2 was the cover
article of the August 2009 issue.
NOTE: This appendix is included on page 120 of the print copy of the thesis held in the University of Adelaide Library.

121
Appendix 8 – Media features of Chapter 4. Included are the links to various news articles
and the article featured by Science News; ScienceNews, Wired Science, JakartaGlobe,
KeSimpulan (in Bahasa), FinancialTimes (German), Süddeutsche Zeitung (German) ,
FocusOnline (German), Bild (German), Deutschlandfunk (German), n*tv (German), Scinexx
(German), Greenpeace (German).
NOTE: This appendix is included on pages 121-122 of the print copy of the thesis held in the University of Adelaide Library.

123
Appendix 9 – PhD thesis corrections after examination I thank the two examiners for their positive feedback and insightful comments on my thesis. My responses are given below the comments and where necessary they were also included in the thesis. Please note that my thesis is a ‘thesis-by-publication’, and as such I was advised to use the published manuscripts and to only make minor changes on methods (avoid repetition, include supplementary material information where necessary), citations, and general style. The introduction and conclusion section are the only exceptions, because the former had to be more specific than the original paper for the thesis, and the latter is the only unpublished part of the thesis. I include additional references in the reference list below only if they had not been listed in the main thesis document. This document is included with the thesis as Appendix 9.
Thomas C. Wanger, Stanford, 04 May 2011

124
Examiner 1 Introduction
The introduction is based on the published Sodhi et al. 2010 Biological Conservation paper. It is not an exact copy of this paper, because the focus was too broad and I felt it needed to be more focused to blend in with this thesis.
I agree that the wording of the sentence was not clear. The sentence now reads: “Agricultural land use is often focused on few species and local processes, but in dynamic, human-dominated landscapes, species diversity will substantially enhance resilience (i.e. the capacity to re-organize after disturbance)”.
The sentence is changed and now reads: “In a land use change context, we know little about the factors affecting amphibians and reptiles in particular in Southeast Asia. Even less is known about the services that these taxa provide. However, realistic management recommendations for sustainable agricultural landscapes require a good and general knowledge of the effects of land-use changes on biodiversity. Besides other factors, the effects of pesticide use on biodiversity are poorly known but must urgently be evaluated.”
Chapter 1.
The text is not identical with the published paper, because I felt that it was necessary to include parts of the supplementary material of the paper in the methods section (see also initial remarks above).

125
The opening sentence now reads: “Increasing deforestation rates and subsequent land-use change in the tropics will force the surviving tropical biodiversity to reside in human-dominated landscapes such as agricultural areas (Bawa et al. 2004; Foley et al. 2005).”
The sentence was clarified and now reads: “The conservation value of agricultural habitats can be assessed by first comparing diversity-patterns across land-use modification gradients (i.e. open to pristine habitats) (e.g., Barlow et al. 2007) and then examining the factors driving diversity patterns within agricultural habitats (e.g., Clough et al. 2009b).”
As stated on p.15, canopy heterogeneity refers to the patchiness of the canopy (i.e., “many small open patches vs. one large open patch in the canopy”). In the methods section on p.21, I state briefly that “[f]or a measure of canopy heterogeneity, I calculated the lacunarity index [from] all canopy pictures.”
I do agree that it would be more appropriate to refer to degraded primary rather than secondary forest. In order to keep the chapters closer aligned to the published papers I kept using the term secondary forest but rephrased the sentence giving the distinction between primary to secondary forest as follows: “Here, I refer to secondary forest as degraded primary forest, where large trees had been cut in the past and for example rattan, and fire wood was extracted.”
It is difficult to provide areas for the sampled habitats due to severe habitat conversion from primary forest into plantation habitats. The values available from the study area are from 2002 but do not include all sampled habitats: broad-leafed forest – 6103 km2; perennial crops (coffee and cocoa) – 190 km2; grassland – 220.5 km2 (Erasmi and Priess 2007). Because these values are outdated and not available for all habitats, I did not include them in the thesis.
The definition of a water body, as used in the thesis, is that it had to be flowing water and wider than 50 cm. I now mention this also in Appendix 1.

126
This is an important question. This is unfortunately not known, hence the reason why these plots were excluded from an analysis of pesticide effects on vertebrates and invertebrates in Sulawesi in a forthcoming paper. Further discussion with the landowners may shed light on this question.
I did identify species in the field and took pictures of all species in the field laboratory that were sent to the leading expert in the region for confirmation. While I certainly tried my best to get the most accurate identification possible, I do agree that I might have missed cryptic species.
As I briefly state, the reason for not using pitfall traps was that I did not have the resources to maintain a statistical robust pitfall trap setup. On p.67 I also provide more details on which species I likely have missed. In addition, one has to keep in mind that herpetological diversity in Sulawesi is generally lower compared to its neighbouring islands such as Borneo, for example.
While there may be no obvious advantages to use Bayesian correlations to test for matching of observed and estimated measures of species richness, there is justification to use Bayesian methods for other analysis conducted in this study and thesis (model is fitted to the data rather than vice a versa; it is easier and more intuitive to code models and represent uncertainty; ways to present results graphically; as mentioned in the text, the approach used to compare species rank abundance curves is more suitable for small sample sizes). To follow one consistent analytical approach throughout, I decided to use Bayesian analysis for the whole study and thesis, and not to mix up different statistical methods.
See my response to comment 11.). I deleted the statement of the Simpson index.
This sentence interprets the results from the Bayesian modelling. I explain Bayesian Model evaluation (i.e. trend and effect) in Appendix 2.

127
“When evaluating the results of the hierarchical regression, the difference of the mean and credibility intervals (the interval within which there is a 95% probability that the true value resides), in relation to zero, is important. The further the mean is away from zero, the stronger the tendency (trend) of an effect.”
The reason I used the approach for species rank abundance models is: “Using a Bayesian instead of a frequentist generalized linear model (GLM) approach to compare Species-Rank-Abundance curves has the advantages that it is suitable for small sample sizes and more amenable hierarchical data structures (Golicher et al. 2006).” .. And in addition I wanted to try something novel.
Indeed, as mentioned in chapter 3, there are tenth of species awaiting formal description and some species likely have been missed. By not using pitfall traps I likely have missed certain species – with a bias towards more species-rich habitat. This may have caused a bias in the results of beta diversity patterns. In the thesis I write now: “Note, however, that not using pitfall traps may have lead to missing more species in some but not other habitats. Depending on the strength of this effect, it may have biased my estimates of additive diversity.”
Chapter 2
If we agree that biodiversity loss results in loss of ecosystem function/services and resilience of a system against climate change, I think it is a valid claim to make that biodiversity protection will “assist […] poverty alleviation” by affecting crop yield.
Please refer to my answers to the comments about habitat classification and site description in chapter 1.
The sentence now reads: “[..] this double [photo] identification process re-confirmed correct identification.”

128
I wanted to circumvent the selection-problem of one of several appropriate estimators by employing a selection of the most suitable estimators. Evaluation of sampling completeness seems more realistic to a range rather than a fixed estimated value.
It is true that the results of sampling completeness may be biased because the number of species missed due to the sampling method in primary compared to disturbed habitats is likely larger.
As mentioned in the text, pristine forest specialists are not if at all abundant in cacao plantations. Therefore, I agree with you that a lack of pristine forest species may be partially responsible for landscape variables not being a good predictor.
I agree that the original sentence was confusing. It now reads: “Low species richness and abundance paralleled by exceptionally high endemism distinguish Sulawesi from other tropical regions. An additional difference is reflected in the results of my observational modelling where, in contrast to other studies, plantation rather than landscape-environmental factors enhance the value of cacao agroforests for herpetological diversity.”
A pilot study I conducted last year in Sulawesi showed that pesticides, for example, will strongly affect common species. On a broader scale, the review by Gaston and Fuller (2008) points out that even small decline of common species may result in larger losses of ecosystem functions and services. As such, there is definitely a reason for thinking about the protection of common species.
I propose increasing leaf litter depth as a means to enhance the conservation value of cacao plantations for herpetological diversity. I do agree that further economic aspects have to be taken into account before conclusive recommendations can be given.
129
Realistically, however, such an approach will have to be based not only on predictors for one but multiple taxonomic groups and take multiple structural parameters, pesticides, and fertilizer into account that affect yield. Two recent studies did this for my study region in Sulawesi (Tscharntke et al. 2011; Clough et al. 2011).
In Sulawesi’s cacao plantations, it has also been shown that there is no trade off between high biodiversity and high yield but that a combination of both is possible under the right management regimes (Clough et al. 2011). This suggests that investing in suitable management of agroforests may sustain biodiversity and spare natural habitat.
The manipulative approach was a good way to challenge the statistical modelling results. It was not a failure but rather illustrated satisfactorily that translating modelling results into the real world is not straightforward, because there is a lot of temporal and spatial variation.
The modelling and experimental manipulation was done on the same plots but in different time frames. For the modelling approach, however, “snapshots” of the habitat and species were taken at two points in time. In contrast, the manipulative experiment was based on a comparison of sampling sessions over a longer period of time. As such, minimizing variation and detecting actual biological effects rather than statistical artefacts in the manipulative experiment is more difficult.
Chapter 3
As I point out above (point 10, chapter 1), I likely have missed (cryptic, secretive, and fossorial) species.
I agree. Please see my responses to this comment above and the statement given in chapter 3.
There is – rapidly dwindling – forest in pristine condition in the Lore Lindu National Park and other parts of Sulawesi.
Chapter 4
I do agree that there may be a potential bias towards soft-bodied animals in using faeces rather than stomach content for diet analysis. I assume, however, that this is unlikely, because I have more than 600 mins of behavioural video recording from different males in their natural habitats at night (from a different project). In these video recordings, I hardly

130
ever saw the toads feeding on soft-bodied animals, which will be most of the ones I missed.
As mentioned in the methods section, I was interested in the treatment-over-time effect. The first sampling session was used as a reference level against which the subsequent sampling sessions were evaluated (i.e., the estimated effect parameter of the first sampling session was included in calculating the effect parameters for subsequent sampling sessions).
I fully agree!
This is right and the reason is that to my knowledge this is not known. A PhD student in Göttingen is currently working on this topic.
I do agree that it is a critical point. This paper only shows experimentally the link between the toads as opponent of invasive and native ants, which I tried to make clear in Fig. 4.1. It shows the parts of the “toad biocontrol service” that come from experimental work in this study and those that come from the literature and have to be tested explicitly in the future. I do believe, however, that while pointing out the conditions for such a service, it is correct to speculate on indirect human benefits, hence, indirect biocontrol services.
Chapter 5
The comments on the conclusions drawn and future research recommendations are highly relevant. As mentioned in the initial remarks section, this chapter – published as a letter – was not modified. A full review paper on the impacts of pesticides on biodiversity and ecosystem services in the tropics including extensive future research recommendations is under peer-review (Wanger et al. submitted). I found for example that less than 0.1 % of all pertinent pesticide papers deal with tropical vertebrates, highlighting a priority for
131
future research activities. A comparison of pesticide sensitivity of temperate against tropical amphibian and fish species suggests higher susceptibility in tropical amphibians but not fish. Pollination and pest control services in the tropics seem to be substantially imperilled by pesticide usage. Besides ecotoxicological research on a broad spectrum of substances and tropical model organisms, integrated pest management (an ecological approach of controlling pests for most economic benefit with physical, cultural, biological and chemical methods and by reducing side effects) should be the long-term goal for sustainable crop production.
Conclusions
I now provide more details in the criticized sentences. The sentence now reads: “It has been shown, for example, that application of the commonly used pesticide atrazine is a powerful endocrine disruptor (e.g., it de-masculinizes male frogs) and, hence, it interferes with population structure (Hayes et al. 2010). Glyphosate, the most commonly used herbicide, has led to substantial mortality in amphibians and is also known to cause genetic damage in reptiles at higher concentrations (e.g., Relyea 2005; Sparling et al. 2006).” And “[…] even moderate herbicide application of >2.5 l/ha and >0.5 l/ha substantially depleted richness and dominant species abundance of amphibians and reptiles, respectively.”
Besides summarizing the results from the thesis, I put a focus on pesticide impacts on biodiversity in the conclusions. After having written Chapter 5, a review on pesticide impacts on biodiversity and ecosystem services in the tropics (Wanger et al. submitted, mentioned in the Chapter 5 comment above), and a paper on the impacts of pesticides on Sulawesi’s vertebrates and invertebrates (Wanger et al. in preparation), I feel that this area is amongst the most important ones, where we need to focus our research efforts if agricultural habitats are to be made more sustainable for biodiversity.
Please see my response to comment 5.) in chapter 4. In addition, I did rephrase the last part of the conclusion: “I also show for the first time that amphibians control invasive ants with effects on native ant diversity. These predator-prey interactions in Sulawesi’s cacao plantations may potentially have implications for crop yield. If future research activities can experimentally establish the link between endemic toads and cacao yield, it provides an even more important argument for amphibian conservation than this study does. While

132
valuing nature is not without criticism and can only be part of the conservation puzzle (e.g., Redford and Adams 2009), its use depends on the region and specific situation. Sulawesi’s unique herpetofauna is of little interest for smallholder farmers primarily interested in increasing their monthly income from cacao. If anything is to change in the perception of local people, then biodiversity must have an obvious (economic) value to them. To date, the main benefit from amphibians to humans has been in the nature of a genetic resource. For instance, they are used as model organisms in the laboratory and they provide skin peptides to produce medical products (Smith & Stoskopf 2007). In addition to addressing the effects of pesticide use on amphibians and reptiles, much more research is needed on the ecosystem services that they provide to humanity.”
Examiner 2 Note that I extracted the comments from a longer paragraph, commenting – very positively – on the individual chapters. This is why the original comment is not shown here. Chapter 1 Future experiments for leaf litter thickness and canopy variables I agree that it is best to complement correlative evidence with experimental tests. In the second chapter I test how leaf litter thickness will affect diversity patterns in cacao plantation habitat. The reason for not testing the effects of canopy variables and leaf litter thickness on amphibian and reptile diversity along the land use gradient was simply that it was logistically not feasible to manipulate these (e.g. accessibility of the plots) and sample size per habitat group was not large enough for a full-factorial design. Pesticide results not in the model This is a valid point. The pesticide data was not included in the modelling for two reasons. First, the paper should focus only on the structural adjustments required to make cacao plantations more sustainable, because pesticide use intensified only after I first started my field experiments around the Toro village in Sulawesi (the study region). I then wanted to write an additional manuscript (which is currently in preparation) that also includes experiments to specifically show effects of common pesticides on amphibians and reptiles to present the whole picture. Leaf litter effects on other organism groups A recent study (Clough et al. 2011) investigated environmental correlates of various species groups including plants, fungi, vertebrates as well as invertebrates in Sulawesi’s cacao agroforests. It was found that a thick leaf-litter stratum was a predictor of amphibian, reptile, and endemic bird species richness but there was no negative relationship with thinner leaf litter cover and species richness of any other taxonomic group. Chapter 4 Which sugars are used for attracting ants (ref needed)

133
For ant sampling I used saccharose (common table sugar), which is a disaccharide. Saccharose is readily availably and the applied sampling technique with this sugar has been shown to be successful in previous ant studies in Sulawesi. The method is explained in detail in the cited study by Wielgoss et al. (2010). Clarify future research needs Given that parts of this study are based on evidence from the literature and not shown yet in an experimental approach, I do agree that more research on amphibian pest control services is needed. Further comments on this point are made in response to the other referee’s queries. References Y. Clough, Barkmann, J., Juhrbandt, J., Kessler, M., Wanger, T.C., et al. (2011): Combining
high biodiversity with high yields in tropical agroforests. Proceedings of the National Academy of Science USA. In press.
S. Erasmi, Priess, J. (2007): Satellite and survey data: a multiple source approach to study
regional land cover / land use change in Indonesia. In: Dickmann, F. (Ed.): Geovisualisierung in der Humangeographie. Kartographische Schriften13: 101-114, Kirschbaum Verlag, Bonn.
T. Tscharntke, Clough Y., Bhagwat S., Buchori D., Faust H., et al. (2011): Multifunctional
shade-tree management in tropical agroforestry landscapes – a review. Journal of Applied Ecology. 48, 619–629. doi: 10.1111/j.1365-2664.2010.01939.x
T.C. Wanger, Tscharntke, T., Sodhi, N.S. (submitted to Nature): The tropical pesticide trade-
off.

134
Bibliography
Abbott K.L. (2005). Supercolonies of the invasive yellow crazy ant, Anoplolepis gracilipes,
on an oceanic island: forager activity patterns, density and biomass. Insectes Sociaux,
52, 266-273.
Alcala E.L., Alcala A.C. & Dolino C.N. (2004). Amphibians and reptiles in tropical rainforest
fragments on Negros Island, the Philippines. Environmental Conservation, 31, 254-
261.
Aratrakorn S., Thunhikorn S. & Donald P.F. (2006). Changes in bird communities following
conversion of lowland forest to oil palm and rubber plantations in southern Thailand.
Bird Conservation International, 16, 71-82.
Barlow J., Gardner T.A., Araujo I.S., Avila-Pires T.C., Bonaldo A.B., Costa J.E., Esposito
M.C., Ferreira L.V., Hawes J., Hernandez M.M., Hoogmoed M.S., Leite R.N., Lo-
Man-Hung N.F., Malcolm J.R., Martins M.B., Mestre L.A.M., Miranda-Santos R.,
Nunes-Gutjahr A.L., Overal W.L., Parry L., Peters S.L., Ribeiro-Junior M.A., da Silva
M.N.F., Motta C.D. & Peres C.A. (2007). Quantifying the biodiversity value of
tropical primary, secondary, and plantation forests. Proceedings of the National
Academy of Sciences of the United States of America, 104, 18555-18560.
Bawa K.S., Kress W.J., Nadkarni N.M., Lele S., Raven P.H., Janzen D.H., Lugo A.E., Ashton
P.S. & Lovejoy T.E. (2004). Tropical ecosystems into the 21st century. Science, 306,
227-228.
Borkhataria R.R., Collazo J.A. & Groom M.J. (2006). Additive effects of vertebrate predators
on insects in a Puerto Rican coffee plantation. Ecological Applications, 16, 696-703.
Bos M.M., Steffan-Dewenter I. & Tscharntke T. (2007). The contribution of cacao agroforests
to the conservation of lower canopy ant and beetle diversity in Indonesia. Biodiversity
and Conservation, 16, 2429-2444.

135
Bos M.M., Tylianakis J.M., Steffan-Dewenter I. & Tscharntke T. (2008). The invasive
Yellow Crazy Ant and the decline of forest ant diversity in Indonesian cacao
agroforests. Biological Invasions, 10, 1399-1409.
Bowman D., Woinarski J.C.Z., Sands D.P.A., Wells A. & McShane V.J. (1990). Slash-and-
burn agriculture in the wet coastal lowlands of Papua-New-Guinea - response of birds,
butterflies, and reptiles. Journal of Biogeography, 17, 227-239.
Bradshaw C.J.A., Sodhi N.S. & Brook B.W. (2009). Tropical turmoil: a biodiversity tragedy
in progress. Frontiers in Ecology and the Environment, 7, 79-87.
Brook B.W., Sodhi N.S. & Ng P.K.L. (2003). Catastrophic extinctions follow deforestation in
Singapore. Nature, 424, 420-426.
Brooks T.M., Mittermeier R.A., da Fonseca G.A.B., Gerlach J., Hoffmann M., Lamoreux J.F.,
Mittermeier C.G., Pilgrim J.D. & Rodrigues A.S.L. (2006). Global biodiversity
conservation priorities. Science, 313, 58-61.
Bruno J.F., Stachowicz J.J. & Bertness M.D. (2003). Inclusion of facilitation into ecological
theory. Trends in Ecology & Evolution, 18, 119-125.
Burnham K.P. & Anderson D.R. (2002). Model selection and multimodel inference: a
practical information-theoretic approach. 2nd Edition. In. Springer-Verlag New York.
Cardillo M., Mace G.M., Gittleman J.L. & Purvis A. (2006). Latent extinction risk and the
future battlegrounds of mammal conservation. Proceedings of the National Academy
of Sciences of the United States of America, 103, 4157-4161.
Carlsson N.O.L., Sarnelle O. & Strayer D.L. (2009). Native predators and exotic prey - an
acquired taste? Frontiers in Ecology and the Environment, 7, 525-532.
Castelletta M., Sodhi N.S. & Subaraj R. (2000). Heavy extinctions of forest avifauna in
Singapore: lessons for biodiversity conservation in Southeast Asia. Conservation
Biology, 14, 1870-1880.

136
Chazdon R.L., Harvey C.A., Komar O., Griffith D.M., Ferguson B.G., Martinez-Ramos M.,
Morales H., Nigh R., Soto-Pinto L., van Breugel M. & Philpott S.M. (2009). Beyond
reserves: a research agenda for conserving biodiversity in human-modified tropical
landscapes. Biotropica, 41, 142-153.
Chivian E. & Bernstein A. (2008). Sustaining Life: How Human Health Depends on
Biodiversity. Oxford University Press, New York.
Clarke R.D. (1974). Food habits of toads, genus Bufo (Amphibia, Bufonidae). American
Midland Naturalist, 91, 140-147.
Cleary D.F.R., Boyle T.J.B., Setyawati T., Anggraeni C.D., Loon E.E.V. & Menken S.B.J.
(2007). Bird species and traits associated with logged and unlogged forest in Borneo.
Ecological Applications, 17, 1184-1197.
Clough Y., Abrahamczyk S., Adams M.-O., Anshary A., Ariyanti N., Betz L., Buchori D.,
Cicuzza D., Darras K., Putra D.D., Fiala B., Gradstein S.R., Kessler M., Klein A.-M.,
Pitopang R., Sahari B., Scherber C., Schulze C.H., Shahabuddin, Sporn S., Stenchly
K., Tjitrosoedirdjo S.S., Wanger T.C., Weist M., Wielgoss A. & Tscharntke T. (2010).
Biodiversity patterns and trophic interactions in human-dominated tropical landscapes
in Sulawesi (Indonesia): plants, arthropods and vertebrates. Tropical Rainforests and
Agroforests under Global Change: Ecological and Socio-economic Valuations, 15-71.
Clough Y., Faust H. & Tscharntke T. (2009a). Cacao boom and bust: sustainability of
agroforests and opportunities for biodiversity conservation. Conservation Letters, 2,
197-205.
Clough Y., Holzschuh A., Gabriel D., Purtauf T., Kleijn D., Kruess A., Steffan-Dewenter I. &
Tscharntke T. (2007). Alpha and beta diversity of arthropods and plants in organically
and conventionally managed wheat fields. Journal of Applied Ecology, 44, 804-812.

137
Clough Y., Putra D.D., Pitopang R. & Tscharntke T. (2009b). Local and landscape factors
determine functional bird diversity in Indonesian cacao agroforestry. Biological
Conservation, 142, 1032-1041.
Colwell R.K. & Coddington J.A. (1994). Estimating terrestrial biodiversity through
extrapolation. Philosophical Transactions of the Royal Society of London Series B-
Biological Sciences, 345, 101-118.
Cruz-Angon A., Sillett T.S. & Greenberg R. (2008). An experimental study of habitat
selection by birds in a coffee plantation. Ecology, 89, 921-927.
Danielsen F., Beukema H., Burgess N.D., Parish F., Bruhl C.A., Donald P.F., Murdiyarso D.,
Phalan B., Reijnders L., Struebig M. & Fitzherbert E.B. (2009). Biofuel plantations on
forested lands: double jeopardy for biodiversity and climate. Conservation Biology,
23, 348-358.
Davis A.J., Holloway J.D., Huijbregts H., Krikken J., Kirk-Spriggs A.H. & Sutton S.L.
(2001). Dung beetles as indicators of change in the forests of northern Borneo. Journal
of Applied Ecology, 38, 593-616.
de Lang R. & Vogel G. (2005). The Snakes of Sulawesi: a Field Guide to the Land Snakes of
Sulawesi with Identification Keys. Edition Chimaira, Frankfurt.
De Rooij N. (1915). The Reptiles of the Indo-Australian Archipelago - Vol. 1. E.J. Brill,
Leiden.
De Rooij N. (1917). The Reptiles of the Indo-Australian Archipelago - Vol. 2. E.J. Brill,
Leiden.
Dirzo R. & Raven P.H. (2003). Global state of biodiversity and loss. Annual Review of
Environment and Resources, 28, 137-167.
Dumbrell A.J., Clark E.J., Frost G.A., Randell T.E., Pitchford J.W. & Hill J.K. (2008).
Changes in species diversity following habitat disturbance are dependent on spatial
scale: theoretical and empirical evidence. Journal of Applied Ecology, 45, 1531-1539.
138
Dunham A.E. & Mikheyev A.S. (2010). Influence of an invasive ant on grazing and detrital
communities and nutrient fluxes in a tropical forest. Diversity and Distributions, 16,
33-42.
Dunn R.R. (2005). Modern insect extinctions, the neglected majority. Conservation Biology,
19, 1030-1036.
Eltz T., Bruhl C.A., van der Kaars S. & Linsenmair K.E. (2002). Determinants of stingless
bee nest density in lowland dipterocarp forests of Sabah, Malaysia. Oecologia, 131,
27-34.
FAO (2009). FAOSTAT. URL
http://faostat.fao.org/site/423/DesktopDefault.aspx?PageID=423#ancor
Faria D., Paciencia M.L.B., Dixo M., Laps R.R. & Baumgarten J. (2007). Ferns, frogs,
lizards, birds and bats in forest fragments and shade cacao plantations in two
contrasting landscapes in the Atlantic forest, Brazil. Biodiversity and Conservation,
16, 2335-2357.
Feare C. (1999). Ants take over from rats on Bird Island, Seychelles. Bird Conservation
International, 9, 94-95.
Fink R.D., Lindell C.A., Morrison E.B., Zahawi R.A. & Holl K.D. (2009). Patch size and tree
species influence the number and duration of bird visits in forest restoration plots in
Southern Costa Rica. Restoration Ecology, 17, 479-486.
Fitzherbert E.B., Struebig M.J., Morel A., Danielsen F., Bruhl C.A., Donald P.F. & Phalan B.
(2008). How will oil palm expansion affect biodiversity? Trends in Ecology &
Evolution, 23, 538-545.
Foley J.A., DeFries R., Asner G.P., Barford C., Bonan G., Carpenter S.R., Chapin F.S., Coe
M.T., Daily G.C., Gibbs H.K., Helkowski J.H., Holloway T., Howard E.A., Kucharik
C.J., Monfreda C., Patz J.A., Prentice I.C., Ramankutty N. & Snyder P.K. (2005).
Global consequences of land use. Science, 309, 570-574.

139
Fritz G., Rand A.S. & Depamphilis C.W. (1981). The aposematically colored frog,
Dendrobates pumilio, is distasteful to the large, predatory ant, Paraponera clavata.
Biotropica, 13, 158-159.
Frost D.R. (2009). Amphibian Species of the World: An Online Reference. Version 5.4. In.
American Museum of Natural History, New York, USA.
Gardner T.A., Barlow J., Chazdon R., Ewers R.M., Harvey C.A., Peres C.A. & Sodhi N.S.
(2009). Prospects for tropical forest biodiversity in a human-modified world. Ecology
Letters, 12, 561-582.
Gardner T.A., Barlow J. & Peres C.A. (2007). Paradox, presumption and pitfalls in
conservation biology: The importance of habitat change for amphibians and reptiles.
Biological Conservation, 138, 166-179.
Garnett S.T. & Brook B.W. (2007). Modelling to forestall extinction of Australian tropical
birds. Journal of Ornithology, 148, S311-S320.
Gaston K.J. & Fuller R.A. (2008). Commonness, population depletion and conservation
biology. Trends in Ecology & Evolution, 23, 14-19.
Gelman A. & Hill J. (2006). Data Analysis Using Regression and Multilevel/Hierarchical
Models. Cambridge University Press, Cambridge.
Gibbons J.W., Scott D.E., Ryan T.J., Buhlmann K.A., Tuberville T.D., Metts B.S., Greene
J.L., Mills T., Leiden Y., Poppy S. & Winne C.T. (2000). The global decline of
reptiles, déjà vu amphibians. Bioscience, 50, 653-666.
Gillespie G., Howard S., Lockie D., Scroggie M. & Boeadi (2005). Herpetofaunal richness
and community structure of offshore islands of Sulawesi, Indonesia. Biotropica, 37,
279-290.
GISD (2007). Global Invasive Species Database. In. Global Invasive Species Database.

140
Golicher D.J., O'Hara R.B., Ruiz-Montoya L. & Cayuela L. (2006). Lifting a veil on diversity:
a Bayesian approach to fitting relative-abundance models. Ecological Applications,
16, 202-212.
Greenberg R., Perfecto I. & Philpott S.M. (2008). Agroforests as model systems for tropical
ecology. Ecology, 89, 913-914.
Hamer K.C. & Hill J.K. (2000). Scale-dependent effects of habitat disturbance on species
richness in tropical forests. Conservation Biology, 14, 1435-1440.
Hayden C.J., Brown R.M., Gillespie G., Setiad M.I., Linkem C.W., Iskandar D.T., Umilaela,
Bickford D.P., Ritanto A., Mumpuni & McGuibe J.A. (2008). A new species of bent-
toed gecko Cyrtodactylus Gray, 1827, (Squamata : Gekkonidae) from the island of
Sulawesi, Indonesia. Herpetologica, 64, 109-120.
Hayes T.B., Khoury V., Narayan A., Nazir M., Park A., Brown T., Adame L., Chan E.,
Buchholz D., Stueve T. & Gallipeau S. (2010). Atrazine induces complete
feminization and chemical castration in male African clawed frogs (Xenopus laevis).
Proceedings of the National Academy of Sciences of the United States of America,
107, 4612-4617.
Hewitt J.E., Thrush S.F., Dayton P.K. & Bonsdorff E. (2007). The effect of spatial and
temporal heterogeneity on the design and analysis of empirical studies of scale-
dependent systems. American Naturalist, 169, 398-408.
Heyer W.R., Donnelly M.A., McDiarmid R.W., Hayek L.C. & Foster M.S. (1994). Measuring
and Monitoring Biological Diversity: Standard Methods for Amphibians. Smithsonian
Institution Press.
Hikida T., Riyanto A. & Ota H. (2003). A new water skink of the genus Tropidophorus
(Lacertilia: Scincidae) from Sulawesi, Indonesia. Current Herpetology, 22, 29-36.
141
Hoehn P., Tscharntke T., Tylianakis J.M. & Steffan-Dewenter I. (2008). Functional group
diversity of bee pollinators increases crop yield. Proceedings of the Royal Society B-
Biological Sciences, 275, 2283-2291.
Holloway J.D., Kirkspriggs A.H. & Khen C.V. (1992). The response of some rain-forest
insect groups to logging and conversion to plantations. Philosophical Transactions of
the Royal Society of London Series B-Biological Sciences, 335, 425-436.
Holway D.A., Lach L., Suarez A.V., Tsutsui N.D. & Case T.J. (2002). The causes and
consequences of ant invasions. Annual Review of Ecology and Systematics, 33, 181-
233.
Hooper D.U., Chapin F.S., Ewel J.J., Hector A., Inchausti P., Lavorel S., Lawton J.H., Lodge
D.M., Loreau M., Naeem S., Schmid B., Setala H., Symstad A.J., Vandermeer J. &
Wardle D.A. (2005). Effects of biodiversity on ecosystem functioning: a consensus of
current knowledge. Ecological Monographs, 75, 3-35.
Howard S.D., Gillespie G.R., Riyanto A. & Iskandar D.T. (2007). A new species of large
Eutropis (Scincidae) from Sulawesi, Indonesia. Journal of Herpetology, 41, 604-610.
Huey R.B., Deutsch C.A., Tewksbury J.J., Vitt L.J., Hertz P.E., Álvarez Pérez H.J. & Garland
T. (2009). Why tropical forest lizards are vulnerable to climate warming. Proceedings
of the Royal Society B: Biological Sciences, 276, 1939-1948.
ICCO (2008). Production of cocoa beans. In: Quarterly Bulletin of Cocoa Statistics.
Inger R.F. (1980). Relative abundance of frogs and lizards in forests of Southeast-Asia.
Biotropica, 12, 14-22.
Inger R.F. & Colwell R.K. (1977). Organization of continguous communities of amphibians
and reptiles in Thailand. Ecological Monographs, 47, 229-253.
Iskandar D.T. & Tjan K.N. (1996). The amphibians and reptiles of Sulawesi, with notes on
the distribution and chromosomal number of frogs. In: Proceedings of the First
International Conference on Eastern Indonesian-Australian Vertebrate Fauna (eds.
142
Kitchener DJ & Suyanto A). Australia Western Australian Museum for lembaga Ilmu
Penetahuan Indonesia Perth, Western Australia, pp. 39-46.
IUCN (2009). IUCN Red List of Threatened Species. Version 2009.2. In.
Ives I.E., Platt S.G., Tasirin J.S., Hunowu I., Siwu S. & Rainwater T.R. (2008). Field surveys,
natural history observations, and comments on the exploitation and conservation of
Indotestudo forstenii, Leucocephalon yuwonoi, and Cuora amboillensis in Sulawesi,
Indonesia. Chelonian Conservation and Biology, 7, 240-248.
Johns A.G. (1996). Bird population persistence in Sabahan logging concessions. Biological
Conservation, 75, 3-10.
Juhrbandt J., Duwe T., Barkmann J., Gerold G. & Marggraf R. (2010). Structure and
management of cocoa agroforestry systems in Central Sulawesi across an
intensification gradient. Tropical Rainforests and Agroforests under Global Change:
Ecological and Socio-economic Valuations, 115-140.
Kenis M., Auger-Rozenberg M.-A., Roques A., Timms L., Péré C., Cock M., Settele J.,
Augustin S. & Lopez-Vaamonde C. (2009). Ecological effects of invasive alien
insects. Biological Invasions, 11, 21-45.
King D.I., Hernandez-Mayorga M.D., Trubey R., Raudales R. & Rappole J.H. (2007). An
evaluation of the contribution of cultivated allspice (Pimenta dioca) to vertebrate
biodiversity conservation in Nicaragua. Biodiversity and Conservation, 16, 1299-1320.
Kinnaird M.F. & O'Brien T.G. (1998). Ecological effects of wildfire on lowland rainforest in
Sumatra. Conservation Biology, 12, 954-956.
Kinnaird M.F., Sanderson E.W., O'Brien T.G., Wibisono H.T. & Woolmer G. (2003).
Deforestation trends in a tropical landscape and implications for endangered large
mammals. Conservation Biology, 17, 245-257.

143
Kitzes J., Wackernagel M., Loh J., Peller A., Goldfinger S., Cheng D. & Tea K. (2008).
Shrink and share: humanity's present and future Ecological Footprint. Philosophical
Transactions of the Royal Society B-Biological Sciences, 363, 467-475.
Klein A.M., Steffan-Dewenter I. & Tscharntke T. (2003a). Fruit set of highland coffee
increases with the diversity of pollinating bees. Proceedings of the Royal Society of
London Series B-Biological Sciences, 270, 955-961.
Klein A.M., Steffan-Dewenter I. & Tscharntke T. (2003b). Pollination of Coffea canephora in
relation to local and regional agroforestry management. Journal of Applied Ecology,
40, 837-845.
Koch A., Ives I., Arida E. & Iskandar D.T. (2008). On the occurrence of the Asiatic softshell
turtle, Amyda cartilaginea (Boddaert, 1770), on Sulawesi, Indonesia. Hamadryad, 32,
121-127.
Koh L.P. (2007). Impending disaster or sliver of hope for Southeast Asian forests? The devil
may lie in the details. Biodiversity and Conservation, 16, 3935-3938.
Koh L.P. (2008). Can oil palm plantations be made more hospitable for forest butterflies and
birds? Journal of Applied Ecology, 45, 1002-1009.
Koh L.P. & Gardner T.A. (2010). Conservation in human-modified landscapes. Conservation
biology for all., 236-261.
Koh L.P. & Wilcove D.S. (2008). Is oil palm agriculture really destroying tropical
biodiversity? Conservation Letters, 1, 60-64.
Laidlaw R.K. (2000). Effects of habitat disturbance and protected areas on mammals of
peninsular Malaysia. Conservation Biology, 14, 1639-1648.
Lambert F.R. (1992). The consequences of selective logging for Bornean lowland forest birds.
Philosophical Transactions of the Royal Society of London Series B-Biological
Sciences, 335, 443-457.

144
Lambert F.R. & Collar N.J. (2002). The future for Sundaic lowland forest birds: long-term
effects of commercial logging and fragmentation. Forktail, 18, 127-146.
Langkilde T. & Shine R. (2004). Competing for crevices: interspecific conflict influences
retreat-site selection in montane lizards. Oecologia, 140, 684-691.
Lee T.M. & Jetz W. (2008). Future battlegrounds for conservation under global change.
Proceedings of the Royal Society B-Biological Sciences, 275, 1261-1270.
Linkem C.W., McGuire J.A., Hayden C.J., Setiadi M.I., Bickford D.P. & Brown R.M. (2008).
A new species of bent-toe gecko (Gekkonidae : Cyrtodactylus) from Sulawesi Island,
Eastern Indonesia. Herpetologica, 64, 224-234.
Liow L.H., Sodhi N.S. & Elmqvist T. (2001). Bee diversity along a disturbance gradient in
tropical lowland forests of south-east Asia. Journal of Applied Ecology, 38, 180-192.
Luiselli L. (2006). Resource partitioning and interspecific competition in snakes: the search
for general geographical and guild patterns. Oikos, 114, 193-211.
Luja V.H., Herrando-Perez S., Gonzalez-Solis D. & Luiselli L. (2008). Secondary rain forests
are not havens for reptile species in tropical Mexico. Biotropica, 40, 747-757.
Magurran A.E. (2004). Measuring Biological Diversity. Wiley-Blackwell, Oxford, UK.
Manthey U. & Grossmann W. (1997). Amphibien und Reptilien Südostasiens. Natur und Tier
Verlag, Münster.
McCarthy M. (2007). Bayesian Methods for Ecology. Cambridge University Press,
Cambridge, UK.
McDiarmid R.W., Campbell J.A. & Toure T.S.A. (1999). Snake Species of the World: a
Taxonomic and Geographic Reference. Vol. 1, i-xi, 1-511.
McGuire J.A., Brown R.M., Mumpuni, Riyanto A. & Andayani N. (2007). The flying lizards
of the Draco lineatus group (Squamata : Iguania : Agamidae): A taxonomic revision
with descriptions of two new species. Herpetological Monographs, 179-212.
McKay J.L. (2006). A Field Guide to the Amphibians and Reptiles of Bali. Malabar, Florida.

145
McNatty A., Abbott K. & Lester P. (2009). Invasive ants compete with and modify the trophic
ecology of hermit crabs on tropical islands. Oecologia, 160, 187-194.
MEA (2005). Millennium ecosystem assessment. Ecosystems and human well-being:
Biodiversity synthesis. (2005) World Resources Institute, Washington, DC. Ecological
Management & Restoration, 6, 226-227.
Myers N., Mittermeier R.A., Mittermeier C.G., da Fonseca G.A.B. & Kent J. (2000).
Biodiversity hotspots for conservation priorities. Nature, 403, 853-858.
O'Dowd D.J., Green P.T. & Lake P.S. (2003). Invasional 'meltdown' on an oceanic island.
Ecology Letters, 6, 812-817.
Peh K.S.H., de Jong J., Sodhi N.S., Lim S.L.H. & Yap C.A.M. (2005). Lowland rainforest
avifauna and human disturbance: persistence of primary forest birds in selectively
logged forests and mixed-rural habitats of southern Peninsular Malaysia. Biological
Conservation, 123, 489-505.
Peres C.A., Gardner T.A., Barlow J., Zuanon J., Michalski F., Lees A.C., Vieira I.C.G.,
Moreira F.M.S. & Feeley K.J. (2010). Biodiversity conservation in human-modified
Amazonian forest landscapes. Biological Conservation, 143, 2314-2327.
Perfecto I., Armbrecht I., Philpott S.M., Soto-Pinto L. & Dietsch T.V. (2007). Shaded coffee
and the stability of rainforest margins in northern Latin America. Stability of Tropical
Rainforest Margins: Linking Ecological, Economic and Social Constraints of Land
Use and Conservation, 227-263.
Perfecto I. & Vandermeer J. (2008). Biodiversity conservation in tropical agroecosystems - A
new conservation paradigm. Year in Ecology and Conservation Biology 2008, 1134,
173-200.
Perkebunan D.J. (2008). Statistik Perkebunan Indonesia 2006-2008. In: (ed. Perkebunan
DPDJ) Jakarta.

146
Philpott S.M., Arendt W.J., Armbrecht I., Bichier P., Dietch T.V., Gordon C., Greenberg R.,
Perfecto I., Reynoso-Santos R., Soto-Pinto L., Tejeda-Cruz C., Williams-Linera G.,
Valenzuela J. & Zolotoff J.M. (2008). Biodiversity loss in Latin American coffee
landscapes: review of the evidence on ants, birds, and trees. Conservation Biology, 22,
1093-1105.
Philpott S.M. & Armbrecht I. (2006). Biodiversity in tropical agroforests and the ecological
role of ants and ant diversity in predatory function. Ecological Entomology, 31, 369-
377.
Pineda E. & Halffter G. (2004). Species diversity and habitat fragmentation: frogs in a
tropical montane landscape in Mexico. Biological Conservation, 117, 499-508.
Pineda E., Moreno C., Escobar F. & Halffter G. (2005). Frog, bat, and dung beetle diversity in
the cloud forest and coffee agroecosystems of Veracruz, Mexico. Conservation
Biology, 19, 400-410.
Posa M.R.C. & Sodhi N.S. (2006). Effects of anthropogenic land use on forest birds and
butterflies in Subic Bay, Philippines. Biological Conservation, 129, 256-270.
Pounds J.A., Bustamante M.R., Coloma L.A., Consuegra J.A., Fogden M.P.L., Foster P.N.,
La Marca E., Masters K.L., Merino-Viteri A., Puschendorf R., Ron S.R., Sanchez-
Azofeifa G.A., Still C.J. & Young B.E. (2006). Widespread amphibian extinctions
from epidemic disease driven by global warming. Nature, 439, 161-167.
Qian S. & Shen Z. (2008). Ecological applications of multilevel analysis of variance. Ecology,
88, 2489-2495.
Redford K.H. & Adams W.M. (2009). Payment for ecosystem services and the challenge of
saving nature. Conservation Biology, 23, 785-787.
Relyea R.A. (2005). The impact of insecticides and herbicides on the biodiversity and
productivity of aquatic communities. Ecological Applications, 15, 618-627.

147
Rodriguez J.P., Beard T.D., Bennett E.M., Cumming G.S., Cork S.J., Agard J., Dobson A.P.
& Peterson G.D. (2006). Trade-offs across space, time, and ecosystem services.
Ecology and Society, 11.
Roedel M.-O. & Ernst R. (2004). Measuring and monitoring amphibian diversity in tropical
forests. I. An evaluation of methods with recommendations for standardization.
Ecotropica, 10, 1-14.
Roemer G.W., Donlan C.J. & Courchamp F. (2002). Golden eagles, feral pigs, and insular
carnivores: How exotic species turn native predators into prey. Proceedings of the
National Academy of Sciences of the United States of America, 99, 791-796.
Rowley J., Brown R., Bain R., Kusrini M., Inger R., Stuart B., Wogan G., Thy N., Chan-ard
T., Trung C.T., Diesmos A., Iskandar D.T., Lau M., Ming L.T., Makchai S., Truong
N.Q. & Phimmachak S. (2009). Impending conservation crisis for Southeast Asian
amphibians. Biology Letters, 6, 336-338.
Ryall K.L. & Fahrig L. (2006). Response of predators to loss and fragmentation of prey
habitat: A review of theory. Ecology, 87, 1086-1093.
Samejima H., Marzuki M., Nagamitsu T. & Nakasizuka T. (2004). The effects of human
disturbance on a stingless bee community in a tropical rainforest. Biological
Conservation, 120, 577-587.
Scherr S.J. & McNeely J.A. (2008). Biodiversity conservation and agricultural sustainability:
towards a new paradigm of 'ecoagriculture' landscapes. Philosophical Transactions of
the Royal Society B-Biological Sciences, 363, 477-494.
Schroth G. & Harvey C. (2007a). Biodiversity conservation in cocoa production landscapes:
an overview. Biodiversity and Conservation, 16, 2237-2244.
Schroth G. & Harvey C.A. (2007b). Biodiversity conservation in cocoa production
landscapes: an overview. Biodiversity and Conservation, 16, 2237-2244.

148
Shahabuddin, Schulze C.H. & Tscharntke T. (2005). Changes of dung beetle communities
from rainforests towards agroforestry systems and annual cultures in Sulawesi
(Indonesia). Biodiversity and Conservation, 14, 863-877.
Simberloff D. (2010). Invasive species. In: Conservation biology for all (eds. Sodhi NS &
Ehrlich P). Oxford University Press Oxford, pp. 131-152.
Smith S.A. & Stoskopf M.K. (2007). The art of amphibian science - Introduction. Ilar
Journal, 48, 179-182.
Sodhi N., Posa M., Lee T.M., Bickford D., Koh L. & Brook B. (2010a). The state and
conservation of Southeast Asian biodiversity. Biodiversity and Conservation, in press.
Sodhi N.S., Bickford D., Diesmos A.C., Lee T.M., Koh L.P., Brook B.W., Sekercioglu C.H.
& Bradshaw C.J.A. (2008). Measuring the meltdown: drivers of global amphibian
extinction and decline. PLoS One, 3, Article No.: e1636.
Sodhi N.S. & Brook B.W. (2006). Southeast Asian Biodiversity in Crisis. Cambridge
University Press, Cambridge.
Sodhi N.S., Koh L.P., Brook B.W. & Ng P.K.L. (2004). Southeast Asian biodiversity: an
impending disaster. Trends in Ecology & Evolution, 19, 654-660.
Sodhi N.S., Koh L.P., Clements R., Wanger T.C., Hill J.K., Hamer K.C., Clough Y.,
Tscharntke, T.,, Posa M.R.C. & Lee T.M. (2010b). Conserving Southeast Asian forest
biodiversity in human-modified landscapes. Biological Conservation.
Sodhi N.S., Koh L.P., Prawiradilaga D.M., Tinulele I., Putra D.D. & Tan T.H.T. (2005a).
Land use and conservation value for forest birds in Central Sulawesi (Indonesia).
Biological Conservation, 122, 547-558.
Sodhi N.S., Lee T.M., Koh L.P. & Brook B.W. (2009a). A meta-analysis of the impact of
anthropogenic forest disturbance on Southeast Asia's biotas. Biotropica, 41, 103-109.

149
Sodhi N.S., Soh M.C.K., Prawiradilaga D.M., Darjono & Brook B.W. (2005b). Persistence of
lowland rainforest birds in a recently logged area in central Java. Bird Conservation
International, 15, 173-191.
Sodhi N.S., Wilcove D.S., Subaraj R., Yong D.L., Lee T.M., Bernard H. & Lim S.L.H.
(2009b). Insect extinctions on a small denuded Bornean island. Biodiversity and
Conservation, 19, 485-490.
Soh M.C.K., Sodhi N.S. & Lim S.L.H. (2006). High sensitivity of montane bird communities
to habitat disturbance in Peninsular Malaysia. Biological Conservation, 129, 149-166.
Sparling D.W., Matson C., Bickham J. & Doelling-Brown P. (2006). Toxicity of glyphosate
as Glypro (R) and LI700 to red-eared slider (Trachemys scripta elegans) embryos and
early hatchlings. Environmental Toxicology and Chemistry, 25, 2768-2774.
Spiegelhalter D.J., Best N.G., Carlin B.R. & van der Linde A. (2002). Bayesian measures of
model complexity and fit. Journal of the Royal Statistical Society Series B-Statistical
Methodology, 64, 583-616.
Spitzer K., Jaros J., Havelka J. & Leps J. (1997). Effect of small-scale disturbance on butterfly
communities of an Indochinese montane rainforest. Biological Conservation, 80, 9-15.
Steffan-Dewenter I., Kessler M., Barkmann J., Bos M.M., Buchori D., et al. (2007). Tradeoffs
between income, biodiversity, and ecosystem functioning during tropical rainforest
conversion and agroforestry intensification. Proceedings of the National Academy of
Sciences of the United States of America, 104, 4973-4978.
Suaz-Ortuno I., Alvarado-Diaz J. & Martinez-Ramos M. (2008). Effects of conversion of dry
tropical forest to agricultural mosaic on herpetofaunal assemblages. Conservation
Biology, 22, 362-374.
Suwabe M., Ohnishi H., Kikuchi T., Kawara K. & Tsuji K. (2009). Difference in seasonal
activity pattern between non-native and native ants in subtropical forest of Okinawa
Island, Japan. Ecological Research, 24, 637-643.

150
Tilman D., Fargione J., Wolff B., D'Antonio C., Dobson A., Howarth R., Schindler D.,
Schlesinger W.H., Simberloff D. & Swackhamer D. (2001). Forecasting agriculturally
driven global environmental change. Science, 292, 281-284.
Tscharntke T., Klein A.M., Kruess A., Steffan-Dewenter I. & Thies C. (2005). Landscape
perspectives on agricultural intensification and biodiversity - ecosystem service
management. Ecology Letters, 8, 857-874.
Uryu Y., Mott C., Foaed N., Yulianto K., Setiabudi A., Takakai F., Nursamsu, Sunarto, Fadhli
N., Hutajulu C.M.B., Jaenicke J., Hatano R., Siegert F. & Stüwe M. (2008).
Deforestation, forest degradation, biodiversity loss and C02 emissions in Riau,
Sumatra, Indonesia. In. WWF Indonesia Jakarta.
Vogel G., David P., Lutz M., Van Rooijen J. & Vidal N. (2007). Revision of the
Tropidolaemus wagleri-complex (Serpentes : Viperidae : Crotalinae). I. Definition of
included taxa and redescription of Tropidolaemus wagleri (Boie, 1827). Zootaxa, 1-40.
Vu L.V. (2009). Diversity and similarity of butterfly communities in five different habitat
types at Tam Dao National Park, Vietnam (vol 277, pg 15, 2009). Journal of Zoology,
277, 333-333.
Wagner D.L. & Van Driesche R.G. (2010). Threats posed to rare or endangered insects by
invasions of nonnative species. Annual Review of Entomology, 55, 547-568.
Wake D.B. & Vredenburg V.T. (2008). Are we in the midst of the sixth mass extinction? A
view from the world of amphibians. Proceedings of the National Academy of Sciences
of the United States of America, 105, 11466-11473.
Wanger T.C., Iskandar D.T., Motzke I., Brook B.W., Sodhi N.S., Clough Y. & Tscharntke T.
(2010a). Effects of land-use change on community composition of tropical amphibians
and reptiles in Sulawesi, Indonesia. Conservation Biology, 24, 795-802.
Wanger T.C., Rauf A. & Schwarze S. (2010b). Pesticides and tropical biodiversity. Frontiers
in Ecology and the Environment, 8, 178-179.

151
Wanger T.C., Saro A., Iskandar D.T., Brook B.W., Sodhi N.S., Clough Y. & Tscharntke T.
(2009). Conservation value of cacao agroforestry for amphibians and reptiles in South-
East Asia: combining correlative models with follow-up field experiments. Journal of
Applied Ecology, 46, 823-832.
Weber R., Faust H., Schippers B., Mamar S., Sutarto E. & Kreisel W. (2007). Migration and
ethnicity as cultural impact factors on land use change in the rainforest margins of
Central Sulawesi, Indonesia. Stability of Tropical Rainforest Margins: Linking
Ecological, Economic and Social Constraints of Land Use and Conservation, 417-
436.
Wells K.D. (2001). The energetics of calling in frogs. In: Anuran Communication (ed. Ryan
MJ). Smithsonian Institute Press Washington DC., pp. 45-60.
Whitfield S.M., Bell K.E., Philippi T., Sasa M., Bolanos F., Chaves G., Savage J.M. &
Donnelly M.A. (2007). Amphibian and reptile declines over 35 years at La Selva,
Costa Rica. Proceedings of the National Academy of Sciences of the United States of
America, 104, 8352-8356.
Whitten T., Mustafa M. & Henderson G.S. (2002). The Ecology of Sulawesi, 2nd. edition.
Gadjah Mada University Press, Yogyakarta, Indonesia.
Wich S.A., Meijaard E., Marshall A.J., Husson S., Ancrenaz M., Lacy R.C., van Schaik C.P.,
Sugardjito J., Simorangkir T., Traylor-Holzer K., Doughty M., Supriatna J., Dennis R.,
Gumal M., Knott C.D. & Singleton I. (2008). Distribution and conservation status of
the orang-utan (Pongo spp.) on Borneo and Sumatra: how many remain? Oryx, 42,
329-339.
Wielgoss A., Tscharntke T., Buchori D., Fiala B. & Clough Y. (2010). Temperature and a
dominant dolichoderine ant species affect ant diversity in Indonesian cacao
plantations. Agriculture Ecosystems & Environment, 135, 253-259.

152
Winder L., Alexander C.J., Holland J.M., Woolley C. & Perry J.N. (2001). Modelling the
dynamic spatio-temporal response of predators to transient prey patches in the field.
Ecology Letters, 4, 568-576.
Yap C.A.M., Sodhi N.S. & Brook B.W. (2002). Roost characteristics of invasive mynas in
Singapore. Journal of Wildlife Management, 66, 1118-1127.
Yap C.A.M., Sodhi N.S. & Peh K.S.H. (2007). Phenology of tropical birds in Peninsular
Malaysia: effects of selective logging and food resources. Auk, 124, 945-961.
Ziegler A.D., Fox J.M. & Xu J.C. (2009). The rubber juggernaut. Science, 324, 1024-1025.
Zug G.R., Vitt L.J. & Caldwell J.P. (2001). Herpetology: an Introductory Biology of
Amphibians and Reptiles. Second edition. Allen Press, San Diego.
153
List of publication as listed in this thesis
Introduction published as N.S. Sodhi, Koh, L.P., Clements, R., Wanger, T.C., Hill, J.K., Hamer, K.C., Clough, Y., Tscharntke, T., Posa, M.R.C., Lee, T.M. (2010): Conserving Southeast Asian forest biodiversity in human-modified landscapes. Biological Conservation, 143,2375-2384. doi:10.1016/j.biocon.2009.12.029.
Chapter 1 published as T.C. Wanger, Iskandar, D.T., Motzke, I., Brook, B.W., Sodhi, N.S., Clough, Y., Tscharntke, T. (2010): Effects of land-use change on community composition of tropical amphibians and reptiles in Sulawesi (Indonesia). Conservation Biology, 24,794-802. doi:10.1111/j.1523-1739.2009.01434.x
Chapter 2 published as T.C. Wanger, Saro, A., Iskandar, D.T., Brook, B.W., Sodhi, N.S., Clough, Y., Tscharntke, T. (2009): Conservation value of cacao agroforestry for amphibians and reptiles in Southeast Asia: combining correlative models with follow-up field experiments. Journal of Applied Ecology. 46,823-832. doi: 10.1111/j.1365-2664.2009.01663.x (this article is the cover article of the journal issue; Appendix 7)
Chapter 3 published as T.C. Wanger, Motzke, I., Shahabuddin, S., Iskandar, D.T. (2010): Amphibians and reptiles of the Lore Lindu National Park area, Sulawesi (Indonesia). Salamandra. 47,17-29.
Chapter 4 published as T.C. Wanger, Wielgoss, A.C., Motzke, I., Clough, Y., Brook, B.W., Sodhi, N.S., Tscharntke, T. (2010): Endemic predators, invasive prey, and native diversity. Proceedings of the Royal Society - B., 278,690-694. doi: 10.1098/rspb.2010.1512 (for media attention of this article see Appendix 8)
Chapter 5 published as T.C. Wanger, Rauf, A., Schwarze, S. (2010): Pesticides and tropical biodiversity. Frontiers in Ecology and the Environment, 4,178-179. doi:10.1890/10.WB.015

154
Complete list of publications
T.C. Wanger, Wielgoss, A.C., Motzke, I., Clough, Y., Brook, B.W., Sodhi, N.S., Tscharntke, T. (2010): Endemic predators, invasive prey, and native diversity. Proceedings of the Royal Society - B., 278,690-694. doi: 10.1098/rspb.2010.1512
T.C. Wanger, Motzke, I., Shahabuddin, S., Iskandar, D.T. (2010): Amphibians and reptiles of the Lore Lindu National Park area, Sulawesi (Indonesia). Salamandra. 47,17-29.
T.C. Wanger, Rauf, A., Schwarze, S. (2010): Pesticides and tropical biodiversity. Frontiers in Ecology and the Environment, 4, 178-179. doi:10.1890/10.WB.015
T.C. Wanger, Iskandar, D.T., Motzke, I., Brook, B.W., Sodhi, N.S., Clough, Y., Tscharntke, T. (2010): Effects of land-use change on community composition of tropical amphibians and reptiles in Sulawesi (Indonesia). Conservation Biology, 24,794-802. doi:10.1111/j.1523-1739.2009.01434.x
N.S. Sodhi, Koh, L.P., Clements, R., Wanger, T.C., Hill, J.K., Hamer, K.C., Clough, Y., Tscharntke, T., Posa, M.R.C., Lee, T.M. (2010): Conserving Southeast Asian forest biodiversity in human-modified landscapes. Biological Conservation, 143,2375-2384. doi: 10.1016/j.biocon.2009.12.029
Y. Clough, Abrahamczyk, S., Adams, M.-O., Anshary, A., Ariyanti, N., Betz, L., Buchori, D., Cicuzza, D., Darras, K., Putra, D.D., Fiala, B., Gradstein, S.R., Kessler, M., Klein, A.-M., Pitopang, R., Sahari, B., Schulze, C.H., Shahabuddin, Sporn, S., Stenchly, K., Tjitrosoedirdjo, S.S., Wanger, T.C., Weist, M., Wielgoss, A., Tscharntke, T. (2010): Biodiversity and trophic interactions in human-dominated tropical landscapes in Sulawesi (Indonesia). p.15-75, in Environmental Series, Springer Verlag, Berlin, Germany.
T. Tscharntke, Clough Y, Bhagwat S, Buchori D, Faust H, Hertel D, Hölscher D, Juhrbandt J, Kessler M, Perfecto I, Scherber C, Schroth G, Veldkamp E, Wanger TC (2011) Ecological principles of multifunctional shade-tree management in cacao agroforestry landscapes. Journal of Applied Ecology. 48,619–629.
T.C. Wanger, Saro, A., Iskandar, D.T., Brook, B.W., Sodhi, N.S., Clough, Y., Tscharntke, T. (2009): Conservation value of cacao agroforestry for amphibians and reptiles in Southeast Asia: combining correlative models with follow-up field experiments. Journal of Applied Ecology. 46,823-832. doi: 10.1111/j.1365-2664.2009.01663.x
T.C. Wanger, Motzke, I., Furrer, S.C., Brook, B.W., Gruber, B. (2009): How to monitor elusive lizards: comparison of capture-recapture methods on giant day geckos (Gekkonidae, Phelsuma madagascariensis grandis) in the Masoala rainforest exhibit, Zurich Zoo. Ecological Research. 24, 345-353. doi:10.1007/s11284-008-0511-3
T.C. Wanger, Motzke, I., Furrer, S.C., Gruber, B. (2009): Spatial distribution and habitat preferences of the giant day gecko (Phelsuma madagascariensis grandis) in the Masoala rainforest exhibit, Zoo Zurich. Salamandra. 45, 147-153.
155
M. Olsson, Wilson, M., Uller, T., Mott, B., Isaksson, C., Healey, M., Wanger, T.C. (2008): Free radicals run in lizard families. Biology Letters, 4, 186-188. doi:10.1098/rsbl.2007.0611
T.U. Grafe, Wanger, T.C. (2007): Multimodal signaling in male and female foot-flagging frogs Staurois guttatus (Ranidae): an alerting function of calling. Ethology, 113, 772-781.
T.C. Wanger, Motzke, I., Rödel, M.O. (2006): Zur Entwicklung der Diversität der Herpetofauna des östlichen Landschaftsschutzgebietes Spitzberg bei Tübingen am Neckar. - Jahresheft der Gesellschaft für Naturkundliche Mitteilungen Württemberg, 162, 283-294.
T.U. Grafe, Wanger, T.C., Dehling, J.M., Proksch, S., Braasch, T. (2006): Use of individual markings in the study of the foot-flagging frog, Staurois guttatus. Scientia Bruneiana, 7, 3-8.
T.C. Wanger (2005): Amphibians of Kiang West National Park, The Gambia. Salamandra, 41, 27-33.
T.C. Wanger (2005): Bird watching along Badas Road. Brunei Nature Society, 3, 2-3.