determination of the fatigue behaviour of asphalt base ... · determination of the fatigue...
TRANSCRIPT
2nd Workshop on Four Point Bending, Pais (ed.), © 2009. University of Minho. ISBN 978-972-8692-42-1
325
Determination of the fatigue behaviour of asphalt base mixes using the indirect tensile and the 4 point bending test
C. Weise, S. Werkmeister & F. Wellner Institute of Pavement Engineering, Technische Universitaet Dresden, Germany
M. Oeser School of Civil and Environmental Engineering, University of New South Wales, Australia
ABSTRACT: The purpose of the research project which is the background for the paper was to determine input parameters of asphalt base mixes for the mechanistic pavement design proce-dure. The influence of the air void content, the aggregate variety, the bitumen content, the provenance and also the paving grade of the bitumen on the fatigue behaviour was investigated. Using the Indirect Tensile Test (ITT) the fatigue behaviour of the asphalt base mixes was de-termined. In addition to this, the Four Point Bending Test (4PBT) was carried out on three as-phalt base mixes. So it was possible to detect a linear correlation between the fatigue functions based on the ITT and the 4PBT. Former tests displayed a difference of the E-Modulus values due to compression or tension particularly at temperatures above 5 °C. Hence, the effects of the differences on the stress state within a specimen of the 4PBT were investigated using FE simu-lations.
1 INTRODUCTION Different repeated load test methods have been established worldwide to investigate the fatigue behaviour of asphalt mixes. The results of the fatigue tests can be used as input parameters for a mechanistic pavement design procedure. At the moment such a mechanistic design procedure for asphalt pavements is under development in Germany. For the pavement design procedure the stiffness and the fatigue resistance of the asphalt mixes should be known. These characteris-tics can be obtained by various fatigue tests like bending, direct and indirect tensile tests.
For that reason a research project (Wellner & Lipke 2009) has been conducted at the Chair of Pavement Engineering at Technische Universitaet Dresden, Germany to investigate the effect of asphalt mix properties (aggregate type, bitumen source, bitumen content, degree of compaction) on the fatigue behaviour of asphalt base mixes. Within this research project the effect of the testing methods (Indirect Tensile Test (ITT) and Four Point Bending Test (4PBT)) on the fa-tigue curves of the asphalt base mixes was investigated as well. The research was funded by the German Federal Ministry of Transport, Building and Urban Affairs.
2 FATIGUE TESTS 2.1 Asphalt base mixes investigated Fatigue parameters of asphalt mixes are commonly determined using the results of repeated load tensile tests. These parameters and the E-Modulus-temperature-function are required for the pavement design procedure.
Different repeated load tests have been established in Germany and worldwide to determine the fatigue behaviour of asphalt mixes. Within this project ITTs and 4PBTs on asphalt base
mixes (that were produced in the laboratory as well as in an asphalt mixing plant) carried out. The asphalt mix design followed the German Guideline ZTV-T (ZTV T–StB 1995).
At least 19 different asphalt base mixes with a maximum aggregate size of 22 mm have been determined. Three different aggregates types and nine different bitumen have been considered. Thereby, emphasis was placed on the effect of the bitumen and air void content. Table 1 sum-marise the aggregates and the bitumen used for the ITT and the 4PBT.
Table 1. Aggregates and bitumen used for the tests
Code Aggregate Type Bitumen ProvenanceG1B0 Greywacke 50/70 C (mixing plant)G1B1 Greywacke 50/70 AG1B7 Greywacke PmB 45A A
2.2 Sample preparation For the ITT specimens cores were drilled from asphalt slabs produced with a laboratory rolling segment compactor. For the 4BPT prismatic specimens were cut out of asphalt slabs produced with a laboratory roll segment compactor. Afterwards, all specimens were cleaned and dehu-mifed at room temperature. Finally, the dimension for each specimen and the bulk density val-ues were measured and checked against the requirements.
For testing, eight clamps were glued on the 4PBT specimens using synthetic resin glue, which must harden for at least 24 hours. Before testing the temperature within the specimens must be kept constant. To achieve this, a tempering time of four hours was chosen for all speci-mens.
2.3 Indirect Tensile Tests In terms of the ITTs, the resultant horizontal deformations are measured for a cylindrical speci-men, which is loaded by two diametrically arranged compressive forces applied via curved load distribution bars. In the centre of the specimen the stress ratio σx/σy = 1/3 is constant. During the ITT a repeated load is applied to the specimen up to a defined criterion for test termination (fa-tigue crack). The ITTs were run in force controlled mode. The horizontal displacement of the sample was measured using two Linear Variable Differential Transformers (LVDTs).
The test specimens had a diameter of 150 ± 3 mm and a height of 60 mm. The load distribu-tion bars had a width of 19.1 mm. Table 2 shows the test conditions for the ITTs. Table 2. Dynamic ITTs – Test Conditions
Parameter Performed Test ConditionsWave sinusoidal stress, without cycling through zeroFrequency f [Hz] 10Duration of Loading [s] 1/fRest period [s] noneTest Temperature [°C] -10, 0, +10, +20Lower Stress contact stress / temperature-induced stressesUpper Stress triple variation
The contact stress or lower stress level was 0.035 N/mm². In addition, temperature-induced stresses were taken into account for test temperatures lower than +10 °C. The temperature-induced stresses were determined using the results of cool-down tests conducted at the Univer-sity of Braunschweig. The maximum stress level (upper stress level) for each test was deter-mined in dependency of the aspired initial elastic strain values of 0.05, 0.10 and 0.15‰. Be-cause of the low binder content and hence a poor fatigue function with a steep slope it was necessary to conduct the fatigue tests at the initial elastic strain values chosen. In order to use the same wave shape for all fatigue tests (ITT and 4PBT), a sinusoidal wave with no rest periods was chosen and it was accepted that the loading for the ITTs differs from the specifications given in the European Standard (EN 12697-26).
326
2.4 Four-Point Bending Tests In the 4PBT prismatic specimens are subjected to vertical loads and the vertical deformations of the specimens are measured. During the 4PBT a repeated load is applied to the specimen up to a defined criterion for test termination (fatigue crack). The vertical displacement of the sample was measured using a LVDT. The tests were run in force controlled mode.
The test specimens had a length of 460 mm, a width of 70 mm and a height of 70 mm. Table 3 summarise the test conditions for the 4PBTs.
Table 3. 4PBTs – Test Conditions
Parameter Performed Test ConditionsWave sinusoidal stress, with cycling through zeroFrequency f [Hz] 30Duration of Loading [s] 1/fRest period [s] noneTest Temperature [°C] stiffness: -10, 0, +10, +20
fatigue tests: +20Stress amplitude triple variation
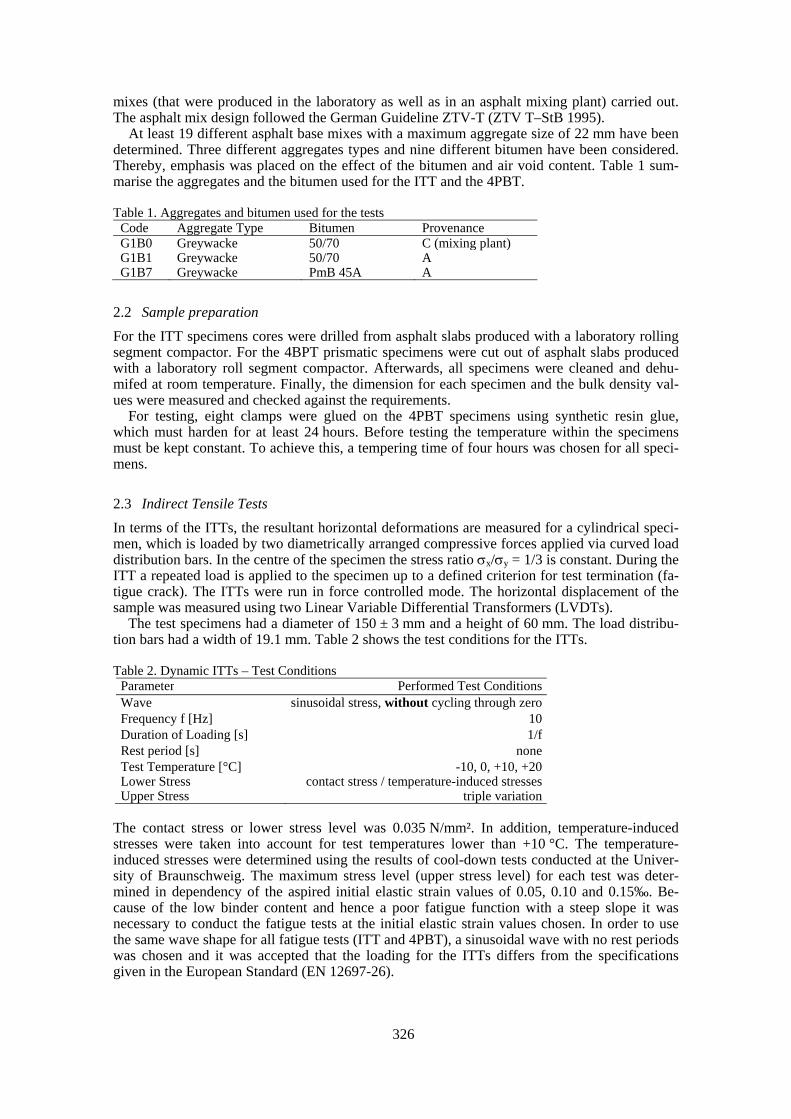
The stress amplitudes for the fatigue tests were chosen dependent on the aspired number of load cycles until macro-crack formation (see Section 2.5) between 10,000 and 2,000,000. In Figure 1 the equipment used for the tests is shown.
Figure 1. 4PBT equipment at TU Dresden
2.5 Fatigue criteria A test methodology that is standardized for both tests and that takes into account the same crite-ria is necessary to determine the number of load cycles until crack formation (fatigue).
Hopman et al. (1989) developed a method by detecting the number of load cycles at the time of crack formation based on the concept of dissipated energy. Figure 2 gives an example of the method suggested by Hopman et al. The product of the number of load cycles and the stiffness modulus (measured during the tests) is plotted versus the number of load cycles, see Figure 2. According to Hopman et al., a deviation of this curve from a straight line indicates the begin-ning of micro-cracking, while the peak of the curve deviates the formation of macro-cracks. The dissipated energy is specified by the product of plastic deformations and applied load. The
327

stored energy is calculated as the product of elastic deformations and applied load. The elastic potential represents the recovery ability of the body. The plastic potential symbolizes the plastic deformation ability.
0,0
4,5E+08
Figure 2. Evaluation of the fatigue test using the method of Hopman et al. (1989) This method is based on the fundamental idea that in the early stage of the test the elastic poten-tial of the specimen (stiffness modulus) is constant. Hence, the slope of the curve in Figure 2 is constant. Furthermore, the plastic deformation accumulates at a constant rate so the increase in dissipated energy is constant as well. Later the plastic potential accumulates (progressive in-crease in dissipated energy per load cycle) and the elastic potential of the specimen decreases progressively (stiffness modulus declines significantly). Once the macro-crack has developed, complete failure of the specimen follows on after a relatively small number of load cycles. The apex of the curve in Figure 2 can be interpreted as the moment of macro-crack formation. At this point, the ratio of stored and dissipated energy changes abruptly.
The initial elastic strain εel may be used to determine strain-based fatigue curves. Because of adaptation problems between the specimen and the load distribution bars during the first load cycles the elastic strain is determined between the 98th and 102nd load cycle.
The use of strain-based fatigue curves eliminates the influence of the temperature on the fa-tigue behaviour (Read 1996). The formation of macro-cracks was used as the fatigue criteria. Material specific fatigue curves can be determined using Equation 1. (1)
where εel = initial elastic strain; N = number of load cycles until macro-crack; and K1, K2 = ma-terial parameter. The number of load cycles to fatigue failure in-situ (in a real pavement) can not be estimated di-rectly from the results of laboratory fatigue tests. For this reason fatigue models that utilise the results of fatigue tests are needed to estimate the number of load cycles to fatigue failure. Dif-ferent factors like lateral wander, duration of rest periods between loadings, crack propagation etc. are held responsible for the fact that the number of load cycles to fatigue failure in the pavement are always greater than the number of load cycles to fatigue determined in the labora-tory (Werkmeister et al. 2006).
E+00
5,0E+07
1,0E+08
1,5E+08
2,0E+08
2,5E+08
3,0E+08
3,5E+08
4,0E+08
0 10.000 20.000 30.000 40.000 50.000 60.000 70.000Number of cycles N [-]
N*E
[N
/mm
²]
4.5E+08
4.0E+08
3.5E+08
macro-crack3.0E+08 N = 47,780
2.5E+08
2.0E+08
1.5E+08
1.0E+08
5.0E+07
0.0E+00 0 10,000 20,000 30,000 40,000 50,000 60,000 70,000
2Kel1KN ε⋅=
328

3 FATIGUE TEST RESULTS 3.1 Comparison of the E-Modulus values Repeated load tests are necessary to obtain the stiffness characteristics of asphalt mixes in de-pendence on the loading time and temperature. However, a direct comparison of the E-Modulus values using the temperature frequency equivalence was not possible because the tests were conducted at selected temperature and frequency values (Table 4). The difference between the E-Modulus values determined using ITT and 4PBT can be explained by the different testing frequencies. The effect of the frequency is getting larger at lower temperatures.
Table 4. E-Modulus values determined using ITT (10 Hz) and 4PBT (30 Hz)
G1B0 G1B1 G1B7 ITT 4PBT ITT 4PBT ITT 4PBT
T [°C] E [N/mm²] E [N/mm²] E [N/mm²] E [N/mm²] E [N/mm²] E [N/mm²]-10 20,648 31,935 20,572 33,630 20,630 29,5310 19,268 17,906 12,882 22,198 15,760 16,532
10 12,586 16,001 10,240 11,788 8,985 11,47920 8,832 11,232 6,775 7,857 6,231 6,811
3.2 Comparison of the fatigue curves Repeated load tests are required as well to obtain the fatigue properties of asphalt mixes. Fatigue tests can be conducted using the equipment explained in Section 2.3 and 2.4. The type of fatigue tests and the testing conditions (e.g. testing frequency) influences the test results (fatigue curves). This is shown in Figure 3 where results of two different types of tests (ITT and 4 PBT) on three asphalt base mixes are presented.
G1B1 4PBT
y = 2,436x-3,7228
R2 = 0,6669
G1B0 ITT
y = 31,871x-2,6356
R2 = 0,8651
G1B0 4PBT
y = 854,7x-1,8897
R2 = 0,7949
G1B7 4 PBT
y = 91,657x-2,8749
R2 = 0,6856
G1B1 ITT
y = 1,2119x-3,3606
R2 = 0,969
G1B7 ITT
y = 0,8462x-4,1832
R2 = 0,8982
1
1.000.000
Figure 3. Fatigue relations obtained by ITT at 10 Hz and 4PBT at 30 Hz
From this diagram it becomes quite clear that intercept value K1 of the fatigue relation is rather a test property than a material property. It has been shown (Medani and Molenaar 2000) that the K2 value depends on the slope of the master curve. Previous research was carried out by RILEM (Di Benedetto et al. 2004) to compare different test procedures for the evaluation of fatigue re-sistance. Within this test campaign it was observed that that fatigue test results are very sensitive
00
1.000
10.000
100.000
0,01 0,10 1,00
Initial elastic strain [‰]
Num
ber o
f loa
d cy
cles
(mac
rocr
ack)
[-]
G1B0 4PBT G1B0 ITTG1B1 4PBT G1B1 ITTG1B7 4PBT G1B7 ITT
1,000,000
100,000
10,000
1,000
1000.01 0.10 1.00
329
to the load conditions and that the ITT results show the shortest life duration. However, these finding couldn’t be confirmed within this research project.
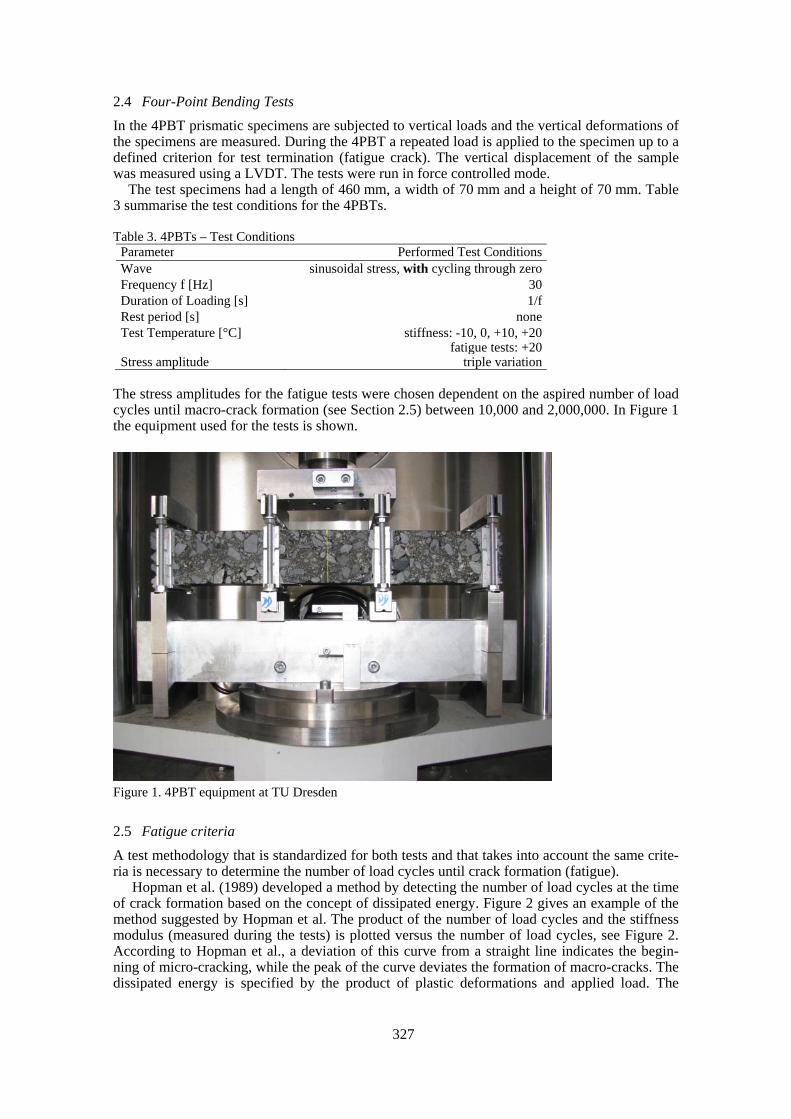
For determining the fatigue curve of the mixes using the ITT results at 10 °C and 20 °C were considered. Both tests were conducted as force controlled tests. However, there is still a major influence on the fatigue relations by the frequency. As already explained, the 4 PBT were car-ried out at 30 Hz while the ITT were conducted at 10 Hz. The influence of stress signal’s frequency on the fatigue performance during a Uniaxial Cy-clic Tensile Stress Test (UCTST) was analysed by Mollenhauer (2008), based on an extensive experimental program including various asphalt materials (see also Mollenhauer & Lorenzl, 2008). From this analysis it was concluded that the number of load cycles until fatigue failure is independently from the test frequency, but depends solely on the test duration and hence on the energy applied on the sample. This observation is exemplarily shown in Figure 4 for an asphalt wearing course material. The number of endured load cycles at 10 Hz is about the double of the corresponding number at 5 Hz, and about the triple of the corresponding number at 3 Hz. Con-sequently, if the time until macro-crack-initiation NMakro is drawn versus the applied stress, it is stated, that all test results gained at varied frequencies can be represented by one single time-fatigue curve.
1,000
10,000
100,000
1,000,000
0.5 1.0 1.5 2.0
stress difference Δσ [MPa]
endu
red
num
ber o
f loa
d cy
cles
d
NM
akro
[-]
frequency10 Hz5 Hz3 Hz
T = +5°C
100
1,000
10,000
100,000
0.5 1.0 1.5 2.0
stress difference Δσ [MPa]te
st d
urat
ion
until
cra
ckin
g
d t(N
Mak
ro) [
s]
frequency10 Hz5 Hz3 Hz
T = +5°C
Figure 4: Fatigue curves; influence of the test frequency on the number of endured load cycles (left); same results but plotted over the test duration until cracking (right) (Mollenhauer 2008) The approach proposed by Mollenhauer was used to recalculate the number of load cycles de-termined by the 4 PBT at a frequency of 10 Hz. Figure 5, Figure 6 und Figure 7 present the re-sults. It can be seen clearly that all test results can be presented by one fatigue curve.
330

100
1,000
10,000
100,000
1,000,000
0.01 0.10 1.00
Inital elastic strains [‰]
Num
ber o
f loa
d cy
cles
(mac
rocr
ack)
[-]
G1B0 4PBT G1B0 ITT
Figure 5. Fatigue relations obtained by ITT at 10 Hz and 4PBT at recalculated 10 Hz for the G1B0 mix
100
1,000
10,000
100,000
1,000,000
0.01 0.10 1.00
Inital elastic strains [‰]
Num
ber o
f loa
d cy
cles
(mac
rocr
ack)
[-]
G1 B1 4PBT G1B1 ITT
Figure 6. Fatigue relations obtained by ITT at 10 Hz and 4PBT at recalculated 10 Hz for the G1B1 mix
100
1,000
10,000
100,000
1,000,000
0.01 0.10 1.00
Inital elastic strains [‰]
Num
ber o
f loa
d cy
cles
(mac
rocr
ack)
[-]
G1B7 4PBT G1B7 ITT
Figure 7. Fatigue relations obtained by ITT at 10 Hz and 4PBT at recalculated 10 Hz for the G1B7 mix
331
These results indicate that for same test conditions (load controlled tests and testing tempera-ture) similar fatigue relations can be determined by the ITT and 4PBT. Further tests are required to confirm these findings.
Furthermore, it should be mentioned that the scatter of the individual 4PBT results was high and consequently the regression coefficient for the 4PBT results was quite low (average R2 > 0.7) compared to the ITT results (R2 > 0.9).
4 FEM SIMULATIONS
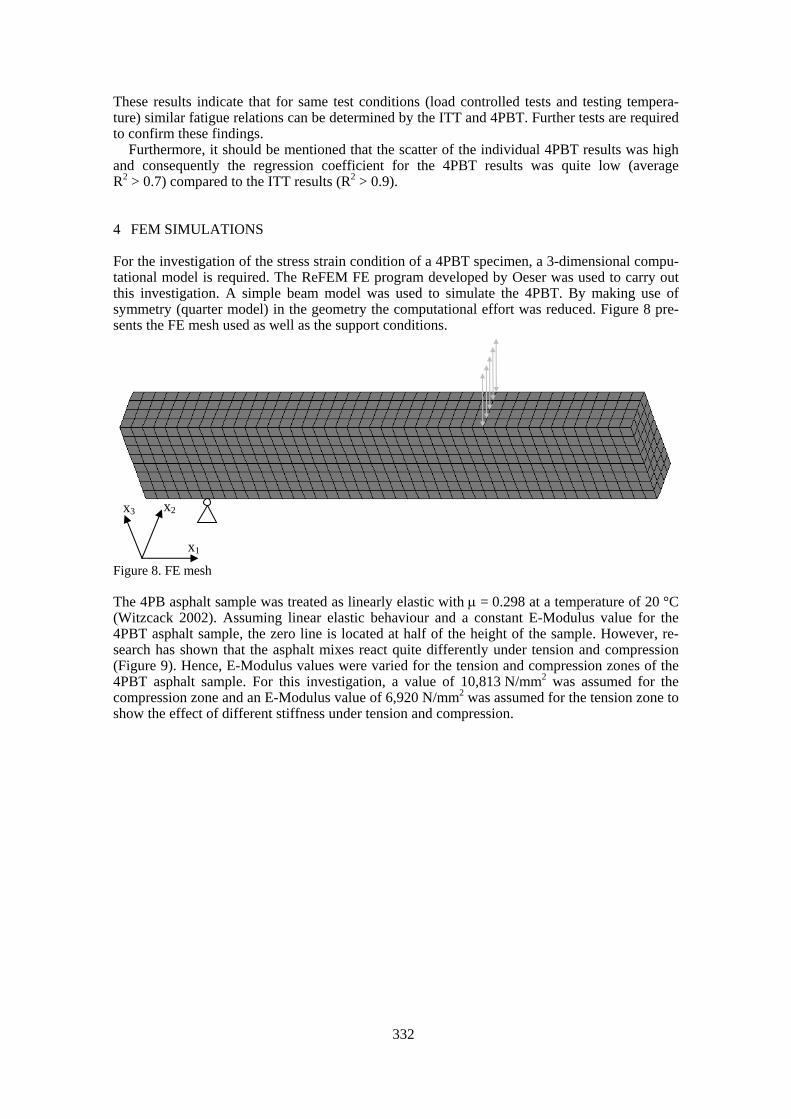
For the investigation of the stress strain condition of a 4PBT specimen, a 3-dimensional compu-tational model is required. The ReFEM FE program developed by Oeser was used to carry out this investigation. A simple beam model was used to simulate the 4PBT. By making use of symmetry (quarter model) in the geometry the computational effort was reduced. Figure 8 pre-sents the FE mesh used as well as the support conditions.
x2 x3
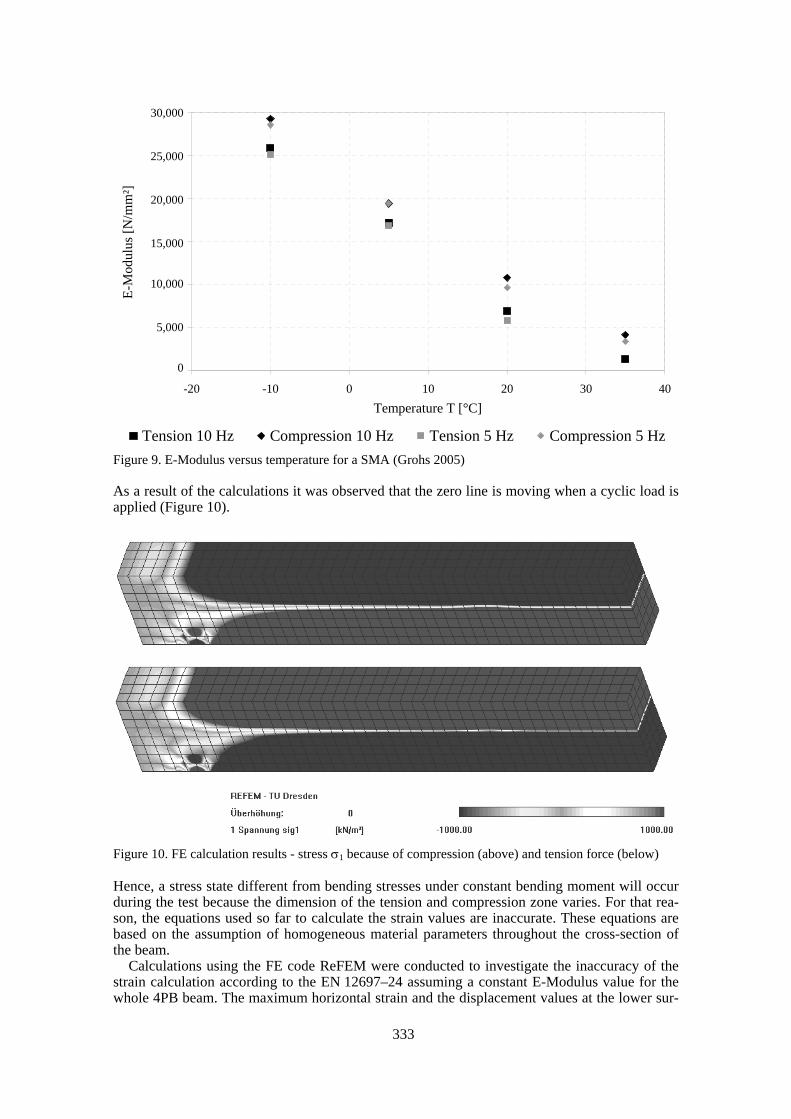
x1 Figure 8. FE mesh The 4PB asphalt sample was treated as linearly elastic with μ = 0.298 at a temperature of 20 °C (Witzcack 2002). Assuming linear elastic behaviour and a constant E-Modulus value for the 4PBT asphalt sample, the zero line is located at half of the height of the sample. However, re-search has shown that the asphalt mixes react quite differently under tension and compression (Figure 9). Hence, E-Modulus values were varied for the tension and compression zones of the 4PBT asphalt sample. For this investigation, a value of 10,813 N/mm2 was assumed for the compression zone and an E-Modulus value of 6,920 N/mm2 was assumed for the tension zone to show the effect of different stiffness under tension and compression.
332
0
5.000
10.000
15.000
20.000
25.000
30.000
-20 -10 0 10 20 30 4Temperature T [°C]
E-M
odul
us [N
/mm
²]
0
Tension 10 Hz Compression 10 Hz Tension 5 Hz Compression 5 Hz
30,000
F25,000
F20,000
F15,000
F10,000
F5,000
F0
Figure 9. E-Modulus versus temperature for a SMA (Grohs 2005)
As a result of the calculations it was observed that the zero line is moving when a cyclic load is applied (Figure 10). Figure 10. FE calculation results - stress σ1 because of compression (above) and tension force (below) Hence, a stress state different from bending stresses under constant bending moment will occur during the test because the dimension of the tension and compression zone varies. For that rea-son, the equations used so far to calculate the strain values are inaccurate. These equations are based on the assumption of homogeneous material parameters throughout the cross-section of the beam.
Calculations using the FE code ReFEM were conducted to investigate the inaccuracy of the strain calculation according to the EN 12697–24 assuming a constant E-Modulus value for the whole 4PB beam. The maximum horizontal strain and the displacement values at the lower sur-
333
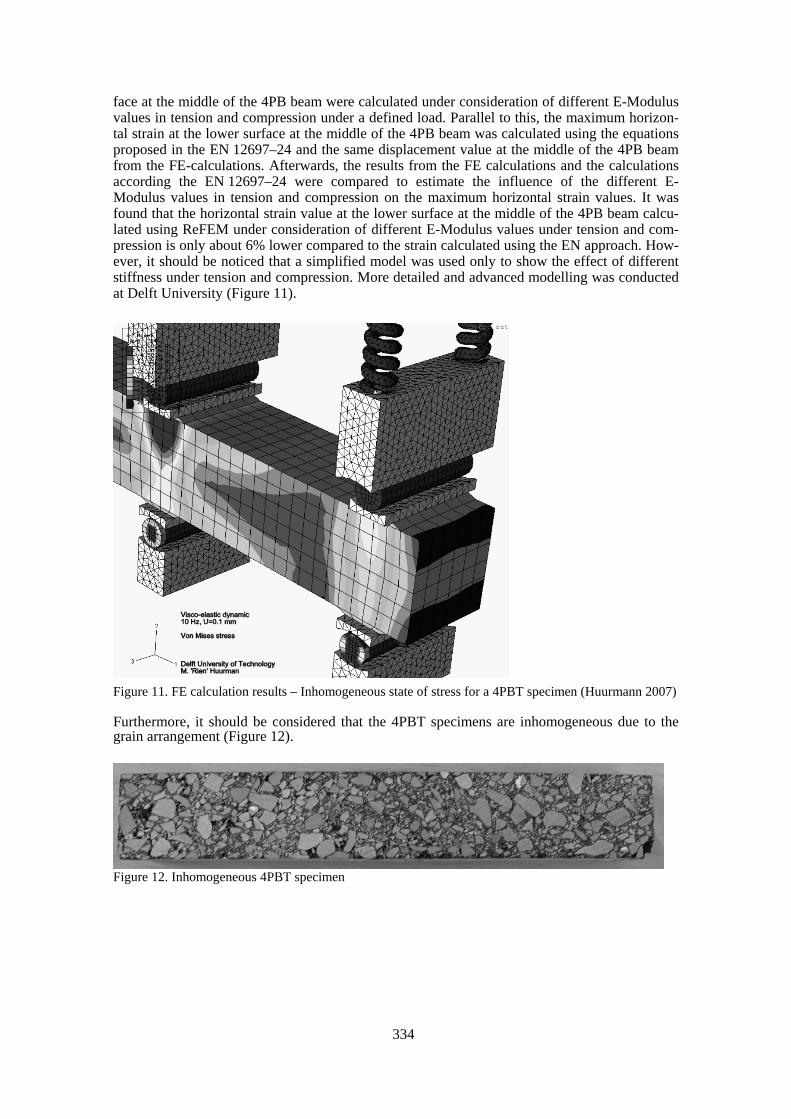
face at the middle of the 4PB beam were calculated under consideration of different E-Modulus values in tension and compression under a defined load. Parallel to this, the maximum horizon-tal strain at the lower surface at the middle of the 4PB beam was calculated using the equations proposed in the EN 12697–24 and the same displacement value at the middle of the 4PB beam from the FE-calculations. Afterwards, the results from the FE calculations and the calculations according the EN 12697–24 were compared to estimate the influence of the different E-Modulus values in tension and compression on the maximum horizontal strain values. It was found that the horizontal strain value at the lower surface at the middle of the 4PB beam calcu-lated using ReFEM under consideration of different E-Modulus values under tension and com-pression is only about 6% lower compared to the strain calculated using the EN approach. How-ever, it should be noticed that a simplified model was used only to show the effect of different stiffness under tension and compression. More detailed and advanced modelling was conducted at Delft University (Figure 11).
Figure 11. FE calculation results – Inhomogeneous state of stress for a 4PBT specimen (Huurmann 2007) Furthermore, it should be considered that the 4PBT specimens are inhomogeneous due to the grain arrangement (Figure 12).
Figure 12. Inhomogeneous 4PBT specimen
334

5 CONCLUSIONS
Both tests (ITT and 4PBT) are suitable to investigate the fatigue performance of asphalt base mixes. Using appropriate test-analysing methods, similar test results in terms of the E-Modulus values and fatigue curves can be determined. As it was shown in the paper using the results of 4PBT and ITT similar fatigue test results for the same materials were determined considering the “test duration” approach proposed by Mollenhauer. If tests were conducted at different fre-quencies the “test duration” approach can be applied to recalculate the number of load cycles at different frequencies. The number of load cycles until fatigue failure was independently from the test frequency, but depends solely on the test duration and hence on the energy applied on the sample.
The deformation measurement equipment for the 4PBT needs to be improved. It is recom-mended that strain gauges should be glued directly underneath the test beam. By using such a system, the strains can be measured directly on the sample and no strain calculation is required.
The regression coefficients were low for the 4PBTs conducted. By using strain measurement system directly on the sample the accuracy of the measurements and hence the regression coef-ficient of the fatigue curves can be improved significantly.
Furthermore, due to the inhomogeneous sample structure caused by the grain assembly and large grain dimensions a disturbed stress distribution within the testing sample occurs. For ana-lysing the test results according to the European Standard, a homogenous stress distribution is assumed. The test results might be inaccurate because of the disturbed stress state induced in the sample.
Both tests ITT and 4PBT exhibit their own crack-mechanism. If a crack occurs in the centre of the ITT specimen, the stresses are redistributed and a stress concentration occurs at the peak of the crack. This stress concentration leads to an acceleration of the crack growths. In a 4PBT specimen cracks that propagate from the lower surface upwards or from the upper surface downwards lead to a reduction in the size of the part of the cross section though which bending stresses can be transferred. This also triggers a stress concentration and influences the crack growth. The crack mechanism of the ITT and of the 4PBT is not only different between them-selves; but also differ from the crack mechanism in a actual pavement. The amount at which stresses concentrate at the peak of the crack differs between the ITT the 4PBT and in the actual pavement since the mechanisms of load transfer is distinctively different. This must always be considered when using the results of these tests to predict the fatigue behaviour of pavements.
6 ACKNOWLEDGEMENTS
The authors extend their kind regards to the German Federal Ministry of Transport, Buildings and Urban Affairs for funding the research project. The authors would like to thank Sebastian Lipke for his work on the research project.
7 REFERENCES
Di Benedetto, H.; de La Roche, C.; Baaj, H.; Pronk, A. & Lundström, R. 2004. Fatigue of bituminous mixtures. Materials and Structures, April 2004, Vol. 37, pp. 202-216.
EN 12697-24. Bituminous mixtures - Test methods for hot mix asphalt – Part 24: Resistance to fatigue. October 2007.
EN 12697-26. Bituminous mixtures - Test methods for hot mix asphalt – Part 26: Stiffness. October 2004.
Grohs, S. 2005. Determination of mechanistic parameters for a SMA 0/11S using the Triaxial Test (Bes-timmung mechanischer Kenngrößen für einen SMA 0/11 S mit Hilfe des dynamischen Triaxialver-suchs), in German, Diploma Thesis. Technische Universität Dresden.
Hopman, P.; Kunst, P. & Pronk, A. 1989. A Renewed Interpretation Model for Fatigue Measurement. Verification of Miner’s Rule, 4th Eurobitume Symposium, 4-6 October 1989, Vol. 1, pp. 557-561. Madrid.
Huurman, M. 2007. Can we perform tests on materials, Presentation on the 1st 4PB-Workshop, 8./9.03.2007. Delft.
335

336
Medani and Molenaar A. A. A. 2000. A simplified procedure for the estimation of the fatigue and crack growth characteristics of asphalt mixes, Int. Journal of road materials and pavement design. Vol. 1, Issue 3.
Mollenhauer, K. 2008. Prognosis of fatigue characteristics of asphalt by uniaxial swelling tensile tests (Dimensionierungsrelevante Prognose des Ermüdungsverhaltens von Asphalt mittels einaxialer Zug-Schwellversuche), in German, PhD Thesis. Technische Universität Braunschweig.
Mollenhauer, K. & Lorenzl, H. 2008. Testing of fatigue and deformation properties in uniaxial tension tests, 4th Eurasphalt & Eurobitume Congress, 21-23 May 2008. Copenhague
Read, J. 1996. Fatigue cracking of bituminous paving mixtures, PhD Thesis, University of Nottingham, Department of Civil Engineering. Nottingham.
Werkmeister, S.; Wellner, F. & Oeser, M. 2006. Study on the Fatigue Behaviour of Asphalt Mixes Using the Dynamic Indirect Tensile Test within the Scope of Analytical Design, ISAP Conference 12-17 August 2006, Quebec.
Wellner, F. & Lipke, S. 2009. Determination of relevant input parameters for the analytical pavement de-sign procedure of asphalt pavements– indirect tensile fatigue tests (Ermittlung von dimensionierungs-relevanten Eingangsgrößen für Asphaltbefestigungen im Rahmen einer rechnerischen Dimen-sionierung – Ermüdungsuntersuchungen mit dem Spaltzugversuch), in German, Final Report to Project FE 04.202/2005/ARB. Dresden.
Witzcak, M. W. 2002. Simple Performance Test for Superpave Mix Design, National Cooperative High-way Research Program (NCHRP), Report 465, Transportation Research Board (TRB), National Re-search Council. Washington DC.
ZTV T – StB 95. 1995. Zusätzliche Technische Vertragsbedingungen und Richtlinien für Tragschichten im Straßenbau, Fassung 2002, Forschungsgesellschaft für Straßen- und Verkehrswesen. Köln.