determination of alpha lipoic acid content in dietary supplements...
TRANSCRIPT
DISSERTATION
Determination of alpha lipoic acid content in dietary supplements
and foodstuffs using high performance liquid chromatography with
different detection modes
Angestrebter akademischer Grad
Doktor der Naturwissenschaften (Dr. rer. nat.)
An der
Fakultät für Chemie,
Universität Wien
Verfasserin: Arjumand Iqbal Durrani
Matrikelnummer: 091 447029
Dissertationsgebiet: Lebensmittelchemie
Betreuer: Univ. Prof. Dr. Gerhard Sontag, Universität Wien
Gutachter: O. Univ. Prof. Dr. Werner Pfannhauser, Technische
Universität Graz
Ao. Univ. Prof. Dr. Ebrahim Razzazi-Fazeli,
Veterinärmedizinische Universität Wien
Wien, im Juli 2008
I
ACKNOWLEDGEMENTS
First of all, I express my deepest and humble gratitude towards Almighty
Allah for His unending blessings, in particular for giving me strength and
environment to complete my doctoral studies.
I want to share a heart-felt acknowledgement for my late father, Muhammad
Iqbal Khan Durrani, who has always been a source of love and motivation in my life.
It was he who encouraged me to go abroad for higher studies and it was he who was
always there whenever I needed him. He is no more in this world but he is and will
always be with me.
I express deepest gratitude to my principle supervisor (doctoral father), Univ.
Prof. Dr. Gerhard Sontag, University of Vienna, for his encouragment to start this
research work and for the opportunity to be a member of the inspiring research group.
His endless support, professional supervision and constructive critisicsm has been
really precious during these years.
I owe special thanks to the Higher Education Commission, (HEC), Pakistan
for providing me the financial support for my PhD studies, Austrian Exchange
Sercvice (ÖAD) and Academic Cooperation and Mobility Unit (ACM) for providing
me the opportunity and support to continue my higher studies here in Austria.
I appreciate the official referees of this thesis, O. Univ. Prof. Dr. Werner
Pfannhauser, Technical University of Graz and Ao. Univ. Prof. Dr. Ebrahim
Razzazi-Fazeli, Veterinary University of Vienna, for their valuable criticism and
constructive comments.
I warmly acknowledge the encouragement and support of Ao. Univ. Prof. Dr.
Margit Cichna-Markl during the whole course of my studies in Austria.
I wish to express thanks to my friend and lab-fellow Heidi Schwartz for
making my work easier during these years, for giving helping hand in solving
problems, constructive comments and for providing a pleasant working atmosphere.
Warm thanks are due to Fatima Tazeen Hussain, Eva Grünauer, Sabine Fuchs,
Eva Gerstenmeyer, Magdalena Wiplinger, Norbert Neger, Kerstin Schöringhumer,
Zdenka Brenn-Stuckhofova, Gerda Redl, Abdul Rehman and all other friends and

II
colleagues in the Department of Analytical and Food Chemistry for making my work
easier during these years and for giving me a pleasant and friendly environment.
Special thanks are due to my dear friend Montse for always being there with the
friendly smile.
I also want to acknowledge the love and support of all my Pakistani friends,
especially Aneesa, Saadia, Fareeha, Sheeba, Mamoona, Shazia, Noor, Rizwana,
Rameeza, Asim, Ather, Farooq and Rao Nadeem; your encouragements have been a
pure source of motivation for me especially during the thesis write-up.
My warmest thanks belong to my mother, Khurshid Akhtar Durrani, for her
confidence in me and for being always so supportive and interested in my work and
well-being. I also extend my love and thanks to my brothers, Naveed Durrani,
Shahzad Durrani and sister, Iram Durrani, for their love, advice and continuous
encouragement during my academic career. My special thanks to my sister-in-law,
Mubashra Durrani; you are a sun-shine of my life.
I extend special gratitude to my brother-in-law Karim Nawaz Durrani for
being so concerned about my studies and stay in Austria. Last but not the least, I owe
special thanks to little angles of my family, Hammad, Alishba, Muaz, Huzaifa and
Hadia Noor for making my life full of love and laughter.
Vienna, July 2008
Arjumand Iqbal Durrani

III
PREFACE
This PhD research thesis is based upon the work done in the research group of
Food Chemistry from December 2004 till March 2008 under the supervision of Univ.
Prof. Dr. Gerhard Sontag at the Department of Analytical and Food Chemistry,
University of Vienna, Währingerstraße 38, 1090-Vienna, Austria.

IV
DEDICATED
TO
MY LATE FATHER
Table of contents
1
ACKNOWLEDGMENT ............................................................................................................ .I
PREFACE ................................................................................................................................. II
DEDICATION ......................................................................................................................... IV
LIST OF FIGURES ................................................................................................................... .5
LIST OF TABLES ............................................................................................................. …....7
LIST OF ABBREVIATIONS. ................................................................................................... 8
LIST OF PUBLICATIONS .................................................................................................... .11
ABSTRACT ............................................................................................................................ .14
ZUSAMMENFASSUNG ........................................................................................................ .15
1 INTRODUCTION ........................................................................................................ 16
1.1 BACKGROUND ............................................................................................................ 16
1.2 RESEARCH QUESTIONS ................................................................................................ 17
1.3 AIM OF THE RESEARCH ............................................................................................... 18
1.4 THEORETICAL BACKGROUND ...................................................................................... 18
1.5 METHOD DEVELOPMENT ............................................................................................. 18
1.6 OPTIMIZATION OF SAMPLE PREPARATION ................................................................... 19
1.7 BRIEF OVERVIEW OF RESULTS ..................................................................................... 20
1.8 SUGGESTIONS AND RECOMMENDATIONS .................................................................... 21
2 LITERATURE SURVEY ............................................................................................ 22
2.1 BRIEF HISTORY ........................................................................................................... 22
2.2 CHEMICAL NAMES ...................................................................................................... 23
2.3 BIOLOGICAL FUNCTIONS ............................................................................................. 23
2.3.1 Protein-bound alpha lipoic acid ....................................................................... 24
2.3.1.1 Alpha keto acid dehydrogenase complexes .............................................................. 25
2.3.1.2 Glycine cleavage system (GCS) ............................................................................... 28
2.3.2 Free alpha lipoic acid ...................................................................................... 28
2.3.2.1 Universal antioxidant ................................................................................................ 28
2.3.2.2 Alpha lipoic acid as an enzyme substrate ................................................................. 29
2.3.2.3 Alpha lipoic acid as an enzyme inhibitor .................................................................. 29
2.3.2.4 Redox regulation of proteins and influence on protein folding ................................. 30
2.3.2.5 Effects on gene expression ....................................................................................... 30
2.4 ABSORPTION, UPTAKE, INTRACELLULAR REDUCTION, AND METABOLISM OF Α-LA .... 31
2.4.1 Diabetes ............................................................................................................ 31
2.4.2 Liver diseases ................................................................................................... 31
2.4.3 Neurodegenerative disorders ........................................................................... 32
2.4.4 Radiation injury ................................................................................................ 32
2.4.5 Heavy metal poisoning ..................................................................................... 33
2.4.6 Anti-ageing effects ............................................................................................ 33
Table of contents
2
2.5 SOURCES ..................................................................................................................... 33
2.6 SIDE EFFECTS .............................................................................................................. 34
2.7 ANALYTICAL METHODS FOR THE DETERMINATION OF ALPHA LIPOIC ACID ................. 34
2.7.1 Gas chromatography ........................................................................................ 35
2.7.1.1 GC-FID and GC-FPD ............................................................................................... 35
2.7.1.2 GC-MS ..................................................................................................................... 36
2.7.2 High performance liquid chromatography ....................................................... 39
2.7.2.1 HPLC-UV and HPLC-FL ......................................................................................... 39
2.7.2.2 HPLC-EC ................................................................................................................. 41
2.7.2.3 HPLC-MS ................................................................................................................. 42
2.7.3 Capillary electrophoresis ................................................................................. 43
2.7.3.1 General techniques for sample preparation ............................................................... 43
2.7.3.2 Bacteria ..................................................................................................................... 46
2.7.3.3 Animal tissues .......................................................................................................... 48
2.7.3.4 Drug .......................................................................................................................... 48
2.7.3.5 Dietary supplements ................................................................................................. 49
2.7.3.6 Food .......................................................................................................................... 50
2.7.4 Summary ........................................................................................................... 50
3 AIM OF THE PRESENT STUDY .............................................................................. 53
4 INSTRUMENTAL SET-UP......................................................................................... 55
4.1 HIGH PERFORMANCE LIQUID CHROMATOGRAPHY ....................................................... 55
4.1.1 Theoretical background.................................................................................... 55
4.1.2 Instrumentation ................................................................................................ 58
4.1.3 The column ....................................................................................................... 59
4.1.4 Detectors in HPLC ........................................................................................... 61
4.1.4.1 UV detection ............................................................................................................. 61
4.1.4.2 Coulometric electrode array detection ...................................................................... 63
4.1.5 Liquid chromatography-mass spectrometry ..................................................... 66
4.1.5.1 Ion trap electrospray mass spectrometry ................................................................... 67
4.1.5.2 Mode of analysis ....................................................................................................... 69
4.1.6 Sample preparation techniques ........................................................................ 72
4.1.6.1 Solid phase extraction (SPE) .................................................................................... 72
4.1.6.2 Accelerated solvent extraction (ASE) ....................................................................... 73
4.1.6.3 Ultrasound-assisted extraction (UAE) ...................................................................... 75
5 METHOD DEVELOPMENT ...................................................................................... 78
5.1.1 Reagents and chemicals ................................................................................... 78
5.1.2 Analysis of standard solution ........................................................................... 79
5.1.2.1 Internal standard ....................................................................................................... 79
5.1.2.2 Stationary phase ........................................................................................................ 79
Table of contents
3
5.1.2.3 Mobile phase ............................................................................................................ 79
5.1.3 UV detection ..................................................................................................... 81
5.1.3.1 Instrumentation ......................................................................................................... 81
5.1.3.2 Selection of optimum wavelength ............................................................................ 81
5.1.4 CEAD ............................................................................................................... 83
5.1.4.1 Instrumentation ......................................................................................................... 83
5.1.4.2 Selection of optimum cell potential .......................................................................... 84
5.1.5 ESI-MS ............................................................................................................. 84
5.1.5.1 Instrumentation ......................................................................................................... 84
5.1.5.2 Optimization of instrumental parameters .................................................................. 85
5.1.5.3 Optimization of MRM mode .................................................................................... 86
5.1.6 Calibration curves, repeatability, linearity and LOD ...................................... 88
6 SAMPLE PREPARATION ......................................................................................... 89
6.1 EXPERIMENTAL .......................................................................................................... 90
6.1.1 Reagents, standards and solutions ................................................................... 90
6.1.2 Validation of instrumental method ................................................................... 90
6.1.3 Sample preparation methods ............................................................................ 90
6.1.3.1 Hydrolytic extraction methods .................................................................................. 91
6.1.3.2 Non-hydrolytic extraction methods .......................................................................... 94
6.1.3.3 Qualitative analysis ................................................................................................... 96
6.1.3.4 Quantitative analysis ................................................................................................. 96
6.1.4 Results and discussion ...................................................................................... 96
6.1.4.1 ASE extraction .......................................................................................................... 97
6.1.4.2 Ultrasonication.......................................................................................................... 99
6.1.4.3 Effect of ultrasonication on extraction .................................................................... 100
6.2 CONCLUSION ............................................................................................................ 101
7 ALPHA LIPOIC ACID IN DIETARY SUPPLEMENTS ....................................... 102
7.1 REAGENTS AND CHEMICALS ..................................................................................... 102
7.2 PREPARATION OF SOLUTIONS .................................................................................... 102
7.2.1 Stock solutions ................................................................................................ 102
7.2.2 Dietary supplements ....................................................................................... 103
7.2.3 Mobile phase .................................................................................................. 103
7.3 SAMPLE PREPARATION .............................................................................................. 103
7.4 HPLC-CEAD ........................................................................................................... 106
7.5 HPLC-UV ................................................................................................................ 106
7.6 HPLC-ESI-MS ......................................................................................................... 106
7.7 VALIDATION OF METHODS ........................................................................................ 107
7.8 QUANTITATIVE ANALYSIS ......................................................................................... 107
7.8.1 External calibration curve .............................................................................. 107
Table of contents
4
7.8.2 Standard addition ........................................................................................... 107
7.9 RESULTS AND DISCUSSION ........................................................................................ 108
7.9.1 Calibration, linearity, limit of detection and repeatability ............................. 108
7.9.2 Determination of α-LA in dietary supplements ............................................... 108
8 ALPHA LIPOIC ACID IN FOODSTUFFS ............................................................. 112
8.1 REAGENTS AND CHEMICALS ..................................................................................... 112
8.2 PREPARATION OF SOLUTIONS .................................................................................... 112
8.3 SAMPLES ................................................................................................................... 112
8.4 SAMPLE PREPARATION .............................................................................................. 113
8.5 HPLC-CEAD ........................................................................................................... 114
8.6 HPLC-ESI-MS ......................................................................................................... 114
8.7 VALIDATION OF METHODS ........................................................................................ 115
8.8 QUALITATIVE ANALYSIS ........................................................................................... 115
8.9 QUANTITATIVE ANALYSIS ......................................................................................... 116
8.10 RESULTS AND DISCUSSION ................................................................................... 117
8.10.1 Calibration, linearity, limit of detection and precision .................................. 117
8.10.2 Storage stability .............................................................................................. 118
8.10.3 Alpha lipoic acid in food ................................................................................ 118
8.10.4 Conclusion ...................................................................................................... 120
9 REFERENCES ........................................................................................................... 122
5
LIST OF FIGURES
FIGURE 1: ALPHA LIPOIC ACID (A) CHEMICAL STRUCTURE; (B) SPACE FILLING MODEL ........................... 22
FIGURE 2: STRUCTURE OF ALPHA LIPOIC ACID LINKED WITH THE LYSINE RESIDUES ................................ 25
FIGURE 3: SCHEMATIC REPRESENTATION OF THE REACTIONS CONDUCTED BY ALPHA LIPOIC ACID
WORKING AS A COFACTOR IN PYRUVATE DEHYDROGENASE COMPLEX ........................................... 26
FIGURE 4: SCHEMATIC REPRESENTATION OF RESEARCH WORK ............................................................... 54
FIGURE 5: CALCULATION OF RESOLUTIONS FOR TWO ADJACENT BANDS 1 AND 2 .................................... 56
FIGURE 6: SCHEMATIC REPRESENTATION OF A TYPICAL HPLC SYSTEM .................................................. 59
FIGURE 7: CHEMISTRY OF BONDED-PHASE PACKINGS. [A] REACTION OF SURFACE SILANOL WITH
CHLORODIMETHYLSILANE; [B] REACTION OF SURFACE SILANOLS WITH TRIFUNCTIONAL SILANE;
[C] REACTION OF SURFACE SILANOLS WITH TRIFUNCITONAL ALKOXYSILANE ............................... 61
FIGURE 8: SCHEMATIC PRESENTATION OF A TYPICAL UV DETECTOR ...................................................... 62
FIGURE 9: SCHEMATIC REPRESENTATION OF A TYPICAL COULOMETRIC ELECTRODE ARRAY CELL. (A)
CROSS SECTION OF CELL SHOWING EFFICIENCY WITH CLOSE TO 100% OF THE ANALYTE BEING
MEASURED; (B) CROSS SECTION THROUGH A DUAL COULOMETRIC ELECTRODE, TAKEN FROM
PROGRESS IN HPLC-HPCE, VOL 6, 1997 PP 18 ............................................................................. 64
FIGURE 10: COULOMETRIC ELECTRODE ARRAY CELL. (A) FOUR SERIALLY PLACED FLOW-THROUGH
GRAPHITE ELECTRODES; (B) RESOLUTION OF A COMPOUND ACROSS THE ARRAY AT ITS ELUTION
TIME AND CONSTRUCTION OF HYDRODYNAMIC VOLTAMMOGRAMS (HDV); TAKEN FROM PROGRESS
IN HPLC-HPCE, VOL 6, 1997 PP 30 ............................................................................................... 66
FIGURE 11: SCHEMATIC REPRESENTATION OF ATMOSPHERIC PRESSURE INTERFACE-ELECTROSPRAY
IONIZATION (API-ESI) MASS SPECTROMETRIC SYSTEM; MODIFIED FROM HCT/ESQUIRE SERIES
USER MANUAL, VERSION 1.1 ........................................................................................................ 68
FIGURE 12: SCHEMATIC PRESENTATION OF A SOLID PHASE-EXTRACTION COLUMN ................................. 73
FIGURE 13: KEY OPERATING FEATURES OF ASE 100; TAKEN DIONEX OPERATOR MANUAL OF ASE 100 74
FIGURE 14: AN ULTRASONIC BATH (SONICATOR) .................................................................................... 76
FIGURE 15: CALIBRATION CURVES FOR ALPHA LIPOIC ACID MEASURED AT DIFFERENT WAVELENGTHS .. 83
FIGURE 16: CURRENT/VOLTAGE CURVES OF ALPHA LIPOIC ACID AND BISPHENOL A ............................... 84
FIGURE 17: OPTIMIZATION OF MRM MODE FOR SENSITIVE QUANTITATION OF ALPHA LIPOIC ACID ........ 87
FIGURE 18: MASS SPECTRUM OF ALPHA LIPOIC ACID FRAGMENT ION AT M/Z 171 ([α-LA-H-H2S]−) AND
FOR INTERNAL STANDARD BPA AT M/Z 227 ([BPA-H]− USING MRM MODE. ................................. 87
FIGURE 19: SCHEMATIC REPRESENTATION OF DIFFERENT SAMPLE PREPARATION METHODS ................... 91
FIGURE 20: SCHEMATIC REPRESENTATION OF ACID HYDROLYSIS ............................................................ 92
FIGURE 21: SCHEMATIC PRESENTATION OF BASE HYDROLYSIS ............................................................... 93
FIGURE 22: SCHEMATIC REPRESENTATION OF ENZYMATIC HYDROLYSIS ................................................. 94
FIGURE 23: SCHEMATIC PRESENTATION OF ACCELERATED SOLVENT EXTRACTION ................................. 95
FIGURE 24: SCHEMATIC PRESENTATION OF ULTRASOUND ASSISTED EXTRACTION .................................. 96
FIGURE 25: COMPARISON OF DIFFERENT EXTRACTION SOLVENTS USED IN ASE ...................................... 98
6
FIGURE 26: EFFECT OF TEMPERATURE ON ASE OF ALPHA LIPOIC ACID ................................................... 98
FIGURE 27: OPTIMIZATION OF SONICATION TIME .................................................................................. 100
FIGURE 28: MS SPECTRA OF LIPOAMIDE IN THE POSITIVE SCAN MODE .................................................. 101
FIGURE 29: DIFFERENT DIETARY SUPPLEMENTS CONTAINING ALPHA LIPOIC ACID ................................ 102
FIGURE 30: REPRESENTATIVE CHROMATOGRAMS OF ALPHA LIPOIC ACID IN SUPPLEMENT ‘A’ USING HIGH
PERFORMANCE LIQUID CHROMATOGRAPHY WITH (A) UV AT 215 NM, (B) COULOMETRIC
ELECTRODE ARRAY AND (C) ESI-MS DETECTION. ALPHA LIPOIC ACID: ALPHA LIPOIC ACID
FRAGMENT ION (M/Z 171); BPA: BISPHENOL A (M/Z 227) ............................................................ 109
FIGURE 31: STANDARD ADDITION CURVE FOR THE DETERMINATION OF ALPHA LIPOIC ACID IN
SUPPLEMENT ‘F’ USING HPLC WITH UV DETECTION MODE ......................................................... 111
FIGURE 32: COULOMETRIC ELECTRODE ARRAY CHROMATOGRAM OF UNSPIKED DRIED EGG POWDER
AFTER SONICATION ...................................................................................................................... 116
FIGURE 33: STANDARD ADDITION CURVE FOR THE DETERMINATION OF ALPHA LIPOIC ACID IN FRESH EGG
YOLK USING HPLC WITH COULOMETRIC ELECTRODE ARRAY DETECTION ................................... 117
FIGURE 34: HPLC-CEAD CHROMATOGRAMS OF ALPHA LIPOIC ACID IN DRIED EGG POWDER: (A)
UNSPIKED, (B) SPIKED. Α–LA: ALPHA LIPOIC ACID, BPA= BISPHENOL A ................................... 119
FIGURE 35: HPLC-MS CHROMATOGRAM OF UNSPIKED DRIED EGG SHOWING THE EXTRACTED IONS OF
ALPHA LIPOIC ACID (M/Z 171) AND BPA (M/Z 227) ....................................................................... 119
7
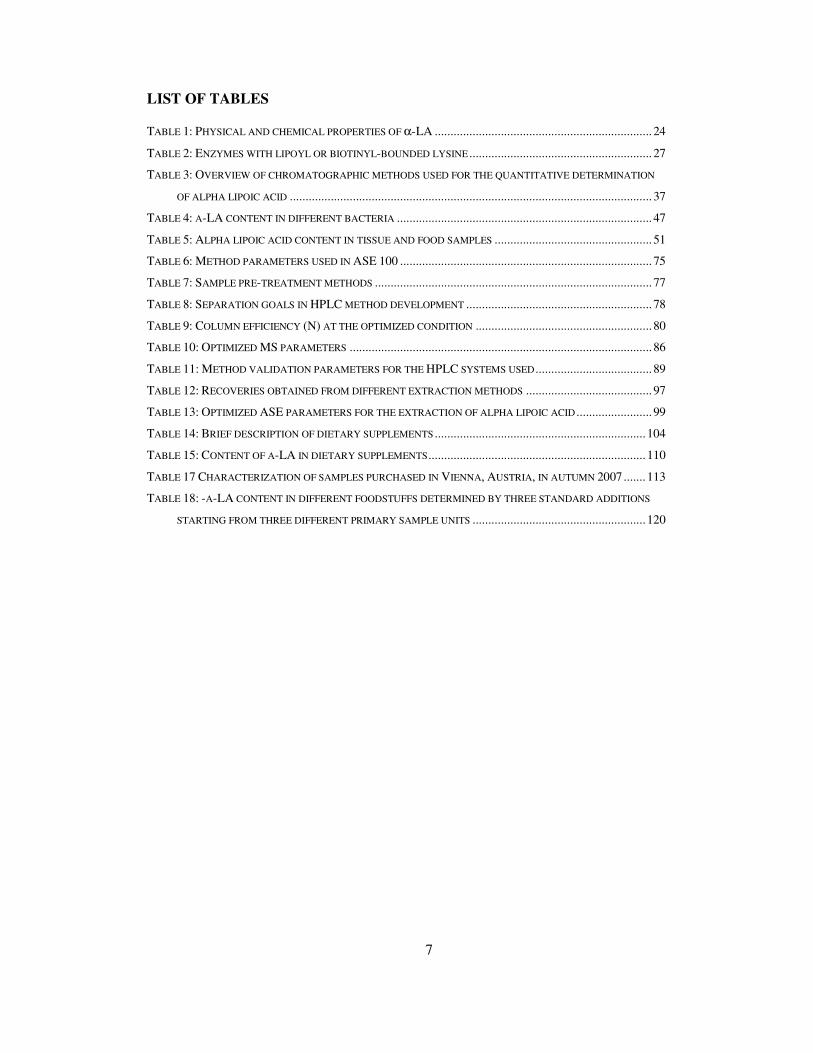
LIST OF TABLES
TABLE 1: PHYSICAL AND CHEMICAL PROPERTIES OF α-LA ..................................................................... 24
TABLE 2: ENZYMES WITH LIPOYL OR BIOTINYL-BOUNDED LYSINE .......................................................... 27
TABLE 3: OVERVIEW OF CHROMATOGRAPHIC METHODS USED FOR THE QUANTITATIVE DETERMINATION
OF ALPHA LIPOIC ACID ................................................................................................................... 37
TABLE 4: Α-LA CONTENT IN DIFFERENT BACTERIA ................................................................................. 47
TABLE 5: ALPHA LIPOIC ACID CONTENT IN TISSUE AND FOOD SAMPLES .................................................. 51
TABLE 6: METHOD PARAMETERS USED IN ASE 100 ................................................................................ 75
TABLE 7: SAMPLE PRE-TREATMENT METHODS ........................................................................................ 77
TABLE 8: SEPARATION GOALS IN HPLC METHOD DEVELOPMENT ........................................................... 78
TABLE 9: COLUMN EFFICIENCY (N) AT THE OPTIMIZED CONDITION ........................................................ 80
TABLE 10: OPTIMIZED MS PARAMETERS ................................................................................................ 86
TABLE 11: METHOD VALIDATION PARAMETERS FOR THE HPLC SYSTEMS USED ..................................... 89
TABLE 12: RECOVERIES OBTAINED FROM DIFFERENT EXTRACTION METHODS ........................................ 97
TABLE 13: OPTIMIZED ASE PARAMETERS FOR THE EXTRACTION OF ALPHA LIPOIC ACID ........................ 99
TABLE 14: BRIEF DESCRIPTION OF DIETARY SUPPLEMENTS ................................................................... 104
TABLE 15: CONTENT OF Α-LA IN DIETARY SUPPLEMENTS ..................................................................... 110
TABLE 17 CHARACTERIZATION OF SAMPLES PURCHASED IN VIENNA, AUSTRIA, IN AUTUMN 2007 ....... 113
TABLE 18: -Α-LA CONTENT IN DIFFERENT FOODSTUFFS DETERMINED BY THREE STANDARD ADDITIONS
STARTING FROM THREE DIFFERENT PRIMARY SAMPLE UNITS ....................................................... 120
8
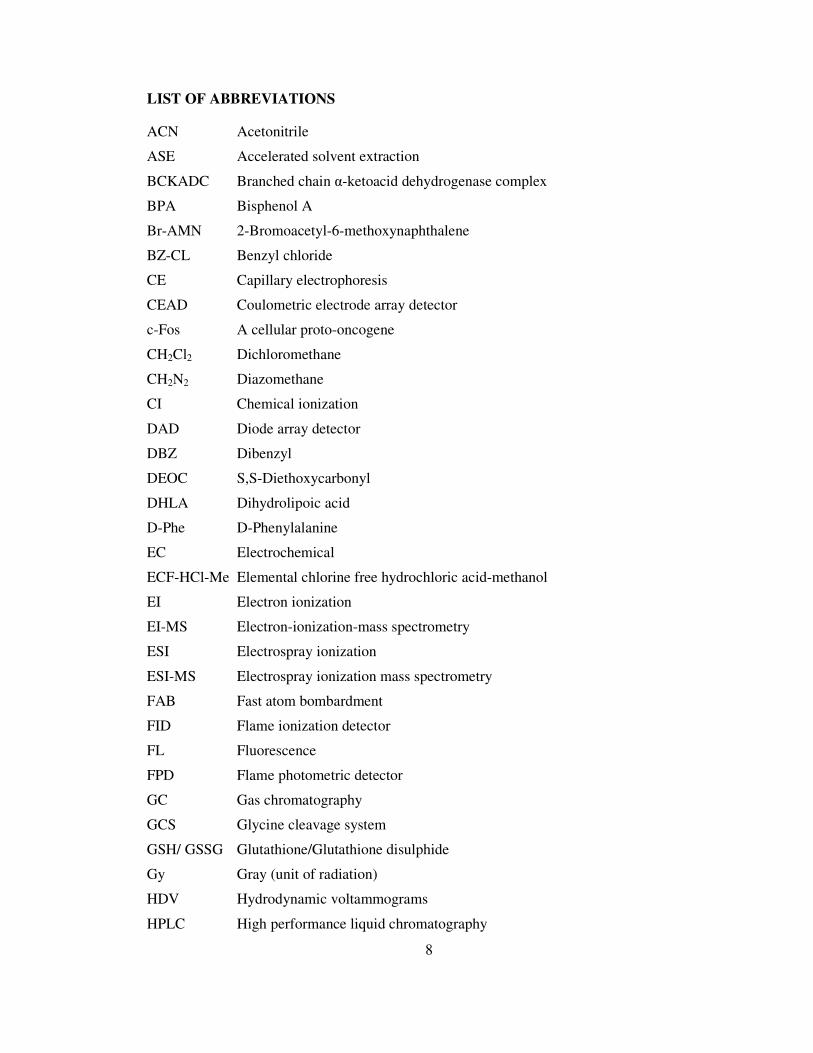
LIST OF ABBREVIATIONS
ACN Acetonitrile
ASE Accelerated solvent extraction
BCKADC Branched chain α-ketoacid dehydrogenase complex
BPA Bisphenol A
Br-AMN 2-Bromoacetyl-6-methoxynaphthalene
BZ-CL Benzyl chloride
CE Capillary electrophoresis
CEAD Coulometric electrode array detector
c-Fos A cellular proto-oncogene
CH2Cl2 Dichloromethane
CH2N2 Diazomethane
CI Chemical ionization
DAD Diode array detector
DBZ Dibenzyl
DEOC S,S-Diethoxycarbonyl
DHLA Dihydrolipoic acid
D-Phe D-Phenylalanine
EC Electrochemical
ECF-HCl-Me Elemental chlorine free hydrochloric acid-methanol
EI Electron ionization
EI-MS Electron-ionization-mass spectrometry
ESI Electrospray ionization
ESI-MS Electrospray ionization mass spectrometry
FAB Fast atom bombardment
FID Flame ionization detector
FL Fluorescence
FPD Flame photometric detector
GC Gas chromatography
GCS Glycine cleavage system
GSH/ GSSG Glutathione/Glutathione disulphide
Gy Gray (unit of radiation)
HDV Hydrodynamic voltammograms
HPLC High performance liquid chromatography
9
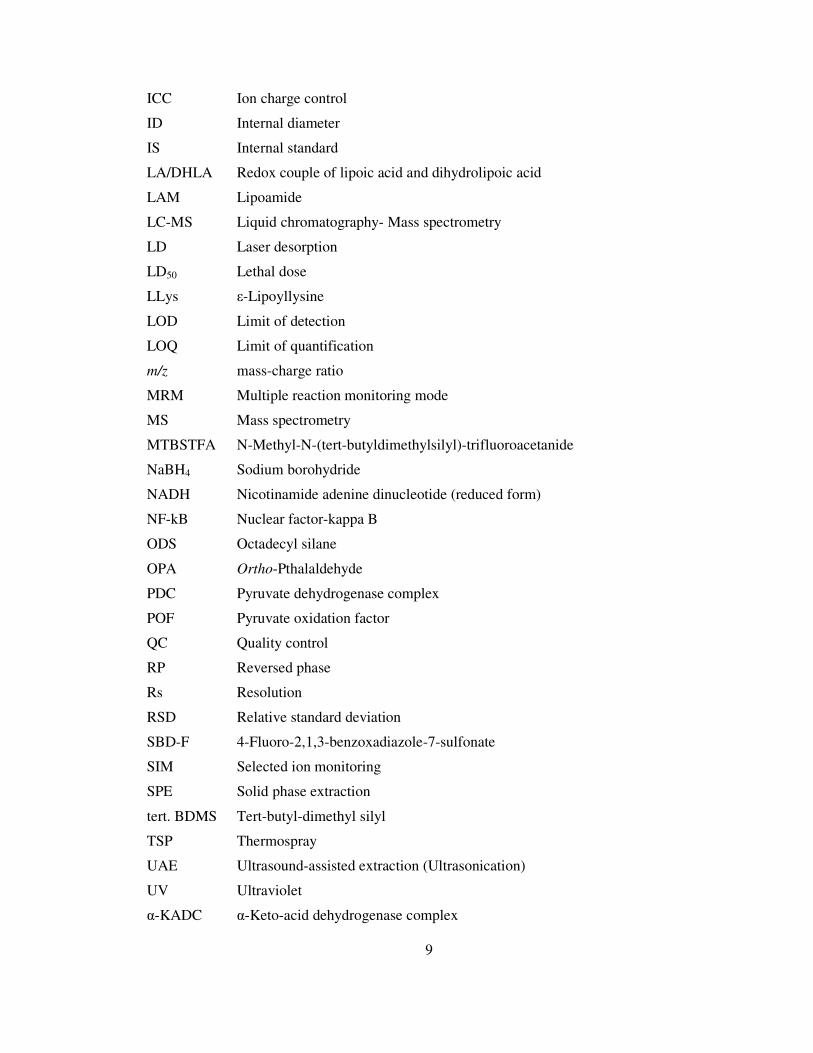
ICC Ion charge control
ID Internal diameter
IS Internal standard
LA/DHLA Redox couple of lipoic acid and dihydrolipoic acid
LAM Lipoamide
LC-MS Liquid chromatography- Mass spectrometry
LD Laser desorption
LD50 Lethal dose
LLys ε-Lipoyllysine
LOD Limit of detection
LOQ Limit of quantification
m/z mass-charge ratio
MRM Multiple reaction monitoring mode
MS Mass spectrometry
MTBSTFA N-Methyl-N-(tert-butyldimethylsilyl)-trifluoroacetanide
NaBH4 Sodium borohydride
NADH Nicotinamide adenine dinucleotide (reduced form)
NF-kB Nuclear factor-kappa B
ODS Octadecyl silane
OPA Ortho-Pthalaldehyde
PDC Pyruvate dehydrogenase complex
POF Pyruvate oxidation factor
QC Quality control
RP Reversed phase
Rs Resolution
RSD Relative standard deviation
SBD-F 4-Fluoro-2,1,3-benzoxadiazole-7-sulfonate
SIM Selected ion monitoring
SPE Solid phase extraction
tert. BDMS Tert-butyl-dimethyl silyl
TSP Thermospray
UAE Ultrasound-assisted extraction (Ultrasonication)
UV Ultraviolet
α-KADC α-Keto-acid dehydrogenase complex

10
α-KGDC α-Ketoglutarate dehydrogenase complex
α-LA α-Lipoic acid
11
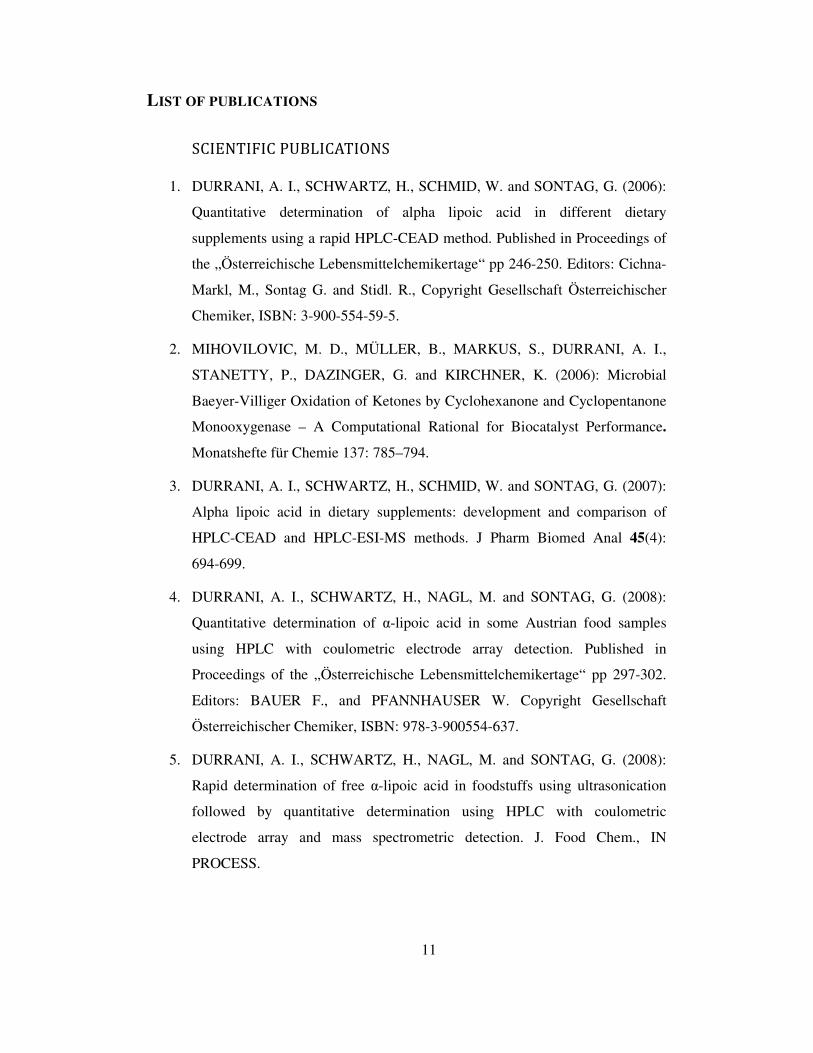
LIST OF PUBLICATIONS
SCIENTIFIC PUBLICATIONS
1. DURRANI, A. I., SCHWARTZ, H., SCHMID, W. and SONTAG, G. (2006):
Quantitative determination of alpha lipoic acid in different dietary
supplements using a rapid HPLC-CEAD method. Published in Proceedings of
the „Österreichische Lebensmittelchemikertage“ pp 246-250. Editors: Cichna-
Markl, M., Sontag G. and Stidl. R., Copyright Gesellschaft Österreichischer
Chemiker, ISBN: 3-900-554-59-5.
2. MIHOVILOVIC, M. D., MÜLLER, B., MARKUS, S., DURRANI, A. I.,
STANETTY, P., DAZINGER, G. and KIRCHNER, K. (2006): Microbial
Baeyer-Villiger Oxidation of Ketones by Cyclohexanone and Cyclopentanone
Monooxygenase – A Computational Rational for Biocatalyst Performance.
Monatshefte für Chemie 137: 785–794.
3. DURRANI, A. I., SCHWARTZ, H., SCHMID, W. and SONTAG, G. (2007):
Alpha lipoic acid in dietary supplements: development and comparison of
HPLC-CEAD and HPLC-ESI-MS methods. J Pharm Biomed Anal 45(4):
694-699.
4. DURRANI, A. I., SCHWARTZ, H., NAGL, M. and SONTAG, G. (2008):
Quantitative determination of α-lipoic acid in some Austrian food samples
using HPLC with coulometric electrode array detection. Published in
Proceedings of the „Österreichische Lebensmittelchemikertage“ pp 297-302.
Editors: BAUER F., and PFANNHAUSER W. Copyright Gesellschaft
Österreichischer Chemiker, ISBN: 978-3-900554-637.
5. DURRANI, A. I., SCHWARTZ, H., NAGL, M. and SONTAG, G. (2008):
Rapid determination of free α-lipoic acid in foodstuffs using ultrasonication
followed by quantitative determination using HPLC with coulometric
electrode array and mass spectrometric detection. J. Food Chem., IN
PROCESS.
12
ORAL PRESENTATION
1. DURRANI, A. I. (2007): Alpha lipoic acid in dietary supplements: Development
and comparison of HPLC-CEAD and HPLC-ESI-MS methods. 3rd International
Symposium on Recent Advances in Food Analysis, Prague, Czech Republic.
POSTER PRESENTATIONS
1. DURRANI, A. I., SCHWARTZ, H., SCHMID, W. and SONTAG, G. (2006):
Quantitative determination of alpha lipoic acid in different dietary
supplements using a rapid HPLC-CEAD method. Presented at the Austrian
Food Chemistry Days (Österreichische Lebensmittelchemikertage) Vienna,
Austria.
2. DURRANI, A. I., SCHWARTZ, H., SCHMID, W. and SONTAG, G. (2007):
Quantitative determination of alpha lipoic acid in dietary supplements using
HPLC with different detection modes. International Congress band 55th
Annual Meeting of the Society for Medicinal Plant Research, Graz, Austria.
3. DURRANI, A. I., SCHWARTZ, H., SCHMID, W. and SONTAG, G. (2007):
Development and comparison of HPLC-CEAD and HPLC-ESI-MS methods
to determine alpha lipoic acid in dietary supplements. Euro-analysis XIV,
Antwerp, Belgium.
4. DURRANI, A. I., SCHWARTZ, H., SCHMID, W. and SONTAG, G (2007):
Quantitative analysis of α-lipoic acid in egg yolk using HPLC with CEAD and
ESI-MS detection modes. 3rd International Symposium on Recent Advances in
Food Analysis, Prague, Czech Republic.
5. DURRANI, A. I., SCHWARTZ, H., NAGL, M. and SONTAG, G. (2008):
Determination of α-lipoic acid in food and supplements. First Symposium of
the Vienna Research Platform of Nutrition and Food Sciences. Vienna,
Austria.
6. DURRANI, A. I., SCHWARTZ, H., NAGL, M. and SONTAG, G. (2008):
Quantitative determination of α-lipoic acid in some Austrian food samples

13
using HPLC with coulometric electrode array detection. Österreichische
Lebensmittelchemikertage Eisenstadt, Austria.
14
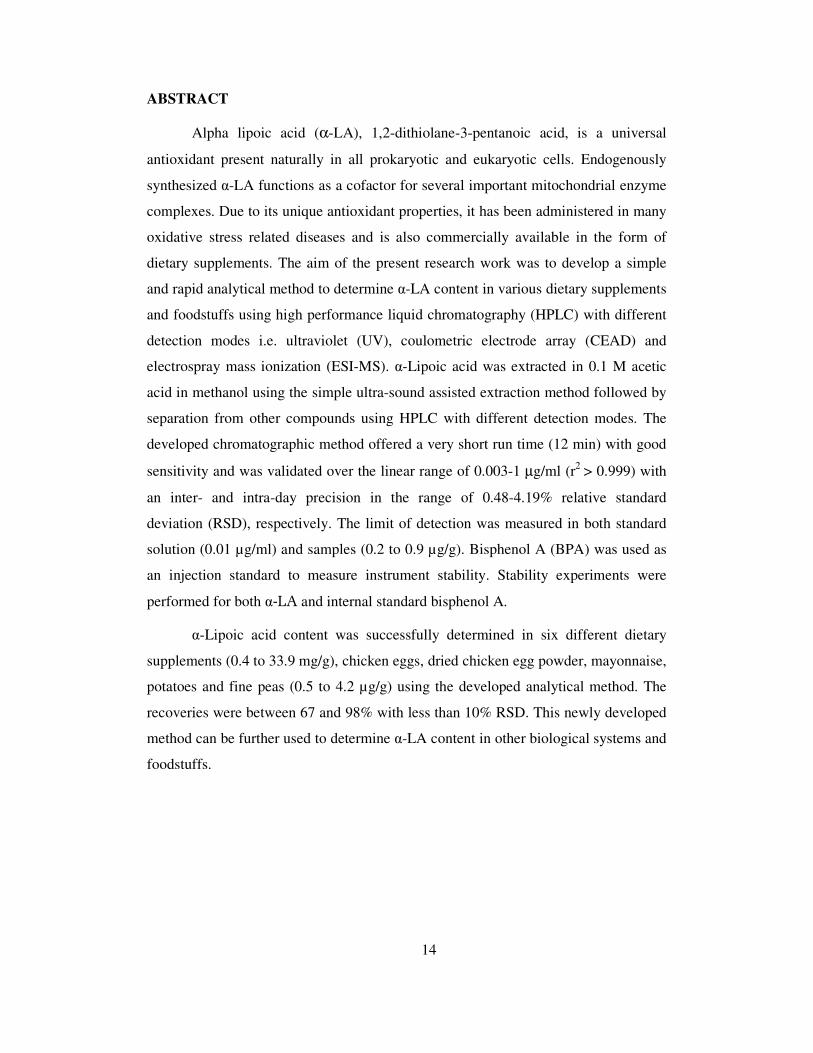
ABSTRACT
Alpha lipoic acid (α-LA), 1,2-dithiolane-3-pentanoic acid, is a universal
antioxidant present naturally in all prokaryotic and eukaryotic cells. Endogenously
synthesized α-LA functions as a cofactor for several important mitochondrial enzyme
complexes. Due to its unique antioxidant properties, it has been administered in many
oxidative stress related diseases and is also commercially available in the form of
dietary supplements. The aim of the present research work was to develop a simple
and rapid analytical method to determine α-LA content in various dietary supplements
and foodstuffs using high performance liquid chromatography (HPLC) with different
detection modes i.e. ultraviolet (UV), coulometric electrode array (CEAD) and
electrospray mass ionization (ESI-MS). α-Lipoic acid was extracted in 0.1 M acetic
acid in methanol using the simple ultra-sound assisted extraction method followed by
separation from other compounds using HPLC with different detection modes. The
developed chromatographic method offered a very short run time (12 min) with good
sensitivity and was validated over the linear range of 0.003-1 µg/ml (r2 > 0.999) with
an inter- and intra-day precision in the range of 0.48-4.19% relative standard
deviation (RSD), respectively. The limit of detection was measured in both standard
solution (0.01 µg/ml) and samples (0.2 to 0.9 µg/g). Bisphenol A (BPA) was used as
an injection standard to measure instrument stability. Stability experiments were
performed for both α-LA and internal standard bisphenol A.
α-Lipoic acid content was successfully determined in six different dietary
supplements (0.4 to 33.9 mg/g), chicken eggs, dried chicken egg powder, mayonnaise,
potatoes and fine peas (0.5 to 4.2 µg/g) using the developed analytical method. The
recoveries were between 67 and 98% with less than 10% RSD. This newly developed
method can be further used to determine α-LA content in other biological systems and
foodstuffs.
15
ZUSAMMENFASSUNG
Alpha Liponsäure, 1,2 Dithiolan-3-pentansäure, ist ein universelles
Antioxidans, das natürlich in eukaryontischen und porkaryontischen Zellen
vorkommt. Endogen erzeugte α-Liponsäure fungiert als Cofaktor für verschiedene
wichtige mitochondriale Enzymkomplexe. Aufgrund ihrer besonderen antioxidativen
Eigenschaften wird sie bei Krankheiten, die auf oxidativem Stress beruhen,
eingenommen und ist auch in kommerziell erhältlichen Nahrungsergänzungsmitteln in
höherer Konzentration enthalten. Das Ziel der vorliegenden Arbeit war, eine einfache
als auch schnelle analytische Methode basierend auf der Hochleistungs-flüssig-
chromatographie (HPLC) in Kombination mit Ultraviolett- (UV), coulometrischer
Elektrodenarray (CEAD) und massenpektrometrischer (ESI-MS) Detektion zu
entwickeln. α-Liponsäure wurde mit 0.1 M Essigsäure in Methanol im Ultraschall aus
den Proben extrahiert, von weiteren Substanzen mittels HPLC getrennt und
anschließend detektiert. Die neu entwickelte chromatographische Methode zeichnet
sich durch eine sehr kurze Laufzeit (12 min) mit verbesserter Sensitivität aus und
wurde über einen linearen Bereich von 0,003 bis 1 µg α−Liponsäure/ml (r2>0,999)
mit einer „Inter-day bzw. Intra-day“ Reproduzierbarkeit von 0,48 bis 4,19% relativer
Standardabweichung (RSD) validiert. Die Nachweisgrenzen (S/N=3) wurden in einer
Standardlösung (1 ng/mL) als auch in Proben (0,2 - 0,9 µg/g) ermittelt. Bisphenol A
(BPA) wurde als interner Standard zur Bewertung der Stabilität des Messinstrumentes
herangezogen.
Der Gehalt an α-Liponsäure wurde sowohl in sechs verschiedenen Nahrungs-
ergänzungsmitteln als auch in Hühnereiern, Trockeneipulver, Mayonnaise, Kartoffeln
und Erbsen erfolgreich mittels der neu entwickelten Analysemethode gemessen und
lag im Bereich von 0,4 bis 33,9 mg/g in Nahrungsergänzungsmitteln und 0,5 bis 4,2
µg/g in Nahrungsmitteln. Die Wiederfindung varierte abhängig von der Probenmatrix
zwischen 67 bis 98% mit einer RSD < 10%. Diese neu entwickelte Methode eignet
sich für die Quantifizierung von α-Liponsäure in Nahrungsmitteln als auch in anderen
biologischen Proben.
Introduction
16
1 INTRODUCTION
First chapter is based upon a brief introduction of each following chapter to
give an overview of present research work. This summarized detail will help to better
understand the basis and importance of this research project.
1.1 Background
In addition to other essential nutritional components, plants contain
antioxidants. These natural occurring antioxidants have received considerable interest
because of their potential safety, nutritional and therapeutic effects. Alpha lipoic acid
(α-LA), or 1,2-dithiolane-3-pentanoic acid, is a natural antioxidant present in
prokaryotic and eukaryotic cells. In the human body, it is linked to lysine residues and
acts as a cofactor in different multi-enzyme complexes. It has been characterized as a
universal antioxidant as it functions both in membranes and in aqueous phases and
plays an important role in the synergism of antioxidants by directly recycling vitamin
C, glutathione and coenzyme Q10 and indirectly recycling vitamin E.
Alpha lipoic acid is mainly present in free or protein-bound form and is of
great interest in the field of food chemistry with reference to its precise determination
in different matrices. Different analytical methods have been developed so far to
determine α-LA content in biological samples (tissue and plasma) and various
foodstuffs both from animal and plant sources. These methods include the use of
different extraction methods to improve the recovery and of different analytical
methods to improve the sensitivity of measurements.
Second chapter starts with a brief discussion on the structure of α-LA, its
physical and chemical properties and then leads to a comprehensive literature review
which consists of following two main parts:
1. Biological and therapeutic functions of α-LA
2. Previously reported analytical/chromatographic methods for the quantitation
of α-LA and their applications in various samples
Here, it is important to note that α-LA is present in two forms, free α-LA and
protein-bound α-LA. Alpha lipoic acid is capable of performing different functions in
Introduction
17
both forms. Different extraction methods have been developed and validated to
determine α-LA in protein-bound and total (free + protein-bound), however there is
no specific method to determine free α-LA in supplements and foodstuffs.
1.2 Research questions
According to the literature survey, different analytical methods were used to
determine α-LA in different sample matrices; however most of these methods faced
limitations either in terms of recoveries or sensitivities. This required the development
of a rapid and reliable method to determine α-LA in different matrices with better
sensitivity. Among the different available forms, free α-LA is of more interest due to
its more pharmacological and therapeutic function. Unfortunately, very few analytical
data are available for the quantitative determination of free α-LA in different sample
matrices such as pharmaceutical preparates, dietary supplements and also in
foodstuffs.
High performance liquid chromatography (HPLC) is one of the most widely
used analytical techniques in the determination of biologically active compounds in
different sample matrices and hence can be used and further developed to determine
α-LA.
Despite the fact that α-LA is a natural compound and is present in most
foodstuffs, it is also commercially available in the forms of pharmaceutical preparates
and dietary supplements. In past, few analytical methods were developed to analyze
α-LA in above matrices using HPLC with different detection modes. However, these
methods require destructive extraction methods and/or tedious derivatization steps for
ultra violet (UV) or fluorescence (FL) detection. Intensive extraction conditions
usually result in the loss of free α-LA and hence give only a rough estimate of bound
α-LA content. High performance liquid chromatography coupled with mass
spectrometry (HPLC-MS) was also used to determine α-LA in different matrices,
however there was still a need to improve the conditions for better sensitivities.
Introduction
18
1.3 Aim of the research
The aim of the present research work was to develop a non-destructive method
to extract free α-LA from different matrices followed by precise determination using
high performance liquid chromatography with different detection modes.
Third chapter gives a brief sketch of the experimental work to be followed in
the next pages of this thesis and can be easily divided into following two main parts:
1. Development and validation of a rapid and reliable analytical method to
determine free α-LA content with better sensitivity
2. Determination of free α-LA in various dietary supplements and foodstuffs by
successfully applying the developed analytical method
1.4 Theoretical background
Different instruments were used in the experimental work and are briefly
discussed in the following chapter (chapter: 4). It includes a basic introduction to high
performance liquid chromatography with an insight to three different detectors used in
the experiments i.e. ultraviolet (UV), coulometric electrode array (CEAD) and
electrospray mass ionization (ESI-MS). It also gives a basic introduction to three
different set-ups used in the sample preparation namely solid-phase extraction,
accelerated solvent extraction and ultra-sound assisted extraction.
1.5 Method development
In chapter 5, an analytical method was developed to determine α-LA content
using high performance liquid chromatography (HPLC) with different detection
modes i.e. ultraviolet (UV), coulometric electrode array detection (CEAD) and mass
spectrometric detection with electrospray ionization (ESI-MS). Newly developed
method required short and simple sample preparation step with a new approach and
gave short run time with better sensitivity and selectivity. For HPLC-UV, different
wavelengths were checked for better sensitivity despite the fact α-LA is a weak UV
absorbing compound. We were able to determine α-LA at 215 nm with better
sensitivity then the one cited in the literature i.e. 208 nm and 332 nm.
Introduction
19
In HPLC-ESI-MS, electrospray ionization mode gave more possibilities than
the conventional single quadruple/ ion trap detection mode. A more selective and
sensitive detection method was developed using electrospray mass ionization in the
multiple reaction monitoring mode (MRM) by first fragmenting the deprotonated
molecular ion (m/z 205) without being isolated, and then isolating the fragment ion
(m/z 171). Hence, both the original fragment ion (the one created in the source) and
the fragment ion created from the deprotonated molecular ion in the trap contributed
to the total ion current and the corresponding peak area was used for quantification.
The approach gave higher sensitivity then all the other mass spectrometric methods
cited in the literature.
In HPLC-CEAD, half wave potential was used as cell potential to determine
α-LA content which is again a new approach for the determination of α-LA. This new
approach discarded the extensive cleaning of the cells as was previously done with the
conventional electrochemical cells while determining α-LA content and also provided
a decreased noise of the detector and a lower detection limit.
1.6 Optimization of sample preparation
Sample preparation is one of the most crucial steps in any analytical method.
Chapter 6 deals with the selection and optimization of this step for the quantitative
determination of α-LA in various samples of complex matrices.
α-Lipoic acid is mainly present in two forms i.e. free and protein-bound form.
The main emphasis of this thesis is to determine free α-LA content in different sample
matrices. Most analytical methods cited in the literature do not differentiate between
these two forms of α-LA and hence do not give a clear overview of its distribution in
the sample matrix. The use of drastic hydrolytic conditions may lead to the
destruction of free α-LA form and hence give merely the information about the bound
form which is also not so stable under the applied conditions and hence the recoveries
are very low.
In this research work, both hydrolytic and non-hydrolytic methods were used
to extract α-LA from the samples under investigation. Acid, base and enzymatic
hydrolytic methods were checked for the recoveries at different conditions. Non-

Introduction
20
hydrolytic methods such as accelerated solvent extraction and ultra-sound assisted
extractions were also applied at different conditions. More detailed information is
given in the chapter 6. Among these methods, ultra-sound assisted extraction was
selected due to its non-destructive nature and less complex extracts. This extraction
method can only extract free α-LA and not the protein-bound form and hence gives a
clear investigation of only one form of α-LA. The results were verified using MS and
the method was further applied to determine the free α-LA in various foodstuffs and
dietary supplements.
1.7 Brief overview of results
In chapter 7, six different dietary supplements, purchased in Austria and
United States, were analyzed for the α-LA content. Only in one supplement, the
experimentally calculated value matched with that of the claimed one. While in rest,
the experimentally calculated values were less than the claimed ones. Standard
addition was performed to eliminate the influence of matrix compounds on the
measurement of α-LA and gave good recovery 96 ± 2.1% (n = 3). The data also
confirmed the results obtained by the external calibration method. The deviation
between the claimed values and the data found could be due to improper handling
during the production of the supplements or degradation of α-LA during storage.
In addition, free α-LA was determined in different foodstuffs using high
performance liquid chromatography with coulometric electrode array detection
(chapter 8). Foodstuffs analyzed included fresh egg yolk, fresh egg white, dried whole
egg powder, boiled egg yolk, boiled egg white, mayonnaise, fresh potatoes and
canned peas. The recoveries were good in all the experiments (70-94%) with good
intra and inter-day repeatabilities. Best source of free α-LA was fresh potatoes (1.5-
4.2 µg/g; 94 ± 4.7% RSD). It was also found in good quantities in dried egg powder
(1.3 µg/g; 92 ±3.8% RSD), fresh egg yolk (0.5-0.9 µg/g; 89 ±4.5% RSD) and also in
young peas (0.5-1 µg/g; 93 ± 5.3% RSD). However α-LA was found to be in low
amount i.e. 0.6 µg/g (recovery: 67 ±7.2% RSD) in mayonnaise and below limit of
detection in other food samples under investigation.

Introduction
21
1.8 Suggestions and recommendations
The developed method was successfully utilized to determine free α-LA
content in different dietary supplements and foodstuffs. The rapidity of the ultra-
sound assisted extraction can be used as such or with some modifications to determine
free α-LA in other foodstuffs and pharmaceutical preparates. The use of coulometric
electrode array detection offers addition advantages being more sensitive and
selective than other conventional detection methods.
Following are some suggestions or recommendations to further extend the
present research work:
1. This method can be used to determine free α-LA in egg and egg-based
products.
2. This method can be used to determine free α-LA content in different
vegetables and vegetable-based foodstuffs.
3. This method can be used to compare the free α-LA content in food obtained
from different regions and also in cooked and raw foodstuffs.
4. Different pharmaceutical preparates and supplements can be investigated for
the available α-LA content.
5. This method when coupled with a specific enzymatic hydrolysis can give
information about both free and protein-bound α-LA content in different
samples.
2 LITERATURE SURVE
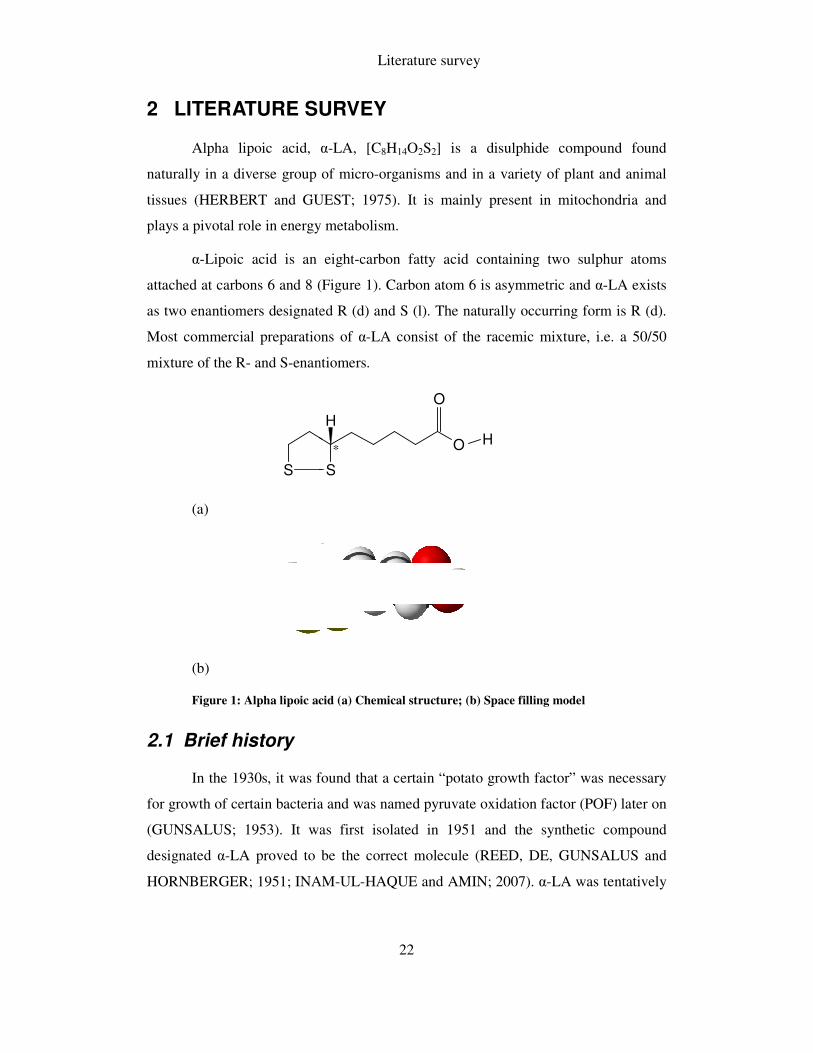
Alpha lipoic acid, α
naturally in a diverse group of micro
tissues (HERBERT and GUEST; 1975)
plays a pivotal role in energy meta
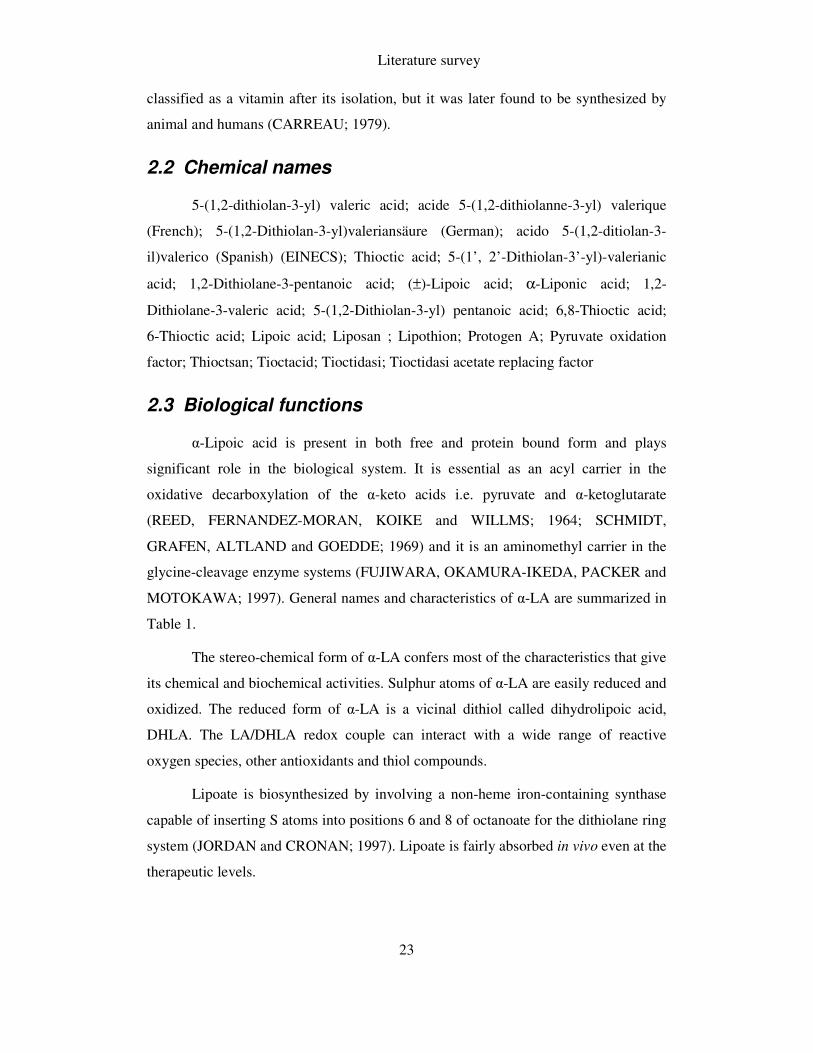
α-Lipoic acid is an eight
attached at carbons 6 and 8 (
as two enantiomers designated R (d) and S (
Most commercial preparations of
mixture of the R- and S-enantiomers.
S
(a)
(b)
Figure 1: Alpha lipoic acid
2.1 Brief history
In the 1930s, it was found that a certain “potato growth factor” was necessary
for growth of certain bacteria
(GUNSALUS; 1953). It was first isolated in 1951
designated α-LA proved to be the correct molecule
HORNBERGER; 1951; INAM
Literature survey
22
SURVEY
, α-LA, [C8H14O2S2] is a disulphide compound
a diverse group of micro-organisms and in a variety of plant and animal
d GUEST; 1975). It is mainly present in mitochondri
role in energy metabolism.
is an eight-carbon fatty acid containing two sulphur atoms
(Figure 1). Carbon atom 6 is asymmetric and α-
as two enantiomers designated R (d) and S (l). The naturally occurring form is R
ommercial preparations of α-LA consist of the racemic mixture, i.e. a 50/50
enantiomers.
H
O
S
O
H
*
ipoic acid (a) Chemical structure; (b) Space filling model
In the 1930s, it was found that a certain “potato growth factor” was necessary
for growth of certain bacteria and was named pyruvate oxidation factor (POF)
. It was first isolated in 1951 and the synthetic compound
LA proved to be the correct molecule (REED, DE, GUNSALUS and
HORNBERGER; 1951; INAM-UL-HAQUE and AMIN; 2007). α-LA was tentatively
is a disulphide compound found
ty of plant and animal
mitochondria and
two sulphur atoms
-LA exists
). The naturally occurring form is R (d).
mixture, i.e. a 50/50
In the 1930s, it was found that a certain “potato growth factor” was necessary
pyruvate oxidation factor (POF) later on
and the synthetic compound
DE, GUNSALUS and
was tentatively
Literature survey
23
classified as a vitamin after its isolation, but it was later found to be synthesized by
animal and humans (CARREAU; 1979).
2.2 Chemical names
5-(1,2-dithiolan-3-yl) valeric acid; acide 5-(1,2-dithiolanne-3-yl) valerique
(French); 5-(1,2-Dithiolan-3-yl)valeriansäure (German); acido 5-(1,2-ditiolan-3-
il)valerico (Spanish) (EINECS); Thioctic acid; 5-(1’, 2’-Dithiolan-3’-yl)-valerianic
acid; 1,2-Dithiolane-3-pentanoic acid; (±)-Lipoic acid; α-Liponic acid; 1,2-
Dithiolane-3-valeric acid; 5-(1,2-Dithiolan-3-yl) pentanoic acid; 6,8-Thioctic acid;
6-Thioctic acid; Lipoic acid; Liposan ; Lipothion; Protogen A; Pyruvate oxidation
factor; Thioctsan; Tioctacid; Tioctidasi; Tioctidasi acetate replacing factor
2.3 Biological functions
α-Lipoic acid is present in both free and protein bound form and plays
significant role in the biological system. It is essential as an acyl carrier in the
oxidative decarboxylation of the α-keto acids i.e. pyruvate and α-ketoglutarate
(REED, FERNANDEZ-MORAN, KOIKE and WILLMS; 1964; SCHMIDT,
GRAFEN, ALTLAND and GOEDDE; 1969) and it is an aminomethyl carrier in the
glycine-cleavage enzyme systems (FUJIWARA, OKAMURA-IKEDA, PACKER and
MOTOKAWA; 1997). General names and characteristics of α-LA are summarized in
Table 1.
The stereo-chemical form of α-LA confers most of the characteristics that give
its chemical and biochemical activities. Sulphur atoms of α-LA are easily reduced and
oxidized. The reduced form of α-LA is a vicinal dithiol called dihydrolipoic acid,
DHLA. The LA/DHLA redox couple can interact with a wide range of reactive
oxygen species, other antioxidants and thiol compounds.
Lipoate is biosynthesized by involving a non-heme iron-containing synthase
capable of inserting S atoms into positions 6 and 8 of octanoate for the dithiolane ring
system (JORDAN and CRONAN; 1997). Lipoate is fairly absorbed in vivo even at the
therapeutic levels.
Literature survey
24
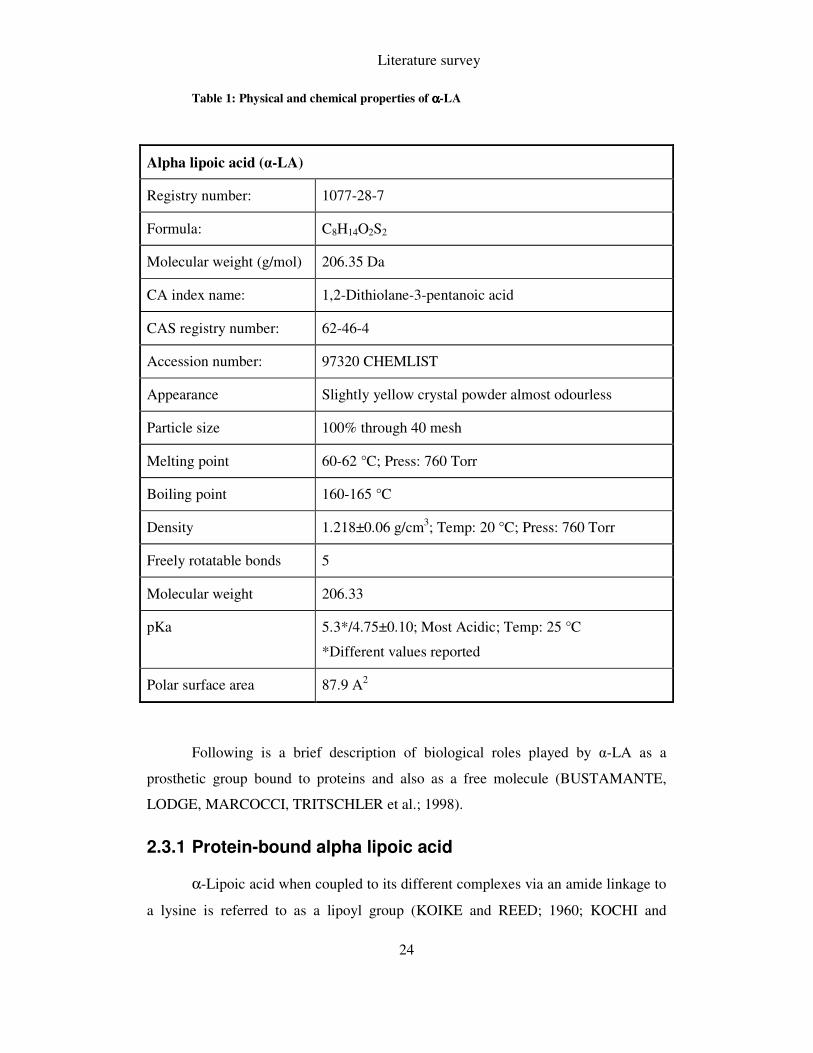
Table 1: Physical and chemical properties of αααα-LA
Following is a brief description of biological roles played by α-LA as a
prosthetic group bound to proteins and also as a free molecule (BUSTAMANTE,
LODGE, MARCOCCI, TRITSCHLER et al.; 1998).
2.3.1 Protein-bound alpha lipoic acid
α-Lipoic acid when coupled to its different complexes via an amide linkage to
a lysine is referred to as a lipoyl group (KOIKE and REED; 1960; KOCHI and
Alpha lipoic acid (α-LA)
Registry number: 1077-28-7
Formula: C8H14O2S2
Molecular weight (g/mol) 206.35 Da
CA index name: 1,2-Dithiolane-3-pentanoic acid
CAS registry number: 62-46-4
Accession number: 97320 CHEMLIST
Appearance Slightly yellow crystal powder almost odourless
Particle size 100% through 40 mesh
Melting point 60-62 °C; Press: 760 Torr
Boiling point 160-165 °C
Density 1.218±0.06 g/cm3; Temp: 20 °C; Press: 760 Torr
Freely rotatable bonds 5
Molecular weight 206.33
pKa 5.3*/4.75±0.10; Most Acidic; Temp: 25 °C
*Different values reported
Polar surface area 87.9 A2
Literature survey
25
KIKUCHI; 1976), the structure is shown in Figure 2. It acts as a cofactor in α-keto-
acid dehydrogenases and in the glycine cleavage system. These enzyme complexes
are involved in the metabolic pathways of pyruvate oxidation, the citric acid cycle,
and amino acid degradation and biosynthesis.
Source: http://www.nature.com/emboj/journal/v24/n10/full/7600663a.html
Figure 2: Structure of alpha lipoic acid linked with the lysine residues
2.3.1.1 Alpha keto acid dehydrogenase complexes
The α-keto acid dehydrogenase complexes, i.e., the pyruvate dehydrogenase
complex (PDC), the α-ketoglutarate dehydrogenase complex (α-KGDC), and the
branched chain α-ketoacid dehydrogenase complex (BCKADC) constitute an almost
ubiquitous family of enzymes (PATEL, ROCHE and HARRIS; 1996). Following is a
schematic representation of the reactions conducted by three enzymes, E1, E2 and E3
of pyruvate dehydrogenase complex (Figure 3).
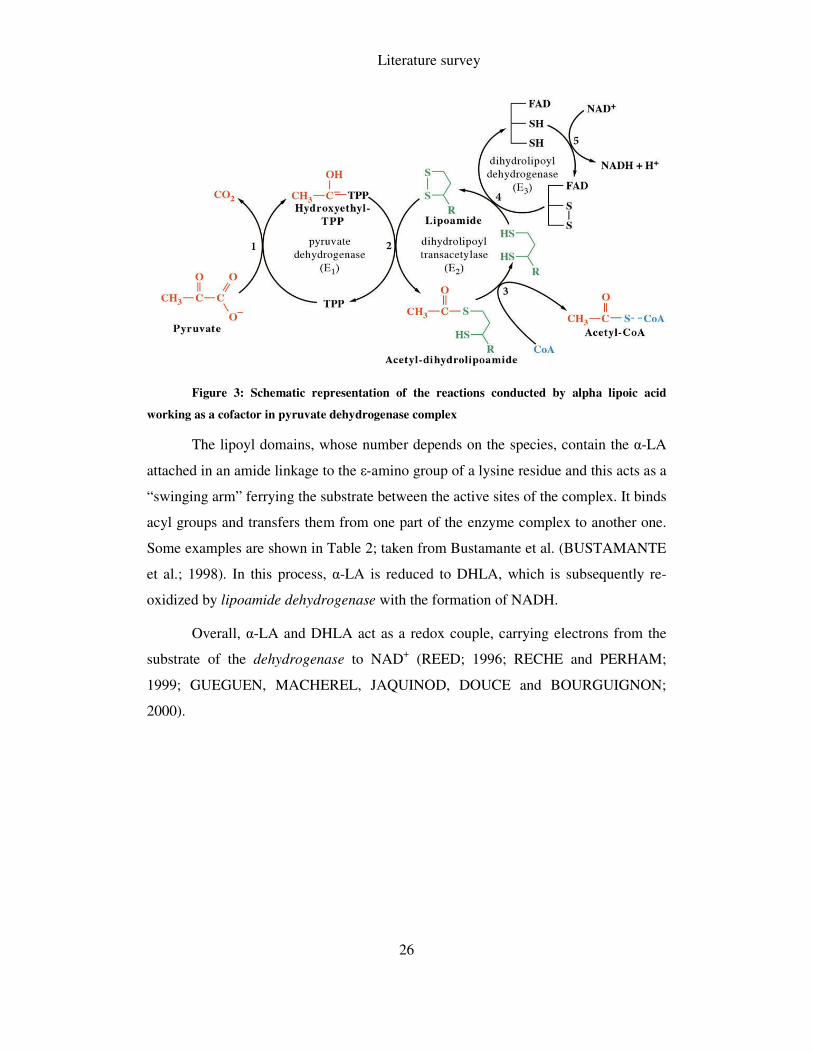
Literature survey
26
Figure 3: Schematic representation of the reactions conducted by alpha lipoic acid
working as a cofactor in pyruvate dehydrogenase complex
The lipoyl domains, whose number depends on the species, contain the α-LA
attached in an amide linkage to the ε-amino group of a lysine residue and this acts as a
“swinging arm” ferrying the substrate between the active sites of the complex. It binds
acyl groups and transfers them from one part of the enzyme complex to another one.
Some examples are shown in Table 2; taken from Bustamante et al. (BUSTAMANTE
et al.; 1998). In this process, α-LA is reduced to DHLA, which is subsequently re-
oxidized by lipoamide dehydrogenase with the formation of NADH.
Overall, α-LA and DHLA act as a redox couple, carrying electrons from the
substrate of the dehydrogenase to NAD+ (REED; 1996; RECHE and PERHAM;
1999; GUEGUEN, MACHEREL, JAQUINOD, DOUCE and BOURGUIGNON;
2000).
Literature survey
27
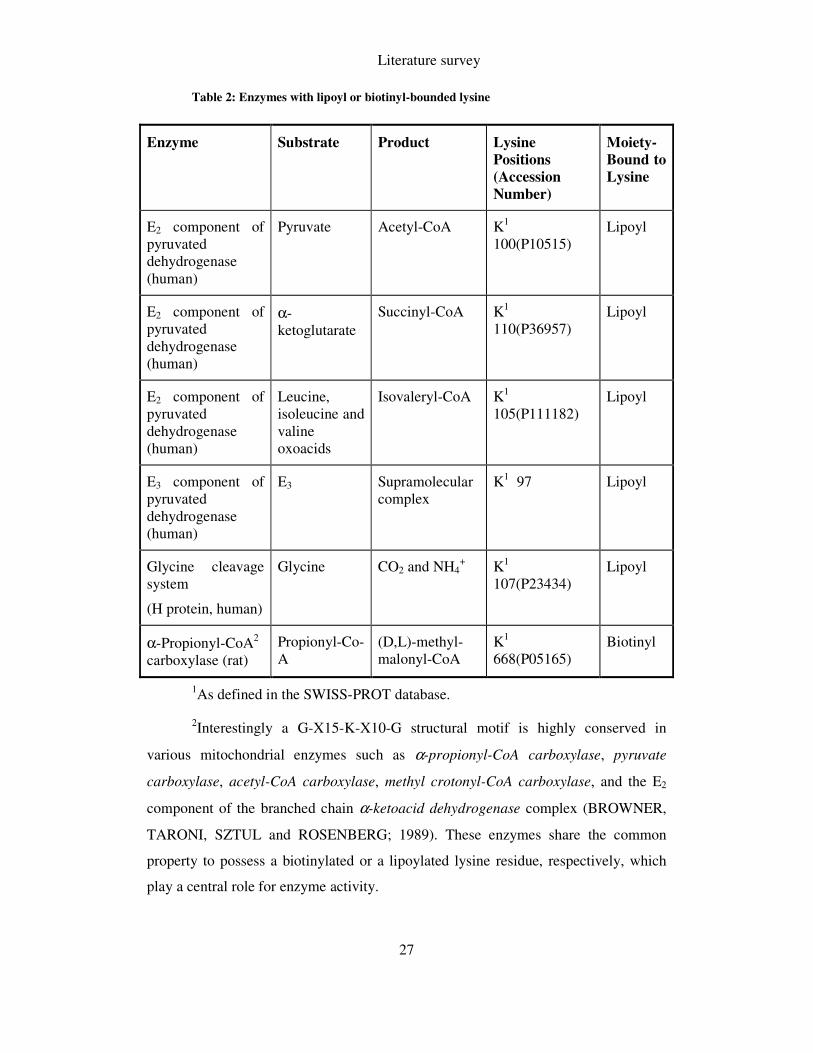
Table 2: Enzymes with lipoyl or biotinyl-bounded lysine
1As defined in the SWISS-PROT database.
2Interestingly a G-X15-K-X10-G structural motif is highly conserved in
various mitochondrial enzymes such as α-propionyl-CoA carboxylase, pyruvate
carboxylase, acetyl-CoA carboxylase, methyl crotonyl-CoA carboxylase, and the E2
component of the branched chain α-ketoacid dehydrogenase complex (BROWNER,
TARONI, SZTUL and ROSENBERG; 1989). These enzymes share the common
property to possess a biotinylated or a lipoylated lysine residue, respectively, which
play a central role for enzyme activity.
Enzyme Substrate Product Lysine
Positions
(Accession
Number)
Moiety-
Bound to
Lysine
E2 component of pyruvated dehydrogenase (human)
Pyruvate Acetyl-CoA K1 100(P10515)
Lipoyl
E2 component of pyruvated dehydrogenase (human)
α-ketoglutarate
Succinyl-CoA K1 110(P36957)
Lipoyl
E2 component of pyruvated dehydrogenase (human)
Leucine, isoleucine and valine oxoacids
Isovaleryl-CoA K1 105(P111182)
Lipoyl
E3 component of pyruvated dehydrogenase (human)
E3 Supramolecular complex
K1 97 Lipoyl
Glycine cleavage system
(H protein, human)
Glycine CO2 and NH4+ K1
107(P23434) Lipoyl
α-Propionyl-CoA2 carboxylase (rat)
Propionyl-Co-A
(D,L)-methyl-malonyl-CoA
K1 668(P05165)
Biotinyl
Literature survey
28
2.3.1.2 Glycine cleavage system (GCS)
The glycine cleavage system is a multi-enzyme complex that is located only in
the hepatic mitochondrial matrix and catalyzes the oxidation of glycine to carbon
dioxide and ammonia, forming NADH and (N5, N10)-methylenetetrahydrofolate. The
complex consists of four proteins termed P-, T-, L-, and H-protein. α-Lipoic acid is
covalently attached to a lysine in the H-protein.
During the enzymatic catalysis P-protein, a pyridoxal phosphate-dependent
decarboxylase, catalyzes the release of carbon dioxide from glycine and transfers the
methylamine moiety to the lipoyl prosthetic group of H-protein. The α-LA group is
reduced during the transfer. T-protein catalyzes the formation of ammonia and the
transfer of one-carbon group from the lipoyl residue of H-protein to tetrahydrofolate.
L-protein is a lipoamide dehydrogenase that catalyzes the oxidation of the
dihydrolipoyl residue of H-protein and the reduction of NAD+. Thus, the α-LA
prosthetic group of the H-protein interacts with the active sites of three different
enzymes in a similar manner as was found in the α-keto-acid dehydrogenase
complexes (KADC).
2.3.2 Free alpha lipoic acid
Free α-LA (non-protein bound) is a water and lipid soluble fatty acid. Its
solubility in water is controlled by its carboxylate moiety. The octanoic backbone is
hydrophobic. Limited water solubility and hydrophobicity of α-LA affects its stability
and utility in cell culture systems. Factors that affect the availability of α-LA for use
by cells in culture include; i) its possible loss upon storage at low temperatures, ii) its
filterability, and iii) the complexes it forms.
Interaction of α-LA with various protein systems has been analyzed and α-LA
has been observed to act at various levels in biochemical pathways, as a substrate, an
inhibitor, or an effector (PACKER, WITT and TRITSCHLER; 1995).
2.3.2.1 Universal antioxidant
α-Lipoic acid has gained considerable attention as an antioxidant. Lipoate, or
its reduced form, dihydrolipoate, reacts with reactive oxygen species such as
Literature survey
29
superoxide radicals, hydroxyl radicals, hypochlorous acid, peroxyl radicals, and
singlet oxygen (BIEWENGA, HAENEN and BAST; 1997). It also protects
membranes by interacting with vitamin C and glutathione, which may in turn recycle
vitamin E (PODDA, TRITSCHLER, ULRICH and PACKER; 1994). In addition to its
antioxidant activities, dihydrolipoate may exert pro-oxidant actions through reduction
of iron.
Administration of α-LA has been shown to be beneficial in a number of
oxidative stress models such as ischemia-reperfusion injury, diabetes, cataract
formation, HIV activation, neurodegeneration, and radiation injury (PACKER, WITT
and TRITSCHLER; 1995).
2.3.2.2 Alpha lipoic acid as an enzyme substrate
An effect of free α-LA on the enzyme activity of the glycine cleavage system
has also been reported (HIRAGA and KIKUCHI; 1980). Free α-LA was able to
replace the entire H-protein of this complex as an acceptor of the methylamine
carbanion (the intermediate that is formed during the conversion of glycine to CO2,
NH4+, and N5, N10-methylenetetrahydrofolic acid) although with an efficacy 1000-fold
lower than that of H-protein containing α-LA as a prosthetic group.
It has also been observed that serine hydroxyl-methyltransferase, the enzyme
responsible for the transformation of a large number of amino acids to glycine, can
catalyze in the presence of free α-LA resulting in the direct decarboxylation of glycine
with subsequent formation of methylamine-lipoate (ZIESKE and DAVIS; 1983).
In addition, α-LA has been reported to be a substrate for a lipoamide
dehydrogenase detected in human serum. In this case, the efficacy of α-LA as
substrate was eightfold lower than that of lipoamide (PELLEY, LITTLE, LINN and
HALL; 1976).
2.3.2.3 Alpha lipoic acid as an enzyme inhibitor
An inhibitory effect of α-LA on the activity of various enzymes has also been
observed. α-Lipoic acid (at a dose ranging between 50 and 150 mg/kg) prevents the
conversion of xanthine dehydrogenase to xanthine oxidase in rat intestine
Literature survey
30
homogenates (at a level ranging from 40% to 52%) after 20 min of incubation at
10°C.
2.3.2.4 Redox regulation of proteins and influence on protein folding
Thiolation of proteins has been reported to be a protective mechanism against
oxidative stress, as well as affecting the function of some thiol-containing proteins.
Glutathione is the most abundant thiol in mammalian cells and perhaps a primary
agent involved in redox regulation of protein thiols under normal conditions
(MEISTER; 1989). α-Lipoic acid may influence intracellular function not only
through antioxidant actions but also through affecting the redox status of thiol-
containing proteins, such as thioredoxin, enzymes, and transport proteins (THOMAS,
CHAI and JUNG; 1994).
2.3.2.5 Effects on gene expression
There has recently been a great deal of interest in the effects of oxidants and
antioxidants on signal transduction and gene expression in both normal and abnormal
conditions. In this regard α-LA and DHLA have been investigated in terms of their
effect on the transcription factors NF-kB, which regulates the expression of genes
such as human immunodeficiency virus type 1 and those involved in inflammatory
responses (BAEUERLE; 1991). The effects of both α-LA and DHLA, on the
expression of the growth-regulating gene c-Fos, have also been investigated
(MIZUNO and PACKER; 1994). Although it appears that DHLA and/or α-LA may
influence gene expression at one or more levels, the exact mechanisms and
significance have yet to be elucidated.
Administration of α-LA has been shown to be effective in preventing
pathology in various experimental models in which reactive oxygen species have been
implicated. Before considering these studies, however, it is necessary to discuss how
α-LA is absorbed as a dietary supplement, to what degree it is taken up by tissues, is it
reduced to DHLA?, or is it metabolized to shorter chain homologues?
Literature survey
31
2.4 Absorption, uptake, intracellular reduction, and
metabolism of α-LA
Various studies on the distribution of radioactivity in rat tissues after
intraperitoneal or oral administration of dl-[14C]- or [35S]-α-LA led to the observation
that α-LA is rapidly absorbed in the gut, taken up into various tissues where it is
metabolically altered, and then excreted. After supplementation with α-LA for 5
weeks, free α-LA was found in various tissues, the highest being the heart (PODDA,
TRITSCHLER, ULRICH and PACKER; 1994). When given to cells in vitro, α-LA is
rapidly taken up by the cells and reduced to dihydrolipoic acid, which is released by
the cell (HANDELMAN, HAN, TRITSCHLER and PACKER; 1994).
2.4.1 Diabetes
α-Lipoic acid has potential applications for many aspects of the pathology of
diabetes. In Type I (insulin-dependent) diabetes, destruction of pancreatic β-cells
causes loss of insulin secretion, whereas in Type II (noninsulin-dependent) diabetes
insulin resistance of peripheral tissues is the major problem (WOLFF, JIANG and
HUNT; 1991). α-Lipoic acid has potential preventive or ameliorative effects in both
Type I and Type II diabetes. It has been shown to have a number of beneficial effects,
both in prevention and treatment of diabetes, α-LA acts in a number of ways that are
especially protective in diabetes. It prevents β-cell destruction leading to Type I
diabetes. It enhances glucose uptake in Type II diabetes. It prevents glycation
reactions in some proteins. Its antioxidant effects may be particularly useful in
slowing the development of diabetic neuropathy and cataractogenesis, and this may be
especially significant in alleviating diabetes-induced reduction in intracellular
vitamin C levels (GANDHI, WAGH, NATRAJ and MENON; 1985; WAGH,
NATRAJ and MENON; 1987).
2.4.2 Liver diseases
α-Lipoic acid is often used for therapy in conditions that involve liver
pathology. The basis for such treatment is the metabolic role of α-LA, not its
antioxidant properties. The two most extensively studied conditions are mushroom
Literature survey
32
poisoning and alcoholic liver degeneration (MARSHALL, GRAUL, MORGAN and
SHERLOCK; 1982; BUSTAMANTE et al.; 1998).
2.4.3 Neurodegenerative disorders
Tissues of the central nervous system can be vulnerable to oxidative stress
because of their constant high rate of oxygen consumption and high mitochondrial
density. Mitochondria inevitably produce free radicals as "by-products" of normal
oxidative metabolism, and these free radicals damage the mitochondrial DNA
(RICHTER, PARK and AMES; 1988). The defective proteins coded by the damaged
DNA can lead to synthesis of mitochondria in which components of the electron
transport chain preceding the damaged protein become reduced, leading to greater
free radical production and more mitochondrial damage, in a vicious cycle. Such a
vicious cycle may be responsible, in part for neurodegenerative diseases. Logical
therapy or prevention would therefore involve antioxidant treatment.
α-Lipoic acid is a good candidate as an antioxidant agent in neurodegenerative
diseases. It can interrupt the chain at several points; by competing for free transition
metals as a chelator (DEVASAGAYAM, SUBRAMANIAN, PRADHAN and SIES;
1993), by scavenging hydroxyl or superoxide radicals (REED; 1957), and by
scavenging peroxyl radicals (KAGAN, SHVEDOVA, SERBINOVA, KHAN et al.;
1992). Few other antioxidants possess this kind of versatility.
2.4.4 Radiation injury
Irradiation is known to produce a cascade of free radicals and antioxidant
compounds have long been used to treat irradiation injury. α-Lipoic acid, but not
DHLA, protected against radiation injury to haematopoietic tissues in mice, and
increased the LD50 from 8.67 to 10.93 Gy (RAMAKRISHNAN, WOLFE and
CATRAVAS; 1992). α-LA administration to murine neroblastoma cells (BUSSE,
ZIMMER, SCHOPOHL and KORNHUBER; 1992) increased cell survival after
irradiation from 2% to about 10%, and the effect correlated with an increase of the
intracellular GSH/ GSSG ratio induced by α-lipoate. These results extended to mice
irradiated with 8 Gy; administration of α-lipoic acid (16 mg/kg) increased survival
rates from 35% in untreated animals to 90% in α-LA treated animals.
Literature survey
33
α-Lipoic acid, alone or together with vitamin E, is an effective treatment for
radiation exposure, lessening indices of oxidative damage and normalizing organ
function (KORKINA, AFANAS'EF and DIPLOCK; 1993).
2.4.5 Heavy metal poisoning
The possible chelating effects of α-LA, together with its antioxidant effects,
make it a good candidate for the treatment of heavy metal poisoning. It can be
especially effective against arsenite, cadmium, and mercury. Grunert demonstrated
that α-LA administration completely protected mice and dogs from arsenite
poisoning, if the ratio of α-LA to arsenite was at least 8:1. This was true even if the α-
LA was administered when severe symptoms of poisoning were already seen
(GRUNERT; 1960).
2.4.6 Anti-ageing effects
In various effects, α-LA appears to help restore a cellular “signaling” process
that tends to break down in older blood vessels. It reduces mitochondrial decay in
cells, which is closely linked to the symptoms of aging. With age, glutathione levels
naturally decline, making older animals more susceptible to both free radicals and
other environmental toxins but α-LA can restore glutathione function to almost
normal. The expression and function of other genes seem to come back to life
(ATAMNA; 2004; KUMARAN, PANNEERSELVAM, SHILA, SIVARAJAN and
PANNEERSELVAM; 2005; SAVITHA and PANNEERSELVAM; 2007).
2.5 Sources
Good food sources of α-LA include spinach, broccoli, beef, yeast (particularly
Brewer's yeast), liver, kidney, heart, potatoes and skeletal muscle (ENSMINGER,
ENSMINGER, KONLANDE and ROBSON; 1994; LEY; 1996; MURRAY; 1996).
However, quantitative information on the α-LA or lipoyllysine content of food is
limited and published databases lack this information.
Literature survey
34
2.6 Side effects
Neither animal nor human studies, to date, have shown serious side effects
with administration of α-LA. The LD50 is approximately 400-500 mg/kg following
intravenous administration in rats and 400-500 mg/kg after oral dosing in dogs. In
long-term oral supplementation at doses sufficient to reduce body weight gain, no
functional or laboratory adverse effects were seen in animals. No evidence suggests
carcinogenic or teratogenic effects, but it is recommended that pregnant women avoid
taking supplemental α-LA until more data is available. In humans, side effects
include, allergic skin reactions and possible hypoglycaemia in diabetic patients as a
consequence of improved glucose utilization, with high doses of α-LA (FOSTER;
2007).
It is less clear whether or not supplement use for otherwise healthy individuals
confers any benefit, including delay of aging. More carefully controlled scientific
studies with larger numbers of subjects over longer periods will be needed to clarify
the possibility that the sale of this compound is justified on a nutritional basis
(MCCORMICK; 2005).
2.7 Analytical methods for the determination of alpha
lipoic acid
The analysis of α-LA and related compounds, such as its reduced form DHLA,
its amide form lipoamide (LAM) and other analogues, in biological and food samples
is important in biochemistry, nutritional and clinical chemistry. Unfortunately, due to
the lack of simple and reliable quantitative methods of determination, limited data on
their contents in animal and plant samples are available. The reason of this depends on
the fact that both molecules do not possess chromospheres strong enough to permit
the use of conventional high-performance liquid chromatography (HPLC) with UV or
fluorescence detectors (NAVARI-IZZO, QUARTACCI and SGHERRI; 2002).
Various analytical methods have been developed for the quantitative
determination of α-LA in biological material, drugs and food samples (KATAOKA;
1998). This section is divided into the following two main parts:
Literature survey
35
1. General aspects of the analytical methods for the determination of α-LA and
related compounds according to the instrument type
2. Applications of these methods to the various samples according to the matrix
type
Techniques for the determination of α-LA rely on extraction of free and/or
protein-bound. Different chromatographic methods were used to analyze α-LA and
related compounds. Important features of these analyses are summarized in Table 3.
2.7.1 Gas chromatography
Gas chromatography (GC) has been widely used for the analysis of volatile
compounds due to its inherent advantages of simplicity, high resolving power, high
sensitivity and low cost. Therefore, GC with different detection modes such as flame
ionization detection (FID), flame photometric detection (FPD) and mass spectrometry
(MS) are among the most frequently applied techniques for α-LA and related
compounds, the results are summarized in Table 3. However, the necessity of
different tedious derivatization steps is a considerable drawback.
2.7.1.1 GC-FID and GC-FPD
In 1966, it was reported that a mixture containing α-LA and LAM could be
separated and determined directly without derivatization, using a 15%
diethyleneglycol succinate polyester packed column (75 cm×3 mm I.D), by GC with
FID (IGUCHI, YAMAMOTO and AOYAMA; 1966). However, these polar
compounds tended to elute as broad and tailing peaks, due to strong adsorption to the
column and injector during GC analysis. Therefore, they could not be detected in low
concentrations without derivatization. Thus, several derivatives, such as methyl ester
(SHIH and STEINSBERGER; 1981; KOZMA-KOVACS, HALASZ, HAJOS, SASS
and BOROSS; 1991; VIANEY-LIAUD, KOBREHEL, SAUVAIRE, WONG and
BUCHANAN; 1994), S,S-dibenzyl (DBZ) methyl ester (WHITE; 1981), S,S-
diethoxycarbonyl (DEOC) and methyl ester (KATAOKA, HIRABAYASHI and
MAKITA; 1993; KATAOKA, HIRABAYASHI and MAKITA; 1997) have been
tested.
Literature survey
36
Alpha lipoic acid in standard solutions could be easily determined using gas
chromatography as its methyl ester derivative, but it was difficult to detect the α-LA
in biological and food samples as its derivatives because a part of α-LA forms mixed
disulphides (REED; 1953) and disulphide polymers (THOMAS, CHAI and JUNG;
1994) in these samples. Therefore, these sulphides must be reduced to thiols and then
derivatized with appropriate reagents for GC analysis. α-LA was determined as its
S,S-DBZ methyl ester derivative (WHITE; 1981) after reduction to DHLA using
sodium borohydride (NaBH4) by GC–FID. Calibration curves were constructed using
C7 and C9 homologues as internal standards and were linear in the range 0–20 µg/ml.
Furthermore, increased sensitivity should be possible by using an electron capture
detector and/or using pentafluorobenzyl chloride in the derivatization step instead of
benzyl chloride (BZ-Cl).
A selective and sensitive method for the determination of α-LA by GC with
flame photometric detection (FPD) was developed (KATAOKA, HIRABAYASHI
and MAKITA; 1997) in which α-LA was converted into its S,S-DEOC methyl ester
derivative after reduction with NaBH4. α-Lipoic acid was eluted as a single and
symmetrical peak within 6 min using a DB-210 capillary column (15 m×0.53 mm
I.D., 1.0 µm film thickness). The observed calibration curve was linear in the range
20–500 ng/µl.
2.7.1.2 GC-MS
GC–MS can be usually operated in two modes, total ion monitoring and
selected ion monitoring (SIM). For SIM, only the base peaks are chosen to obtain the
highest possible sensitivity. A magnetic sector instrument is used for positive ion
electron ionization (EI)–MS, which yields excellent fragmentation patterns, with
further confirmation being achieved using chemical ionization (CI) of the sample with
a quadruple instrument. Since CI–MS is a much softer ionization method, it has the
advantage of producing far less fragmentation of the compound and so allows a
greater chance of the molecular ion being present, which can aid interpretation. Thus,
GC–MS is one of the best on-line identification systems because of selectivity and
sensitivity, but it requires conversion into volatile derivatives before analysis.
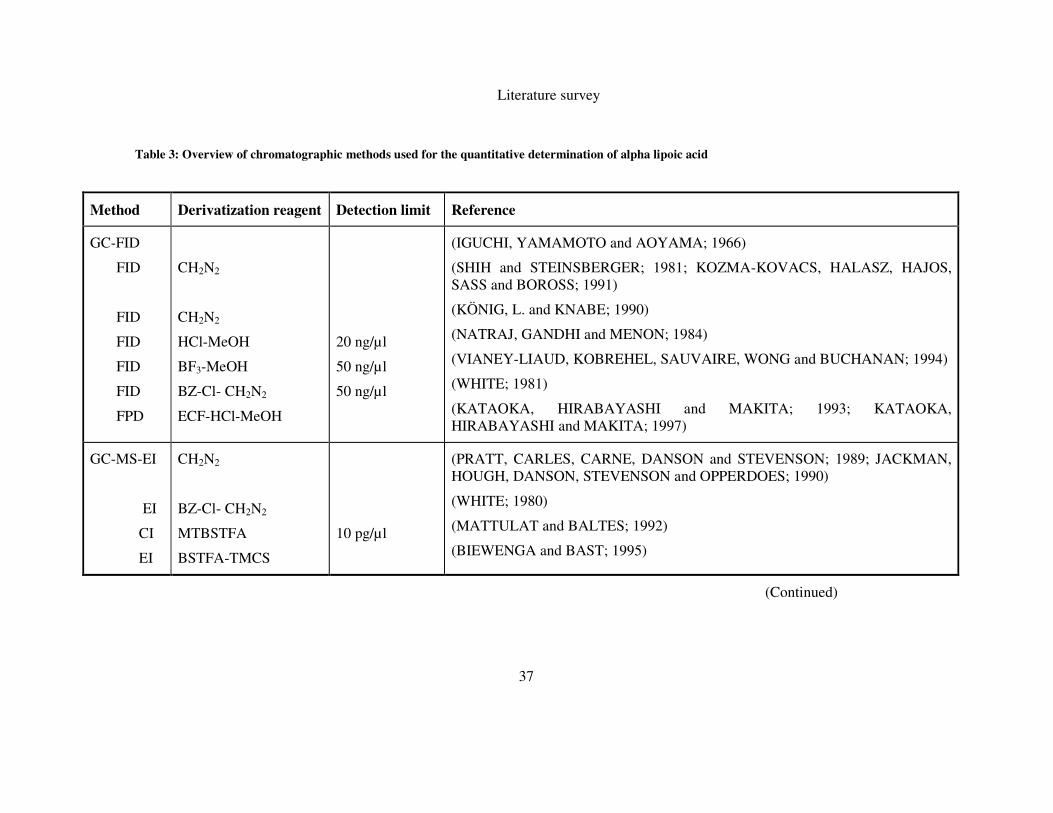
Literature survey
37
Table 3: Overview of chromatographic methods used for the quantitative determination of alpha lipoic acid
(Continued)
Method Derivatization reagent Detection limit Reference
GC-FID
FID
FID
FID
FID
FID
FPD
CH2N2
CH2N2
HCl-MeOH
BF3-MeOH
BZ-Cl- CH2N2
ECF-HCl-MeOH
20 ng/µl
50 ng/µl
50 ng/µl
(IGUCHI, YAMAMOTO and AOYAMA; 1966)
(SHIH and STEINSBERGER; 1981; KOZMA-KOVACS, HALASZ, HAJOS, SASS and BOROSS; 1991)
(KÖNIG, L. and KNABE; 1990)
(NATRAJ, GANDHI and MENON; 1984)
(VIANEY-LIAUD, KOBREHEL, SAUVAIRE, WONG and BUCHANAN; 1994)
(WHITE; 1981)
(KATAOKA, HIRABAYASHI and MAKITA; 1993; KATAOKA, HIRABAYASHI and MAKITA; 1997)
GC-MS-EI
EI
CI
EI
CH2N2
BZ-Cl- CH2N2
MTBSTFA
BSTFA-TMCS
10 pg/µl
(PRATT, CARLES, CARNE, DANSON and STEVENSON; 1989; JACKMAN, HOUGH, DANSON, STEVENSON and OPPERDOES; 1990)
(WHITE; 1980)
(MATTULAT and BALTES; 1992)
(BIEWENGA and BAST; 1995)
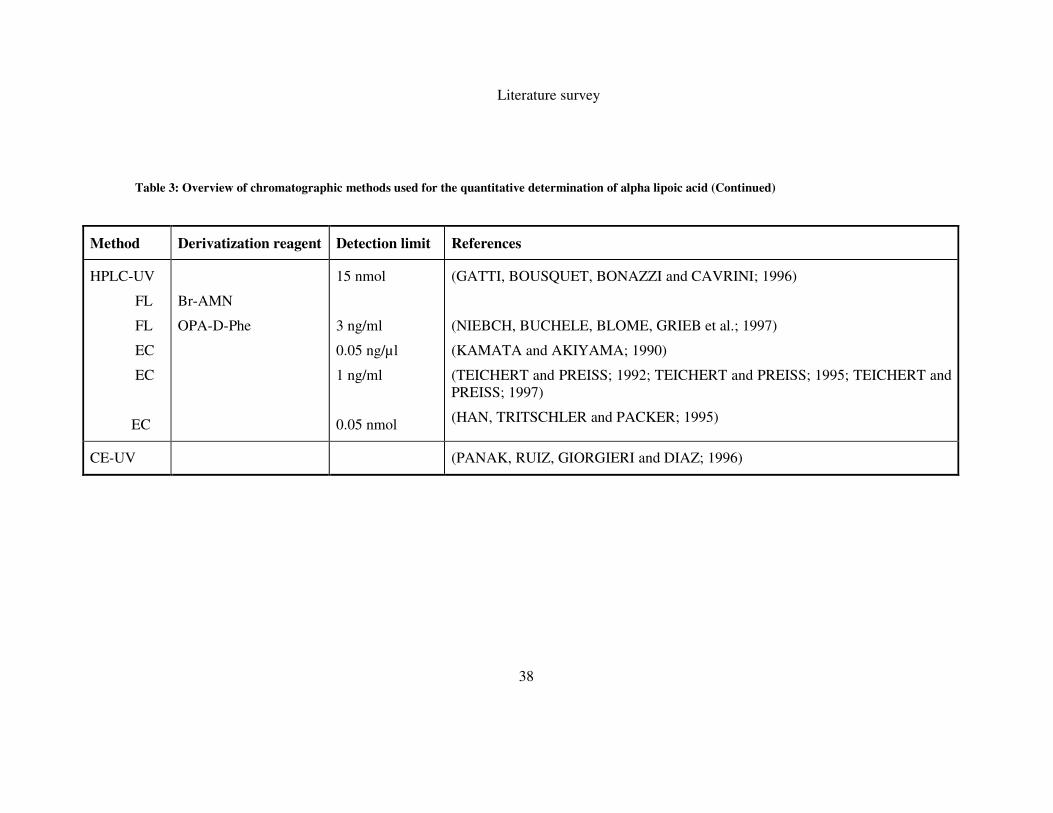
Literature survey
38
Table 3: Overview of chromatographic methods used for the quantitative determination of alpha lipoic acid (Continued)
Method Derivatization reagent Detection limit References
HPLC-UV
FL
FL
EC
EC
EC
Br-AMN
OPA-D-Phe
15 nmol
3 ng/ml
0.05 ng/µl
1 ng/ml
0.05 nmol
(GATTI, BOUSQUET, BONAZZI and CAVRINI; 1996)
(NIEBCH, BUCHELE, BLOME, GRIEB et al.; 1997)
(KAMATA and AKIYAMA; 1990)
(TEICHERT and PREISS; 1992; TEICHERT and PREISS; 1995; TEICHERT and PREISS; 1997)
(HAN, TRITSCHLER and PACKER; 1995)
CE-UV (PANAK, RUIZ, GIORGIERI and DIAZ; 1996)
Literature survey
39
Few GC–MS data on the analysis of α-LA and related compounds using EI
and CI after derivatization are available. Methyl ester of lipoic acid was identified by
monitoring the presence of the fragment ion (m/z 123) and the molecular ion (m/z
220) (PRATT, CARLES, CARNE, DANSON and STEVENSON; 1989; JACKMAN,
HOUGH, DANSON, STEVENSON and OPPERDOES; 1990).
White developed a method for the identification of α-LA as its S,S-DBZ
methyl ester derivative by EI–MS (WHITE; 1981). This derivative gave a strong mass
ion at m/z 311 (M+−91) and a weak ion at m/z 137, which resulted from cleavage of
the C7 and C8 bond of α-LA. He also tested some reagents, such as
dinitrofluorobenzene, iodoacetate and 2,2-dimethoxypropane, for the derivatization of
reduced α-LA, but the derivatives prepared by these reagents proved unacceptable for
the GC–MS analysis of α-LA due to either non-volatility, instability or difficulty in
preparation.
Another method was developed by converting α-LA into its tert.-butyl-
dimethylsilyl (tert.-BDMS) derivative with N-methyl-N-(tert.-butyldimethylsilyl)-
trifluoroacetamide (MTBSTFA) followed by CI–MS (MATTULAT and BALTES;
1992). The detection limit was about 10 pg/µl of LA derivative and the calibration
curve was linear from 10 pg to 20 ng/µl using the base peak m/z 189 for
quantification.
2.7.2 High performance liquid chromatography
High performance liquid chromatography (HPLC) is one of the most popular
analytical techniques and can be used in combination with various detection systems
such as ultraviolet (UV), fluorescence (FL) and electrochemical (EC) detectors.
However, little work has been done on the determination of α-LA and related
compounds by HPLC.
2.7.2.1 HPLC-UV and HPLC-FL
α-Lipoic acid and some of its analogues were separated by reversed-phase
HPLC on a µBondapak C18 column (30 cm×3.9 mm, I.D. 10 µm) using UV detection
at 330 nm (absorption maximum of the dithiolane ring) with a gradient elution system
(HOWARD and MCCORMICK; 1981). Eight compounds could be separated within
Literature survey
40
16 min, but the sensitivities of these compounds were very low, due to the lack of a
strong chromophore (SCHMIDT, GRAFEN, ALTLAND and GOEDDE; 1969;
FURR, SHIH, HARRISON, CHANG et al.; 1979), which is needed for conventional
UV or FL detection.
Few derivatization reagents have been used for the determination of α-LA by
FL detection. 2-Bromoacetyl-6-methoxynaphthalene (Br-AMN) was used as a
fluorogenic labelling reagent and α-LA was separated using a Hypersil 5 ODS column
(25 cm×4.5 mm; I.D. 5 µm) under isocratic conditions and detected at an excitation
wavelength of 300 nm and an emission wavelength of 460 nm (GATTI, BOUSQUET,
BONAZZI and CAVRINI; 1996).
A stereoselective and sensitive method for the high performance liquid
chromatographic analysis of α-LA enantiomers (+)R- and (−)S-LA was developed by
derivatization with o-phthalaldehyde (OPA) in the presence of D-phenylalanine (D-
Phe) after reduction to the dithiol enantiomers and the two diastereomeric derivatives
were separated by reversed-phase HPLC on a LiChrospher 60 SelectB column
(25 cm×4 mm, I.D. 5 µm particle size) using FL detection with an excitation
wavelength of 230 nm and an emission filter of >418 nm (NIEBCH et al.; 1997). The
limit of detection was 3 ng/ml and the working range of the assay was 15–1000 ng/ml
for either enantiomer.
In another method, α-lipoic acid in plasma and tissues was determined by
reversed-phase HPLC-FL. After extraction with diethyl ether, the dithiolane ring of α-
LA was opened by reduction with NaBH4 before the free thiols could react with the
fluorescent label monobromobimane. The concentration-response curve was linear
from 20 to 3000 nM in plasma. The recovery as determined with [3H]LA was 60.9%
from plasma and 61.4% from rat heart tissue (WITT and RUSTOW; 1998).
α-Lipoic acid and DHLA contents in human plasma and urine were
determined using simple isocratic elution with acetonitrile-water (80:20) and detected
fluorimetrically (excitation: 343, emission: 423 nm). After extraction, the free
carboxylic function of α-LA and the SH-protected DHLA were converted into their
amide derivatives with the strong fluorophore, 2-(4-aminophenyl)-6-
methylbenzothiazole, in the presence of a coupling agent and a base catalyst (HAJ-
Literature survey
41
YEHIA, ASSAF, NASSAR and KATZHENDLER; 2000). The resulting fluorescent
amides of both LA and DHLA were separated on a reversed-phase Ultrasphere C8
column (25 cm×4.6 mm, I.D. 5 µm, Beckman, USA).
2.7.2.2 HPLC-EC
HPLC with electrochemical detection usually offers a sensitive quantification
of organic compounds. α-Lipoic acid and DHLA can be readily inter-converted by
application of an electric potential and, therefore, these compounds are suitable for
measurement by an EC detector. The choice of instruments and electrode materials,
and the composition of the mobile phase, are factors that influence both the sensitivity
and selectivity of the EC analysis. Isocratic elution is usually used in the combination
of HPLC and electrochemistry, because gradient elution cannot be used in a high
sensitivity range with this detector. In another experimental work, α-LA and LAM
were simultaneously analyzed by HPLC on a Shim-pack CLC ODS column (15 cm×6
mm I.D. 5 µm particle size) using a Ag, Ag–AgCl electrochemical detector and 50%
acetonitrile in 0.05 M potassium dihydrogen phosphate (pH 2) as the mobile phase
(KAMATA and AKIYAMA; 1990). The detection limits of α-LA and LAM were 50
and 100 pg/µl, respectively, and the calibration curves for these compounds were
linear over the range 0.5–5 ng/µl.
α-Lipoic acid and DHLA were determined using a glassy-carbon working
electrode and a Ag/AgCl-reference electrode at the high oxidation potential of 1.1 V.
HPLC separation was achieved on a Nucleosil 120 C 18 column (25 cm×4 mm I.D. 5
µm particle size) and 28.5% acetonitrile in 0.05 M potassium dihydrogen phosphate
(pH 2.5) as the mobile phase (TEICHERT and PREISS; 1992; TEICHERT and
PREISS; 1995; TEICHERT and PREISS; 1997). The detection limit for α-LA was 1
ng/ml and the calibration curve was non-linear in the range 0.01–50 µg/ml, but could
be described by a power function. The method suffered from an extreme loss in
sensitivity due to poisoning of the electrode. Later the same authors overcame this
drawback by applying pulsed amperometric detection (TEICHERT and PREISS;
2002).
An alternative EC system with a dual Hg–Au electrode was used for the
determination of α-LA and DHLA (HANDELMAN, HAN, TRITSCHLER and
Literature survey
42
PACKER; 1994; HAN, HANDELMAN and PACKER; 1995). In this dual-electrode
system, one electrode acts as the generator and the second electrode acts as a detector.
α-Lipoic acid was reduced to DHLA on the high negative potential generator
electrode (Hg) and then detected as DHLA on the downstream electrode (Au). α-LA
and DHLA were separated within 8 min using a Microsorb C 18 column (10 cm×4.6
mm I.D. 3 µm particle size) and 0.2 M monochloroacetic acid (pH
2.9)/methanol/acetonitrile (50/30/20; v/v/v) as the mobile phase. The detection limits
for α-LA and DHLA were 10 and 2 ng/µl, respectively. But the electrodes lost
sensitivity after 30–50 injections and had to be reconditioned. Sen et al. reported
previously a HPLC method based on coulometric detection. Using this method,
detection limits for α-LA and dihydrolipoate (DHLA) were 1-5 pmol which is at least
10 times more sensitive for the detection of α-LA compared to the Au/Hg electrode-
based detection reported previously (SEN, ROY, KHANNA and PACKER; 1999).
The mercury surface-specific reaction is much more specific than the reaction
on the glassy-carbon surface and, therefore, the former is commonly used for the
measurement of disulphides and thiols (FURR et al.; 1979; ALLISON and SHOUP;
1983). Although both α-LA and DHLA can be measured in their free form by these
EC methods, bound forms of these compounds could not be detected.
Another method based upon voltammetry and coulometric titration with
electro-generated halogens was used to determine α-LA with RSD of 1-2% in the
model solutions. The analytical range of α-LA found by voltammetry at a glassy-
carbon electrode was 1.15 × 10⁻⁵ to 1.73 × 10⁻⁴ M and the detection limit for α-LA
was 5.75 × 10⁻⁶ M (ZIYATDINOVA, BUDNIKOV and POGOREL'TSEV; 2004).
2.7.2.3 HPLC-MS
A simple, sensitive, and specific LC-MS/MS method for the determination of
α-LA was developed and validated over the linearity range 5-1000 ng/ml (r2 > 0.99).
α-Lipoic acid was determined in 200 µl rat plasma using rosigliatzone as an internal
standard (IS). The API-3000 LC-MS/MS was operated under the multiple reaction
monitoring mode (MRM) using the electrospray ionization technique. The recovery of
α-LA and IS was >70% and 97%, respectively. The limit of quantification (LOQ) of
α-LA was 5.0 ng/ml. The inter- and intraday precision in the measurement of quality
Literature survey
43
control (QC) samples 5, 15, 400, and 800 ng/ml were in the range 2.18-5.99% RSD
and 0.93-13.77% RSD, respectively. Accuracy in the measurement of QC samples
was in the range 87.40-114.40% of the nominal values (TRIVEDI, KALLEM,
MAMIDI, MULLANGI and SRINIVAS; 2004).
2.7.3 Capillary electrophoresis
Capillary electrophoresis (CE) is capable of achieving higher separation
efficiency, uses less organic solvents and requires small amounts of samples in
comparison with HPLC. The migration behaviour of ionized compounds is dependent
on various factors, such as buffer pH, organic modifier, concentration of buffer
solution, temperature of the capillary tubing and the electric field strength.
A CE method for the determination of α-LA was developed (PANAK, RUIZ,
GIORGIERI and DIAZ; 1996) using an uncoated capillary column (30 cm effective
length, 50 mm I.D.) with 50 mM tris(hydroxymethyl) amino-methane–hydrochloric
acid (Tris–HCl)–30 mM sodium dodecyl sulphate (pH 7.0) as the running buffer, at 20
kV. A detection limit in the femtomolar range was achieved by monitoring the UV
absorbance at 214 nm.
Another rapid capillary electrophoresis method was developed to determine
α-LA in dietary supplement preparates. α-Lipoic acid was extracted three times with
methanol at ambient temperature and was determined using UV detection at 208 nm
with recovery of 98.3% and a precision of 2.8% RSD (SITTON, SCHMID, GUBITZ
and ABOUL-ENEIN; 2004).
2.7.3.1 General techniques for sample preparation
Majority of the previous work is based on the analysis of protein-bound α-LA
in the biological and food samples and hence used the hydrolytic methods for the
sample preparation. A brief description of these methods is given in the next sections.
2.7.3.1.1 Hydrolytic method
Different acid, base and enzymatic hydrolysis methods were adopted to
analyse α-LA in different matrices.
Literature survey
44
2.7.3.1.1.1 Acid hydrolysis
Samples containing α-LA were hydrolyzed using 6 M HCl at 120 °C for 2–4 h
followed by extraction of hydrolyzed α-LA into dichloromethane (WHITE; 1980);
(WHITE; 1981), (PRATT, CARLES, CARNE, DANSON and STEVENSON; 1989)
and (VIANEY-LIAUD, KOBREHEL, SAUVAIRE, WONG and BUCHANAN;
1994). The release of α-LA from its protein bound form under these hydrolysis
conditions was greater than 95%, but α-LA tended to become oxidized to its
thiosulphinate or thiosulphonate form during hydrolysis. The recovery of α-LA from
plasma by hydrolysis in 6 M HCl at 120 °C for 6 h was about 30% (TEICHERT and
PREISS; 1997). Moreover, the recoveries of α-LA from the synthesized model
compound ε-lipoyllysine (LLys) by hydrolysis with 1 and 6 M HCl at 100 °C for 3 h
were about 80 and 25%, respectively (MATTULAT and BALTES; 1992).
The addition of several thiol protecting agents, such as mercaptoacetic acid,
mercaptoethanol or ethanethiol, to the hydrolysis did not effect the oxidation of α-LA
(WHITE; 1980). Therefore, [3H ] and [13C] homologues of α-LA were added to the
sample as internal standards before hydrolysis (WHITE, BLEILE and REED; 1980).
As an alternative acid hydrolysis method, samples were hydrolyzed using 6 M
sulphuric acid at 125 °C for 6 h, and α-LA in hydrolysate was extracted into benzene
(SHIH and STEINSBERGER; 1981). By using [13C-α-LA], the recovery during
hydrolysis and extraction was found to be 34%. Moreover, the recoveries of α-LA
from lipoyllysine by hydrolysis with 1 and 4 M sulphuric acid at 100 °C for 3 h were
80–85% (MATTULAT and BALTES; 1992).
For food samples, optimum hydrolysis conditions were heating at 120 °C for
7 h in 2 M sulphuric acid and the recoveries of α-LA from samples were about 60–
70%. In addition, the use of organic acids, such as p-toluenesulphonic acid (KOCHI
and KIKUCHI; 1976) and methanesulphonic acids [(WHITE; 1980; WHITE,
BLEILE and REED; 1980), have also been described for the release of α-LA from the
protein-bound form.
Literature survey
45
2.7.3.1.1.2 Base hydrolysis
Base hydrolysis was used to release α-LA from samples, because its oxidation
during hydrolysis was far more resistant to base hydrolysis than to acid hydrolysis
(KATAOKA, HIRABAYASHI and MAKITA; 1993; KATAOKA, HIRABAYASHI
and MAKITA; 1997). Optimum hydrolysis conditions were heating at 110 °C for 3 h
in 2 M potassium hydroxide containing 4% bovine serum albumin. The degradation of
α-LA during hydrolysis could be reduced by bovine serum albumin. The released
lipoic acid could be easily extracted into dichloromethane and directly derivatized to
its S, S-DEOC methyl ester. The recoveries of lipoic acid from biological samples
during hydrolysis and extraction were 50-60%.
2.7.3.1.1.3 Enzymatic hydrolysis
A specific enzyme lipoamidase was used to release α-LA from the ε-amino
group of a lysine residue (SUZUKI and REED; 1963), but it has never been applied
directly to tissue homogenates. A mild enzymatic hydrolysis, using several proteases,
was also reported to release α-LA from plasma sample (TEICHERT and PREISS;
1992; TEICHERT and PREISS; 1995; TEICHERT and PREISS; 1997). The
recoveries of α-LA from plasma by hydrolysis with thermophilic protease, alcalase
and subtilisin A were about 70%, 80% and 82%, respectively. The released α-LA in
hydrolysate was extracted by a solid-phase extraction cartridge. In this method, if all
preparations were carried out under inert gas, DHLA could also be detected in some
cases.
In food samples, an enzymatic recycling method was developed to determine
tissue level of α-LA. Bound lipoyl groups were liberated in the form of lipoyllysine
by protease digestion and were assayed by lipoamide dehydrogenase-mediated
NADH oxidation. NADH oxidation was coupled to reduction of the lipoyl disulfide
group. The method was applied to the protease lysates of bovine, rat and rabbit tissues
to determine lipoyllysine levels. Kidney and liver were found to have the highest
content of α-LA in the range of 3.9 to 4.6 nmol/g wet tissue of rat or rabbit or 11.6 -
13.1 nmol/g bovine acetone powder (KONISHI and PACKER; 1999).
Direct determination of lipoyllysine was carried out using several enzymes
such as pronase E and subtilisin A followed by labelling of the reduced LLys with
Literature survey
46
ammonium 4-fluoro-2,1,3-benzoxadiazole-7-sulfonate (SBD-F) at 50 °C for 1h. The
resulted fluorophore, SBD-LLys, was quantified by reversed-phase HPLC-FL
detection (SATOH, TOYO'OKA, FUKUSHIMA and INAGAKI; 2007). The assay
values of LLys per 1 g wet tissues were 3.67 µg (kidney), 1.97 µg (liver), 2.09 µg
(heart), 0.59 µg (brain), 0.30 µg (pancreas), and 0.20 µg (spleen).
2.7.3.1.2 Non-hydrolytic methods
α-Lipoic acid was extracted in methanol from pharmaceutical dosage forms
using simple solid phase extraction. Statistical analysis proved that the method was
reproducible (SITTON, SCHMID, GUBITZ and ABOUL-ENEIN; 2004).
α-Lipoic acid was extracted from health food by ultrasonication in methanol,
filtered and quantified by HPLC. The average recovery was 98.89%, and RSD was
2.26% (SUN and CHEN; 2006).
2.7.3.2 Bacteria
α-Lipoic acid has been identified in Escherichia coli (E. coli) by 6 M HCl
hydrolysis, extraction into dichloromethane, subsequent derivatization with BZ-Cl
and GC–MS analysis (WHITE; 1980). Pratt et al. detected α-LA in E. coli and
Halobacterium halobium by a modified GC–MS method (PRATT, CARLES,
CARNE, DANSON and STEVENSON; 1989). They identified the released α-LA
from the protein-bound form as its methyl ester. In addition, (WHITE; 1981)
determined the α-LA content in acid hydrolysates of some bacterial samples by GC–
FID analysis, based on preparation of the S,S-DBZ methyl ester derivative, and
showed that the α-LA content of E. coli depended on the carbon source used for its
growth. The contents of bacterial α-LA are summarized in Table 4. The values are in
good agreement with previously reported data (NAKATA; 1962).
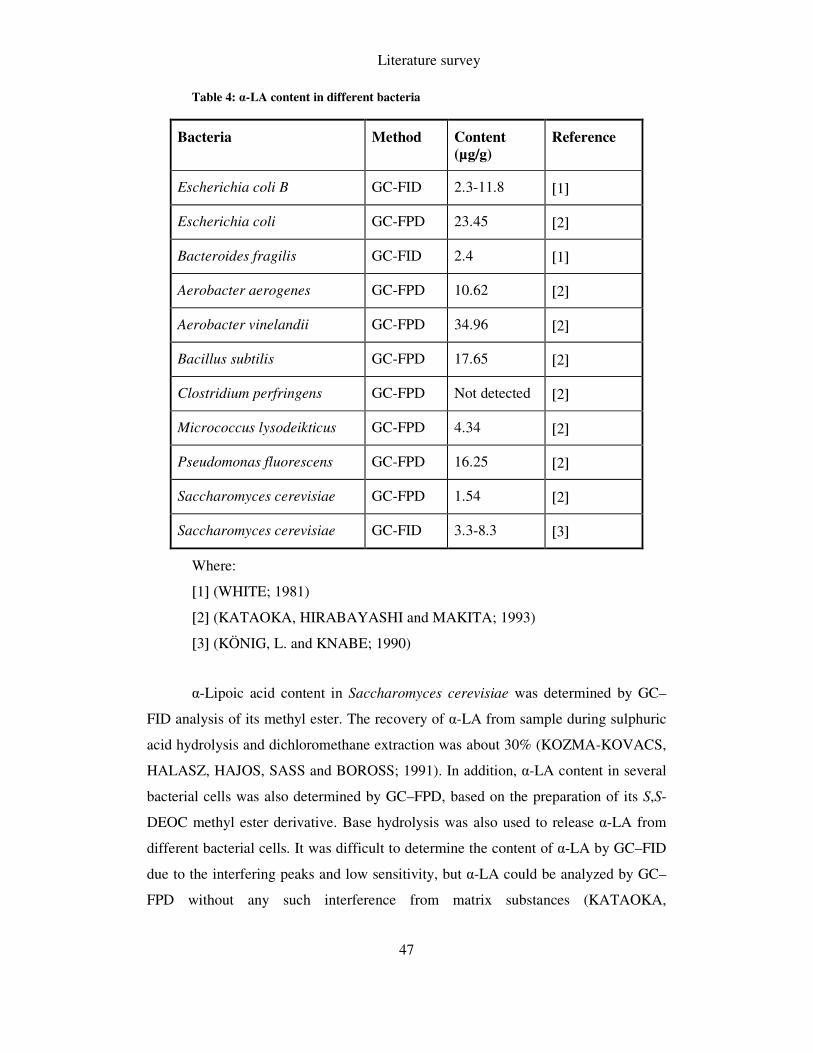
Literature survey
47
Table 4: α-LA content in different bacteria
Bacteria Method Content
(µg/g)
Reference
Escherichia coli B GC-FID 2.3-11.8 [1]
Escherichia coli GC-FPD 23.45 [2]
Bacteroides fragilis GC-FID 2.4 [1]
Aerobacter aerogenes GC-FPD 10.62 [2]
Aerobacter vinelandii GC-FPD 34.96 [2]
Bacillus subtilis GC-FPD 17.65 [2]
Clostridium perfringens GC-FPD Not detected [2]
Micrococcus lysodeikticus GC-FPD 4.34 [2]
Pseudomonas fluorescens GC-FPD 16.25 [2]
Saccharomyces cerevisiae GC-FPD 1.54 [2]
Saccharomyces cerevisiae GC-FID 3.3-8.3 [3]
Where:
[1] (WHITE; 1981)
[2] (KATAOKA, HIRABAYASHI and MAKITA; 1993)
[3] (KÖNIG, L. and KNABE; 1990)
α-Lipoic acid content in Saccharomyces cerevisiae was determined by GC–
FID analysis of its methyl ester. The recovery of α-LA from sample during sulphuric
acid hydrolysis and dichloromethane extraction was about 30% (KOZMA-KOVACS,
HALASZ, HAJOS, SASS and BOROSS; 1991). In addition, α-LA content in several
bacterial cells was also determined by GC–FPD, based on the preparation of its S,S-
DEOC methyl ester derivative. Base hydrolysis was also used to release α-LA from
different bacterial cells. It was difficult to determine the content of α-LA by GC–FID
due to the interfering peaks and low sensitivity, but α-LA could be analyzed by GC–
FPD without any such interference from matrix substances (KATAOKA,
Literature survey
48
HIRABAYASHI and MAKITA; 1993). The analytical data in Table 4 represent the
total content of free and bound forms of LA and DHLA in these samples, as the
samples were hydrolyzed with potassium hydroxide and reduced with NaBH4. The
detection limit of α-LA in these samples was 10 ng/g.
2.7.3.3 Animal tissues
α-Lipoic acid content was determined in rat tissues and other biological
materials by GC–FID analysis based on de-lipidation, sulphuric acid hydrolysis,
benzene extraction and derivatization with diazomethane (SHIH and
STEINSBERGER; 1981). It was found that α-LA level in the chicken egg increases
with incubation time or during embryo development.
α-Lipoic acid content in the rat tissues was determined by GC–FID as its S,S-
DBZ methyl ester and methyl ester derivatives, respectively (WHITE; 1981;
NATRAJ, GANDHI and MENON; 1984).
In another study, α-LA content in several tissues of mouse was determined as
its S,S-DEOC methyl ester derivative by GC–FPD (KATAOKA, HIRABAYASHI
and MAKITA; 1993). Han et al. determined free α-LA and DHLA in Jurkat cells and
fibroblasts by HPLC–EC analysis (HAN, HANDELMAN and PACKER; 1995).
Moreover, Teichert et al. developed a selective and sensitive method for the
determination of α-LA and DHLA in human plasma (TEICHERT and PREISS; 1992;
TEICHERT and PREISS; 1995; TEICHERT and PREISS; 1997). This method
consisted of enzymatic hydrolysis to release the protein-bound α-LA, solid-phase
extraction, and HPLC–EC analysis. The detection limit of α-LA in plasma for this
method was 1 ng/ml, and the basic levels of α-LA and DHLA in plasma from six
healthy volunteers were 1–25 and 33–145 ng/ml, respectively.
2.7.3.4 Drug
Pharmacokinetics of R- and S- α-LA has been under investigation due to their
different in vitro and in vivo biological activities. Kamata et al. developed a HPLC–
EC method for the determination of α-LA and lipoamide (LAM) and reported that
these compounds could be quantitatively recovered from a spiked placebo formulation
(KAMATA and AKIYAMA; 1990).
Literature survey
49
α-Lipoic acid and LAM were determined in a commercial formulation of the
cited acidic drug by a HPLC–FL method, using pre-column derivatization with Br-
AMN (GATTI, BOUSQUET, BONAZZI and CAVRINI; 1996). Another method was
developed for the determination of α-LA enantiomers and applied to pharmacokinetic
studies (NIEBCH et al.; 1997).
A new spectrophotometric method was published to assay α-LA (thioctic acid)
in pharmaceutical formulations using an absorption maximum at 365 nm. The method
is simple, sensitive and reproducible (KORICANAC, CAKAR, TANASKOVIC and
JOVANOVIC; 2007).
A potentiometric lipoate-selective sensor was developed, based on mercuric
lipoate ion-pair as a membrane carrier, to determine α-LA in pharmaceutical
preparations and urine (ABBAS and RADWAN; 2008). The sensor exhibited a
significantly enhanced response towards the lipoate ions over the concentration range
of 1 × 10⁻⁷ mol/l to 1 × 10⁻² mol/l with a limit of detection of 9 × 10⁻⁸ mol/l and a
slope of −29.4 mV/decade, with standard deviation of the slope is 0.214 mV. The
sensor has a response time of ≤ 12s and can be used for at least 6 weeks without any
considerable divergence in its potential response.
2.7.3.5 Dietary supplements
Supplementation of α-LA under various oxidative stress related conditions has
been extensively studied, however very few analytical data are available for the
quantification of α-LA content in different dietary supplements.
Sitton et al. developed an analytical method for the quantitative determination
of α-LA in a dietary supplement preparation by a rapid capillary electrophoretic
method, using UV detection at 208 nm (SITTON, SCHMID, GUBITZ and ABOUL-
ENEIN; 2004). Although α-LA is only weakly UV-absorbing, at this wavelength it
could be detected with sufficient sensitivity with LOD and LOQ of 0.8 and 2.5 µg/ml,
respectively. The compound was extracted from tablets using methanol with a
recovery of 98.3% and a precision of 2.8% RSD.
α-Lipoic acid content was determined in two dietary supplements, syrup and
capsules by differential pulse voltammetry at a glassy carbon electrode. The limits of
Literature survey
50
detection (LOD) and quantification (LOQ) were 1.8 and 6.1 µM at pH 6.9,
respectively (CORDUNEANU, GARNETT and BRETT; 2007).
2.7.3.6 Food
α-Lipoic acid was determined in meat of commercial quality by a sensitive
GC–CI-MS method based on sulphuric acid hydrolysis, diethyl ether extraction,
derivatization with MTBSTFA and SIM, using the base peak m/z 189 for
quantification (MATTULAT and BALTES; 1992). The recoveries of α-LA in meat
with this method were about 60–70%. α-LA was also determined in vegetables by
GC-FID and was found to be present at low levels in wheat germ (ca. 0.1 ppm), but
was not detected in flour or semolina (VIANEY-LIAUD, KOBREHEL, SAUVAIRE,
WONG and BUCHANAN; 1994). In addition, it was found that α-LA content was
higher in food derived from animal sources than in vegetables (KATAOKA,
HIRABAYASHI and MAKITA; 1997).
The values of α-LA content in tissues and food samples obtained from
different experiments are summarized in Table 5.
2.7.4 Summary
Most of the analytical methods deal with quantitation either in foodstuffs or
only for the pharmaceutical preparates. Even there is no clear differentiation between
free or total lipoic acid content in most methods. The lack of a standard and specific
method to extract α-LA has lead towards the basis of this research work.
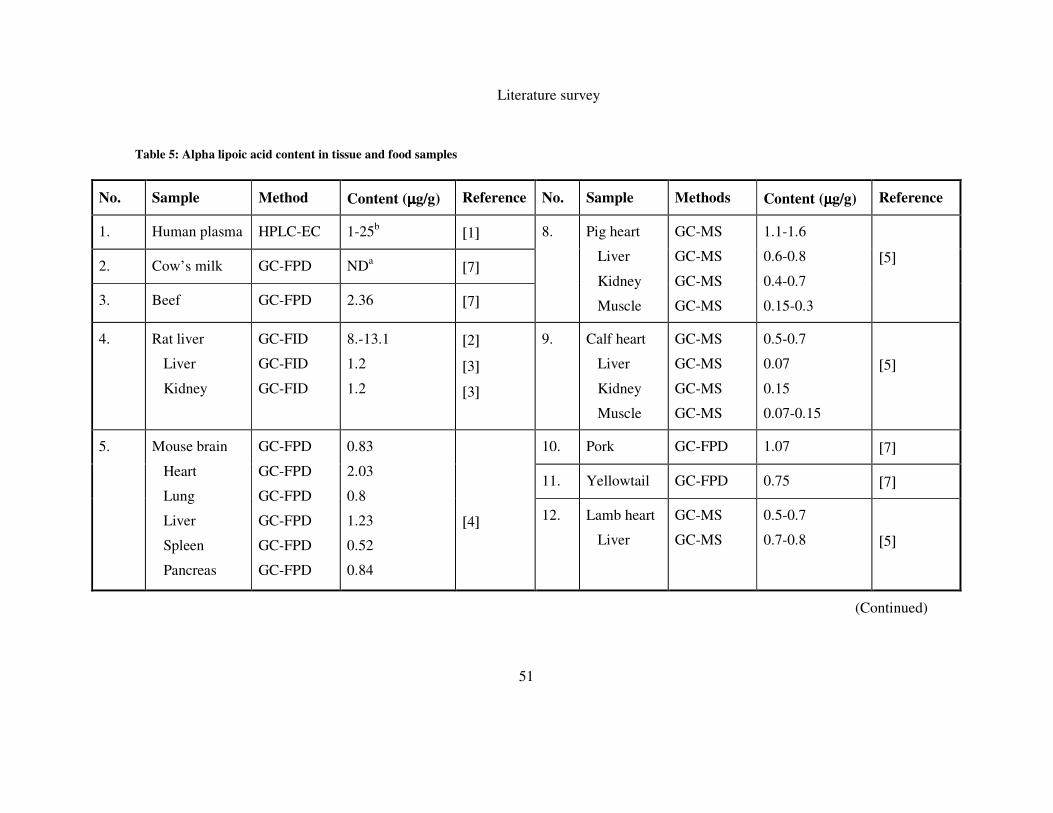
Literature survey
51
Table 5: Alpha lipoic acid content in tissue and food samples
(Continued)
No. Sample Method Content (µµµµg/g) Reference No. Sample Methods Content (µµµµg/g) Reference
1. Human plasma HPLC-EC 1-25b [1] 8. Pig heart
Liver
Kidney
Muscle
GC-MS
GC-MS
GC-MS
GC-MS
1.1-1.6
0.6-0.8
0.4-0.7
0.15-0.3
[5]
2. Cow’s milk GC-FPD NDa [7]
3. Beef GC-FPD 2.36 [7]
4. Rat liver
Liver
Kidney
GC-FID
GC-FID
GC-FID
8.-13.1
1.2
1.2
[2]
[3]
[3]
9. Calf heart
Liver
Kidney
Muscle
GC-MS
GC-MS
GC-MS
GC-MS
0.5-0.7
0.07
0.15
0.07-0.15
[5]
5. Mouse brain
Heart
Lung
Liver
Spleen
Pancreas
GC-FPD
GC-FPD
GC-FPD
GC-FPD
GC-FPD
GC-FPD
0.83
2.03
0.8
1.23
0.52
0.84
[4]
10. Pork GC-FPD 1.07 [7]
11. Yellowtail GC-FPD 0.75 [7]
12. Lamb heart
Liver
GC-MS
GC-MS
0.5-0.7
0.7-0.8
[5]

Literature survey
52
Table 5: Alpha lipoic acid content in tissue and food samples (Continued)
aNot detectable b(ng/ml)
[1] (TEICHERT and PREISS; 1992)
[2] (NATRAJ, GANDHI and MENON; 1984)
[3] (WHITE; 1981)
[4] (KATAOKA, HIRABAYASHI and MAKITA; 1993)
[5] (MATTULAT and BALTES; 1992)
[6] (SHIH and STEINSBERGER; 1981)
[7] (KATAOKA, HIRABAYASHI and MAKITA; 1997)
No. Sample Method Content (µµµµg/g) Reference No. Sample Method Content (µµµµg/g) Reference
5.
(cont’d)
Mouse muscle
Kidney
Testis
GC-FPD
GC-FPD
GC-FPD
0.7
1.54
1.07
[4]
13. Lamb Kidney
Muscle
GC-MS
GC-MS
0.5-0.7
0.2-0.4
[5]
6. Cuttlefish GC-FPD 0.55 [7] 14. Chicken
liver
GC-FPD
GC-FID
0.91
5-10
[7]
[6]
7. Wheat grain GC-FID 0.1 [8] 15. Egg white
Egg yolk
GC-FPD
GC-FPD
ND
1.24
[7]
Aim of the present study
53
3 AIM OF THE PRESENT STUDY
One of the main drawbacks of previous experiments performed to determine
α-LA content was the use of drastic sample preparation steps which resulted merely in
the destruction of free α-LA. In addition, the chromatographic methods used also
required derivatization of α-LA prior to analysis. Due to these facts, very few
analytical data were available to account for the α-LA content in food samples
especially the free α-LA content.
The aim of the present work was to develop an analytical method to determine
free α-LA content in different dietary supplements and food samples using high
performance liquid chromatography with different detection modes such UV, CEAD
and MS. Main theme of this project was to develop a rapid and reliable analytical
method based upon simple and non-destructive sample preparation method.
First the chromatographic method was developed to obtain well shaped peaks
of α-LA in a shorter run time. Bisphenol A was used as an internal standard and three
chromatographic systems were optimized using standard solutions i.e. HPLC-UV,
HPLC-CEAD and HPLC-ESI-MS. Then, different extraction methods were
investigated to obtain free α-LA content from different dietary supplements and
foodstuffs. The structure of the experimental work is summarized in Figure 4.
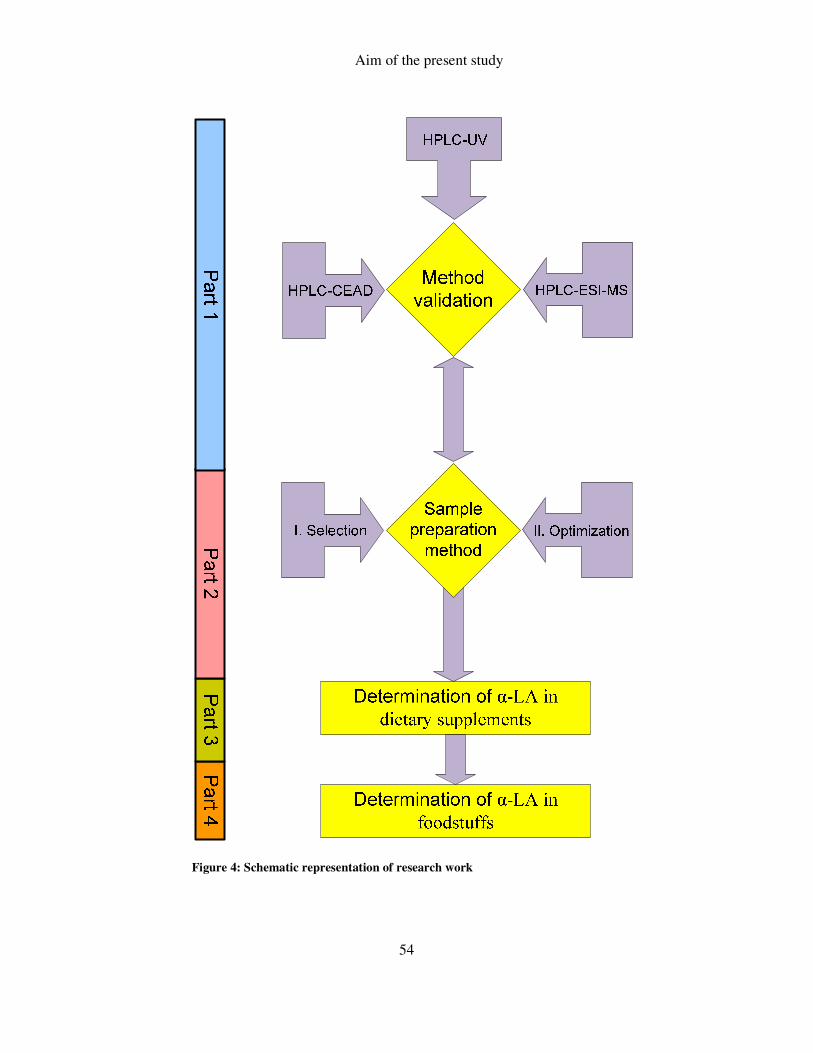
Aim of the present study
54
Figure 4: Schematic representation of research work
Instrumental set-up
55
4 INSTRUMENTAL SET-UP
This chapter gives a brief description of instrumental set-up used in this
research work with special emphasis on the theoretical background (SNYDER,
KIRKLAND and GLAJCH; 1997).
High performance liquid chromatographic method was selected to determine
α-LA content in the samples under investigation using different detection modes. In
addition, different extraction techniques used in this research work are also briefly
described.
4.1 High performance liquid chromatography
High-performance liquid chromatography (HPLC), also sometimes referred as
high-pressure liquid chromatography, is a form of column chromatography and is one
of the most widely used analytical separation method. HPLC is used to separate
components of a mixture by using a variety of chemical interactions between the
substance being analyzed (analyte) and the chromatography column. It depends on the
interaction of sample analytes with the stationary phase (packing) and the mobile
phase to effect a separation.
In reversed phase (RP) chromatography the mobile phase is more polar than
the stationary phase and is commonly used for non-polar or weakly polar substances.
Stationary phases may be either coated to a support, or they may be chemically
bonded to the surface.
4.1.1 Theoretical background
The goal of any HPLC experiment is to achieve the desired separation in the
shortest possible time. Optimization of the experiment usually involves manipulation
of column and mobile phase parameters to alter the relative migration rates of the
components in the mixture and to reduce zone broadening. These can generally be
optimized fairly independently. Some important parameters of a HPLC system are
briefly discussed in the following pages.
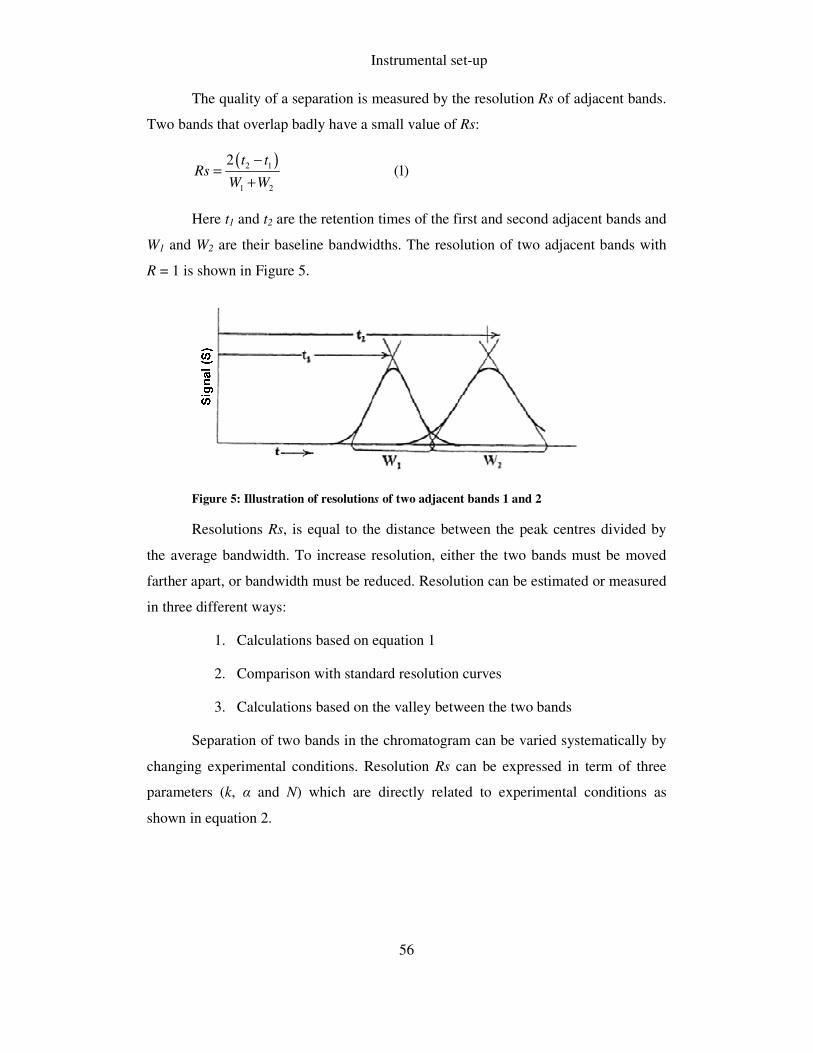
Instrumental set-up
56
The quality of a separation is measured by the resolution Rs of adjacent bands.
Two bands that overlap badly have a small value of Rs:
( )2 1
1 2
2(1)
t tRs
W W
−=
+
Here t1 and t2 are the retention times of the first and second adjacent bands and
W1 and W2 are their baseline bandwidths. The resolution of two adjacent bands with
R = 1 is shown in Figure 5.
Figure 5: Illustration of resolutions of two adjacent bands 1 and 2
Resolutions Rs, is equal to the distance between the peak centres divided by
the average bandwidth. To increase resolution, either the two bands must be moved
farther apart, or bandwidth must be reduced. Resolution can be estimated or measured
in three different ways:
1. Calculations based on equation 1
2. Comparison with standard resolution curves
3. Calculations based on the valley between the two bands
Separation of two bands in the chromatogram can be varied systematically by
changing experimental conditions. Resolution Rs can be expressed in term of three
parameters (k, α and N) which are directly related to experimental conditions as
shown in equation 2.
Instrumental set-up
57
( )1 21 1 N (2)4 1
( ) ( ) ( )
kRs
k
selectivity efficiency retention
α= −+
Here k is the average retention factor for the two bands (also called the
capacity factor, k′ ), N is the column plate number, and α is the separation factor and
can be calculated using the following formulae:
2
1
(3)k
kα =
Here k1 and k2 are values of k for adjacent bands 1 and 2. This equation is very
important in method development because it classifies the dozen or so experimental
variables into three categories: retention (k), column efficiency (N), and selectivity
(α). This simplifies the systematic variations of conditions to achieve some desired
separation. It is convenient to regard k, N and α as independent to each other, so that
changes can be made in each variable without affecting the other two. However, this
is only a rough approximation, especially in the case of k and α.
The retention factor, k, is given as follows:
0
0
(4)Rt tk
t
−=
Here tR is the band retention time and t0 is the column dead time. The column
dead time (t0) is related to the column dead volume Vm (Volume of the mobile phase
inside the column) and flow rate F.
0 (5)mVt
F=
The parameters k and α are determined by those conditions that affect
retention or the equilibrium distribution of the sample between the mobile phase and
the column packing:
1. Composition of the mobile phase
2. Composition of the stationary phase (column)
3. Temperature
Instrumental set-up
58
Changes in the mobile phase or stationary phase will generally affect both k
and α, but will have less effect on N. The column plate number N is primarily
dependent on column quality and can be varied by changing column conditions:
1. Flow rate
2. Column length
3. Particle size
A change in these conditions will not affect k or α as long as the mobile phase
and stationary phase type are not changed
Column quality/performance can be defined in terms of values of N and
asymmetry (band shape) for a test substance run under ‘favourable’ conditions. The
column plate number, N, is defined as follows:
2
16 (6)RtNW
=
As manual measurement of the baseline bandwidth W may be subjected to
error. Therefore, a more practical equation for N is
2
12
5.54 (7)Rt
NW
=
Here tR is band retention time and W1/2 is the bandwidth at half-height.
Another relationship that is used to measure N is
2
2 (8)Rt hN
Aπ
′ =
Here h′ is the peak height and A is the peak area. Equation 8 is often is used
in HPLC data systems to determine a value of N.
4.1.2 Instrumentation
HPLC instruments consist of a reservoir of mobile phase, a pump, an injector, a
separation column, and a detector (Figure 6). Compounds are separated by injecting a
plug of the sample mixture onto the column. The different components in the mixture
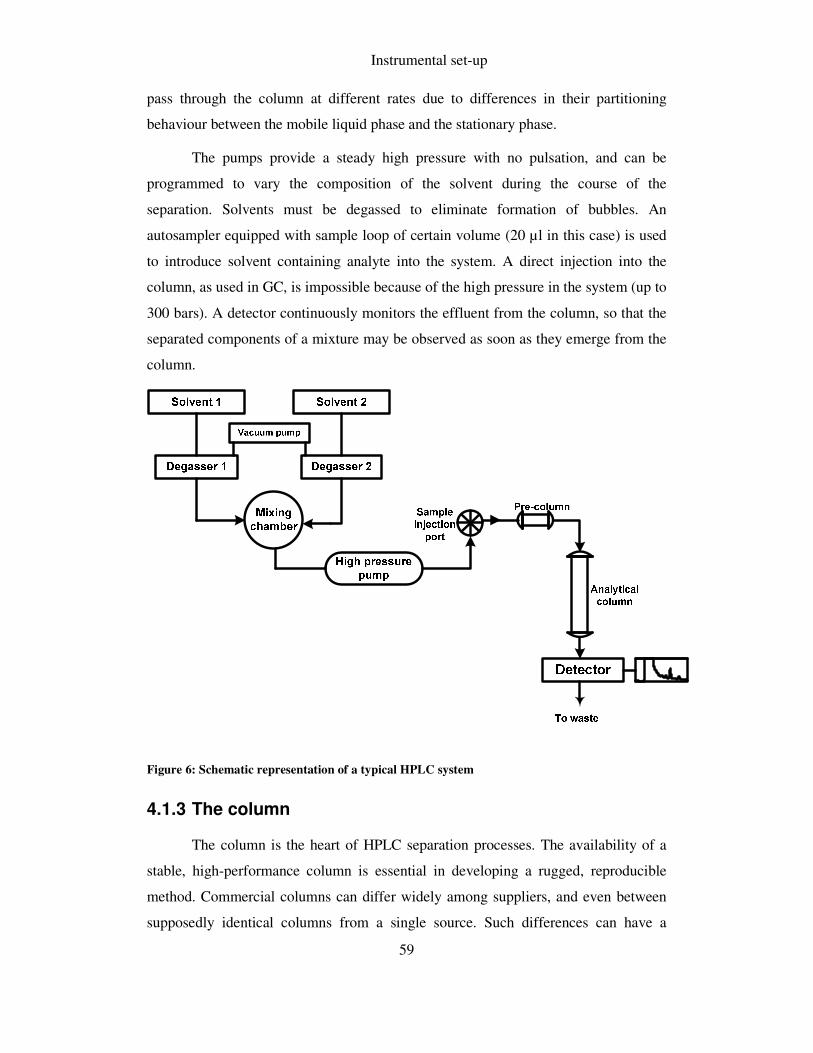
Instrumental set-up
59
pass through the column at different rates due to differences in their partitioning
behaviour between the mobile liquid phase and the stationary phase.
The pumps provide a steady high pressure with no pulsation, and can be
programmed to vary the composition of the solvent during the course of the
separation. Solvents must be degassed to eliminate formation of bubbles. An
autosampler equipped with sample loop of certain volume (20 µl in this case) is used
to introduce solvent containing analyte into the system. A direct injection into the
column, as used in GC, is impossible because of the high pressure in the system (up to
300 bars). A detector continuously monitors the effluent from the column, so that the
separated components of a mixture may be observed as soon as they emerge from the
column.
Figure 6: Schematic representation of a typical HPLC system
4.1.3 The column
The column is the heart of HPLC separation processes. The availability of a
stable, high-performance column is essential in developing a rugged, reproducible
method. Commercial columns can differ widely among suppliers, and even between
supposedly identical columns from a single source. Such differences can have a
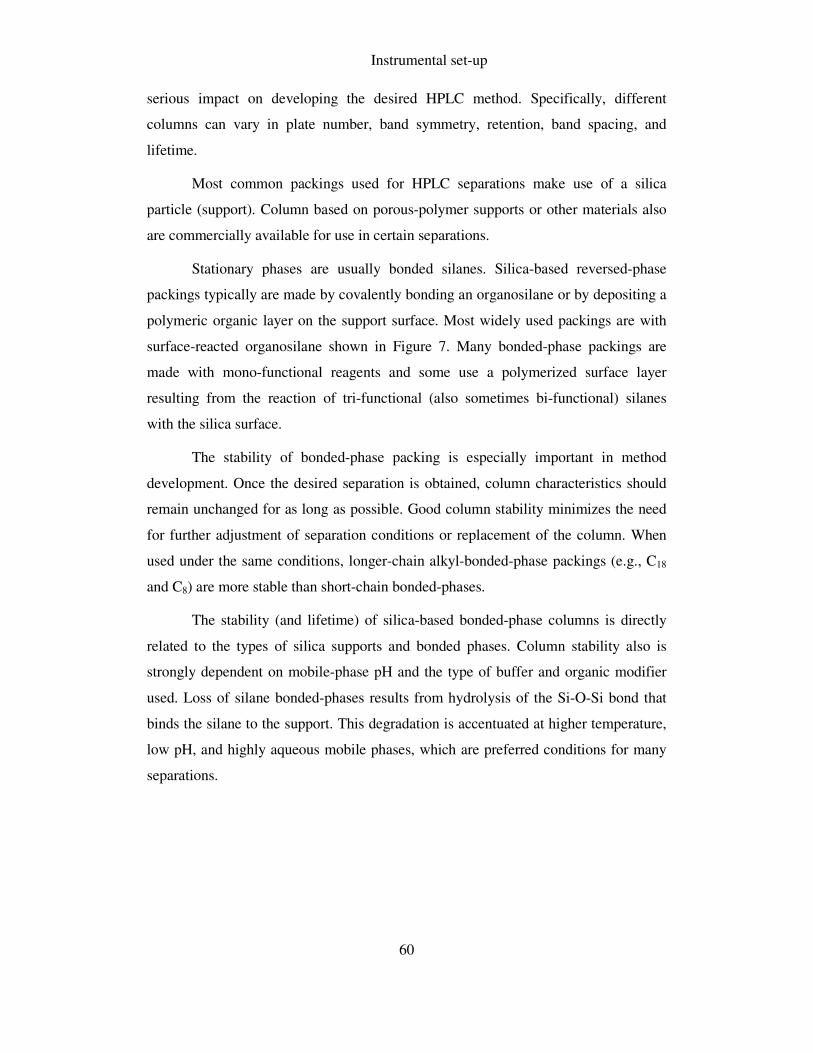
Instrumental set-up
60
serious impact on developing the desired HPLC method. Specifically, different
columns can vary in plate number, band symmetry, retention, band spacing, and
lifetime.
Most common packings used for HPLC separations make use of a silica
particle (support). Column based on porous-polymer supports or other materials also
are commercially available for use in certain separations.
Stationary phases are usually bonded silanes. Silica-based reversed-phase
packings typically are made by covalently bonding an organosilane or by depositing a
polymeric organic layer on the support surface. Most widely used packings are with
surface-reacted organosilane shown in Figure 7. Many bonded-phase packings are
made with mono-functional reagents and some use a polymerized surface layer
resulting from the reaction of tri-functional (also sometimes bi-functional) silanes
with the silica surface.
The stability of bonded-phase packing is especially important in method
development. Once the desired separation is obtained, column characteristics should
remain unchanged for as long as possible. Good column stability minimizes the need
for further adjustment of separation conditions or replacement of the column. When
used under the same conditions, longer-chain alkyl-bonded-phase packings (e.g., C18
and C8) are more stable than short-chain bonded-phases.
The stability (and lifetime) of silica-based bonded-phase columns is directly
related to the types of silica supports and bonded phases. Column stability also is
strongly dependent on mobile-phase pH and the type of buffer and organic modifier
used. Loss of silane bonded-phases results from hydrolysis of the Si-O-Si bond that
binds the silane to the support. This degradation is accentuated at higher temperature,
low pH, and highly aqueous mobile phases, which are preferred conditions for many
separations.
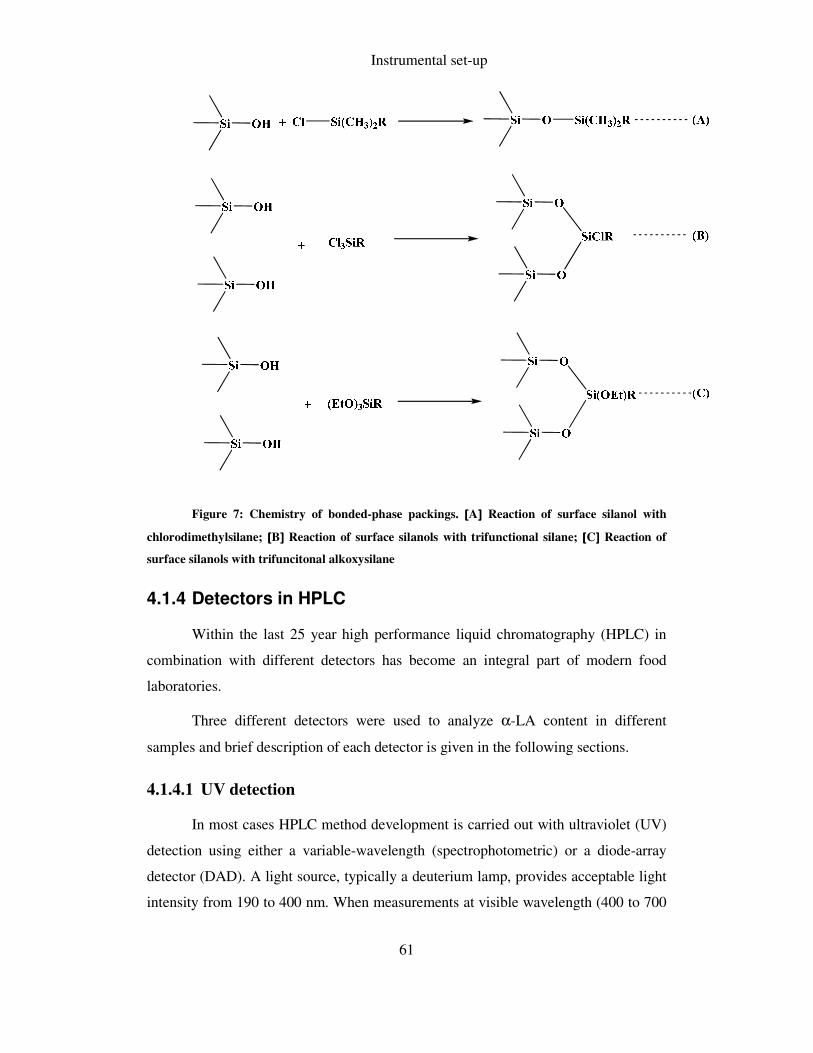
Instrumental set-up
61
Figure 7: Chemistry of bonded-phase packings. [[[[A]]]] Reaction of surface silanol with
chlorodimethylsilane; [[[[B]]]] Reaction of surface silanols with trifunctional silane; [[[[C]]]] Reaction of
surface silanols with trifuncitonal alkoxysilane
4.1.4 Detectors in HPLC
Within the last 25 year high performance liquid chromatography (HPLC) in
combination with different detectors has become an integral part of modern food
laboratories.
Three different detectors were used to analyze α-LA content in different
samples and brief description of each detector is given in the following sections.
4.1.4.1 UV detection
In most cases HPLC method development is carried out with ultraviolet (UV)
detection using either a variable-wavelength (spectrophotometric) or a diode-array
detector (DAD). A light source, typically a deuterium lamp, provides acceptable light
intensity from 190 to 400 nm. When measurements at visible wavelength (400 to 700
Instrumental set-up
62
nm) are required, a higher-energy tungsten-halide lamp is often used. However, most
HPLC applications are carried out using wavelengths below 400 nm.
Schematic illustration of a typical UV detector is show in Figure 8. Light from
the lamp passes through a UV-transmitting flow cell, connected to the column and
impinges on a diode that measures the light intensity I. The detector electronics then
convert the signal from the two diodes into the absorbance A, which is transmitted to
the data system:
0log (9)I
AI
=
Here, I is the light intensity before the flow cell and I0 is the light intensity
after the flow cell.
Analyte concentration C in the flow cell is related to absorbance A, analyte
molar absorptivity ε, and flow-cell length Lfc by Beer’s law:
(10)fc
A C Lε=
Figure 8: Schematic presentation of a typical UV detector
A general goal in selecting experimental conditions that affect detection is to
maximize the signal S (equal to A at peak maximum) of sample components of
interest. For many samples, good analytical results will be obtained only by careful
selection of the wavelength used for detection. This choice requires knowledge of the
UV spectra of individual sample components.
Instrumental set-up
63
4.1.4.2 Coulometric electrode array detection
Coulometric electrode array is a type of electrochemical (EC) detector used
whenever greater sensitivity is required. The detection can be performed in either the
oxidative or reductive mode, depending, in part, on the analyte. All EC detectors have
three electrodes:
1. Working or test electrode
2. Reference electrode
3. Auxiliary or counter electrode
A typical coulometric electrode cell is shown in Figure 9. Overall reaction
taking place in the coulometric cells can be divided into following three steps:
1. The molecule is transported, by convective diffusion, to the electrode surface.
At any liquid/solid interface there is always a stationary or stagnant layer or
liquid.
2. The transfer of electrons takes place and the chemical reaction has occurred.
3. The products of reaction desorb and diffuse back through the diffusion layer.
The electrochemical reaction occurs at the surface of the working/test
electrode. The potential required to drive the reaction is applied between the working
and reference electrodes. The current produced by the reaction is called limiting
current, iL, and is measured between the test and counter electrodes.
(11)L
i zFcU=
Here Li is the limiting current, z is the number of electrons converted/analyte
molecule, F is the Faraday constant (96485 C/mol), c is the concentration of the
electrochemically active substances (mol/ml) and U is the flow rate (ml/s). The peak
area is the integral of the current over time:
2
1
(12)t
t
Q zFn Idt= = ∫
Here, Q is the charge (C) and n is the number of moles (mol). Both peak area
and peak height can be used for the quantitative purpose.
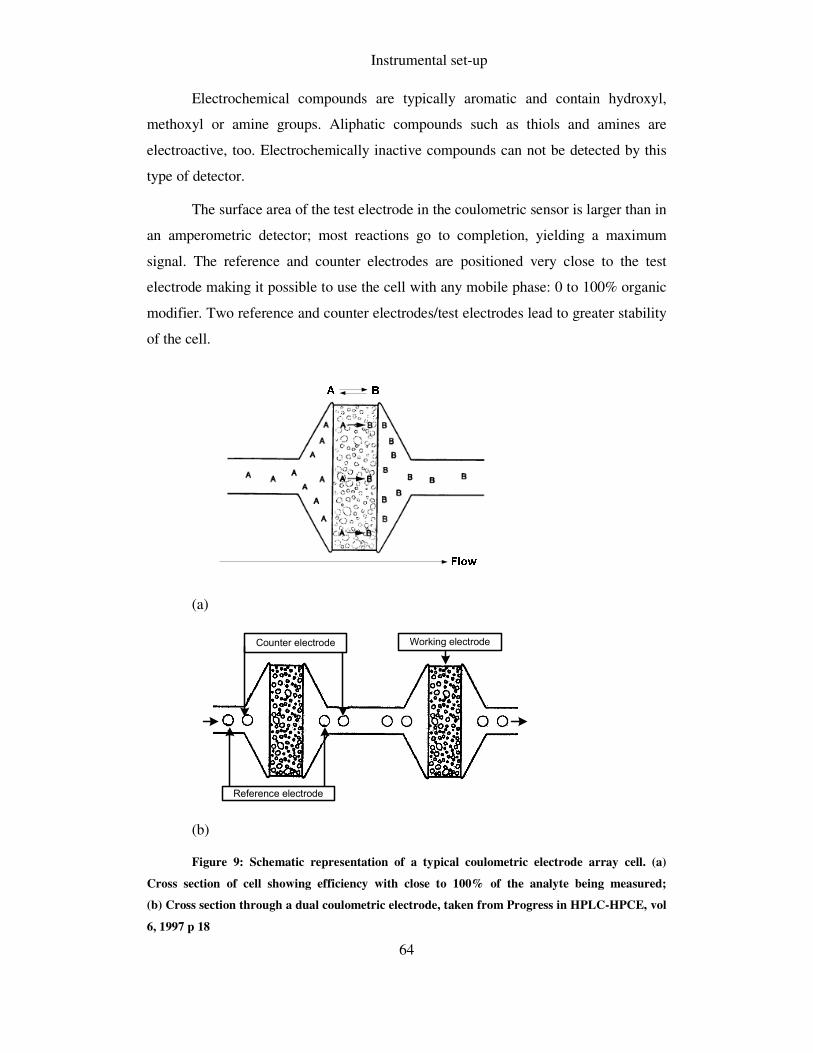
Instrumental set-up
64
Electrochemical compounds are typically aromatic and contain hydroxyl,
methoxyl or amine groups. Aliphatic compounds such as thiols and amines are
electroactive, too. Electrochemically inactive compounds can not be detected by this
type of detector.
The surface area of the test electrode in the coulometric sensor is larger than in
an amperometric detector; most reactions go to completion, yielding a maximum
signal. The reference and counter electrodes are positioned very close to the test
electrode making it possible to use the cell with any mobile phase: 0 to 100% organic
modifier. Two reference and counter electrodes/test electrodes lead to greater stability
of the cell.
(a)
n
Working electrode
Reference electrode
Counter electrode
(b)
Figure 9: Schematic representation of a typical coulometric electrode array cell. (a)
Cross section of cell showing efficiency with close to 100% of the analyte being measured;
(b) Cross section through a dual coulometric electrode, taken from Progress in HPLC-HPCE, vol
6, 1997 p 18
Instrumental set-up
65
The coulometric array cell is built upon the dual serial flow-through graphite
cell design described in Figure 9. There are several characteristics, inherent in the
electrode design, that make the porous graphite electrode attractive for arrays. First,
they are coulometrically efficient; that is, a compound will present a maximum at one
electrode and then drop to zero at subsequent sensors. Second, the band spreading,
dead-volume and pressure characteristics of the cells are such that there is no
significant degradation of the chromatographic separation at the last sensor in the
array and no significant difference in registration time between the first and last
electrode (MATSON, LANGLAIS, VOLICER, GAMACHE et al.; 1984). Third,
hydrodynamic voltammograms (HDVs) from the flow-through coulometric electrodes
are sharper than those from amperometric electrodes for many compounds. Fourth,
analytes can be measured at higher potentials with sensitivity, as noise will be
diminished by the preceding sensors.
A typical coulometric electrode array system consists of 4 to 16 coulometric
flow-through cells, also called ‘channels’ as shown in Figure 10. Signal from a single
compound is measured on three consecutive electrodes (preceding - 2, dominant - 3
and following – 4) with applied potentials placed along the compound’s potential axis
(Figure 10). The response ratios of 2/3 and 4/3 (along with retention time) are used
qualitatively to identify the compound. A plot of the cumulative detector response
against applied voltage produces the compound’s HDV. These channels have the
benefits of eliminating the calibration drift, have extended cell shelf-life due to very
slow loss of signal through cell poisoning and their response is independent of flow
rate.

Instrumental set-up
66
(a)
(b)
Figure 10: Coulometric electrode array cell. (a) Four serially placed flow-through
graphite electrodes; (b) Resolution of a compound across the array at its elution time and
construction of hydrodynamic voltammograms (HDV); taken from Progress in HPLC-HPCE,
vol 6, 1997 p 30
4.1.5 Liquid chromatography-mass spectrometry
Liquid chromatography-mass spectrometry (LC/MS) is an analytical technique
that combines the separation power of HPLC with the detection particular in mass
spectrometry. HPLC separates the sample components and introduces them into a
mass spectrometer. This instrument forms and detects ions for analysis. LC/MS data
provides information about the molecular weight, structure of specific sample
components, and quantitative proportion.
A mass spectrometer can facilitate HPLC method development and avoid
common problems by:
1. Tracking and identifying individual peaks in the chromatogram
between experiments
Instrumental set-up
67
2. Distinguishing compounds of interest from minor compounds or
interferences
3. Recognizing unexpected and overlapping interference peaks to avoid a
premature finish to method development
Mass spectrometers have three distinct features: (1) the source, (2) the
analyzer, and (3) the detector, and differences in these three components differentiate
the types of MS techniques that are useful with HPLC. For all MS techniques, an
analyte is first ionized in the source, since the MS can only detect charged species.
Ions of discrete mass/charge ratios (m/z) are then separated and focused in the mass
analyzer. The final focused beam impinges on a detector that determines the intensity
of the beam. The analyzer is thus comparable to the prism or monochromator for
spectrophotometric techniques, except that ions of discrete m/z ratios are separated
and focused rather than photons of discrete wavelengths.
Selection of the ion source differentiates among different MS techniques for
HPLC applications. Different techniques are often based solely on the source utilized.
Samples are run by electron ionization (EI), chemical ionization (CI), fast-atom
bombardment (FAB), electrospray ionization (ESI), thermo spray (TSP), laser
desorption (LD), and so on.
Electron-ionization or electron impact mass spectrometry (EI-MS) is the most
familiar and commonly utilized form of MS today and is a staple of all environmental
labs. The EI-MS may provide both quantitative and qualitative information. The EI
process requires that volatile compounds be introduced into the MS, however many
analytes in HPLC are polar and non-volatile, this technique is not useful for online
LC-MS. Fortunately, other ionization methods exist that are based on the desorption
of non-volatile and thermally labile compounds directly from solutions or solid
surfaces.
4.1.5.1 Ion trap electrospray mass spectrometry
Electrospray ionization (ESI) is one of the most commonly used ionization
methods and has revolutionized the field of MS. It is best suited for ionizing highly
polar and thermally little stable compounds that are intrinsically charged in solution or
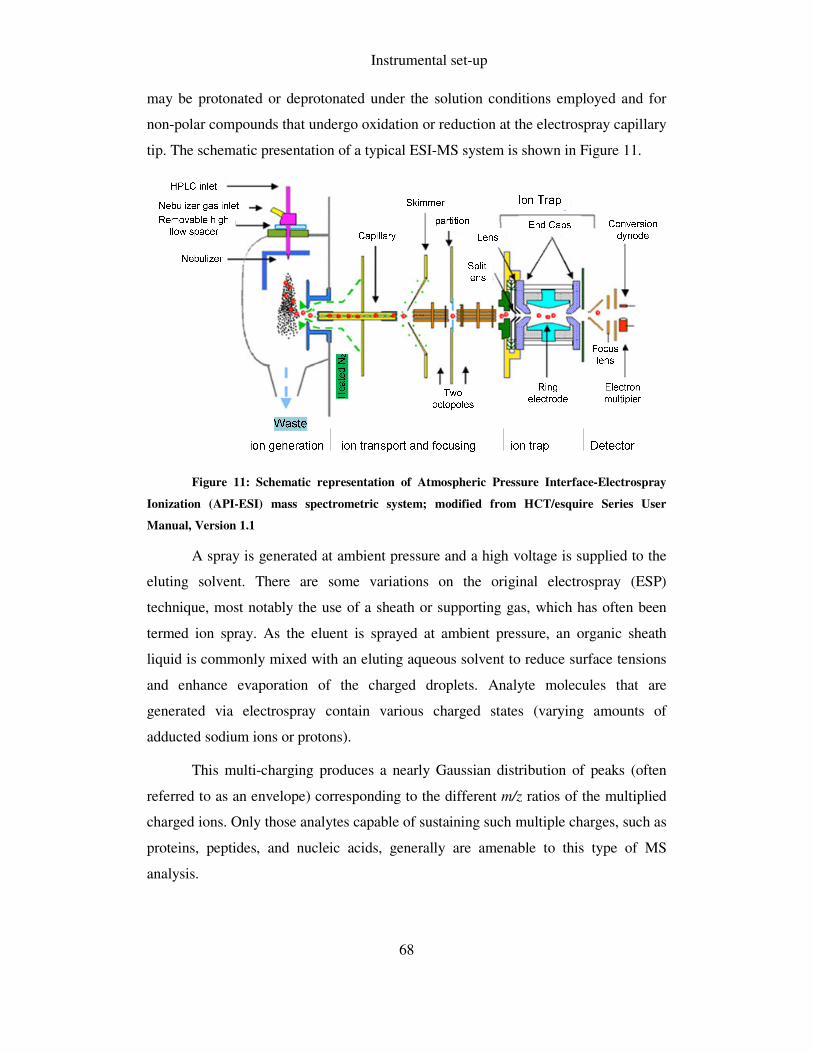
Instrumental set-up
68
may be protonated or deprotonated under the solution conditions employed and for
non-polar compounds that undergo oxidation or reduction at the electrospray capillary
tip. The schematic presentation of a typical ESI-MS system is shown in Figure 11.
Figure 11: Schematic representation of Atmospheric Pressure Interface-Electrospray
Ionization (API-ESI) mass spectrometric system; modified from HCT/esquire Series User
Manual, Version 1.1
A spray is generated at ambient pressure and a high voltage is supplied to the
eluting solvent. There are some variations on the original electrospray (ESP)
technique, most notably the use of a sheath or supporting gas, which has often been
termed ion spray. As the eluent is sprayed at ambient pressure, an organic sheath
liquid is commonly mixed with an eluting aqueous solvent to reduce surface tensions
and enhance evaporation of the charged droplets. Analyte molecules that are
generated via electrospray contain various charged states (varying amounts of
adducted sodium ions or protons).
This multi-charging produces a nearly Gaussian distribution of peaks (often
referred to as an envelope) corresponding to the different m/z ratios of the multiplied
charged ions. Only those analytes capable of sustaining such multiple charges, such as
proteins, peptides, and nucleic acids, generally are amenable to this type of MS
analysis.
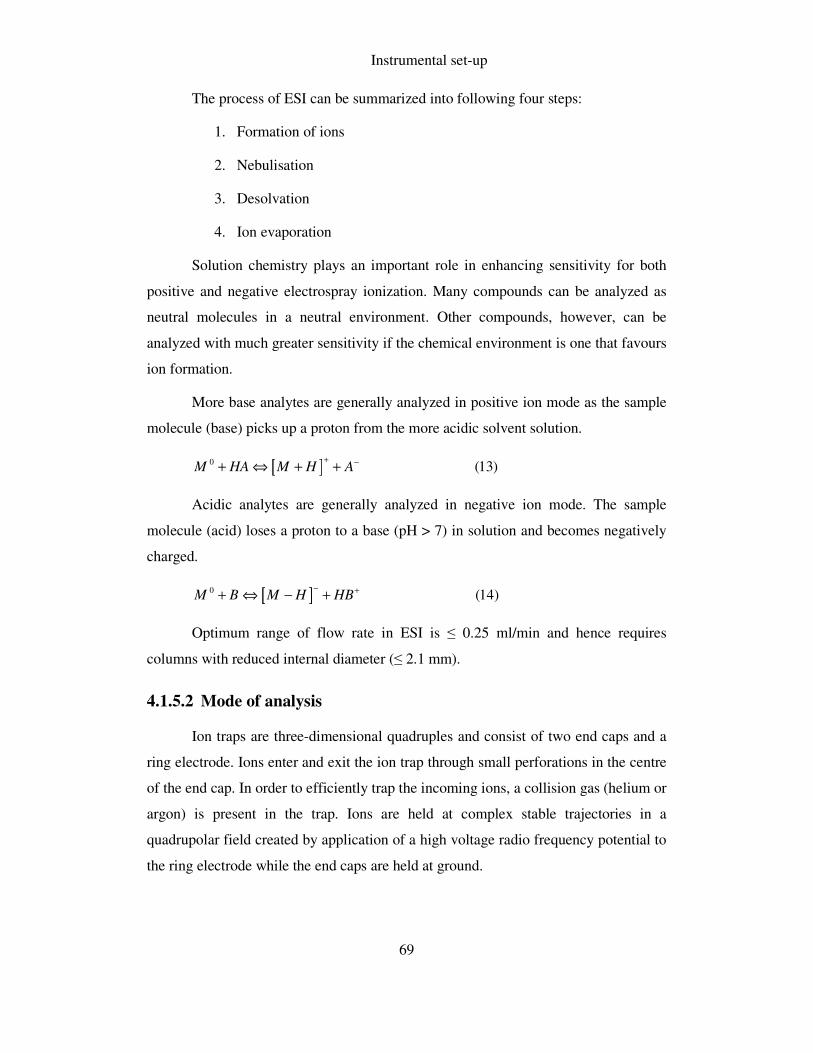
Instrumental set-up
69
The process of ESI can be summarized into following four steps:
1. Formation of ions
2. Nebulisation
3. Desolvation
4. Ion evaporation
Solution chemistry plays an important role in enhancing sensitivity for both
positive and negative electrospray ionization. Many compounds can be analyzed as
neutral molecules in a neutral environment. Other compounds, however, can be
analyzed with much greater sensitivity if the chemical environment is one that favours
ion formation.
More base analytes are generally analyzed in positive ion mode as the sample
molecule (base) picks up a proton from the more acidic solvent solution.
[ ]0 (13)M HA M H A+ −+ ⇔ + +
Acidic analytes are generally analyzed in negative ion mode. The sample
molecule (acid) loses a proton to a base (pH > 7) in solution and becomes negatively
charged.
[ ]0 (14)M B M H HB− ++ ⇔ − +
Optimum range of flow rate in ESI is ≤ 0.25 ml/min and hence requires
columns with reduced internal diameter (≤ 2.1 mm).
4.1.5.2 Mode of analysis
Ion traps are three-dimensional quadruples and consist of two end caps and a
ring electrode. Ions enter and exit the ion trap through small perforations in the centre
of the end cap. In order to efficiently trap the incoming ions, a collision gas (helium or
argon) is present in the trap. Ions are held at complex stable trajectories in a
quadrupolar field created by application of a high voltage radio frequency potential to
the ring electrode while the end caps are held at ground.
Instrumental set-up
70
Depending on the intensity of the ion signal, ions can be accumulated for
10 µs to 1s. During accumulation, all voltages in the ion transport and focussing
region are set for transmission.
In the scan mode, ions are progressively ejected by increasing the quadrupolar
and dipolar fields. When all ions have been removed from the trap, the initial
accumulation conditions are restored and a new accumulation and ejection scan cycle
starts.
In the MS(n) mode, all ions except one target ion are ejected. The selected ion
is isolated and can now be fragmented by increasing the ion’s energy by resonance
excitation. The produced fragment ions can now all be sent to the detector
(whereupon a new accumulation cycle starts) or a daughter ion can again be isolated
(by ejecting all ions but the target fragment ion) and subjected to fragmentation. This
whole process can theoretically be repeated for 10 times.
In the multiple reaction monitoring mode (MRM), ten compounds can be
selected for consecutive isolation and/or fragmentation experiments. Each compound
is isolated and/or fragmented individually. A special feature of MRM is that ions can
be fragmented without being isolated. This results in an increase in the sensitivity of
quantification.
The most important ion trap settings can be done by the trap drive which
depends mainly on the m/z ratio of the analytes, the scan range and ICC (ion charge
control) settings which are important for automatic adjustment of the accumulation
time of ions in the ion trap during LC-MS runs with time spans of low (background)
and high ion intensities (peaks).
The great advantage of ion trap mass analyzers are high sensitivity in the scan
mode due to high scan rates up to 13 000 m/z per second at normal resolution (in
contrast to single- and triple quadrupole mass analyzers) and the possibility of
sequential MS(n) analyses. The greatest limitation is low linearity of the detector
response due to overloading the ion trap.
Optimum settings for ion source, ion transfer and focussing region and ion trap
are determined experimentally by software controlled optimization. For that, a
solution containing the analyte of interest is continuously introduced into the mass

Instrumental set-up
71
spectrometer and a range of values are tested for each parameter. This can also help in
optimizing the condition for well separated peaks in case of co-eluting compounds.
Instrumental set-up
72
4.1.6 Sample preparation techniques
Sample preparation is an essential part of any solid-liquid extraction. A sample
must be in a liquid state prior to HPLC analysis. Some insoluble solids contain
soluble analytes such as additives in a solid polymer, fats in food, and poly-aromatic
hydrocarbons in soil. Contacting the sample with solvent allows the extraction of
analytes, following which the solvent is separated from the solid residue by decanting,
filtration, or centrifugation. The filtrate is further treated, prior to HPLC analysis.
Different sample preparation techniques were used during the research work
(Table 7) and are briefly discussed as follows:
1. Solid Phase Extraction (SPE)
2. Accelerated Solvent Extraction (ASE)
3. Ultrasound-assisted Extraction (UAE)
4.1.6.1 Solid phase extraction (SPE)
Solid phase extraction (SPE) is an extraction method that uses a solid phase
and a liquid phase to isolate one, or one type, of analyte from a solution. It is usually
used to clean up a sample before using a chromatographic or other analytical method
to quantify the amount of analyte(s) in the sample.
The general procedure is to load a solution onto the SPE phase, wash away
undesired components, and then wash off the desired analytes with another solvent
into a collection tube. Solid phase extractions use the same type of stationary phases
as are used in liquid chromatography columns. The stationary phase is contained in a
glass or plastic column above a frit or glass wool. The column might have a frit on top
of the stationary phase and might also have a stopcock to control the flow of solvent
through the column (Figure 12). Commercial SPE cartridges have 1-10 ml capacities
and are discarded after use.
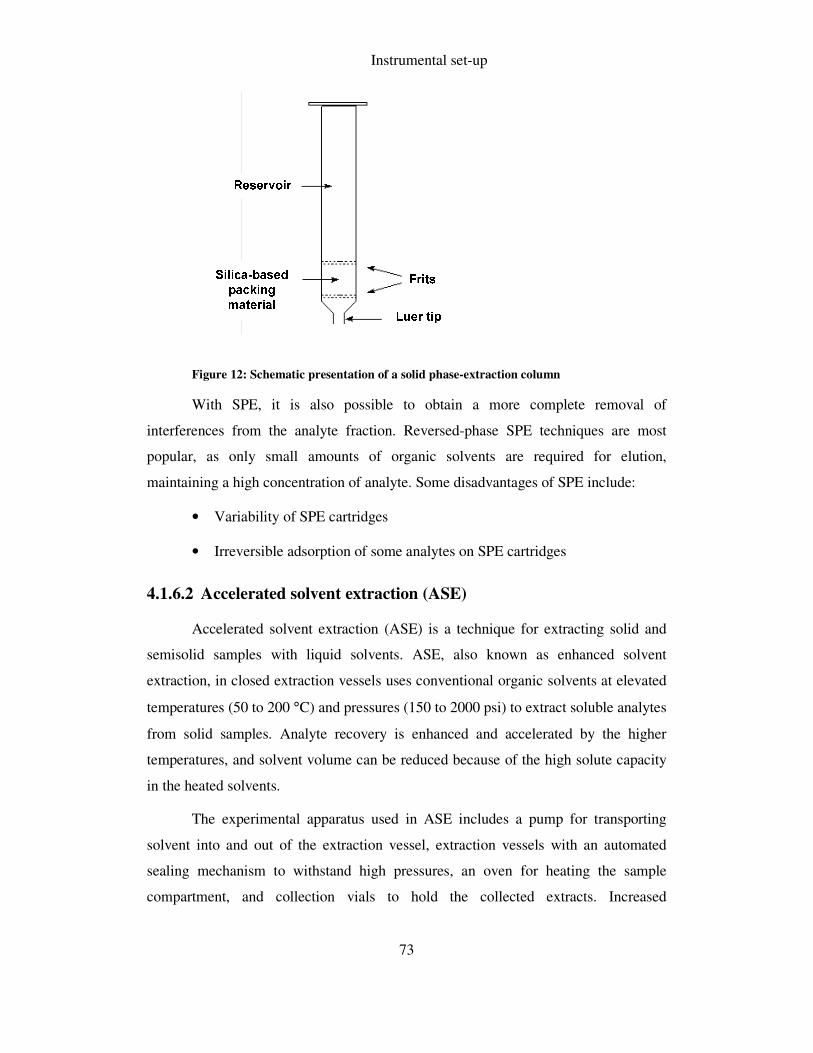
Instrumental set-up
73
Figure 12: Schematic presentation of a solid phase-extraction column
With SPE, it is also possible to obtain a more complete removal of
interferences from the analyte fraction. Reversed-phase SPE techniques are most
popular, as only small amounts of organic solvents are required for elution,
maintaining a high concentration of analyte. Some disadvantages of SPE include:
• Variability of SPE cartridges
• Irreversible adsorption of some analytes on SPE cartridges
4.1.6.2 Accelerated solvent extraction (ASE)
Accelerated solvent extraction (ASE) is a technique for extracting solid and
semisolid samples with liquid solvents. ASE, also known as enhanced solvent
extraction, in closed extraction vessels uses conventional organic solvents at elevated
temperatures (50 to 200 °C) and pressures (150 to 2000 psi) to extract soluble analytes
from solid samples. Analyte recovery is enhanced and accelerated by the higher
temperatures, and solvent volume can be reduced because of the high solute capacity
in the heated solvents.
The experimental apparatus used in ASE includes a pump for transporting
solvent into and out of the extraction vessel, extraction vessels with an automated
sealing mechanism to withstand high pressures, an oven for heating the sample
compartment, and collection vials to hold the collected extracts. Increased
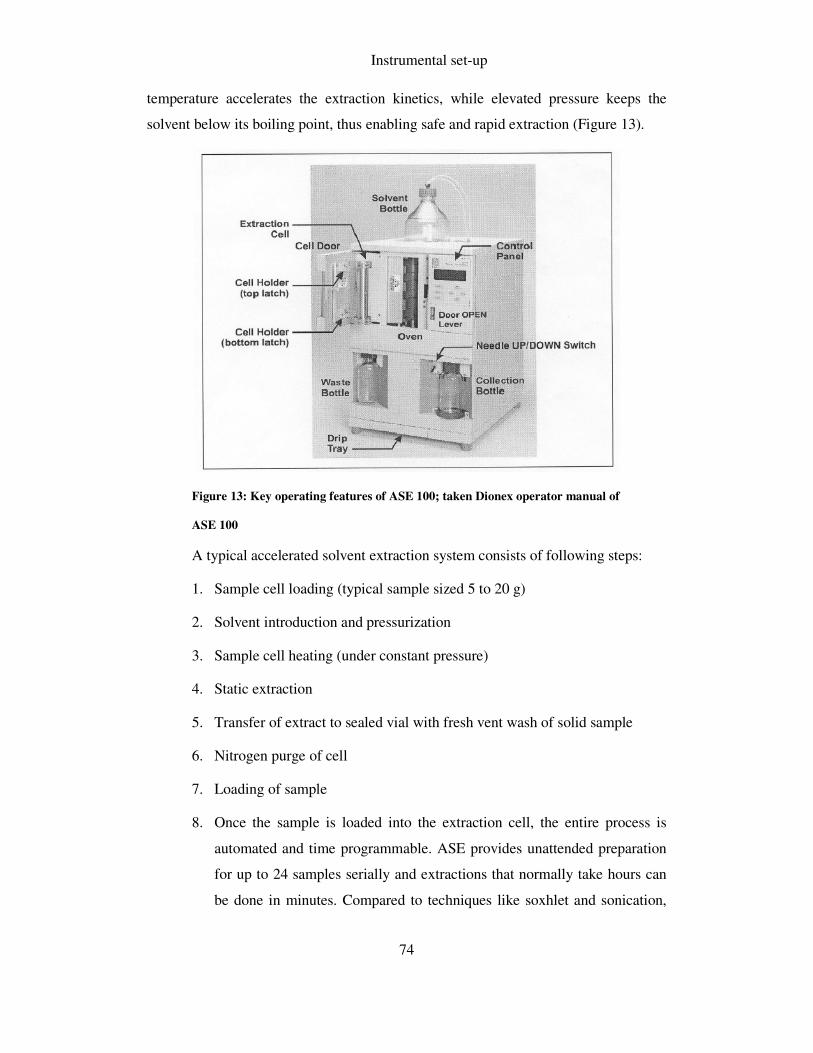
Instrumental set-up
74
temperature accelerates the extraction kinetics, while elevated pressure keeps the
solvent below its boiling point, thus enabling safe and rapid extraction (Figure 13).
Figure 13: Key operating features of ASE 100; taken Dionex operator manual of
ASE 100
A typical accelerated solvent extraction system consists of following steps:
1. Sample cell loading (typical sample sized 5 to 20 g)
2. Solvent introduction and pressurization
3. Sample cell heating (under constant pressure)
4. Static extraction
5. Transfer of extract to sealed vial with fresh vent wash of solid sample
6. Nitrogen purge of cell
7. Loading of sample
8. Once the sample is loaded into the extraction cell, the entire process is
automated and time programmable. ASE provides unattended preparation
for up to 24 samples serially and extractions that normally take hours can
be done in minutes. Compared to techniques like soxhlet and sonication,
Instrumental set-up
75
ASE generates results in a fraction of the time. In addition to speed, ASE
offers a lower cost per sample than other techniques by reducing solvent
consumption by up to 95%.
A method is hence loaded which defines all of the timed events that occur
during a sample extraction. Important parameters of the method control are
summarized in Table 6.
Table 6: Method parameters used in ASE 100
Parameter Function Value range
Temperature Temperature at which to heat the extraction cell.
Off, 40 to 200 °C
(default = 100)
Static time Static solvent extraction time 0 to 99 min (default = 5)
Flush volume Amount of solvent to flush the extraction cell after the static heating step. The flush volume is expected as percentage of the cell volume; for example, if the flush volume is set to 50%, 5 ml is flushed through a 10 ml cell, 17 ml is flushed through a 34 ml cell, and so on.
0 to 150% volume in 5% increments (default = 60)
Purge time Amount of time the cell is purged with nitrogen
20 to 900 sec (default = 1)
Static cycle Number of times the static heating and flushing steps are performed. When more than one cycle is specified, the flush volume is divided among the cycles.
1 to 5
(default = 5)
4.1.6.3 Ultrasound-assisted extraction (UAE)
Ultrasonic agitation (sonication) often allows more effective solid-liquid
contact. Sonication is a procedure recommended for the pre-treatment of many solid
environmental samples, such as U.S. EPA Method 3550 for extracting non-volatile
and semi-volatile organic compounds from solids such as soils, sludge, and wastes. In
this method, different extraction solvents and sonication conditions are recommended,
depending on the type of pollutants and their concentration in the solid matrix.
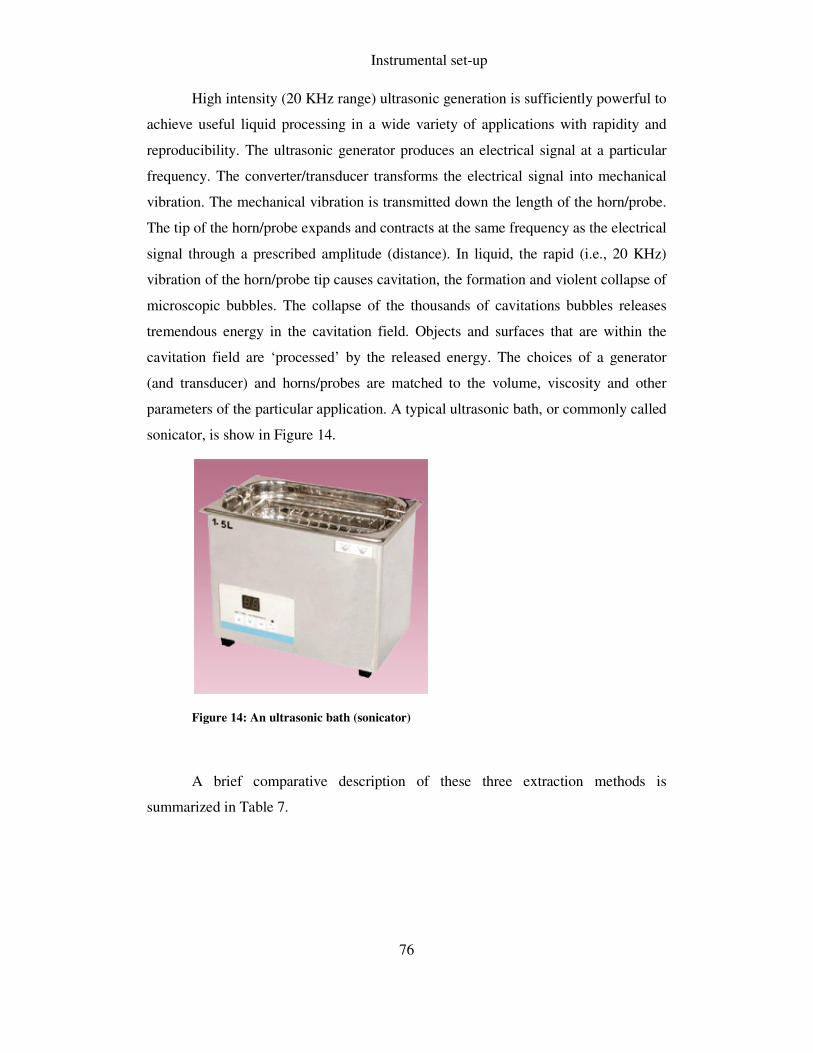
Instrumental set-up
76
High intensity (20 KHz range) ultrasonic generation is sufficiently powerful to
achieve useful liquid processing in a wide variety of applications with rapidity and
reproducibility. The ultrasonic generator produces an electrical signal at a particular
frequency. The converter/transducer transforms the electrical signal into mechanical
vibration. The mechanical vibration is transmitted down the length of the horn/probe.
The tip of the horn/probe expands and contracts at the same frequency as the electrical
signal through a prescribed amplitude (distance). In liquid, the rapid (i.e., 20 KHz)
vibration of the horn/probe tip causes cavitation, the formation and violent collapse of
microscopic bubbles. The collapse of the thousands of cavitations bubbles releases
tremendous energy in the cavitation field. Objects and surfaces that are within the
cavitation field are ‘processed’ by the released energy. The choices of a generator
(and transducer) and horns/probes are matched to the volume, viscosity and other
parameters of the particular application. A typical ultrasonic bath, or commonly called
sonicator, is show in Figure 14.
Figure 14: An ultrasonic bath (sonicator)
A brief comparative description of these three extraction methods is
summarized in Table 7.
Instrumental set-up
77
Table 7: Sample pre-treatment methods
Method of sample pre-treatment Principles of technique Comments
Solid-phase extraction Liquid is passed through solid phase, which selectively removes analyte (or interferences); analyte can be eluted with strong solvent; in some cases interferences are retained and analytes allowed to pass through solid phase un-retained; same mechanisms as HPLC.
Wide variety of stationary phases available for selective removal of desired inorganic, organic, and biological analytes; specially phases for drugs of abuse, carbohydrates, catechol amines, and many other classes of compounds, trace enrichment from water.
Accelerated solvent extraction Sample is placed in a sealed container and heated to above its boiling point, causing pressure in vessel to rise; extracted sample is removed automatically and transferred to vial for further treatment.
Greatly increases speed of liquid-solid extraction process; automated; vessel must withstand high pressure; extracted sample is diluted and requires further concentration; safety provisions are required because of over-pressured, high-temperature solvents.
Ultra-sound assisted extraction Sample is immersed in ultrasonic bath with solvent and subject to ultrasonic radiation. An ultrasonic probe or ultrasonic cell disrupter can also be used.
Dissolution is aided by ultrasonic process; heat can be added to increase rate of extraction; safe; rapid; best for coarse, granular materials; multiple samples handled simultaneously; efficient contact with solvent.
Method validation
78
5 METHOD DEVELOPMENT
High performance liquid chromatography is an excellent quantitative
analytical technique. A properly designed, validated and executed analytical method
should show high levels of both accuracy and precision for a main component
analysis (±1 to 2% precision and accuracies within 2% of actual values).
Main goals of HPLC method development are summarized in Table 8 where
the goal is roughly in order of decreasing importance but may vary with analysis
requirements. The final procedure should meet all the goals that were defined at the
beginning of method development. The method should also be robust in routine
operation and usable by all laboratories and personnel for which it is intended.
Table 8: Separation goals in HPLC method development
Goal Comments
Resolution Precise and rugged quantitative analysis requires that resolution be greater than 1.5
Separation time < 5-10 min is desirable for routine procedures
Quantitation ≤2% for assays; ≤5% for less-demanding analyses; ≤15% for trace analyses
Pressure <150 bar is desirable, <200 bar is usually essential (new column assumed)
Peak height Narrow peaks are desired for large signal/noise ratios
Solvent consumption Minimum mobile-phase use per run is desirable
This chapter is based upon the development and validation of HPLC method
for the rapid and sensitive determination of free α-LA. The method was developed
and validated using three different detection modes.
5.1.1 Reagents and chemicals
Alpha lipoic acid [DL-α-lipoic acid; purity ≥ 99.0%], bisphenol A (99%) and
naproxen (≥ 98%) were purchased from Sigma-Aldrich (Steinheim, Germany).

Method validation
79
Sodium acetate p.A, potassium dihydrogen phosphate p.A, ortho-phosphoric
acid (85%), glacial acetic acid, HPLC-gradient grade acetonitrile and methanol were
delivered from Merck (Darmstadt, Germany).
Deionized water, prepared using a Barnstead Easypur LF (Dubuque, Iowa,
USA) water purification system, was used in all experiments.
5.1.2 Analysis of standard solution
5.1.2.1 Internal standard
Two different internal standards bisphenol A and naproxen were selected and
standard solution of each (0.5 µg/ml) was run separately and also with standard α-LA
solution (0.5 µg/ml). Bisphenol A was selected as an internal standard because it
eluted soon after α-LA when injected into the HPLC system and also showed similar
behaviour in the UV and CEAD detection system. The behaviour and optimized
condition of internal standard bisphenol A (BPA) is discussed in detail in the
following sections.
5.1.2.2 Stationary phase
Stationary phase consisted of ASE 3 C 18 column with two different
dimensions. A longer column (150 mm × 3.0 mm, particle size 3 µm) for UV and
CEAD detection systems while a smaller one (150 × 2.1 mm, particle size 3 µm) for
the MS was used. These columns were equipped with pre-columns of the same
stationary phase material.
5.1.2.3 Mobile phase
In the course of HPLC method development, several mobile phases containing
different proportions of acetonitrile and acetic acid/sodium acetate buffer were tested
for better resolution and shorter run time.
1. Acetonitrile/methanol/50 mM sodium acetate (pH 3, adjusted with glacial
acetic acid), 290/150/560, (v/v/v)
2. Acetonitrile/methanol/50 mM sodium acetate (pH 3, adjusted with glacial
acetic acid), 350/65/585, (v/v/v)
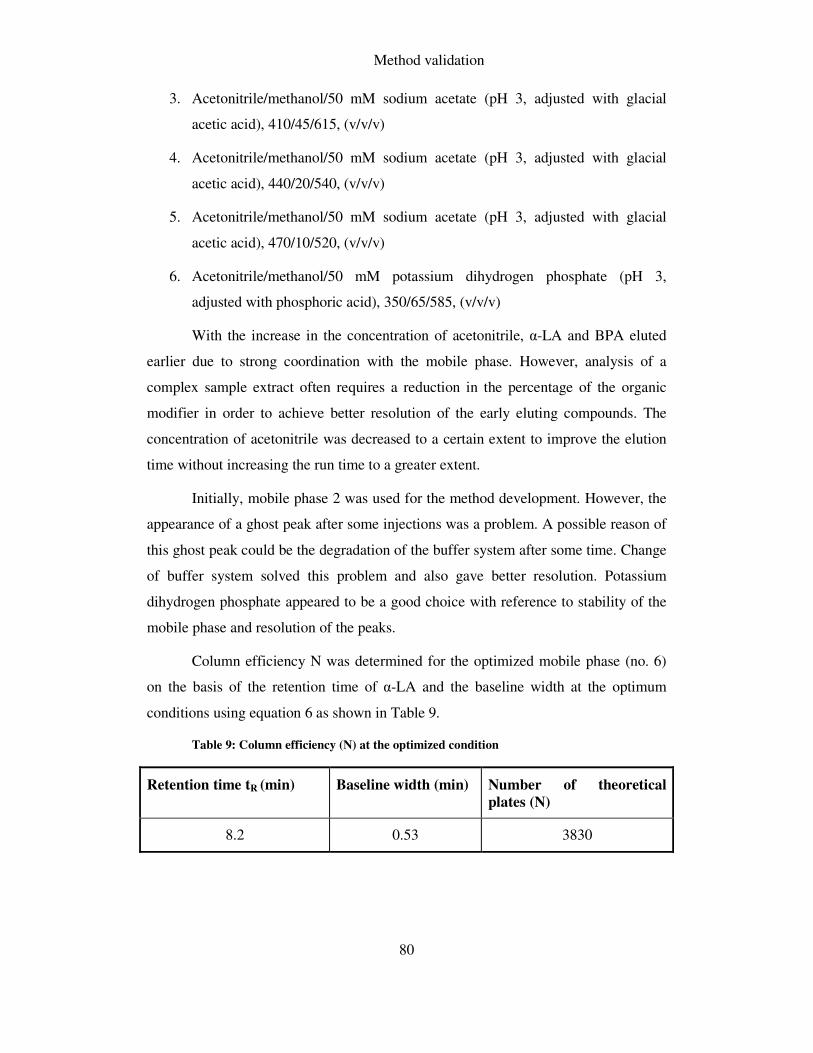
Method validation
80
3. Acetonitrile/methanol/50 mM sodium acetate (pH 3, adjusted with glacial
acetic acid), 410/45/615, (v/v/v)
4. Acetonitrile/methanol/50 mM sodium acetate (pH 3, adjusted with glacial
acetic acid), 440/20/540, (v/v/v)
5. Acetonitrile/methanol/50 mM sodium acetate (pH 3, adjusted with glacial
acetic acid), 470/10/520, (v/v/v)
6. Acetonitrile/methanol/50 mM potassium dihydrogen phosphate (pH 3,
adjusted with phosphoric acid), 350/65/585, (v/v/v)
With the increase in the concentration of acetonitrile, α-LA and BPA eluted
earlier due to strong coordination with the mobile phase. However, analysis of a
complex sample extract often requires a reduction in the percentage of the organic
modifier in order to achieve better resolution of the early eluting compounds. The
concentration of acetonitrile was decreased to a certain extent to improve the elution
time without increasing the run time to a greater extent.
Initially, mobile phase 2 was used for the method development. However, the
appearance of a ghost peak after some injections was a problem. A possible reason of
this ghost peak could be the degradation of the buffer system after some time. Change
of buffer system solved this problem and also gave better resolution. Potassium
dihydrogen phosphate appeared to be a good choice with reference to stability of the
mobile phase and resolution of the peaks.
Column efficiency N was determined for the optimized mobile phase (no. 6)
on the basis of the retention time of α-LA and the baseline width at the optimum
conditions using equation 6 as shown in Table 9.
Table 9: Column efficiency (N) at the optimized condition
Retention time tR (min) Baseline width (min) Number of theoretical
plates (N)
8.2 0.53 3830
Method validation
81
5.1.3 UV detection
5.1.3.1 Instrumentation
The HPLC system consisted of a Merck Hitachi pump L-6200, a Basic
Marathon autosampler (Spark, Holland B.V., Emmen, The Netherlands), and an ACE
3 C 18 (150 mm × 3.0 mm, particle size 3 µm) column (Advanced Chromatography
Technologies, Aberdeen, Scotland) equipped with a pre-column of same stationary
phase.
A Merck Hitachi L-4250 UV/Vis detector was used together with D-6000
Interface (Merck Hitachi). Data were obtained using chromatography data station
software, HPLC manager version 2.
5.1.3.2 Selection of optimum wavelength
Standard solutions or the samples were injected (20 µl) into the HPLC system
and chromatographic separations were achieved isocratically using mobile phase
containing acetonitrile/methanol/50 mM potassium dihydrogen phosphate (pH 3,
adjusted with phosphoric acid), 350/65/585, (v/v/v) at a flow rate of 0.45 ml/min.
Two different wavelengths are cited in literature i.e. 208 nm and 330 nm.
Initially, 208 nm was selected for the optimization of mobile phase. Later, other
wavelengths such as 208, 215, 218, 220, and 332 nm were checked. Calibration
curves of standard α-LA solutions (0.01 to 1 µg/ml) were obtained at each wavelength
and the results were compared (Figure 15). Among these various wavelengths, 215
nm was found to be optimum and was selected for the purpose of quantitation.
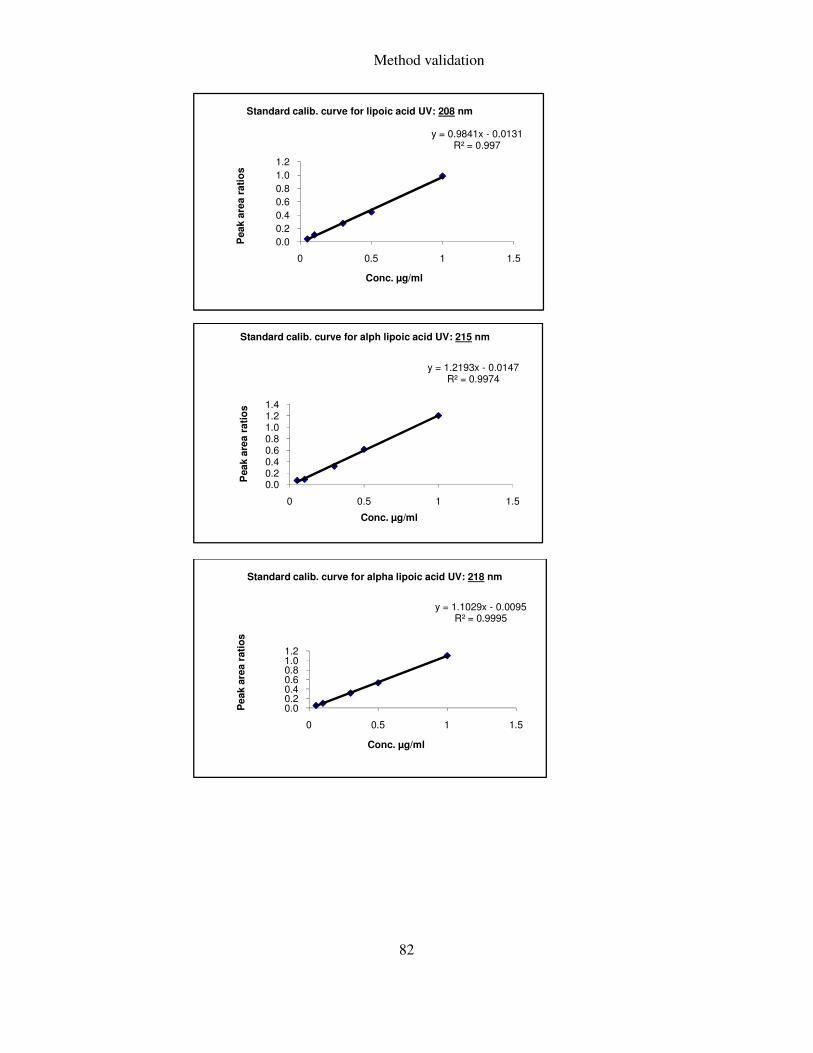
Method validation
82
y = 0.9841x - 0.0131R² = 0.997
0.0
0.2
0.4
0.6
0.8
1.0
1.2
0 0.5 1 1.5
Peak a
rea r
ati
os
Conc. µg/ml
Standard calib. curve for lipoic acid UV: 208 nm
y = 1.2193x - 0.0147R² = 0.9974
0.00.20.40.60.81.01.21.4
0 0.5 1 1.5
Peak a
rea r
ati
os
Conc. µg/ml
Standard calib. curve for alph lipoic acid UV: 215 nm
y = 1.1029x - 0.0095R² = 0.9995
0.00.20.40.60.81.01.2
0 0.5 1 1.5
Peak a
rea r
ati
os
Conc. µg/ml
Standard calib. curve for alpha lipoic acid UV: 218 nm
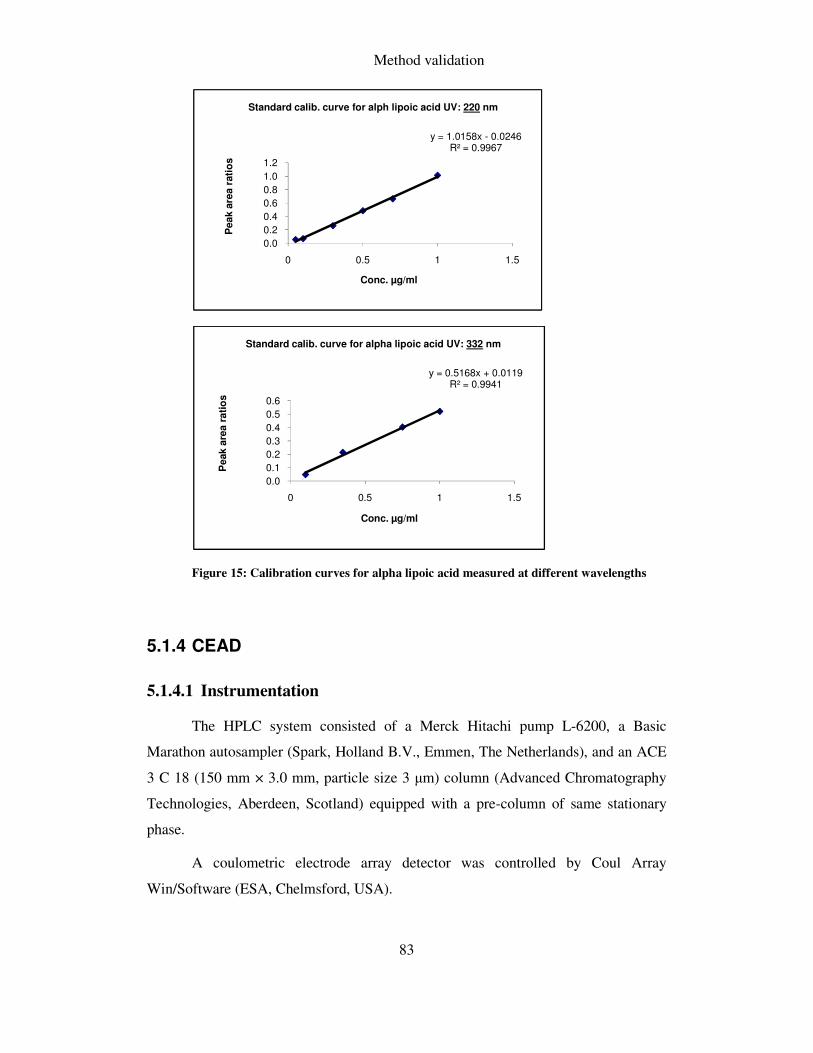
Method validation
83
Figure 15: Calibration curves for alpha lipoic acid measured at different wavelengths
5.1.4 CEAD
5.1.4.1 Instrumentation
The HPLC system consisted of a Merck Hitachi pump L-6200, a Basic
Marathon autosampler (Spark, Holland B.V., Emmen, The Netherlands), and an ACE
3 C 18 (150 mm × 3.0 mm, particle size 3 µm) column (Advanced Chromatography
Technologies, Aberdeen, Scotland) equipped with a pre-column of same stationary
phase.
A coulometric electrode array detector was controlled by Coul Array
Win/Software (ESA, Chelmsford, USA).
y = 1.0158x - 0.0246R² = 0.9967
0.0
0.2
0.4
0.6
0.8
1.0
1.2
0 0.5 1 1.5
Peak a
rea r
ati
os
Conc. µg/ml
Standard calib. curve for alph lipoic acid UV: 220 nm
y = 0.5168x + 0.0119R² = 0.9941
0.0
0.1
0.2
0.3
0.4
0.5
0.6
0 0.5 1 1.5
Peak a
rea r
ati
os
Conc. µg/ml
Standard calib. curve for alpha lipoic acid UV: 332 nm
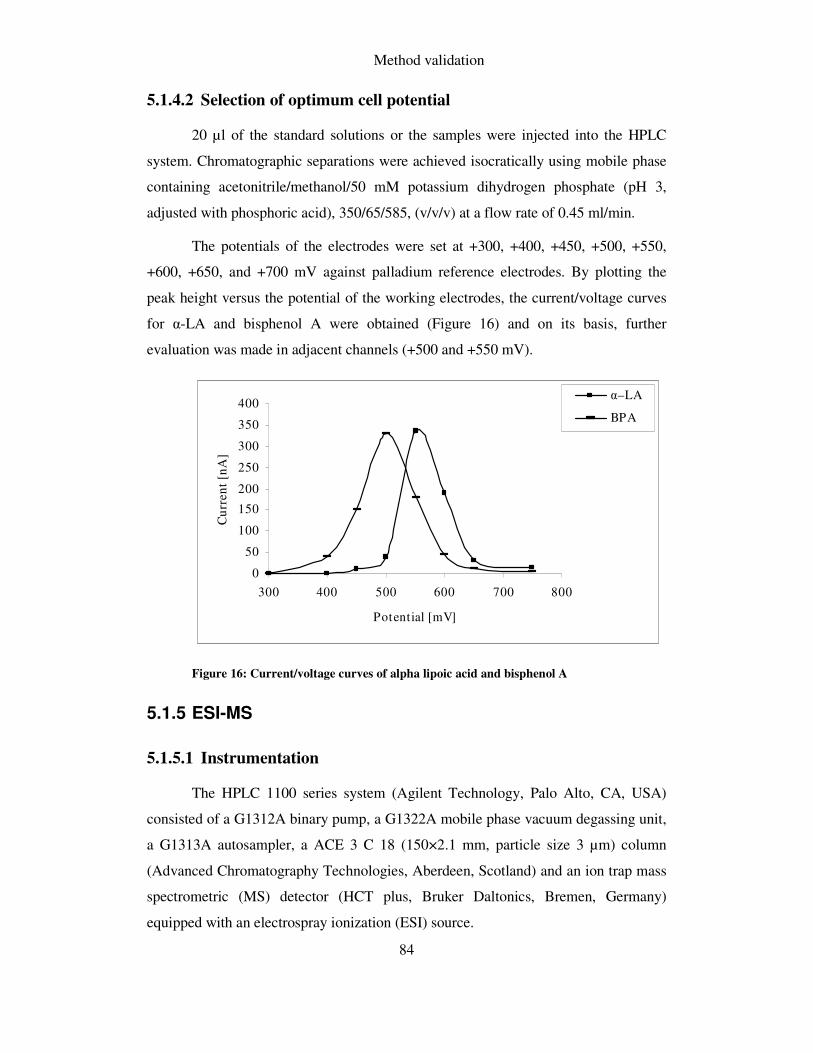
Method validation
84
5.1.4.2 Selection of optimum cell potential
20 µl of the standard solutions or the samples were injected into the HPLC
system. Chromatographic separations were achieved isocratically using mobile phase
containing acetonitrile/methanol/50 mM potassium dihydrogen phosphate (pH 3,
adjusted with phosphoric acid), 350/65/585, (v/v/v) at a flow rate of 0.45 ml/min.
The potentials of the electrodes were set at +300, +400, +450, +500, +550,
+600, +650, and +700 mV against palladium reference electrodes. By plotting the
peak height versus the potential of the working electrodes, the current/voltage curves
for α-LA and bisphenol A were obtained (Figure 16) and on its basis, further
evaluation was made in adjacent channels (+500 and +550 mV).
Figure 16: Current/voltage curves of alpha lipoic acid and bisphenol A
5.1.5 ESI-MS
5.1.5.1 Instrumentation
The HPLC 1100 series system (Agilent Technology, Palo Alto, CA, USA)
consisted of a G1312A binary pump, a G1322A mobile phase vacuum degassing unit,
a G1313A autosampler, a ACE 3 C 18 (150×2.1 mm, particle size 3 µm) column
(Advanced Chromatography Technologies, Aberdeen, Scotland) and an ion trap mass
spectrometric (MS) detector (HCT plus, Bruker Daltonics, Bremen, Germany)
equipped with an electrospray ionization (ESI) source.
0
50
100
150
200
250
300
350
400
300 400 500 600 700 800
Potential [mV]
Cu
rren
t [n
A]
α–LA
BPA
Method validation
85
Hystar 3.1, software for chromatography and hyphenated techniques, was used
to acquire the data. Data were then integrated using the software, Data analysisTM
version 3.3 (Bruker Daltonics).
5.1.5.2 Optimization of instrumental parameters
20 µl of the standard solution (0.4 µg/ml) was injected and the separation was
made using isocratic elution with 0.1% acetic acid in water and acetonitrile (55/45,
v/v).
MS detection was performed using electrospray ionization. First standard
α-LA solution was directly injected into the MS system and negative mode was
selected due to better sensitivity. Then, ion source, ion transfer region and ion trap
were further optimized during continuous infusion of pure standard solution (c ~ 40
µg/ml in 30% ACN) by means of a syringe pump. The optimized parameters in the
negative mode setting are summarized in Table 10.
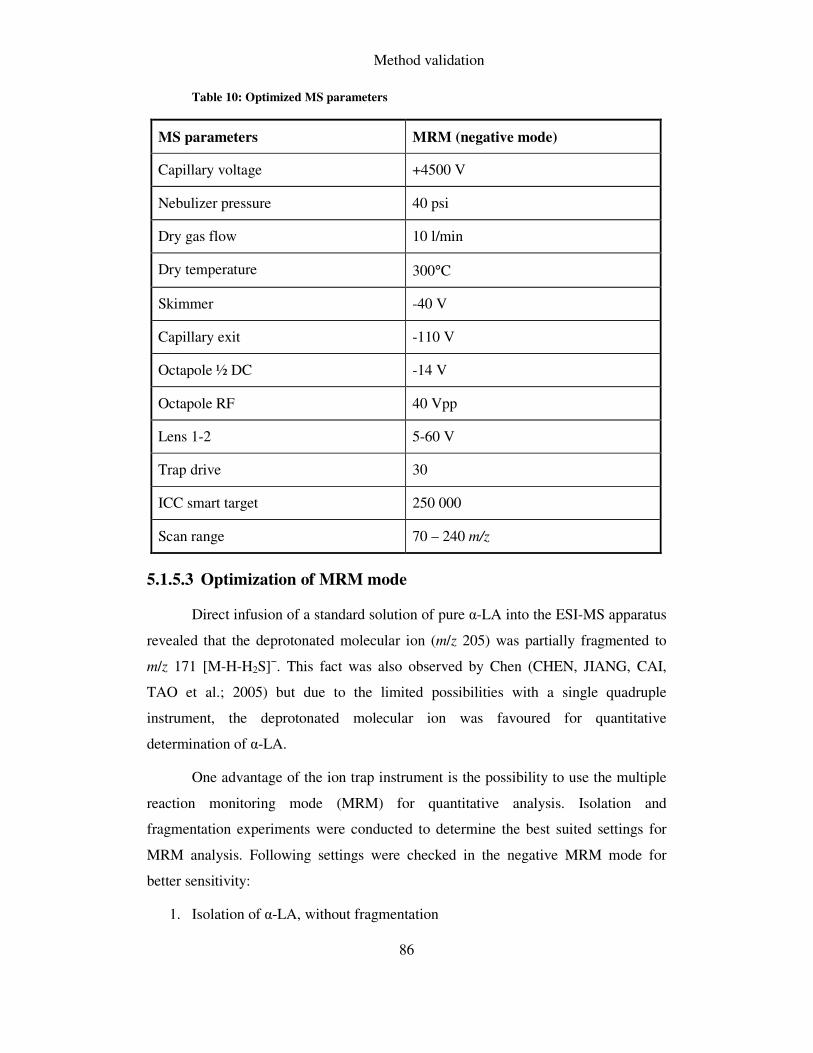
Method validation
86
Table 10: Optimized MS parameters
MS parameters MRM (negative mode)
Capillary voltage +4500 V
Nebulizer pressure 40 psi
Dry gas flow 10 l/min
Dry temperature 300°C
Skimmer -40 V
Capillary exit -110 V
Octapole ½ DC -14 V
Octapole RF 40 Vpp
Lens 1-2 5-60 V
Trap drive 30
ICC smart target 250 000
Scan range 70 – 240 m/z
5.1.5.3 Optimization of MRM mode
Direct infusion of a standard solution of pure α-LA into the ESI-MS apparatus
revealed that the deprotonated molecular ion (m/z 205) was partially fragmented to
m/z 171 [M-H-H2S]−. This fact was also observed by Chen (CHEN, JIANG, CAI,
TAO et al.; 2005) but due to the limited possibilities with a single quadruple
instrument, the deprotonated molecular ion was favoured for quantitative
determination of α-LA.
One advantage of the ion trap instrument is the possibility to use the multiple
reaction monitoring mode (MRM) for quantitative analysis. Isolation and
fragmentation experiments were conducted to determine the best suited settings for
MRM analysis. Following settings were checked in the negative MRM mode for
better sensitivity:
1. Isolation of α-LA, without fragmentation
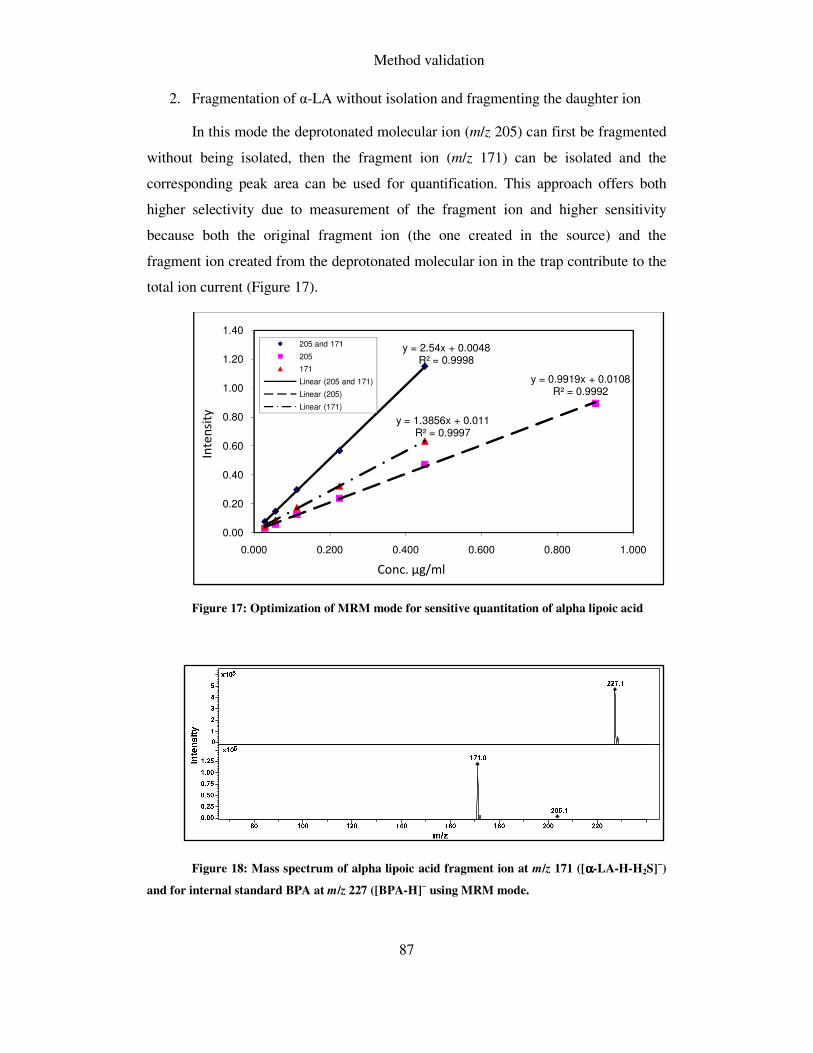
Method validation
87
2. Fragmentation of α-LA without isolation and fragmenting the daughter ion
In this mode the deprotonated molecular ion (m/z 205) can first be fragmented
without being isolated, then the fragment ion (m/z 171) can be isolated and the
corresponding peak area can be used for quantification. This approach offers both
higher selectivity due to measurement of the fragment ion and higher sensitivity
because both the original fragment ion (the one created in the source) and the
fragment ion created from the deprotonated molecular ion in the trap contribute to the
total ion current (Figure 17).
Figure 17: Optimization of MRM mode for sensitive quantitation of alpha lipoic acid
Figure 18: Mass spectrum of alpha lipoic acid fragment ion at m/z 171 ([αααα-LA-H-H2S]−)
and for internal standard BPA at m/z 227 ([BPA-H]− using MRM mode.
y = 2.54x + 0.0048R² = 0.9998
y = 0.9919x + 0.0108R² = 0.9992
y = 1.3856x + 0.011R² = 0.9997
0.00
0.20
0.40
0.60
0.80
1.00
1.20
1.40
0.000 0.200 0.400 0.600 0.800 1.000
205 and 171
205
171
Linear (205 and 171)
Linear (205)
Linear (171)
Conc. µg/ml
Inte
nsi
ty
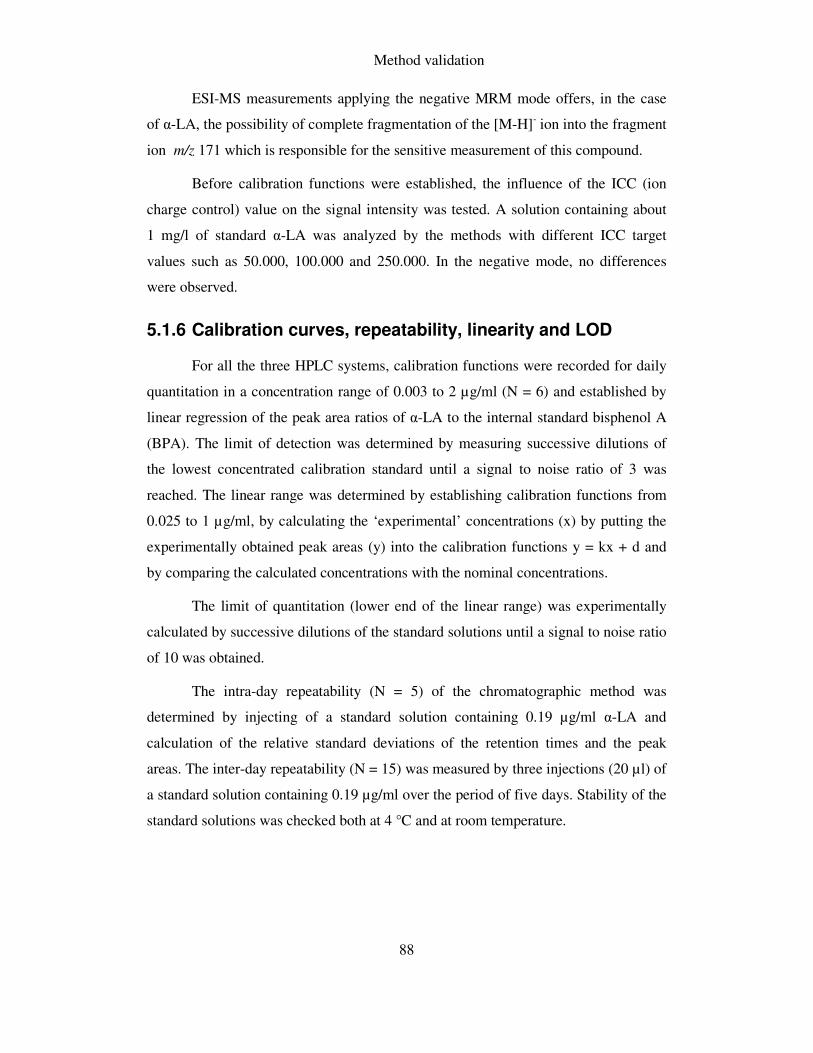
Method validation
88
ESI-MS measurements applying the negative MRM mode offers, in the case
of α-LA, the possibility of complete fragmentation of the [M-H]- ion into the fragment
ion m/z 171 which is responsible for the sensitive measurement of this compound.
Before calibration functions were established, the influence of the ICC (ion
charge control) value on the signal intensity was tested. A solution containing about
1 mg/l of standard α-LA was analyzed by the methods with different ICC target
values such as 50.000, 100.000 and 250.000. In the negative mode, no differences
were observed.
5.1.6 Calibration curves, repeatability, linearity and LOD
For all the three HPLC systems, calibration functions were recorded for daily
quantitation in a concentration range of 0.003 to 2 µg/ml (N = 6) and established by
linear regression of the peak area ratios of α-LA to the internal standard bisphenol A
(BPA). The limit of detection was determined by measuring successive dilutions of
the lowest concentrated calibration standard until a signal to noise ratio of 3 was
reached. The linear range was determined by establishing calibration functions from
0.025 to 1 µg/ml, by calculating the ‘experimental’ concentrations (x) by putting the
experimentally obtained peak areas (y) into the calibration functions y = kx + d and
by comparing the calculated concentrations with the nominal concentrations.
The limit of quantitation (lower end of the linear range) was experimentally
calculated by successive dilutions of the standard solutions until a signal to noise ratio
of 10 was obtained.
The intra-day repeatability (N = 5) of the chromatographic method was
determined by injecting of a standard solution containing 0.19 µg/ml α-LA and
calculation of the relative standard deviations of the retention times and the peak
areas. The inter-day repeatability (N = 15) was measured by three injections (20 µl) of
a standard solution containing 0.19 µg/ml over the period of five days. Stability of the
standard solutions was checked both at 4 °C and at room temperature.
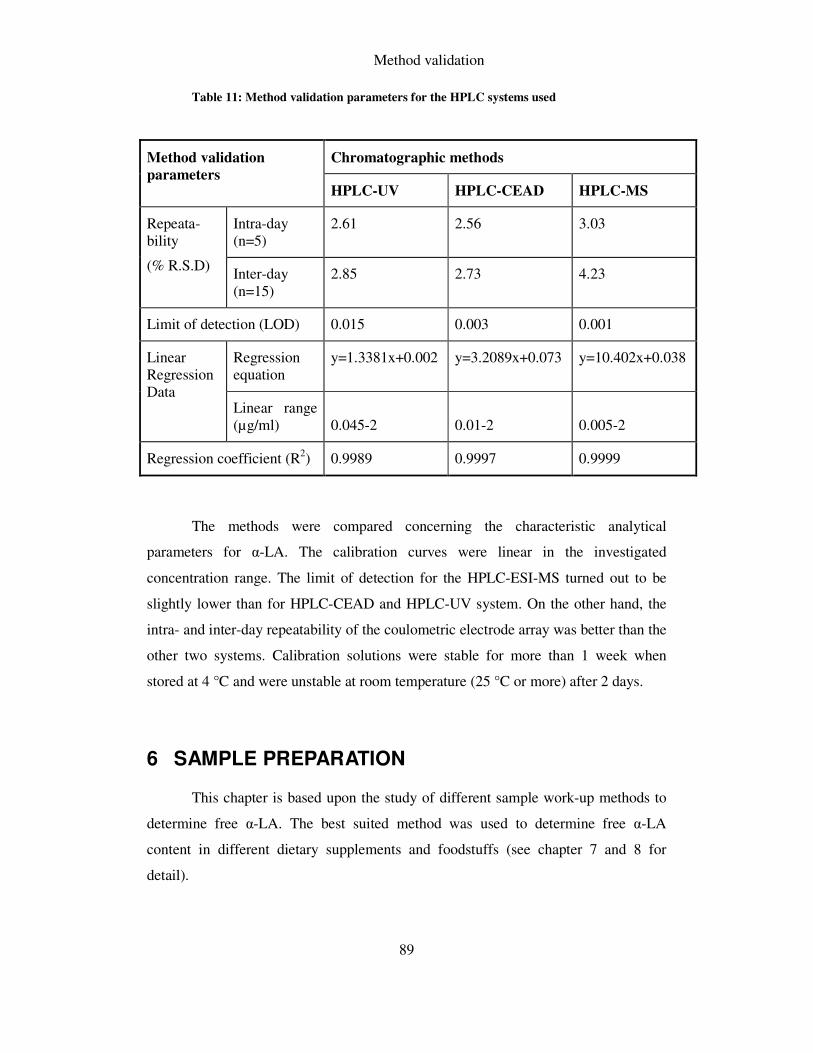
Method validation
89
Table 11: Method validation parameters for the HPLC systems used
The methods were compared concerning the characteristic analytical
parameters for α-LA. The calibration curves were linear in the investigated
concentration range. The limit of detection for the HPLC-ESI-MS turned out to be
slightly lower than for HPLC-CEAD and HPLC-UV system. On the other hand, the
intra- and inter-day repeatability of the coulometric electrode array was better than the
other two systems. Calibration solutions were stable for more than 1 week when
stored at 4 °C and were unstable at room temperature (25 °C or more) after 2 days.
6 SAMPLE PREPARATION
This chapter is based upon the study of different sample work-up methods to
determine free α-LA. The best suited method was used to determine free α-LA
content in different dietary supplements and foodstuffs (see chapter 7 and 8 for
detail).
Method validation
parameters
Chromatographic methods
HPLC-UV HPLC-CEAD HPLC-MS
Repeata-bility
(% R.S.D)
Intra-day (n=5)
2.61 2.56 3.03
Inter-day (n=15)
2.85 2.73 4.23
Limit of detection (LOD) 0.015 0.003 0.001
Linear Regression Data
Regression equation
y=1.3381x+0.002 y=3.2089x+0.073 y=10.402x+0.038
Linear range (µg/ml) 0.045-2 0.01-2 0.005-2
Regression coefficient (R2) 0.9989 0.9997 0.9999
Alpha lipoic acid in dietary supplements
90
6.1 Experimental
6.1.1 Reagents, standards and solutions
Diatomaceous earth (suitable for most routine filtrations, ≥95% SiO2 basis,
powder); diethyl ether (anhydrous, ≥99.7%), sodium bicarbonate (powder, ≥99.5%),
sodium chloride (≥98%); potassium chloride (≥99%); potassium hydroxide (≥85%
KOH basis, pellets); sulphuric acid (99%), disodium phosphate dibasic hydrate
(≥99%); sodium phosphate monobasic monohydrate (≥99.5%); bovine serum albumin
(BSA; 30% in 0.85% sodium chloride), alcalase solution (BioChemika, ≥ 5 U/g) and
polyamide 6 (for column chromatography) were purchased from Sigma-Aldrich
(Steinheim, Germany). Deionized water, prepared using a Barnstead Easypur LF
(Dubuque, Iowa, USA) water purification system, was used in all experiments.
Buffer solution for the enzymatic hydrolysis was prepared by taking sodium
chloride (8.6 g), potassium chloride (0.42 g), disodium phosphate dibasic hydrate
(0.97 g), sodium phosphate monobasic monohydrate (0.04 g) in 1 l volumetric flask
and making the volume up to the mark with distilled water. Enzyme solution was then
prepared by taking 1 ml of alcalase solution (≥ 5 U/g) in a 12.5 ml of the buffer in a
volumetric flask and making the volume up to the mark with distilled water.
6.1.2 Validation of instrumental method
HPLC-UV, HPLC-CEAD and HPLC-MS: Standard calibration solutions were
run thrice a week to obtain/compare the calibration functions in the observed
concentration range. Inter-day and intra-day repeatabilities were checked by injecting
20 µl of a standard solution containing 0.19 µg/ml of α-LA in acetonitrile/water
(30/70; v/v).
6.1.3 Sample preparation methods
Different extraction and hydrolysis procedures were selected and/or developed
to determine the best suited method for the analysis of α-LA in different foodstuffs
and dietary supplements. The optimum conditions determined for each work-up were
then compared for recoveries. An overview of these sample preparation methods is
shown in Figure 19.
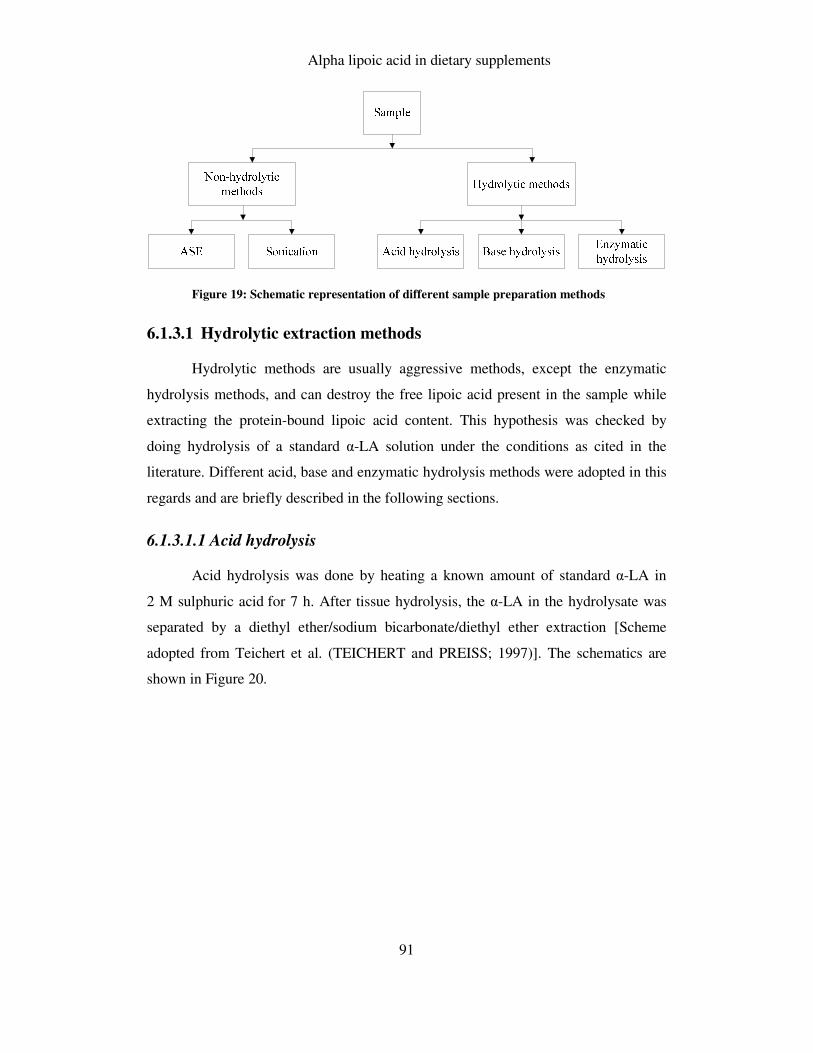
Alpha lipoic acid in dietary supplements
91
Figure 19: Schematic representation of different sample preparation methods
6.1.3.1 Hydrolytic extraction methods
Hydrolytic methods are usually aggressive methods, except the enzymatic
hydrolysis methods, and can destroy the free lipoic acid present in the sample while
extracting the protein-bound lipoic acid content. This hypothesis was checked by
doing hydrolysis of a standard α-LA solution under the conditions as cited in the
literature. Different acid, base and enzymatic hydrolysis methods were adopted in this
regards and are briefly described in the following sections.
6.1.3.1.1 Acid hydrolysis
Acid hydrolysis was done by heating a known amount of standard α-LA in
2 M sulphuric acid for 7 h. After tissue hydrolysis, the α-LA in the hydrolysate was
separated by a diethyl ether/sodium bicarbonate/diethyl ether extraction [Scheme
adopted from Teichert et al. (TEICHERT and PREISS; 1997)]. The schematics are
shown in Figure 20.
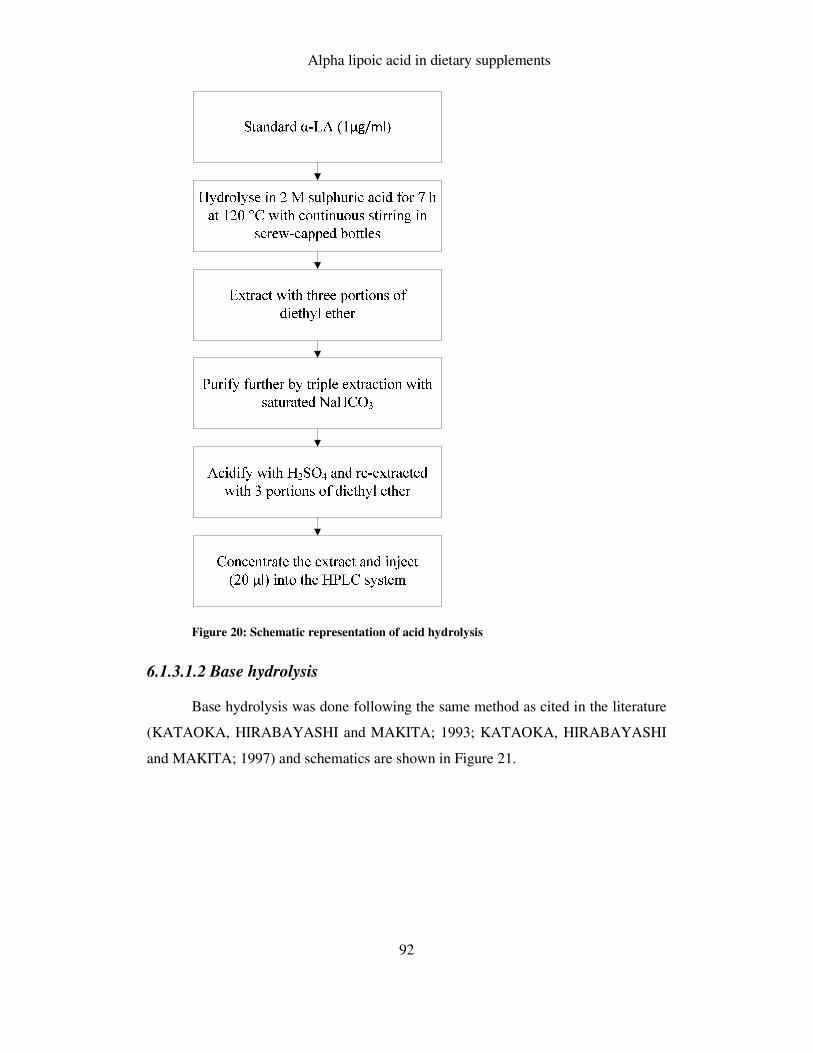
Alpha lipoic acid in dietary supplements
92
Figure 20: Schematic representation of acid hydrolysis
6.1.3.1.2 Base hydrolysis
Base hydrolysis was done following the same method as cited in the literature
(KATAOKA, HIRABAYASHI and MAKITA; 1993; KATAOKA, HIRABAYASHI
and MAKITA; 1997) and schematics are shown in Figure 21.
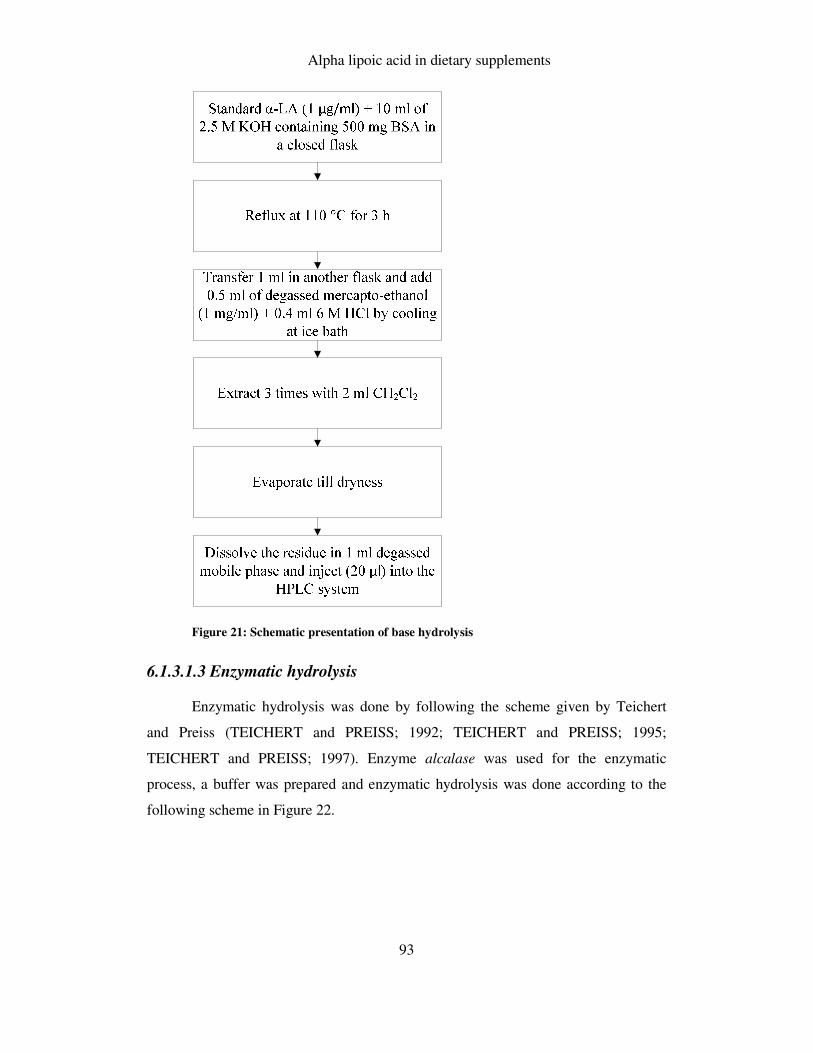
Alpha lipoic acid in dietary supplements
93
Figure 21: Schematic presentation of base hydrolysis
6.1.3.1.3 Enzymatic hydrolysis
Enzymatic hydrolysis was done by following the scheme given by Teichert
and Preiss (TEICHERT and PREISS; 1992; TEICHERT and PREISS; 1995;
TEICHERT and PREISS; 1997). Enzyme alcalase was used for the enzymatic
process, a buffer was prepared and enzymatic hydrolysis was done according to the
following scheme in Figure 22.

Alpha lipoic acid in dietary supplements
94
Figure 22: Schematic representation of enzymatic hydrolysis
6.1.3.2 Non-hydrolytic extraction methods
6.1.3.2.1 Accelerated solvent extraction
Accelerated solvent extraction (ASE) was used to extract α-LA from a
standard solution using different extraction solvents such as distilled water, 0.1%
acetic acid in water, 70% ethanol in water, pure methanol, 0.1% acetic acid in
methanol and 0.5% acetic acid in methanol. The general scheme adopted for the
accelerated solvent extraction method is illustrated in Figure 23.
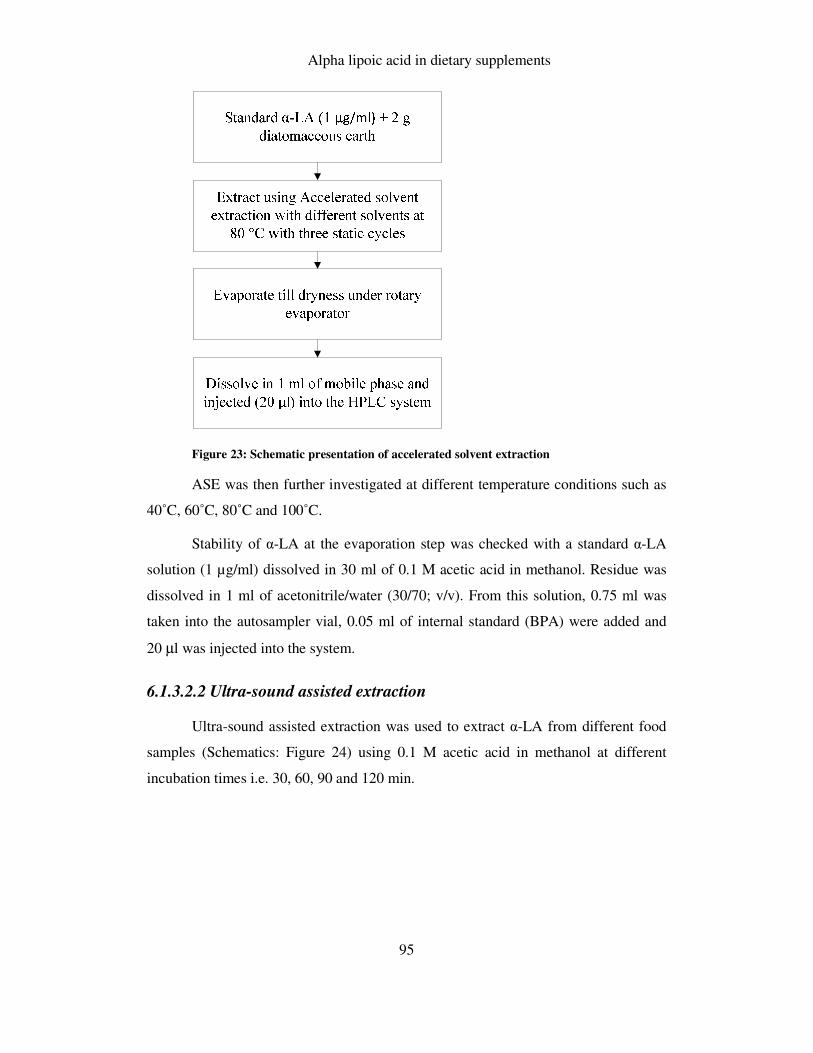
Alpha lipoic acid in dietary supplements
95
Figure 23: Schematic presentation of accelerated solvent extraction
ASE was then further investigated at different temperature conditions such as
40˚C, 60˚C, 80˚C and 100˚C.
Stability of α-LA at the evaporation step was checked with a standard α-LA
solution (1 µg/ml) dissolved in 30 ml of 0.1 M acetic acid in methanol. Residue was
dissolved in 1 ml of acetonitrile/water (30/70; v/v). From this solution, 0.75 ml was
taken into the autosampler vial, 0.05 ml of internal standard (BPA) were added and
20 µl was injected into the system.
6.1.3.2.2 Ultra-sound assisted extraction
Ultra-sound assisted extraction was used to extract α-LA from different food
samples (Schematics: Figure 24) using 0.1 M acetic acid in methanol at different
incubation times i.e. 30, 60, 90 and 120 min.
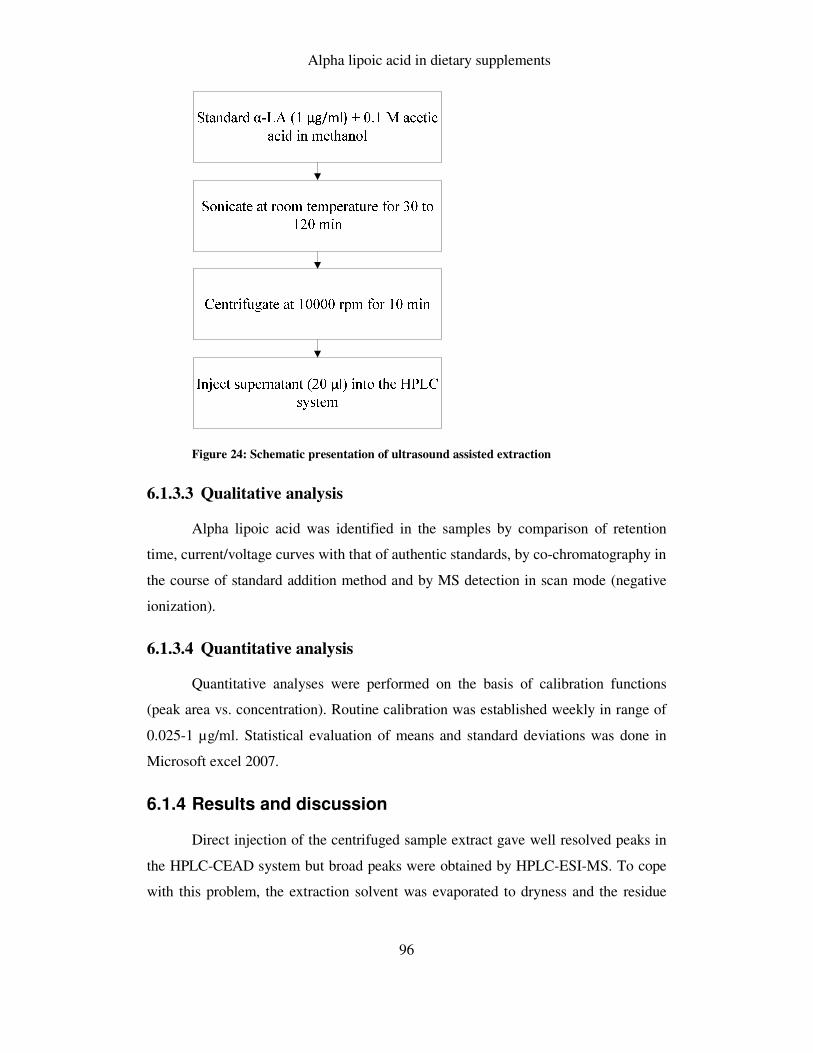
Alpha lipoic acid in dietary supplements
96
Figure 24: Schematic presentation of ultrasound assisted extraction
6.1.3.3 Qualitative analysis
Alpha lipoic acid was identified in the samples by comparison of retention
time, current/voltage curves with that of authentic standards, by co-chromatography in
the course of standard addition method and by MS detection in scan mode (negative
ionization).
6.1.3.4 Quantitative analysis
Quantitative analyses were performed on the basis of calibration functions
(peak area vs. concentration). Routine calibration was established weekly in range of
0.025-1 µg/ml. Statistical evaluation of means and standard deviations was done in
Microsoft excel 2007.
6.1.4 Results and discussion
Direct injection of the centrifuged sample extract gave well resolved peaks in
the HPLC-CEAD system but broad peaks were obtained by HPLC-ESI-MS. To cope
with this problem, the extraction solvent was evaporated to dryness and the residue
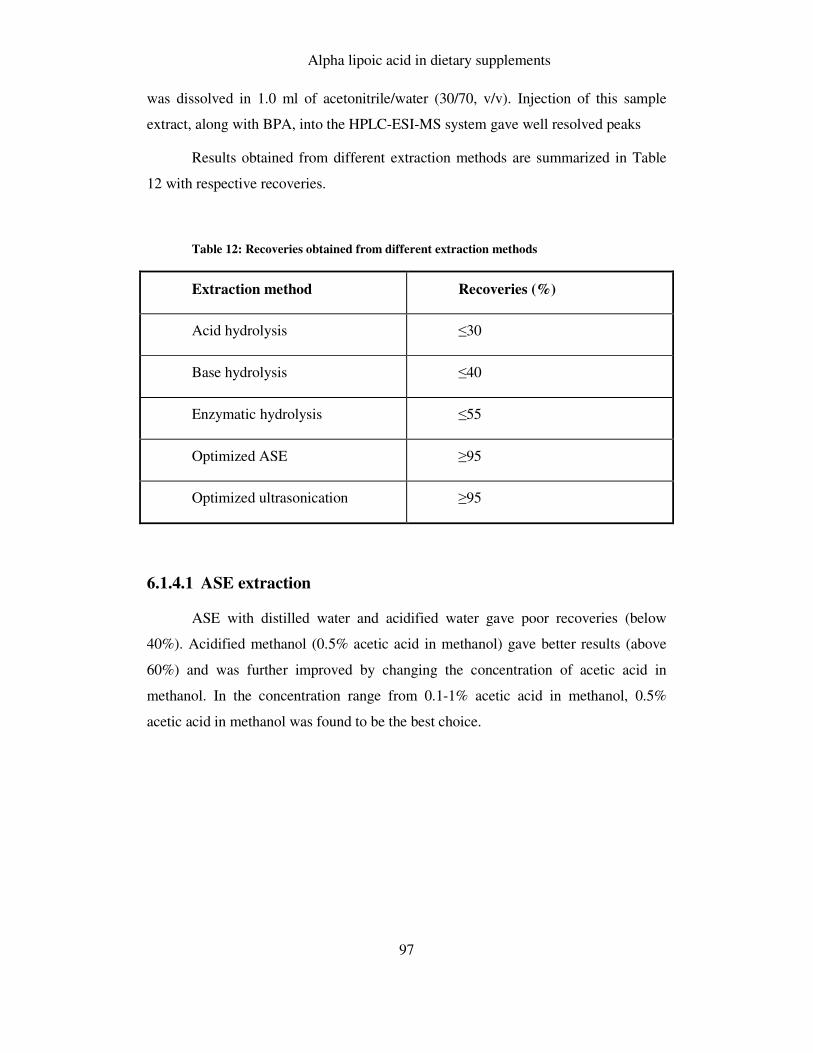
Alpha lipoic acid in dietary supplements
97
was dissolved in 1.0 ml of acetonitrile/water (30/70, v/v). Injection of this sample
extract, along with BPA, into the HPLC-ESI-MS system gave well resolved peaks
Results obtained from different extraction methods are summarized in Table
12 with respective recoveries.
Table 12: Recoveries obtained from different extraction methods
Extraction method Recoveries (%)
Acid hydrolysis ≤30
Base hydrolysis ≤40
Enzymatic hydrolysis ≤55
Optimized ASE ≥95
Optimized ultrasonication ≥95
6.1.4.1 ASE extraction
ASE with distilled water and acidified water gave poor recoveries (below
40%). Acidified methanol (0.5% acetic acid in methanol) gave better results (above
60%) and was further improved by changing the concentration of acetic acid in
methanol. In the concentration range from 0.1-1% acetic acid in methanol, 0.5%
acetic acid in methanol was found to be the best choice.
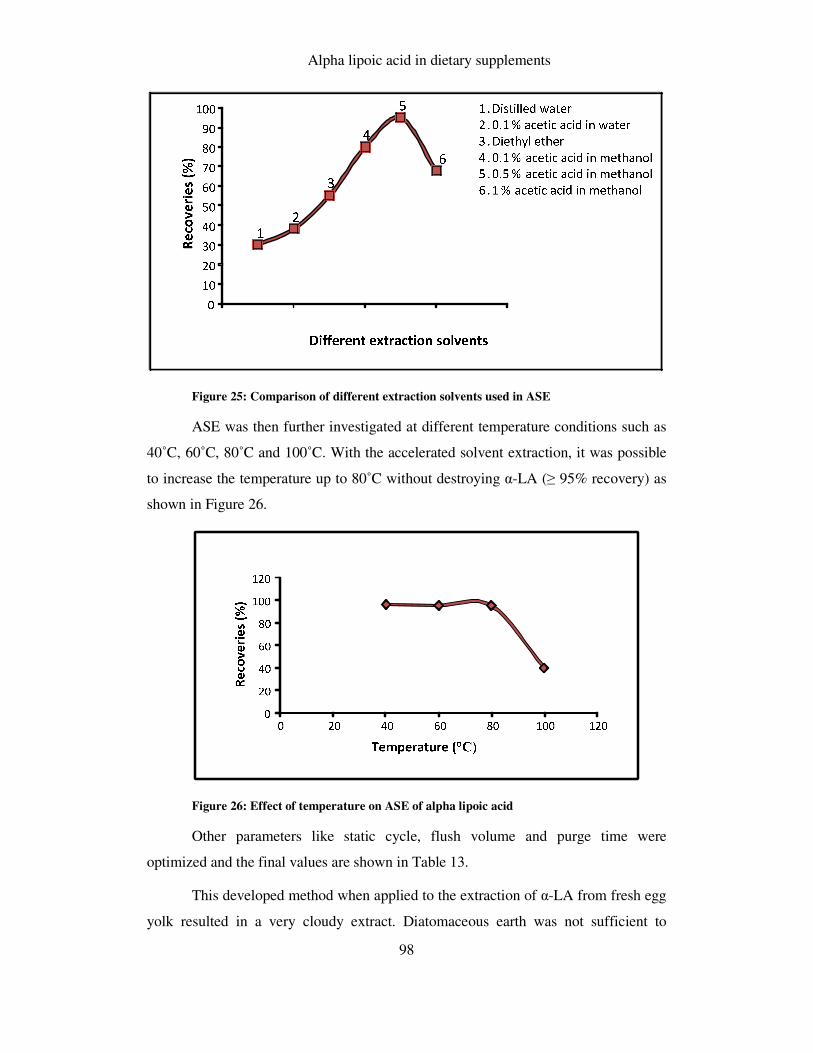
Alpha lipoic acid in dietary supplements
98
Figure 25: Comparison of different extraction solvents used in ASE
ASE was then further investigated at different temperature conditions such as
40˚C, 60˚C, 80˚C and 100˚C. With the accelerated solvent extraction, it was possible
to increase the temperature up to 80˚C without destroying α-LA (≥ 95% recovery) as
shown in Figure 26.
Figure 26: Effect of temperature on ASE of alpha lipoic acid
Other parameters like static cycle, flush volume and purge time were
optimized and the final values are shown in Table 13.
This developed method when applied to the extraction of α-LA from fresh egg
yolk resulted in a very cloudy extract. Diatomaceous earth was not sufficient to
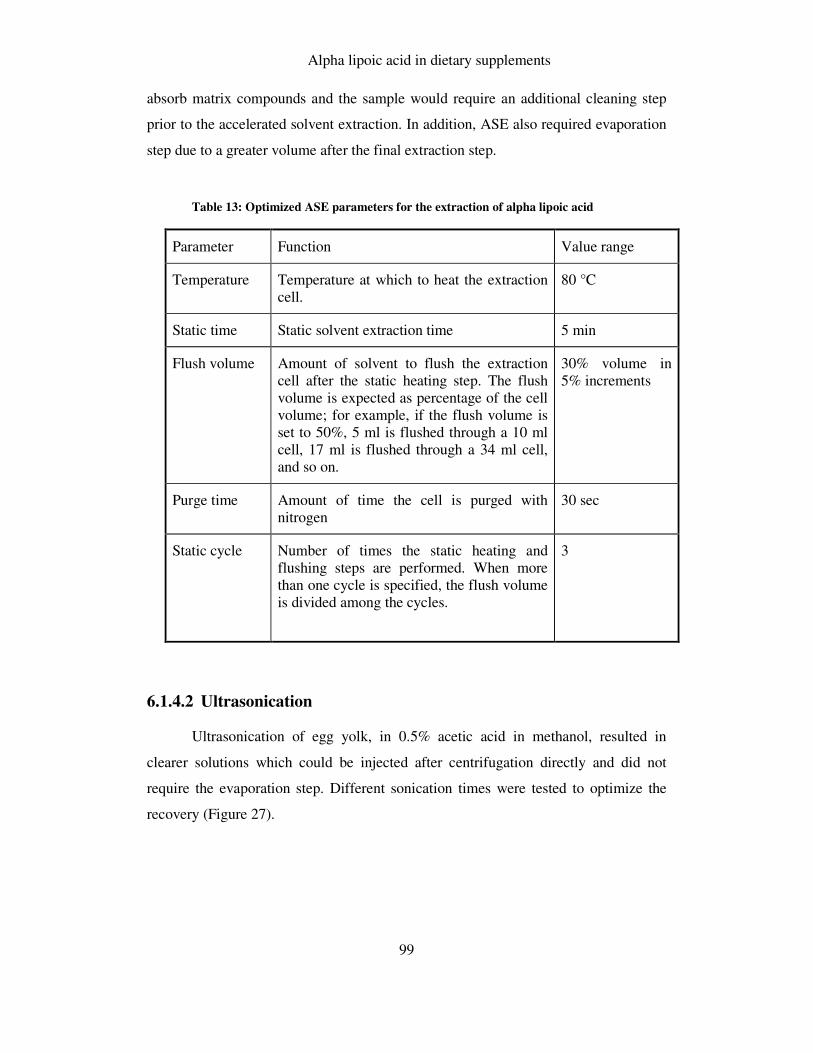
Alpha lipoic acid in dietary supplements
99
absorb matrix compounds and the sample would require an additional cleaning step
prior to the accelerated solvent extraction. In addition, ASE also required evaporation
step due to a greater volume after the final extraction step.
Table 13: Optimized ASE parameters for the extraction of alpha lipoic acid
Parameter Function Value range
Temperature Temperature at which to heat the extraction cell.
80 °C
Static time Static solvent extraction time 5 min
Flush volume Amount of solvent to flush the extraction cell after the static heating step. The flush volume is expected as percentage of the cell volume; for example, if the flush volume is set to 50%, 5 ml is flushed through a 10 ml cell, 17 ml is flushed through a 34 ml cell, and so on.
30% volume in 5% increments
Purge time Amount of time the cell is purged with nitrogen
30 sec
Static cycle Number of times the static heating and flushing steps are performed. When more than one cycle is specified, the flush volume is divided among the cycles.
3
6.1.4.2 Ultrasonication
Ultrasonication of egg yolk, in 0.5% acetic acid in methanol, resulted in
clearer solutions which could be injected after centrifugation directly and did not
require the evaporation step. Different sonication times were tested to optimize the
recovery (Figure 27).
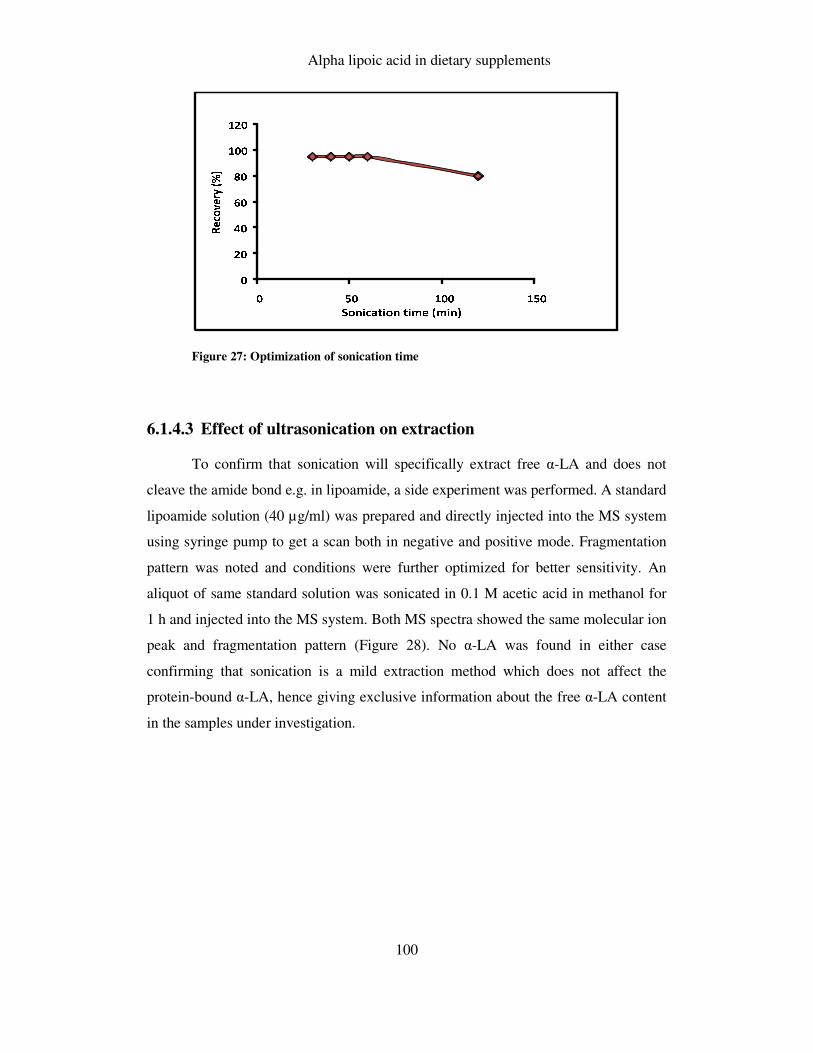
Alpha lipoic acid in dietary supplements
100
Figure 27: Optimization of sonication time
6.1.4.3 Effect of ultrasonication on extraction
To confirm that sonication will specifically extract free α-LA and does not
cleave the amide bond e.g. in lipoamide, a side experiment was performed. A standard
lipoamide solution (40 µg/ml) was prepared and directly injected into the MS system
using syringe pump to get a scan both in negative and positive mode. Fragmentation
pattern was noted and conditions were further optimized for better sensitivity. An
aliquot of same standard solution was sonicated in 0.1 M acetic acid in methanol for
1 h and injected into the MS system. Both MS spectra showed the same molecular ion
peak and fragmentation pattern (Figure 28). No α-LA was found in either case
confirming that sonication is a mild extraction method which does not affect the
protein-bound α-LA, hence giving exclusive information about the free α-LA content
in the samples under investigation.
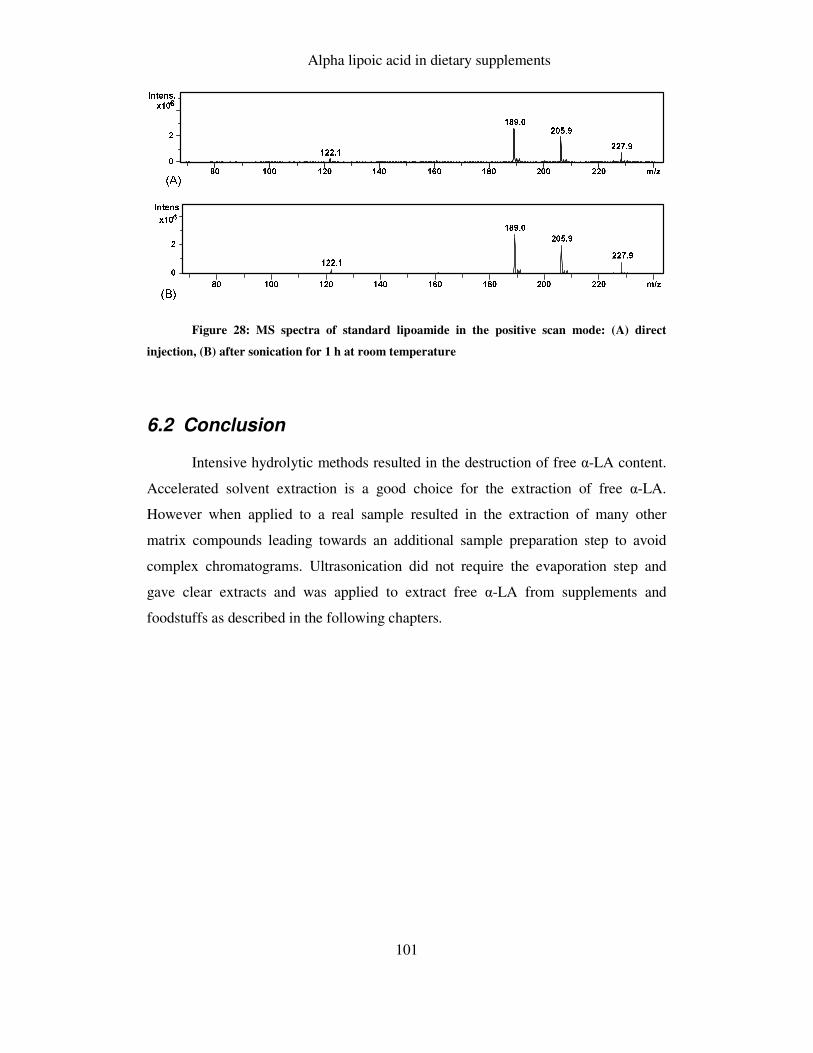
Alpha lipoic acid in dietary supplements
101
Figure 28: MS spectra of standard lipoamide in the positive scan mode: (A) direct
injection, (B) after sonication for 1 h at room temperature
6.2 Conclusion
Intensive hydrolytic methods resulted in the destruction of free α-LA content.
Accelerated solvent extraction is a good choice for the extraction of free α-LA.
However when applied to a real sample resulted in the extraction of many other
matrix compounds leading towards an additional sample preparation step to avoid
complex chromatograms. Ultrasonication did not require the evaporation step and
gave clear extracts and was applied to extract free α-LA from supplements and
foodstuffs as described in the following chapters.
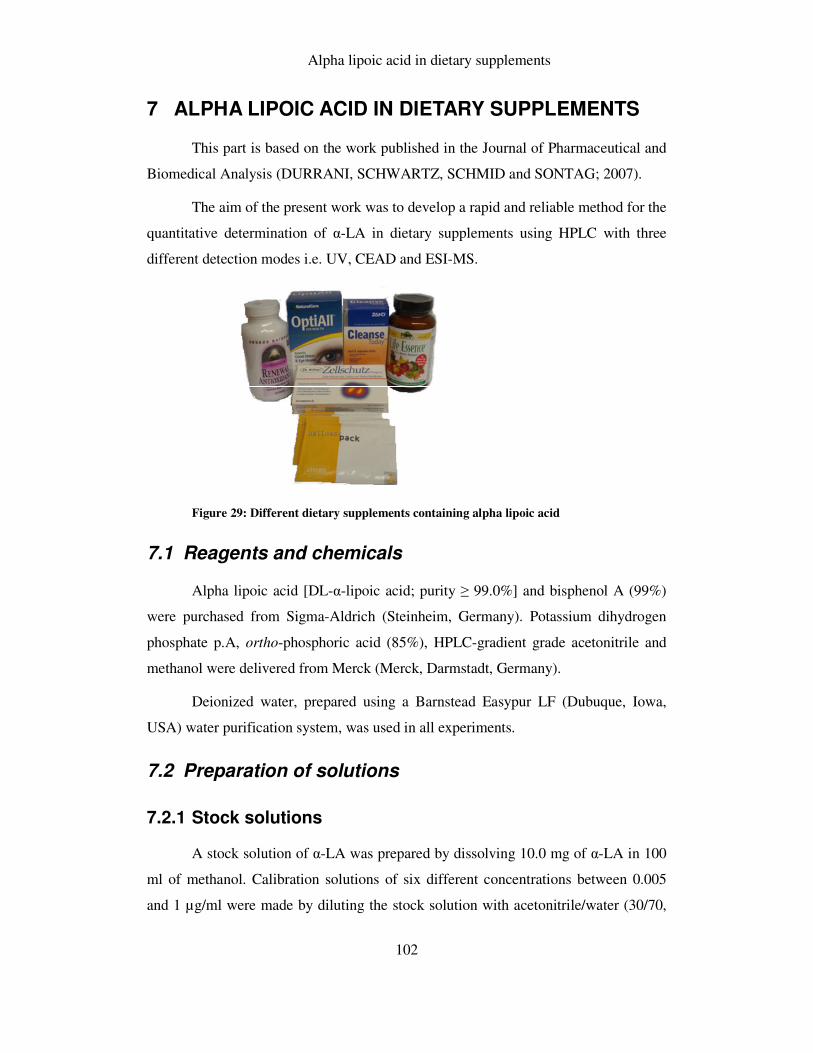
Alpha lipoic acid in dietary supplements
102
7 ALPHA LIPOIC ACID IN DIETARY SUPPLEMENTS
This part is based on the work published in the Journal of Pharmaceutical and
Biomedical Analysis (DURRANI, SCHWARTZ, SCHMID and SONTAG; 2007).
The aim of the present work was to develop a rapid and reliable method for the
quantitative determination of α-LA in dietary supplements using HPLC with three
different detection modes i.e. UV, CEAD and ESI-MS.
Figure 29: Different dietary supplements containing alpha lipoic acid
7.1 Reagents and chemicals
Alpha lipoic acid [DL-α-lipoic acid; purity ≥ 99.0%] and bisphenol A (99%)
were purchased from Sigma-Aldrich (Steinheim, Germany). Potassium dihydrogen
phosphate p.A, ortho-phosphoric acid (85%), HPLC-gradient grade acetonitrile and
methanol were delivered from Merck (Merck, Darmstadt, Germany).
Deionized water, prepared using a Barnstead Easypur LF (Dubuque, Iowa,
USA) water purification system, was used in all experiments.
7.2 Preparation of solutions
7.2.1 Stock solutions
A stock solution of α-LA was prepared by dissolving 10.0 mg of α-LA in 100
ml of methanol. Calibration solutions of six different concentrations between 0.005
and 1 µg/ml were made by diluting the stock solution with acetonitrile/water (30/70,
Alpha lipoic acid in dietary supplements
103
v/v). A stock solution of Bisphenol A was prepared by dissolving 10 mg bisphenol A
in 100 ml of methanol (internal standard) and was diluted with acetonitrile/water
(30/70, v/v) to 2 µg/ml. All the solutions were stored in tightly sealed amber
volumetric flasks at 4°C.
7.2.2 Dietary supplements
Six different dietary supplements (capsules/tablets/sachet) were purchased
from local pharmacies as well as from the US market. A detailed description is given
in Table 14. Ten tablets were weighed, finely ground and the average weight of one
tablet was determined. Likewise, the content of 10 capsules was pooled and the
average weight of one capsule was taken.
7.2.3 Mobile phase
Mobile phase I: Acetonitrile/methanol/50 mM potassium dihydrogen
phosphate (pH 3, adjusted with phosphoric acid), 350/65/585, (v/v/v) were mixed,
filtered through a 0.45 µm Sartolon polyamide filter (Sartorius AG, Goettingen
Germany) and degassed for 20 minutes prior to use.
Mobile phase II: consisted of 0.1% acetic acid in water and acetonitrile (55/45,
v/v).
7.3 Sample preparation
Three aliquots (50 mg) of each homogenized supplement and of the sachet
were dissolved in 8.0 ml of methanol and sonicated for 30 min at room temperature.
The mixtures were then transferred into 25 ml volumetric flasks and the volume was
made up to the mark with distilled water.
2 ml of the extracts were pipetted out into Eppendorf tubes and centrifuged for
10 min at 10,000 rpm. The supernatants were further diluted with acetonitrile/water
(30/70, v/v) depending on the content of supplement. 500 µl of these solutions were
then transferred to autosampler vials containing 450 µl acetonitrile/water (30/70, v/v)
and 50 µl of bisphenol A solution (2 µg/ml).
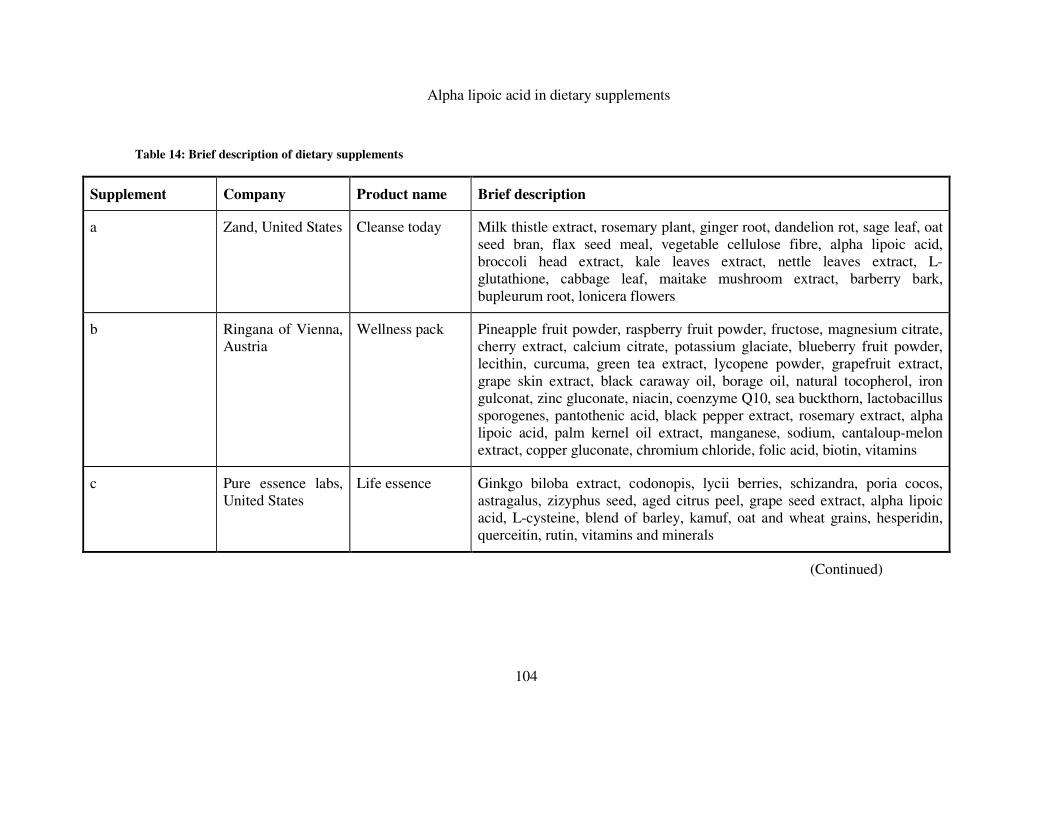
Alpha lipoic acid in dietary supplements
104
Table 14: Brief description of dietary supplements
Supplement Company Product name Brief description
a Zand, United States Cleanse today Milk thistle extract, rosemary plant, ginger root, dandelion rot, sage leaf, oat seed bran, flax seed meal, vegetable cellulose fibre, alpha lipoic acid, broccoli head extract, kale leaves extract, nettle leaves extract, L- glutathione, cabbage leaf, maitake mushroom extract, barberry bark, bupleurum root, lonicera flowers
b Ringana of Vienna, Austria
Wellness pack Pineapple fruit powder, raspberry fruit powder, fructose, magnesium citrate, cherry extract, calcium citrate, potassium glaciate, blueberry fruit powder, lecithin, curcuma, green tea extract, lycopene powder, grapefruit extract, grape skin extract, black caraway oil, borage oil, natural tocopherol, iron gulconat, zinc gluconate, niacin, coenzyme Q10, sea buckthorn, lactobacillus sporogenes, pantothenic acid, black pepper extract, rosemary extract, alpha lipoic acid, palm kernel oil extract, manganese, sodium, cantaloup-melon extract, copper gluconate, chromium chloride, folic acid, biotin, vitamins
c Pure essence labs, United States
Life essence Ginkgo biloba extract, codonopis, lycii berries, schizandra, poria cocos, astragalus, zizyphus seed, aged citrus peel, grape seed extract, alpha lipoic acid, L-cysteine, blend of barley, kamuf, oat and wheat grains, hesperidin, querceitin, rutin, vitamins and minerals
(Continued)
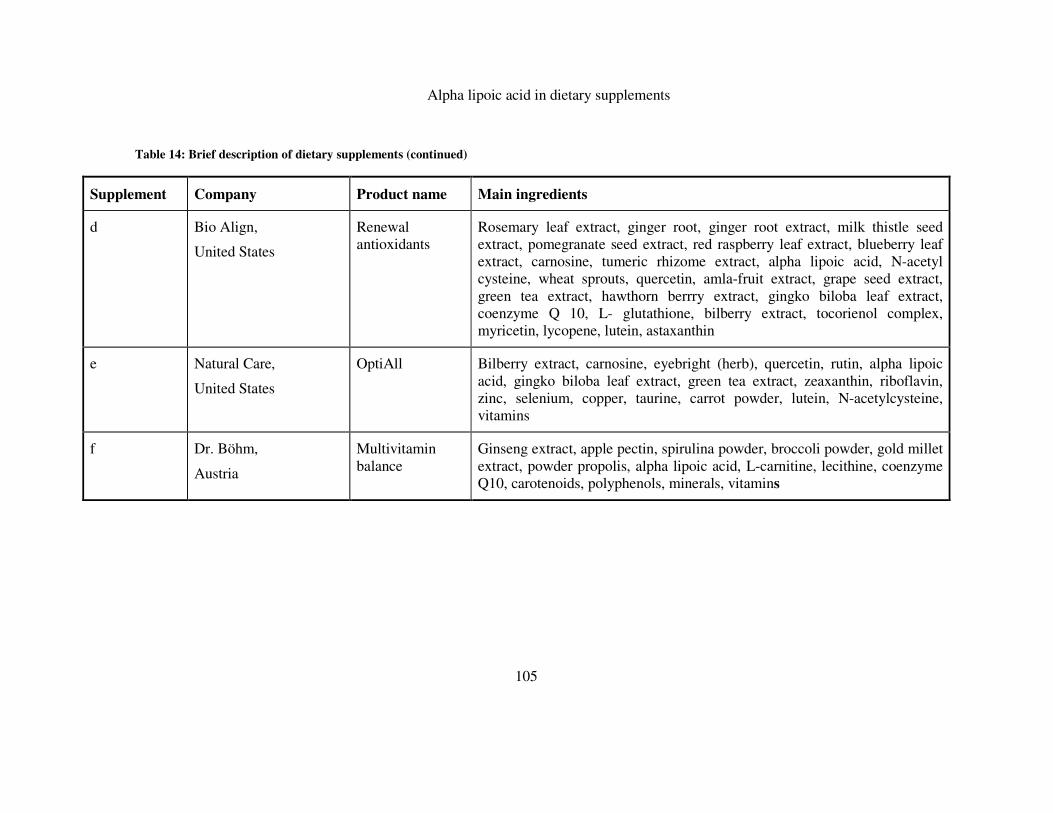
Alpha lipoic acid in dietary supplements
105
Table 14: Brief description of dietary supplements (continued)
Supplement Company Product name Main ingredients
d Bio Align,
United States
Renewal antioxidants
Rosemary leaf extract, ginger root, ginger root extract, milk thistle seed extract, pomegranate seed extract, red raspberry leaf extract, blueberry leaf extract, carnosine, tumeric rhizome extract, alpha lipoic acid, N-acetyl cysteine, wheat sprouts, quercetin, amla-fruit extract, grape seed extract, green tea extract, hawthorn berrry extract, gingko biloba leaf extract, coenzyme Q 10, L- glutathione, bilberry extract, tocorienol complex, myricetin, lycopene, lutein, astaxanthin
e Natural Care,
United States
OptiAll Bilberry extract, carnosine, eyebright (herb), quercetin, rutin, alpha lipoic acid, gingko biloba leaf extract, green tea extract, zeaxanthin, riboflavin, zinc, selenium, copper, taurine, carrot powder, lutein, N-acetylcysteine, vitamins
f Dr. Böhm,
Austria
Multivitamin balance
Ginseng extract, apple pectin, spirulina powder, broccoli powder, gold millet extract, powder propolis, alpha lipoic acid, L-carnitine, lecithine, coenzyme Q10, carotenoids, polyphenols, minerals, vitamins
Alpha lipoic acid in dietary supplements
106
7.4 HPLC-CEAD
The potentials of the electrodes were set at +300, +400, +450, +500, +550,
+600, +650, and +700 mV against palladium reference electrodes. 20 µl of the
standard and sample solutions were injected and the separation was carried out
isocratically (0.45 ml/min) with mobile phase I, using an ACE 3 C 18 (150 mm × 3.0
mm, particle size 3 µm) column (Advanced Chromatography Technologies,
Aberdeen, Scotland) equipped with a pre-column of same stationary phase material.
By plotting the peak area versus the potential of the working electrodes the
current/voltage curves for α-LA and bisphenol A were obtained.
7.5 HPLC-UV
UV detection was done at the wavelength of 215 nm and data were obtained
using chromatography data station software, HPLC manager version 2. Twenty
micro-litres of the standard or the sample solutions were injected into the HPLC
system.
Chromatographic separations were achieved isocratically using mobile phase I
at a flow rate of 0.45 ml/min. Column and pre-column were the same as used in the
HPLC-CEAD system.
7.6 HPLC-ESI-MS
MS detection was performed with electrospray ionization using the optimized
parameters as summarized in Table 10. Data were collected in the multiple reaction
monitoring mode [MRM] by fragmenting the deprotonated molecular ion [m/z 205]
without isolating it and by successively isolating the fragment ion m/z 171 [α-LA-
H2S-H]− and by isolating m/z 227 [BPA-H]−.
During the run time, the divert valve was set to waste from 0−3.5 min and
from 3.5−7.5 min to the source to avoid contamination from the matrix of
supplements.
Alpha lipoic acid in dietary supplements
107
7.7 Validation of methods
Standard calibration curves for α-LA using HPLC-UV, HPLC-CEAD and
HPLC-ESI-MS were plotted, on five successive days, using the analyte/IS (peak area
ratios) versus the nominal concentrations of the analytes. The relative standard
deviation of the slope was calculated.
The limits of detection (LOD) were determined at a signal-to-noise ratio of 3.
The intra-day repeatability was checked by injecting α-LA standard solution (0.19
µg/ml) five times on one day. The inter-day repeatability was tested by injecting the
same solution three times a day successively for 5 days. Stability of α-LA in the
standard solutions was checked both at 4°C and at room temperature.
An extract of supplement ‘a’ was prepared and diluted (1/2, v/v) with
acetonitrile/water (30/70, v/v) and stored at 4°C. 950 µl of this solution and 50 µl of
bisphenol A solution (2 µg/ml) were mixed in the autosampler vial and injected three
times each day to check the instrument performance.
7.8 Quantitative analysis
7.8.1 External calibration curve
The calibration curve was established by plotting the peak area ratios versus
the concentrations of α-LA in the standard solutions. The content of α-LA in the
supplements was determined by multiplying the obtained concentration with the
appropriate dilution factor, correcting by the weighed portion and considering the
recovery.
7.8.2 Standard addition
Supplement ‘f’ was selected for the standard addition method as it contains
less amount of α-LA than other supplements. First, 50 mg of supplement (in triplicate)
was treated as in section 7.3 and α-LA content was estimated with the external
calibration function. Then, 50 mg aliquots of the supplement ‘f’ were then spiked with
50, 100, 150, and 200% of the experimentally calculated α-LA content (each in
triplicate).
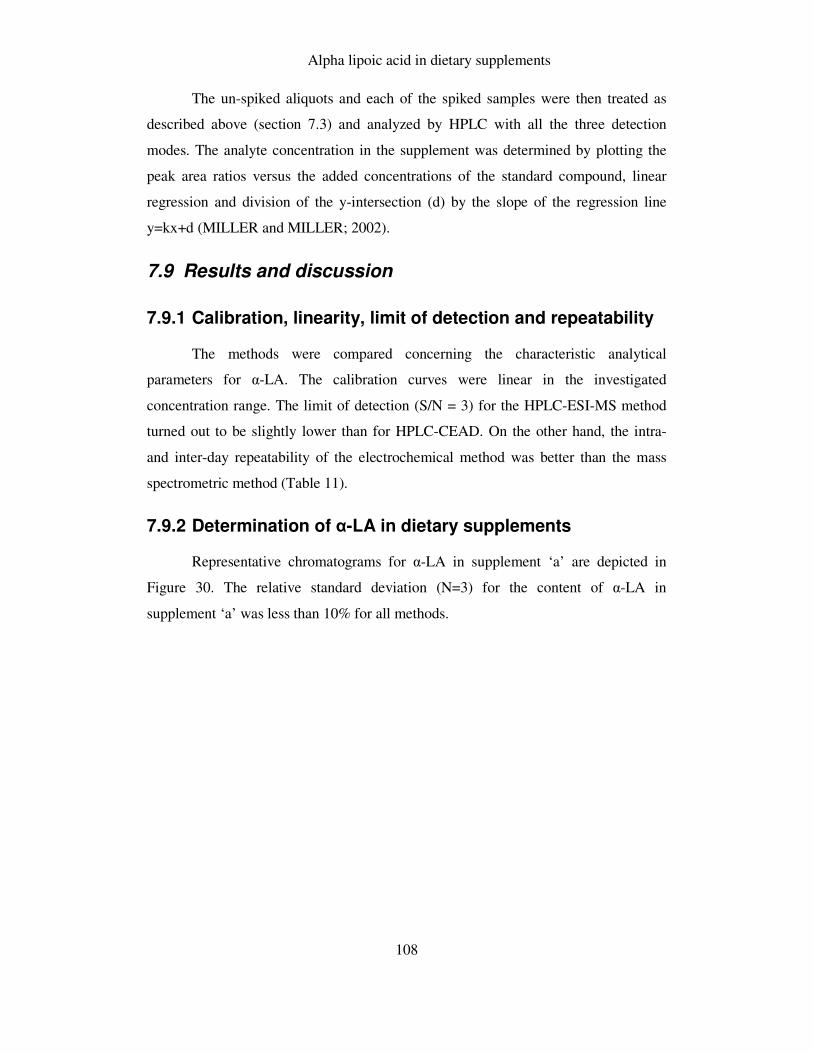
Alpha lipoic acid in dietary supplements
108
The un-spiked aliquots and each of the spiked samples were then treated as
described above (section 7.3) and analyzed by HPLC with all the three detection
modes. The analyte concentration in the supplement was determined by plotting the
peak area ratios versus the added concentrations of the standard compound, linear
regression and division of the y-intersection (d) by the slope of the regression line
y=kx+d (MILLER and MILLER; 2002).
7.9 Results and discussion
7.9.1 Calibration, linearity, limit of detection and repeatability
The methods were compared concerning the characteristic analytical
parameters for α-LA. The calibration curves were linear in the investigated
concentration range. The limit of detection (S/N = 3) for the HPLC-ESI-MS method
turned out to be slightly lower than for HPLC-CEAD. On the other hand, the intra-
and inter-day repeatability of the electrochemical method was better than the mass
spectrometric method (Table 11).
7.9.2 Determination of α-LA in dietary supplements
Representative chromatograms for α-LA in supplement ‘a’ are depicted in
Figure 30. The relative standard deviation (N=3) for the content of α-LA in
supplement ‘a’ was less than 10% for all methods.
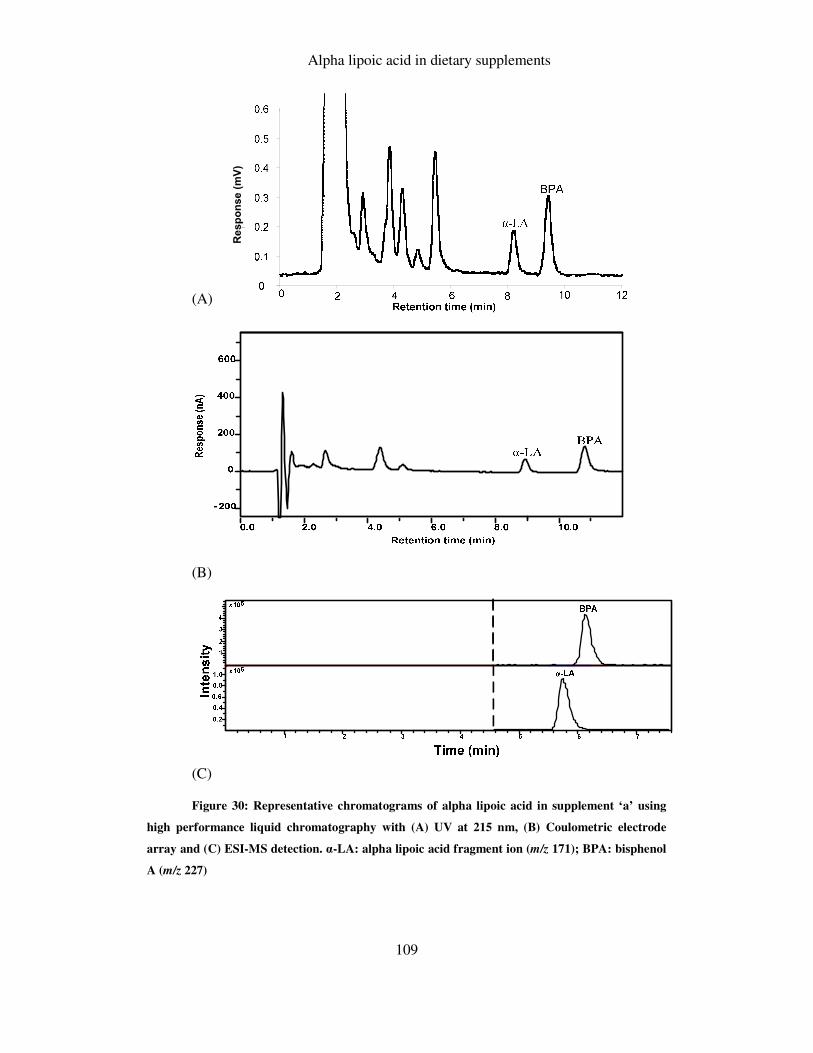
Alpha lipoic acid in dietary supplements
109
(A)
(B)
(C)
Figure 30: Representative chromatograms of alpha lipoic acid in supplement ‘a’ using
high performance liquid chromatography with (A) UV at 215 nm, (B) Coulometric electrode
array and (C) ESI-MS detection. α-LA: alpha lipoic acid fragment ion (m/z 171); BPA: bisphenol
A (m/z 227)
Response (mV)
Alpha lipoic acid in dietary supplements
110
Quantitative evaluation by external calibration method revealed that the
experimentally calculated values matched the manufacturer's claim only in case of
supplement ‘a’ (Table 15). The contents of the supplements b, c, d and e determined by
HPLC-CEAD and HPLC-ESI-MS showed a good correlation but were below the
values claimed by the manufacturers. Additionally three supplements as
representatives for a low and a high concentration (b, d and f) were investigated by
HPLC-UV and corresponding results were obtained (Table 15).
Table 15: Content of α-LA in dietary supplements
Supplement Claimed (µg/mg) Found (µg/mg)
HPLC-UV HPLC-CEAD HPLC-MS
a 34.9 33.6 33.9
b 0.7 0.4 0.4 0.5
c 1.3 0.9 0.9
d 20.6 12.1 12.1 13.2
e 13.1 9.9 10.5
f 1.0 0.4 0.4 0.4
In order to check whether the matrix compounds influence the measured α-LA
content or not, standard addition was performed. The recovery was determined by
division of the slope of the regression lines, obtained using standard addition method,
by the slope of the external calibration functions recorded in the same analysis run
and multiplication by 100 and was found to be 96 ± 2.1% (N = 3). The data of the
standard addition method confirm the results obtained by the external calibration
method. The deviation between the claimed values and the data found could be due to
improper handling during the production of the supplements or degradation of α-LA
during storage.
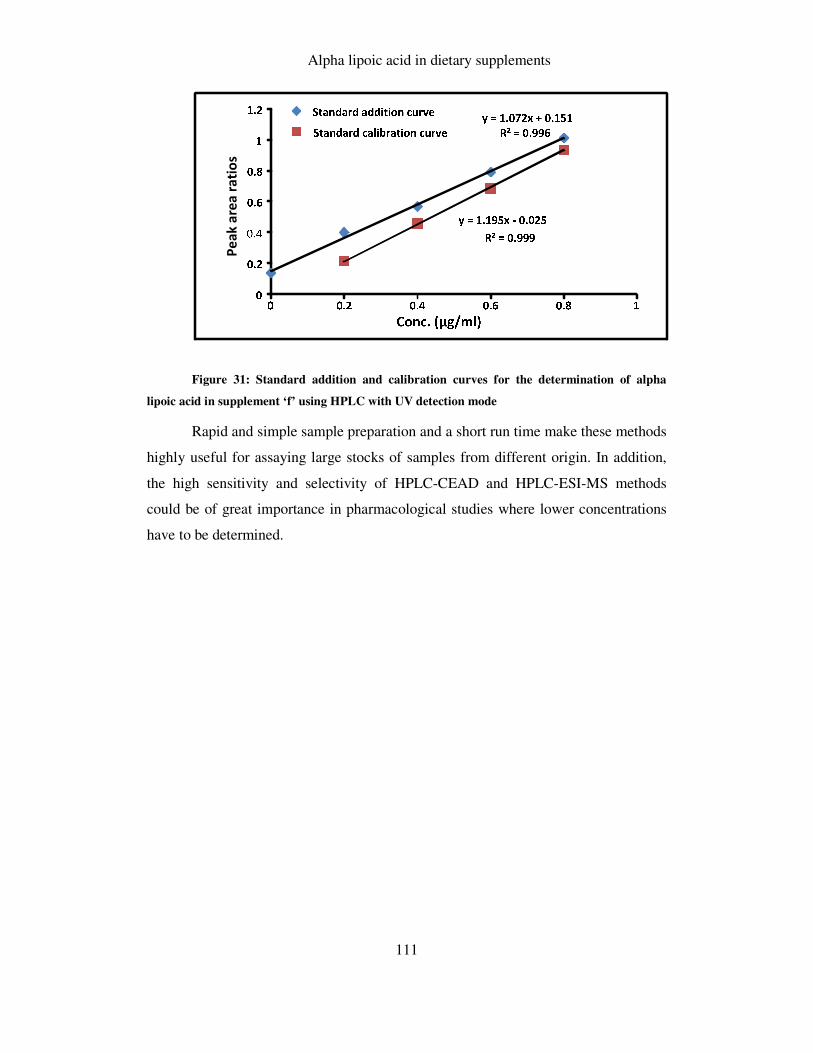
Alpha lipoic acid in dietary supplements
111
Peak area ratios
Figure 31: Standard addition and calibration curves for the determination of alpha
lipoic acid in supplement ‘f’ using HPLC with UV detection mode
Rapid and simple sample preparation and a short run time make these methods
highly useful for assaying large stocks of samples from different origin. In addition,
the high sensitivity and selectivity of HPLC-CEAD and HPLC-ESI-MS methods
could be of great importance in pharmacological studies where lower concentrations
have to be determined.
α-LA in foodstuffs
112
8 ALPHA LIPOIC ACID IN FOODSTUFFS
The aim of the present work was to develop a rapid and specific extraction
method for free α-LA in different foodstuffs using ultra-sound assisted extraction
followed by quantitative determination using HPLC with coulometric electrode array
system. In addition, HPLC-ESI-MS was used to confirm the presence of free α-LA in
the foodstuffs under investigation.
8.1 Reagents and chemicals
All the reagents and chemicals used were of analytical grade. Deionized water,
prepared using a Barnstead Easypur LF (Dubuque, Iowa, USA) water purification
system, was used in all experiments. Alpha-lipoic acid (DL-α-lipoic acid; purity ≥
99.0%) and bisphenol A (99%) were purchased from Sigma-Aldrich (Steinheim,
Germany). Potassium dihydrogen phosphate (p.A), ortho-phosphoric acid (85%;
w/w), HPLC-gradient grade acetonitrile and methanol were delivered from Merck
(Darmstadt, Germany).
8.2 Preparation of solutions
Primary stock solution of both α–LA and internal standard (BPA) were
prepared in methanol (50 µg/ml). Six calibration standards containing α–LA in the
concentration range between 0.005 and 0.5 µg/ml were prepared in acetonitrile/water
(30/70, v/v). All solutions were stored in tightly sealed amber glass vials at 4°C.
8.3 Samples
Different food samples of animal and plant origin were collected from
supermarkets (Table 16). Fresh eggs (3 packages of six eggs each), potatoes (3 x 500
g) and canned peas (3 x 400 g) were obtained in autumn 2007. Two mayonnaise tubes
(275 g each) were also obtained from the supermarkets while dried egg powder was
prepared in the lab by spray drying.
α-LA in foodstuffs
113
Table 16: Characterization of samples purchased in Vienna, Austria, in autumn 2007
∗With courtesy of Ao. Univ. Prof. Dr. Emmerich Berghofer., University of
Natural Resources and Applied Life Science, Vienna, Austria
In the case of eggs, egg yolk and egg white were separated and α–LA content
was determined in the fresh egg yolk and egg white. In another experiment, an egg
was boiled for 15 min and the α–LA content was determined separately in the boiled
egg yolk and egg white. Potatoes were peeled and 50 g of the edible part from each
primary sample unit were crushed and homogenized. Similarly 50 g of fine peas from
each can were washed with lukewarm water, dried under the folds of tissue paper,
crushed and homogenized. 10 g potions of mayonnaise were taken as such from the
tube, homogenized.
8.4 Sample preparation
Three aliquots (50-150 mg) of each fresh and homogenized sample were taken
into Eppendorf tubes, dissolved in 1.0 ml of acidified methanol (0.5% acetic acid in
methanol, v/v) and sonicated for 1 h at room temperature. The mixtures were then
centrifuged at 10000 rpm for 10 min. Two different steps were adopted to comply
with the two different HPLC systems.
Common name Scientific name Manufacturer
Chicken egg Gallus domesticus Ja natuerlich/Organic farming
Dried egg powder - In lab*
Mayonnaise I Commercial product Clever
Mayonnaise II Commercial product
Qualitaet aus Oesterreich (eggs from organic farming)
Potatoes Solanum tuberosum Fresh
Green peas Piscum sativum Bonduelle

α-LA in foodstuffs
114
HPLC-CEAD analysis: 0.5 ml of the supernatant solutions were taken into
autosampler vials and 0.05 ml of BPA (0.5 µg/mL) were added.
HPLC-MS analysis: The supernatants were evaporated to dryness on a rotary
evaporator, the obtained residues were then dissolved in 1.0 ml of acetonitrile/water
(30/70, v/v) and centrifuged at 10000 rpm for 5 min. 0.5 ml of each supernatant was
then taken into autosampler vials containing 0.05 ml of BPA solution (0.5 µg/ml).
8.5 HPLC-CEAD
The HPLC system consisted of a Merck Hitachi pump L-6200, a Basic
Marathon autosampler (Spark, Holland B.V., Emmen, The Netherlands), an ACE
3 C 18 (150×3.0 mm, particle size 3 µm) column (Advanced Chromatography
Technologies, Aberdeen, Scotland) equipped with an ACE 3 C 18 pre-column and a
coulometric electrode array detector controlled by Coul Array Win/Software (ESA,
Chelmsford, USA). The potentials of the electrodes were set at +300, +400, +450,
+500, +550, +600, +650, +700 mV against palladium reference electrodes. 20 µl of
the standard or sample solutions were injected into the HPLC system.
Chromatographic separations were achieved isocratically using a mobile phase
containing acetonitrile/methanol/50 mM potassium dihydrogen phosphate buffer (pH
3, adjusted with phosphoric acid), 350/65/585, v/v/v. The mobile phase was filtered
through a 0.45 µm Sartolon polyamide filter (Sartorius AG, Goettingen Germany) and
degassed by sonication for 20 min prior to use. The flow rate was set at 0.45 mL/min.
Current/voltage curves for α-LA and bisphenol A were obtained by plotting the peak
height ratios versus the potential of the working electrodes.
8.6 HPLC-ESI-MS
The HPLC 1100 series system (Agilent Technology, Palo Alto, CA, USA)
consisted of a G1312A binary pump, a G1322A mobile phase vacuum degassing unit,
a G1313A autosampler, an ACE 3 C 18 (150 × 2.1 mm, particle size 3 µm) column
with an ACE 3 C 18 pre-column and an ion trap mass spectrometric (MS) detector
HCT+, (Bruker Daltonics, Bremen, Germany) equipped with an electrospray
ionization (ESI) source. Hystar 3.1, software for chromatography and hyphenated
techniques, was used to acquire the data. Data were then integrated using the software
α-LA in foodstuffs
115
Data analysisTM version 3.3. Isocratic elution was carried out at a flow rate of 0.2
mL/min with a mobile phase containing 0.1% acetic acid in acetonitrile/water (45/55,
v/v). The capillary voltage was set at 4.5 kV and the electrospray ionization of the
column effluents was performed with nitrogen as nebulizing gas at 10 l/min, 40 psi
nebulizing pressure, and 300 °C drying gas temperature.
Data were collected in MRM mode by [M-H]- to [M-H-H2S]- without isolation
and subsequent isolation of [M-H-H2S]- formed in source and ion trap in time window
1 (LA), and isolation of [M-H]- in time window 2 (BPA); processed according to the
method developed in our previous research work (DURRANI, SCHWARTZ,
SCHMID and SONTAG; 2007).
8.7 Validation of methods
Standard calibration curves for α-LA were generated on five successive days
by plotting the analyte/internal standard peak height ratios versus the nominal
concentrations of α-LA and the relative standard deviation of the slope was
calculated. The limit of detection (S/N = 3) was determined by sequentially diluting
the lowest concentrated standard α-LA solution. The intra-day repeatability was
checked by injecting α-LA standard solution (0.19 µg/ml) five times on one day. The
inter-day repeatability was tested by injecting the same solution three times a day
successively for five days.
The stability of α-LA and BPA in the standards and sample solutions was
determined by leaving the solutions a) overnight in the autosampler vials at room
temperature after the first injection cycle and then injecting them again the next day
and b) by storing the solutions in the freezer at -18˚C for three days. Standard
solutions and the spiked sample solutions were then thawed at room temperature 1 h
prior to analysis.
8.8 Qualitative analysis
α-Lipoic acid was identified in the samples applying HPLC-ESI-MS and
HPLC-CEAD by comparing both retention times, mass spectra and current voltage
curves (CVCs) with those in the standard solutions measured during the same analysis
run (Figure 32). CVCs were obtained by plotting the peak height of α-LA in each
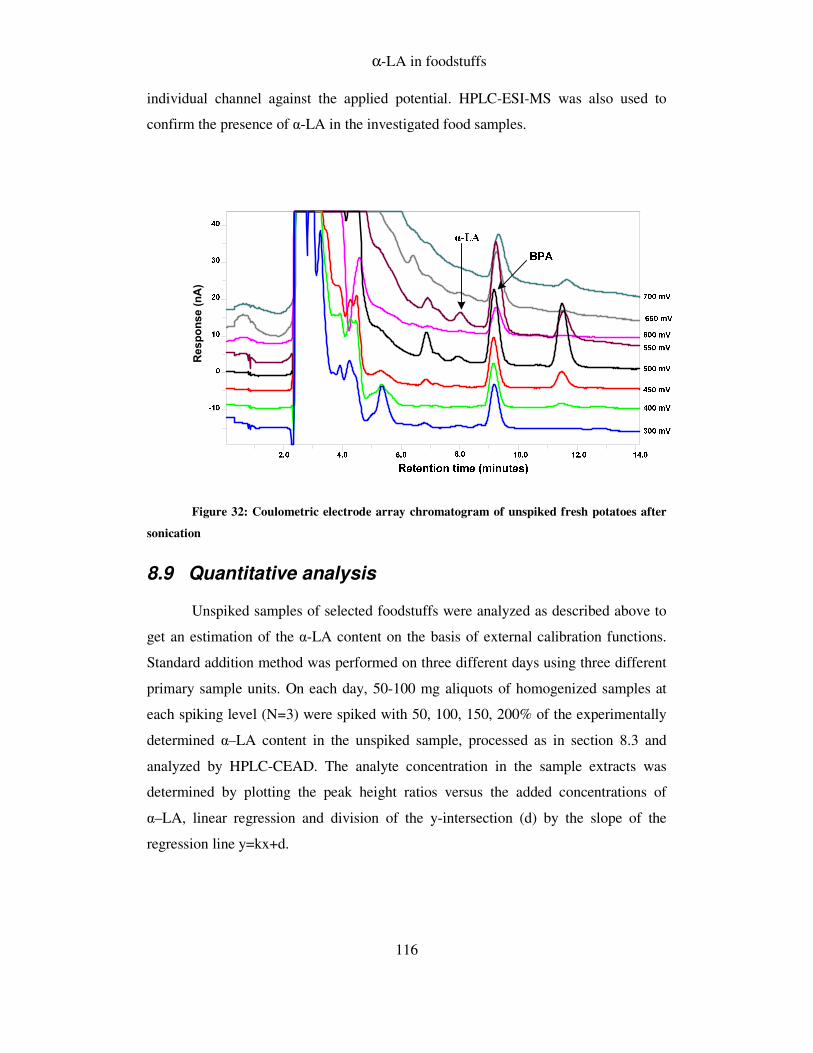
α-LA in foodstuffs
116
individual channel against the applied potential. HPLC-ESI-MS was also used to
confirm the presence of α-LA in the investigated food samples.
Response (nA)
Figure 32: Coulometric electrode array chromatogram of unspiked fresh potatoes after
sonication
8.9 Quantitative analysis
Unspiked samples of selected foodstuffs were analyzed as described above to
get an estimation of the α-LA content on the basis of external calibration functions.
Standard addition method was performed on three different days using three different
primary sample units. On each day, 50-100 mg aliquots of homogenized samples at
each spiking level (N=3) were spiked with 50, 100, 150, 200% of the experimentally
determined α–LA content in the unspiked sample, processed as in section 8.3 and
analyzed by HPLC-CEAD. The analyte concentration in the sample extracts was
determined by plotting the peak height ratios versus the added concentrations of
α–LA, linear regression and division of the y-intersection (d) by the slope of the
regression line y=kx+d.
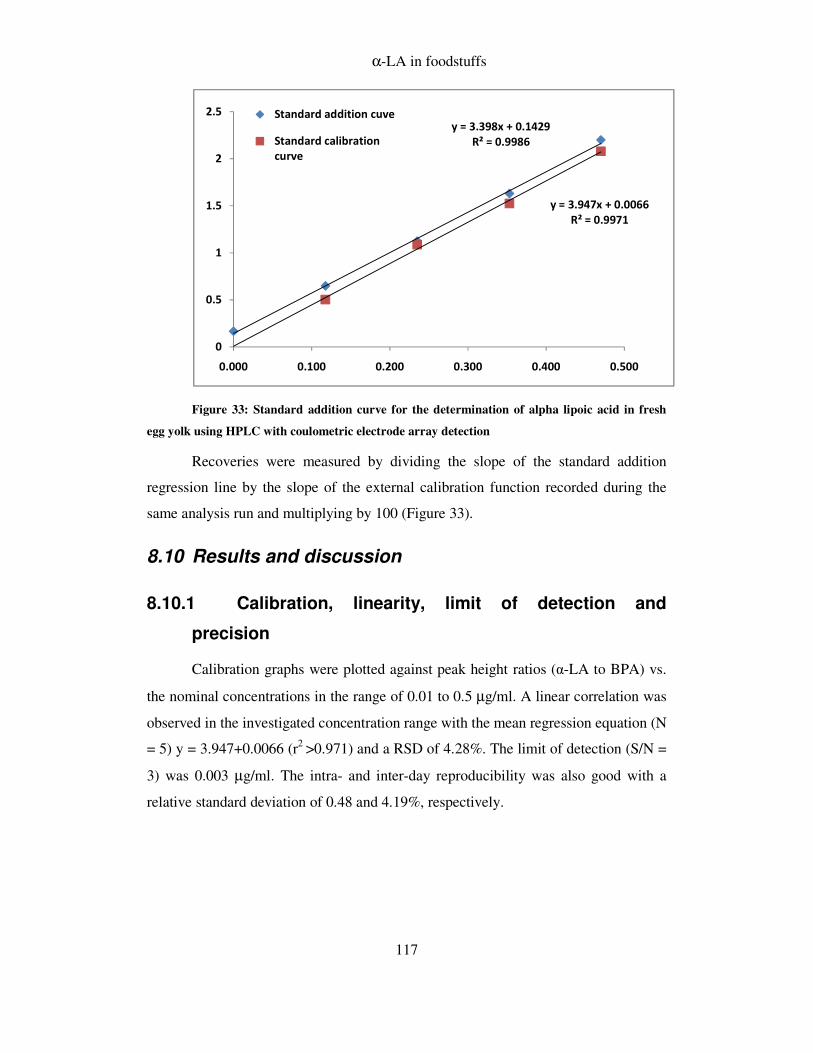
α-LA in foodstuffs
117
Figure 33: Standard addition curve for the determination of alpha lipoic acid in fresh
egg yolk using HPLC with coulometric electrode array detection
Recoveries were measured by dividing the slope of the standard addition
regression line by the slope of the external calibration function recorded during the
same analysis run and multiplying by 100 (Figure 33).
8.10 Results and discussion
8.10.1 Calibration, linearity, limit of detection and
precision
Calibration graphs were plotted against peak height ratios (α-LA to BPA) vs.
the nominal concentrations in the range of 0.01 to 0.5 µg/ml. A linear correlation was
observed in the investigated concentration range with the mean regression equation (N
= 5) y = 3.947+0.0066 (r2 >0.971) and a RSD of 4.28%. The limit of detection (S/N =
3) was 0.003 µg/ml. The intra- and inter-day reproducibility was also good with a
relative standard deviation of 0.48 and 4.19%, respectively.
y = 3.398x + 0.1429
R² = 0.9986
y = 3.947x + 0.0066
R² = 0.9971
0
0.5
1
1.5
2
2.5
0.000 0.100 0.200 0.300 0.400 0.500
Standard addition cuve
Standard calibration
curve
α-LA in foodstuffs
118
8.10.2 Storage stability
Stability tests showed that both α-LA and internal standard BPA are stable
within the assay variability of ±15% RSD upon storage at room temperature for one
day and upon freezing for two days.
8.10.3 Alpha lipoic acid in food
The developed method was applied to determine the α-LA content in different
food materials, from both plant and animal sources. Representative chromatograms of
spiked and unspiked dried egg powder, obtained by HPLC-CEAD, are illustrated in
Figure 34. In a second experiment, an extract of unspiked dried egg powder was
injected into the HPLC-ESI-MS system to verify the presence of α-LA (Figure 35).
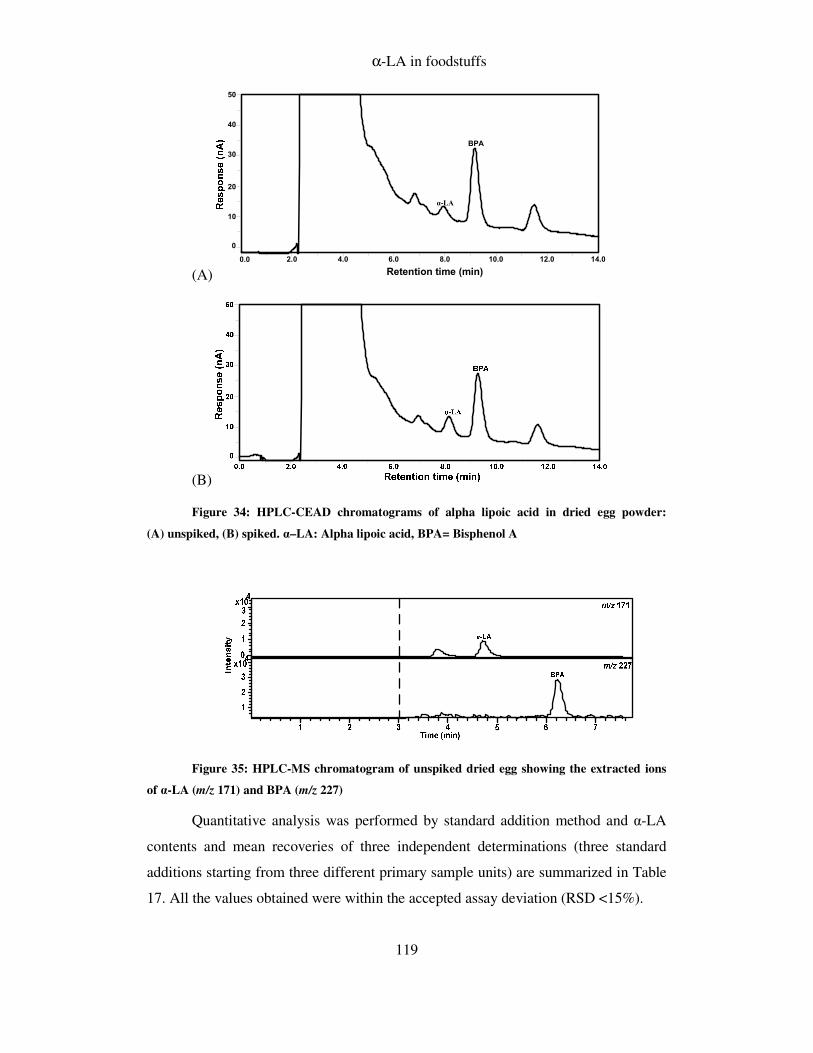
α-LA in foodstuffs
119
(A)2.0 4.0 6.0 8.0 10.0 12.0 14.0
Retention time (min)
BPA
α-LA
0
10
20
30
40
50
0.0
(B)
Figure 34: HPLC-CEAD chromatograms of alpha lipoic acid in dried egg powder:
(A) unspiked, (B) spiked. α–LA: Alpha lipoic acid, BPA= Bisphenol A
Figure 35: HPLC-MS chromatogram of unspiked dried egg showing the extracted ions
of α-LA (m/z 171) and BPA (m/z 227)
Quantitative analysis was performed by standard addition method and α-LA
contents and mean recoveries of three independent determinations (three standard
additions starting from three different primary sample units) are summarized in Table
17. All the values obtained were within the accepted assay deviation (RSD <15%).
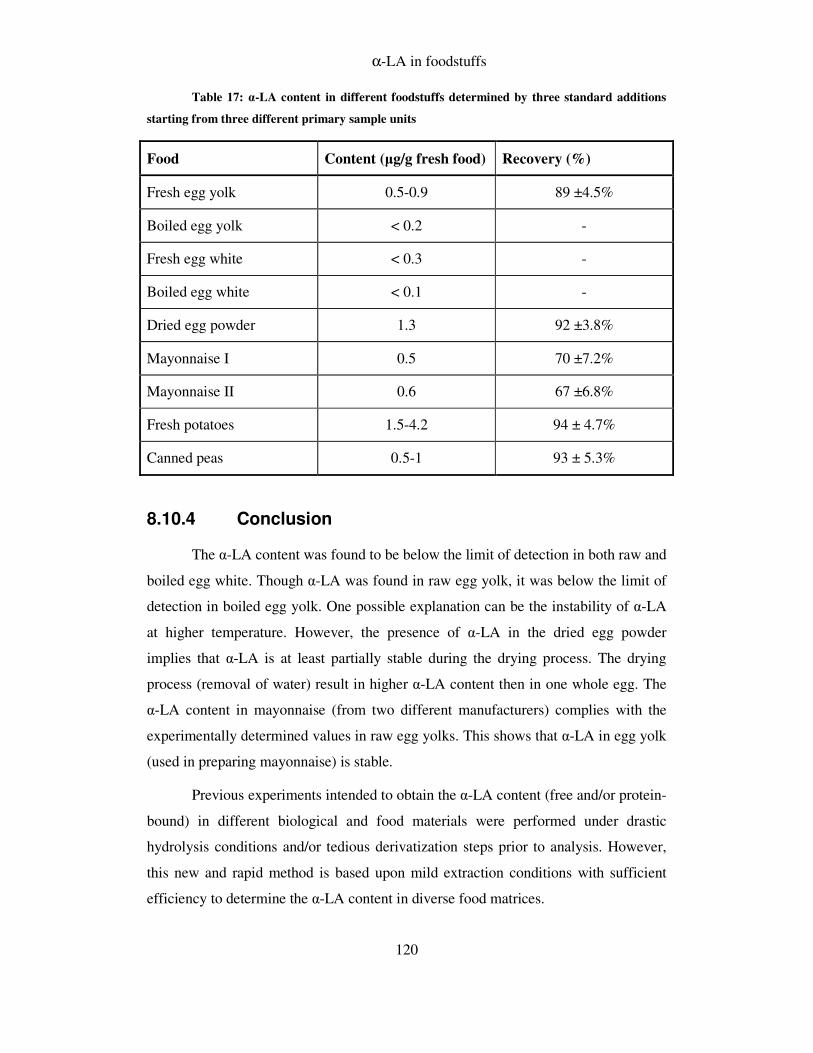
α-LA in foodstuffs
120
Table 17: α-LA content in different foodstuffs determined by three standard additions
starting from three different primary sample units
Food Content (µg/g fresh food) Recovery (%)
Fresh egg yolk 0.5-0.9 89 ±4.5%
Boiled egg yolk < 0.2 -
Fresh egg white < 0.3 -
Boiled egg white < 0.1 -
Dried egg powder 1.3 92 ±3.8%
Mayonnaise I 0.5 70 ±7.2%
Mayonnaise II 0.6 67 ±6.8%
Fresh potatoes 1.5-4.2 94 ± 4.7%
Canned peas 0.5-1 93 ± 5.3%
8.10.4 Conclusion
The α-LA content was found to be below the limit of detection in both raw and
boiled egg white. Though α-LA was found in raw egg yolk, it was below the limit of
detection in boiled egg yolk. One possible explanation can be the instability of α-LA
at higher temperature. However, the presence of α-LA in the dried egg powder
implies that α-LA is at least partially stable during the drying process. The drying
process (removal of water) result in higher α-LA content then in one whole egg. The
α-LA content in mayonnaise (from two different manufacturers) complies with the
experimentally determined values in raw egg yolks. This shows that α-LA in egg yolk
(used in preparing mayonnaise) is stable.
Previous experiments intended to obtain the α-LA content (free and/or protein-
bound) in different biological and food materials were performed under drastic
hydrolysis conditions and/or tedious derivatization steps prior to analysis. However,
this new and rapid method is based upon mild extraction conditions with sufficient
efficiency to determine the α-LA content in diverse food matrices.
α-LA in foodstuffs
121
Ultrasound-assisted extraction of α-LA from various samples of vegetable and
animal origin has been proved as a simple, fast and reliable sample preparation
method. High performance liquid chromatography coupled with coulometric electrode
array detection offer more sensitivity and specificity than the chromatographic
methods reported previously. Non-destructive extraction conditions and short
chromatographic run-time offers additional advantages. This new method can play an
important role in establishing a database for the α-LA content in different foodstuffs.
In summarizing, this method is recommendable for analyzing the free α-LA
content in egg-based samples and vegetables. HPLC-ESI-MS is very useful to
confirm the presence of free α-LA in complex food matrices.

References
122
9 REFERENCES
ABBAS, M. N. and RADWAN, A. A. (2008). "Novel lipoate-selective membrane sensor for the flow injection determination of α-lipoic acid in pharmaceutical preparations and urine." Talanta 74(5): 1113-1121.
ALLISON, L. A. and SHOUP, R. E. (1983). "Dual electrode liquid chromatography
detector for thiols and disulfides." Anal Chem 55(1): 8-12. ATAMNA, H. (2004). "Heme, iron, and the mitochondrial decay of ageing." Ageing
Res Rev 3(3): 303-18. BAEUERLE, P. A. (1991). "The inducible transcription activator NF-kappa B:
regulation by distinct protein subunits." Biochim Biophys Acta 1072(1): 63-80.
BIEWENGA, G. P. and BAST, A. (1995). "Reaction of lipoic acid with ebselen and
hypochlorous acid." Methods Enzymol 251: 303-14. BIEWENGA, G. P., HAENEN, G. R. and BAST, A. (1997). "The pharmacology of
the antioxidant lipoic acid." Gen Pharmacol 29(3): 315-31. BROWNER, M. F., TARONI, F., SZTUL, E., et al. (1989). "Sequence analysis,
biogenesis, and mitochondrial import of the alpha-subunit of rat liver propionyl-CoA carboxylase." J Biol Chem 264(21): 12680-5.
BUSSE, E., ZIMMER, G., SCHOPOHL, B., et al. (1992). "Influence of alpha-lipoic
acid on intracellular glutathione in vitro and in vivo." Arzneimittelforschung 42(6): 829-31.
BUSTAMANTE, J., LODGE, J. K., MARCOCCI, L., et al. (1998). "Alpha-lipoic
acid in liver metabolism and disease." Free Radic Biol Med 24(6): 1023-39. CARREAU, J. P. (1979). "Biosynthesis of lipoic acid via unsaturated fatty acids."
Methods Enzymol 62: 152-8. CHEN, J., JIANG, W., CAI, J., et al. (2005). "Quantification of lipoic acid in plasma
by high-performance liquid chromatography-electrospray ionization mass spectrometry." J Chromatogr B 824(1-2): 249-57.
CORDUNEANU, O., GARNETT, M. and BRETT, A. M. O. (2007). "Anodic
oxidation of α-lipoic acid at a glassy carbon electrode and its determination in dietary supplements." Anal Lett 40(9): 1763-1778.
DEVASAGAYAM, T. P., SUBRAMANIAN, M., PRADHAN, D. S., et al. (1993).
"Prevention of singlet oxygen-induced DNA damage by lipoate." Chem Biol Interact 86(1): 79-92.
References
123
DURRANI, A. I., SCHWARTZ, H., SCHMID, W., et al. (2007). "Alpha-lipoic acid in dietary supplements: development and comparison of HPLC-CEAD and HPLC-ESI-MS methods." J Pharm Biomed Anal 45(4): 694-9.
ENSMINGER, A. H., ENSMINGER, M. E., KONLANDE, J. E., et al. (1994). Foods
and Nutrition Encyclopedia. Boca Raton, FL, CRC Press Inc.: 1318-1319. FOSTER, T. S. (2007). "Efficacy and safety of alpha-lipoic acid supplementation in
the treatment of symptomatic diabetic neuropathy." Diabetes Educ 33(1): 111-7.
FUJIWARA, K., OKAMURA-IKEDA, K., PACKER, L., et al. (1997). "Synthesis
and characterization of selenolipoylated H-protein of the glycine cleavage system." J Biol Chem 272(32): 19880-3.
FURR, H. C., SHIH, J. C., HARRISON, E. H., et al. (1979). "Chromatographic and
spectral properties of lipoic acid and its metabolites." Methods Enzymol 62: 129-35.
GANDHI, V. M., WAGH, S. S., NATRAJ, C. V., et al. (1985). "Lipoic acid and
diabetes II: Mode of action of lipoic acid." J Biosci 9: 117-127. GATTI, R., BOUSQUET, E., BONAZZI, D., et al. (1996). "Determination of
carboxylic acid salts in pharmaceuticals by high-performance liquid chromatography after pre-column fluorogenic labeling." Biomed Chromatog 10(1): 19-24.
GRUNERT, R. R. (1960). "The effect of DL-alpha-lipoic acid on heavy-metal
intoxication in mice and dogs." Arch Biochem Biophys 86: 190-4. GUEGUEN, V., MACHEREL, D., JAQUINOD, M., et al. (2000). "Fatty acid and
lipoic acid biosynthesis in higher plant mitochondria." J Biol Chem 275(7): 5016-25.
GUNSALUS, I. C. (1953). "The chemistry and function of the pyruvate oxidation
factor (lipoic acid)." J Cell Physiol Suppl 41(Suppl 1): 113-36. HAJ-YEHIA, A. I., ASSAF, P., NASSAR, T., et al. (2000). "Determination of lipoic
acid and dihydrolipoic acid in human plasma and urine by high-performance liquid chromatography with fluorimetric detection." J Chromatogr A 870(1-2): 381-8.
HAN, D., HANDELMAN, G. J. and PACKER, L. (1995). "Analysis of reduced and
oxidized lipoic acid in biological samples by high-performance liquid chromatography." Methods Enzymol 251: 315-25.
References
124
HAN, D., TRITSCHLER, H. J. and PACKER, L. (1995). "Alpha-lipoic acid increases intracellular glutathione in a human T-lymphocyte Jurkat cell line." Biochem Biophys Res Commun 207(1): 258-64.
HANDELMAN, G. J., HAN, D., TRITSCHLER, H., et al. (1994). "Alpha-lipoic acid
reduction by mammalian cells to the dithiol form, and release into the culture medium." Biochem Pharmacol 47(10): 1725-30.
HERBERT, A. A. and GUEST, J. R. (1975). "Lipoic acid content of Escherichia coli
and other microorganisms." Arch Microbiol 106(3): 259-66. HIRAGA, K. and KIKUCHI, G. (1980). "The mitochondrial glycine cleavage system.
Purification and properties of glycine decarboxylase from chicken liver mitochondria." J Biol Chem 255(24): 11664-70.
HOWARD, S. C. and MCCORMICK, D. B. (1981). "High-performance liquid
chromatography of lipoic acid and analogs." J Chromatogr 208(1): 129-131. IGUCHI, S., YAMAMOTO, M. and AOYAMA, T. (1966). "Gas chromatographic
determination of lipoic acid and lipoamide." J Vitaminol (Kyoto) 12(1): 67-73. INAM-UL-HAQUE and AMIN, S. (2007). "Lipoic acid - a short review." Science
International (Lahore, Pakistan) 19(4): 273-276. JACKMAN, S. A., HOUGH, D. W., DANSON, M. J., et al. (1990). "Subcellular
localisation of dihydrolipoamide dehydrogenase and detection of lipoic acid in bloodstream forms of Trypanosoma brucei." Eur J Biochem 193(1): 91-5.
JORDAN, S. W. and CRONAN, J. E., JR. (1997). "Biosynthesis of lipoic acid and
posttranslational modification with lipoic acid in Escherichia coli." Methods Enzymol 279: 176-83.
KAGAN, V. E., SHVEDOVA, A., SERBINOVA, E., et al. (1992). "Dihydrolipoic
acid - a universal antioxidant both in the membrane and in the aqueous phase. Reduction of peroxyl, ascorbyl and chromanoxyl radicals." Biochem Pharmacol 44(8): 1637-49.
KAMATA, K. and AKIYAMA, K. (1990). "High-performance liquid
chromatography with electrochemical detection for the determination of thioctic acid and thioctic acid amide " J Pharm Biomed Anal 8(5): 453-456.
KATAOKA, H. (1998). "Chromatographic analysis of lipoic acid and related
compounds." J Chromatogr B 717(1-2): 247-62. KATAOKA, H., HIRABAYASHI, N. and MAKITA, M. (1993). "Analysis of lipoic
acid in biological samples by gas chromatography with flame photometric detection." J Chromatogr 615(2): 197-202.
References
125
KATAOKA, H., HIRABAYASHI, N. and MAKITA, M. (1997). "Analysis of lipoic acid by gas chromatography with flame photometric detection." Methods Enzymol 279: 166-76.
KOCHI, H. and KIKUCHI, G. (1976). "Mechanism of reversible glycine cleavage
reaction in Arthrobacter globiformis. Function of lipoic acid in the cleavage and synthesis of blycine." Arch Biochem Biophys 173(1): 71-81.
KOIKE, M. and REED, L. J. (1960). "Alpha-keto acid dehydrogenation complexes.
II. The role of protein-bound lipoic acid and flavin adenine dinucleotide." J Biol Chem 235: 1931-8.
KÖNIG, W. A., Lutz, S., Evers, P. and KNABE, J. (1990). "Enantiomer separation of
chiral barbiturates and of α-lipoic acid by capillary gas chromatography with modified cyclodextrins as chiral stationary phases." J Chromatogr A 503: 256-259
KONISHI, T. and PACKER, L. (1999). "Determination of protein-bound lipoic acid
in tissues by the enzyme recycling method." Antioxidant Food Supplements in Human Health: 135-141.
KORICANAC, Z., CAKAR, M., TANASKOVIC, S., et al. (2007).
"Spectrophotometric determination of thioctic (a-lipoic) acid in water and pharmaceutical preparations." J Serb Chem Soc 72(1): 29-35.
KORKINA, L. G., AFANAS'EF, I. B. and DIPLOCK, A. T. (1993). "Antioxidant
therapy in children affected by irradiation from the Chernobyl nuclear accident." Bioch Soc Trans 21: 314S.
KOZMA-KOVACS, E., HALASZ, A., HAJOS, G., et al. (1991). "Estimation of
lipoic acid in brewers' yeast by thin-layer and capillary gas chromatographic methods." Acta Alimentaria 20: 151-162.
KUMARAN, S., PANNEERSELVAM, K. S., SHILA, S., et al. (2005). "Age-
associated deficit of mitochondrial oxidative phosphorylation in skeletal muscle: role of carnitine and lipoic acid." Mol Cell Biochem 280(1-2): 83-9.
MARSHALL, A. W., GRAUL, R. S., MORGAN, M. Y., et al. (1982). "Treatment of
alcohol-related liver disease with thioctic acid: a six month randomised double-blind trial." Gut 23(12): 1088-93.
MATSON, W. R., LANGLAIS, P., VOLICER, L., et al. (1984). "n-Electrode three-
dimensional liquid chormatography with electrochemical detection of neurotransmitters." Clin Chem 30: 1477-1488.
MATTULAT, A. and BALTES, W. (1992). "Determination of lipoic acid in meat of
commercial quality." Z Lebensm Unters Forsch 194(4): 326-9.

References
126
MCCORMICK, D. B. (2005). "Alpha Lipoic Acid/Thioctic acid." Encyclopedia of Dietary Supplements(1:1): 401-407.
MEISTER, A. (1989). "Metabolism and function of glutathione." General Review:
367-474. MILLER, J. C. and MILLER, J. N. (2002). The method of standard addition, in
statistics and chemometrices for analytical chemistry, Pearson Education Limited.
MIZUNO, M. and PACKER, L. (1994). "Effects of alpha-lipoic acid and
dihydrolipoic acid on expression of proto-oncogene c-fos." Biochem Biophys Res Commun 200(2): 1136-42.
MURRAY, M. (1996). Encyclopedia of Nutritional Supplements. Roclin, CA, Prima
Publishing: 343-346. NAKATA, T. (1962). "Determination of lipoic acid by using a ferrocyanide formation
reaction." BItamin 26: 213-216. NATRAJ, C. V., GANDHI, V. M. and MENON, K. K. G. (1984). "Lipoic acid and
diabetes: effect of dihydrolipoic acid administration in diabetic rats and rabbits." J Biosci (Benglore, India) 6(1): 37-46.
NAVARI-IZZO, F., QUARTACCI, M. F. and SGHERRI, C. (2002). "Lipoic acid: a
unique antioxidant in the detoxification of activated oxygen species." Plant Physiol Biochem 40(6-8): 463-470.
NIEBCH, G., BUCHELE, B., BLOME, J., et al. (1997). "Enantioselective high-
performance liquid chromatography assay of (+)R- and (-)S-alpha-lipoic acid in human plasma." Chirality 9(1): 32-6.
PACKER, L., WITT, E. H. and TRITSCHLER, H. J. (1995). "Alpha-Lipoic acid as a
biological antioxidant." Free Radic Biol Med 19(2): 227-50. PANAK, K. C., RUIZ, O. A., GIORGIERI, S. A., et al. (1996). "Direct determination
of glutathione in human blood by micellar electrokinetic chromatography: simultaneous determination of lipoamide and lipoic acid." Electrophoresis 17(10): 1613-6.
PATEL, M. S., ROCHE, T. E. and HARRIS, R. A. (1996). "Alpha-keto acid
dehydrogenase complexes." Molecular and cell biology updates, Birkhauser Verlag: 321.
PELLEY, J. W., LITTLE, G. H., LINN, T. C., et al. (1976). "Lipoamide
dehydrogenase in serum: a preliminary report." Clin Chem 22(2): 275-7.
References
127
PODDA, M., TRITSCHLER, H. J., ULRICH, H., et al. (1994). "Alpha-lipoic acid supplementation prevents symptoms of vitamin E deficiency." Biochem Biophys Res Commun 204(1): 98-104.
PRATT, K. J., CARLES, C., CARNE, T. J., et al. (1989). "Detection of bacterial
lipoic acid. A modified gas-chromatographic-mass-spectrometric procedure." Biochem J 258(3): 749-54.
RAMAKRISHNAN, N., WOLFE, W. W. and CATRAVAS, G. N. (1992).
"Radioprotection of hematopoietic tissues in mice by lipoic acid." Radiat Res 130(3): 360-5.
RECHE, P. and PERHAM, R. N. (1999). "Structure and selectivity in post-
translational modification: attaching the biotinyl-lysine and lipoyl-lysine swinging arms in multifunctional enzymes." EMBO J 18(10): 2673-82.
REED, L. J. (1953). "Metabolic functions of thiamine and lipoic acid." Physiol Rev
33(4): 544-59. REED, L. J. (1957). "The chemistry and function of lipoic acid." Adv Enzymol Relat
Subj Biochem 18: 319-47. REED, L. J. (1996). Chemistry and functions of lipoic acid. Comrehensive
Biochemistry. M. S. Florkin, E. H., New York, Elsevier Publishing Company. 14: 99-126.
REED, L. J., DE, B. B., GUNSALUS, I. C., et al. (1951). "Crystalline alpha-lipoic
acid; a catalytic agent associated with pyruvate dehydrogenase." Science 114(2952): 93-4.
REED, L. J., FERNANDEZ-MORAN, H., KOIKE, M., et al. (1964). "Electron
microscopic and biochemical studies of pyruvate dehydrogenase complex of Escherichia coli." Science 145: 930-2.
RICHTER, C., PARK, J. W. and AMES, B. N. (1988). "Normal oxidative damage to
mitochondrial and nuclear DNA is extensive." Proc Natl Acad Sci USA 85: 6465-6467.
SATOH, S., TOYO'OKA, T., FUKUSHIMA, T., et al. (2007). "Simultaneous
determination of alpha-lipoic acid and its reduced form by high-performance liquid chromatography with fluorescence detection." J Chromatogr B 854(1-2): 109-15.
SAVITHA, S. and PANNEERSELVAM, C. (2007). "Mitigation of age-dependent
oxidative damage to DNA in rat heart by carnitine and lipoic acid." Mech Ageing Dev 128(2): 206-12.
References
128
SCHMIDT, U., GRAFEN, P., ALTLAND, K., et al. (1969). "Biochemistry and chemistry of lipoic acids." Adv Enzymol Relat Areas Mol Biol 32: 423-69.
SEN, C. K., ROY, S., KHANNA, S., et al. (1999). "Determination of oxidized and
reduced lipoic acid using high-performance liquid chromatography and coulometric detection." Methods Enzymol 299: 239-46.
SHIH, J. C. and STEINSBERGER, S. C. (1981). "Determination of lipoic acid in
chick livers and chicken eggs during incubation." Anal Biochem 116(1): 65-8. SITTON, A., SCHMID, M. G., GUBITZ, G., et al. (2004). "Determination of lipoic
acid in dietary supplement preparations by capillary electrophoresis." J Biochem Biophys Methods 61(1-2): 119-24.
SNYDER, R. L., KIRKLAND, J. J. and GLAJCH, L. J. (1997). Practical HPLC
method development, John Wiley & Sons, Inc., pp 21-208. SUN, L. and CHEN, M. (2006). "Determination of α-lipoic acid in health food by
high-performance liquid chromatography." Shipin Gongye Keji 27(8): 178-179.
SUZUKI, K. and REED, L. J. (1963). "Lipoamidase." J Biol Chem 238: 4021-5. TEICHERT, J. and PREISS, R. (1992). "HPLC-methods for determination of lipoic
acid and its reduced form in human plasma." Int J Clin Pharmacol Ther Toxicol 30(11): 511-2.
TEICHERT, J. and PREISS, R. (1995). "Determination of lipoic acid in human
plasma by high-performance liquid chromatography with electrochemical detection." J Chromatogr B 672(2): 277-81.
TEICHERT, J. and PREISS, R. (1997). "High-performance liquid chromatography
methods for determination of lipoic and dihydrolipoic acid in human plasma." Methods Enzymol 279: 159-66.
TEICHERT, J. and PREISS, R. (2002). "High-performance liquid chromatographic
assay for alpha-lipoic acid and five of its metabolites in human plasma and urine." J Chromatogr B 769(2): 269-81.
THOMAS, J. A., CHAI, Y. C. and JUNG, C. H. (1994). "Protein S-thiolation and
dethiolation." Methods Enzymol 233: 385-389. TRIVEDI, R. K., KALLEM, R. R., MAMIDI, R. N., et al. (2004). "Determination of
lipoic acid in rat plasma by LC-MS/MS with electrospray ionization: assay development, validation and application to a pharmacokinetic study." Biomed Chromatogr 18(9): 681-6.
VIANEY-LIAUD, N., KOBREHEL, K., SAUVAIRE, Y., et al. (1994). "Lipoic Acid
in Wheat Grains." J Agric Food Chem 42(5): 1110-1114.
References
129
WAGH, S. S., NATRAJ, C. V. and MENON, K. K. G. (1987). "Mode of action of
lipoic acid in diabetes." J Biosci 11: 59-74. WHITE, R. H. (1980). "Stable isotope studies on the biosynthesis of lipoic acid in
Escherichia coli." Biochem 19(1): 15-9. WHITE, R. H. (1981). "A gas chromatographic method for the analysis of lipoic acid
in biological samples." Anal Biochem 110(1): 89-92. WHITE, R. H., BLEILE, D. M. and REED, L. J. (1980). "Lipoic acid content of
dihydrolipoyl transacylases determined by isotope dilution analysis." Biochem Biophys Res Commun 94(1): 78-84.
WITT, W. and RUSTOW, B. (1998). "Determination of lipoic acid by precolumn
derivatization with monobromobimane and reversed-phase high-performance liquid chromatography." J Chromatogr B 705(1): 127-31.
WOLFF, S. P., JIANG, Z. Y. and HUNT, J. V. (1991). "Protein glycation and
oxidative stress in diabetes mellitus and ageing." Free Rad Biol Med(10): 339-352.
ZIESKE, L. R. and DAVIS, L. (1983). "Decarboxylation of glycine by serine
hydroxymethyltransferase in the presence of lipoic acid." J Biol Chem 258(17): 10355-9.
ZIYATDINOVA, G. K., BUDNIKOV, G. K. and POGOREL'TSEV, V. I. (2004).
"Electrochemical Determination of Lipoic Acid." J Anal Chem 59(3): 288-290.

Curriculum vitae
130
Personal data:
Name: Arjumand Iqbal Durrani
Date and place of birth: 16.11.1980, Lahore, Pakistan
Marital state: Single
Academic title: Master of Philosophy (Chemistry)
Nationality: Pakistani
Education:
July 1984 - 1995 Higher Secondary School, Lahore Board
August 1995 - 1999 B.Sc (Major, Chemistry, Zoology and Botany)
Summer 1999 Diploma in Office Management
Dec 1999 - 2001 M.Sc in Applied Chemistry
October 2002 - 2004 M.Phil in Organic Chemistry
December 2004 onwards Ph. D in Food Chemistry
Job experiences:
October - November 2001 Honorary Vice-principle in a Secondary School
January - March 2002 Research Assistant in Chemistry Department,
UET, Lahore Pakistan
December 2003 - November 2004 Lecturer in Chemistry Department, UET, Lahore
Pakistan
Languages:
Urdu (Native speaker)
English (Fluent in writing and speaking)
Saraiki (Basics)
Punjabi (Basics)
German (Basics)
Interests:
Reading, writing, sight seeing, travelling, photography, cooking