determinants of productivity - iariw · determinants of productivity 3 1. introduction the ict and...
TRANSCRIPT

Determinants of Productivity
Michael Polder (Statistics Netherlands)
Hugo de Bondt (Statistics Netherlands)
George van Leeuwen (Statistics Netherlands)
Erik Veldhuizen (Statistics Netherlands)
Paper Prepared for the IARIW-UNSW Conference
on Productivity: Measurement, Drivers and Trends
Sydney, Australia, November 26-27, 2013
Session 7B: ICT and Productivity
Time: Wednesday, November 27, 1:30-3:00

Report
Determinants of productivity
Michael Polder
Hugo de Bondt
George van Leeuwen
Erik Veldhuizen
~paper prepared for the IARIW conference 2013, Sydney, Australia ~
PRELIMINARY PLEASE DO NOT QUOTE

project number
remarks
211096
31 Augustus 2013
The views expressed in this paper are those of the author and do not necessarily reflect the
policies of Statistics Netherlands.

Determinants of productivity 3
1. Introduction
The ICT and Economic Growth project (commissioned by the Dutch Ministry of
Economic Affairs, Innovation, and Agriculture, and carried out by Statistics
Netherlands) aims to shed light on the determinants of economic growth in the
Netherlands. The main research question is to investigate which components of
economic growth are most important. Special attention is given to the role of
Information and Communication Technology (ICT), in line with a substantial body
of empirical evidence that ICT related factors are the main explanation of the gap
between US and EU productivity performance. Moreover, we aim to investigate
how different components are related. Again, there is special interest in the
indirect effect of ICT on productivity via its impact on other factors, in line with its
nature of General Purpose Technology (GPT). ICT does not only contribute directly
to a firm’s production as a part of the firm’s capital stock, it also affects for example
the innovative capacity of a firm and its flexibility to adjust to economic shocks.
Moreover, there is increasing evidence on the need to complement ICT investment
with for example organizational changes, and appropriate skills.
Past economic growth is key to the material well-being of people today. Economic
growth, usually measured by growth in the gross domestic product, is therefore the
focal point of economic policy, and accordingly, research about its determinants is
vast and has a long history. Mathematically, growth in the volume of total
production – which is how GDP growth can be interpreted – can be decomposed
into two components, namely growth in labour, and the productivity of labour. In
the face of ageing populations and increasing (international) competition, the latter
component has gained crucial importance, and policy interest centers around it
(e.g. Gelauff et al. 2004, and as exemplified by the Lisbon Agenda). Although the
title of the project refers to economic growth, we will therefore in fact be focussing
mostly on productivity, following also the lion’s share of the literature on this topic.
Labour productivity itself can be attributed to increases in capital intensity, as well
as to the efficiency in which capital and labour are combined in the production
process, referred to as total factor or, more modestly, multifactor productivity.
Both sources will be discussed.
The current paper has three purposes. Firstly, we sketch a simple framework, that
illustrates the measurement of productivity and highlights differences between
two main approaches, namely production function estimation, and growth
accounting. Given this framework it is also possible to point out where different
subthemes fit into the total picture, and what is their mutual relation. Secondly,
based on our reading of the literature, we discuss the main determinants of
productivity growth, which are divided into three main categories. We also discuss
main empirical findings from the literature. Given the sheer volume of research on

Determinants of productivity 4
this topic, it is necessary to be somewhat selective here, and we follow topics set
out in leading existing overviews of related literature. Finally, we present a
preliminary analysis of productivity growth in the Dutch business sector, based on
industry data from the Dutch growth accounts. This empirical analysis extends the
basic framework by considering heterogeneity in factors of production factors, and
also introduces new variables that follow from our literature review.
Determinants of productivity 5
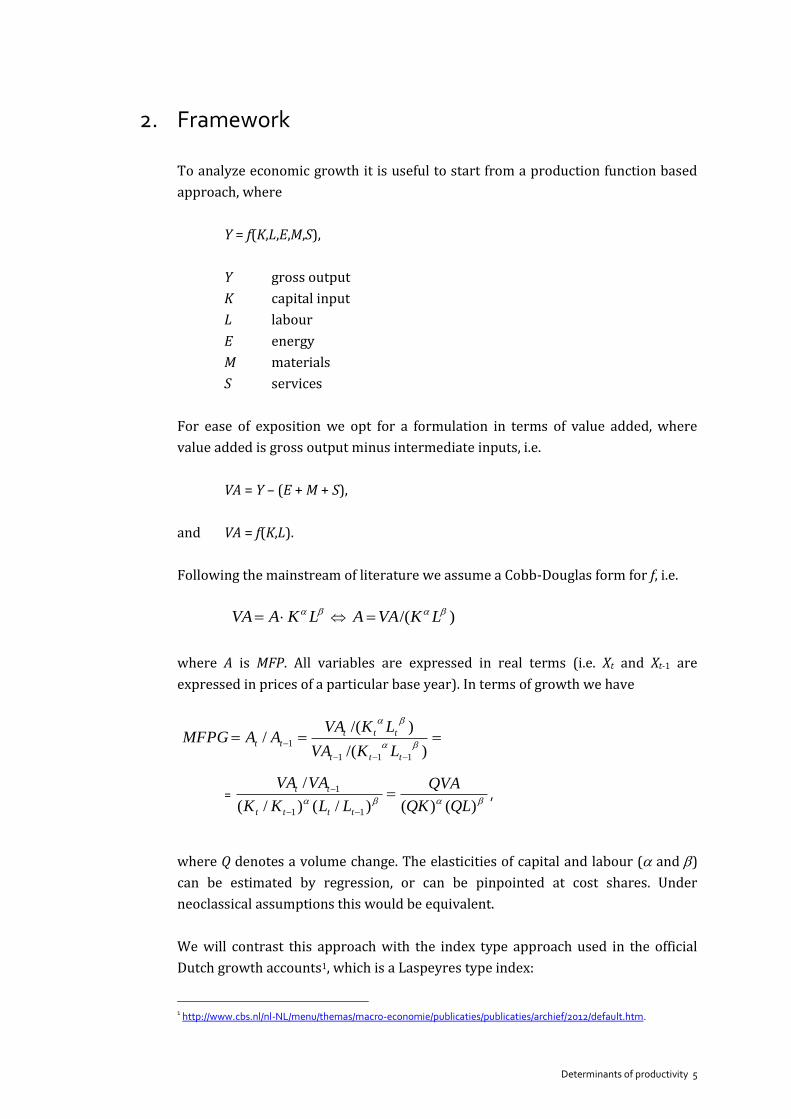
2. Framework
To analyze economic growth it is useful to start from a production function based
approach, where
Y = f(K,L,E,M,S),
Y gross output
K capital input
L labour
E energy
M materials
S services
For ease of exposition we opt for a formulation in terms of value added, where
value added is gross output minus intermediate inputs, i.e.
VA = Y – (E + M + S),
and VA = f(K,L).
Following the mainstream of literature we assume a Cobb-Douglas form for f, i.e.
LKAVA )/( LKVAA
where A is MFP. All variables are expressed in real terms (i.e. Xt and Xt-1 are
expressed in prices of a particular base year). In terms of growth we have
)/(
)/(/
111
1
ttt
ttttt
LKVA
LKVAAAMFPG
= )()()/()/(
/
11
1
QLQK
QVA
LLKK
VAVA
tttt
tt
,
where Q denotes a volume change. The elasticities of capital and labour ( and )
can be estimated by regression, or can be pinpointed at cost shares. Under
neoclassical assumptions this would be equivalent.
We will contrast this approach with the index type approach used in the official
Dutch growth accounts1, which is a Laspeyres type index:
1 http://www.cbs.nl/nl-NL/menu/themas/macro-economie/publicaties/publicaties/archief/2012/default.htm.
Determinants of productivity 6
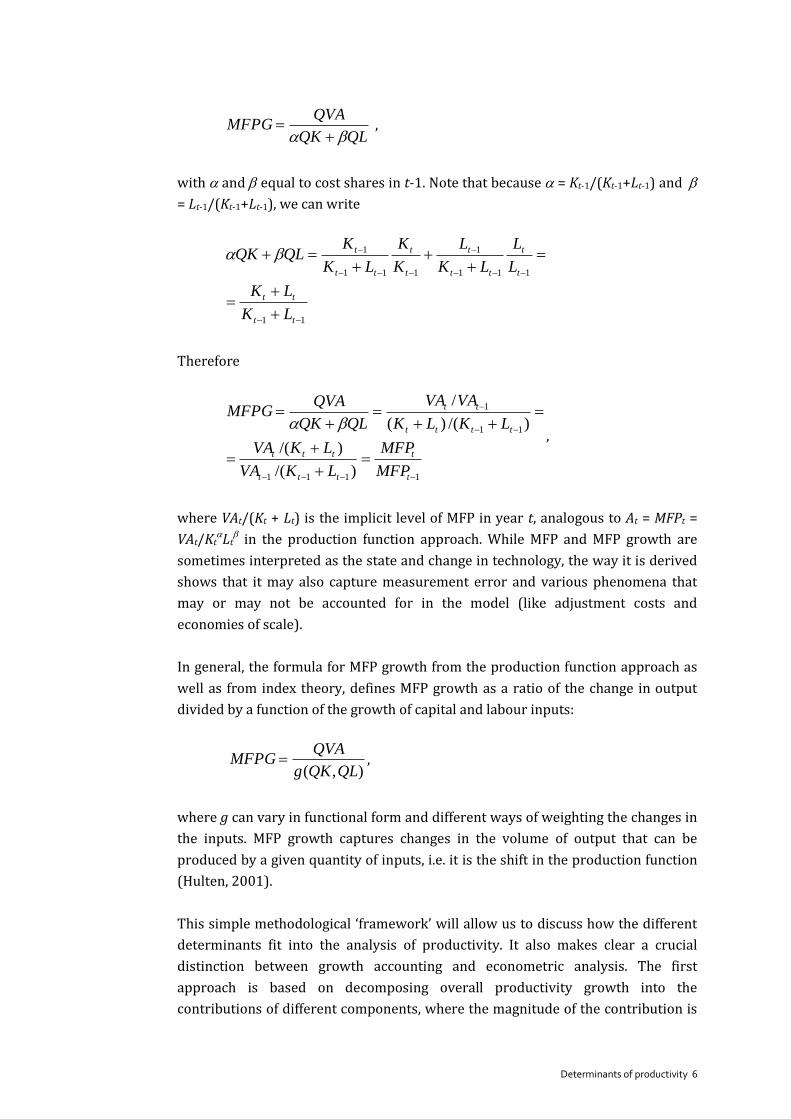
QLQK
QVAMFPG
,
with and equal to cost shares in t-1. Note that because = Kt-1/(Kt-1+Lt-1) and
= Lt-1/(Kt-1+Lt-1), we can write
11
111
1
111
1
tt
tt
t
t
tt
t
t
t
tt
t
LK
LK
L
L
LK
L
K
K
LK
KQLQK
Therefore
1111
11
1
)/(
)/(
)/()(
/
t
t
ttt
ttt
tttt
tt
MFP
MFP
LKVA
LKVA
LKLK
VAVA
QLQK
QVAMFPG
,
where VAt/(Kt + Lt) is the implicit level of MFP in year t, analogous to At = MFPt =
VAt/KtLt
in the production function approach. While MFP and MFP growth are
sometimes interpreted as the state and change in technology, the way it is derived
shows that it may also capture measurement error and various phenomena that
may or may not be accounted for in the model (like adjustment costs and
economies of scale).
In general, the formula for MFP growth from the production function approach as
well as from index theory, defines MFP growth as a ratio of the change in output
divided by a function of the growth of capital and labour inputs:
),( QLQKg
QVAMFPG ,
where g can vary in functional form and different ways of weighting the changes in
the inputs. MFP growth captures changes in the volume of output that can be
produced by a given quantity of inputs, i.e. it is the shift in the production function
(Hulten, 2001).
This simple methodological ‘framework’ will allow us to discuss how the different
determinants fit into the analysis of productivity. It also makes clear a crucial
distinction between growth accounting and econometric analysis. The first
approach is based on decomposing overall productivity growth into the
contributions of different components, where the magnitude of the contribution is

Determinants of productivity 7
crucially determined by the share of the component relative to other components.
In contrast, econometric analysis is about the determination of correlations and
causal effects of the determinants with productivity. If we view the firm’s
productivity level as a draw from a probability distribution (reflecting that there
are many unobserved factors), these determinants can be thought to increase or
decrease the probability of a positive draw for a firm (Syverson, 2011). Needless to
say, both approaches have pros and cons, and it is the research question at hand
that determines the most appropriate route.
An additional note is in place with respect to the analysis of complementarities.
There is a growing body of evidence that, especially in the area of intangible capital,
there are significant complementarities among factors of production. It is
increasingly recognized that in order to increase performance, firms should invest
simultaneous in multiple, complementary strategies. Especially Milgrom and
Roberts (1990, 1995) are credited with this insight. The idea is that for a particular
investment to yield, it is necessary for a firm to also make other adjustments. For
example, if a firm invests in ICT, it benefits from the introduction of according
changes in the organization that on the one hand help ICT to be more productive,
and on the other hand need ICT to be effective. Such complementarities can be
addressed and analysed quite straightforwardly in the framework proposed,
through the introduction of cross-terms into the production function. For example,
if two types of capital K1 and K2 are (expected to be) complementary:
i
iii
ii KKLKcVA 21 logloglogloglog
It is worthwhile to note that specifying the production function in this way, the
marginal effects of the complementary factors are a function of each other. In the
example,
211 loglog/log KKVA
Thus, the direct effect of K1 is increased or mediated by K2. If 1 and have opposite
signs, it is possible to identify a non-linear effect, for example if 1 > 0 and < 0, the
effect of K1 is positive as long as log K2 < 1/.
The growth accounting approach does not allow for an easy incorporation of
complementarities, but one can test if differences in productivity growth can be
explained by them by first determining MFP growth, and subsequently relating this
to the cross-term(s) of possible complementary factors. In the example:
21 loglog KKMFPG .

Determinants of productivity 8
3. Overview of determinants found in literature
Based on our reading of the literature we will distinguish between three broad
categories of determinants of economic/productivity growth:
1. input variables in the production process of a firm;
2. the business environment of a firm;
3. firm and industry dynamics underlying aggregate growth.
For each group we discuss the relevant determinants, the role of ICT, and the way
to analyse the determinants within the model discussed above. Moreover, we point
out where the analysis of the various determinants fits into the suggested
methodological framework.
3.1. Input variables in the production process of a firm
The first group can essentially be characterized as variables over which the firm
has control, i.e. they are the firms choice variables (sometimes called decision or
control variables). Within this group we distinguish between capital and labour, as
in the production function and index approach to measuring productivity. The
main issue here is to distinguish between different types of capital and labour. In
addition, one can distinguish a third input into the production process, which is
knowledge. This can be partly embodied in tangible capital or in labour, but can
also be the knowledge of an innovative way of producing, process, organizing or
marketing a firm’s product, which is difficult to attribute to one of the primary
factors of production, and hence constitutes a factor of production in itself.
3.1.A. Capital inputs
3.1.A.1. Description
For capital, an important distinction is that between ICT-capital and non-ICT
capital. ICT-capital can at its turn be subdivided in computers, software, databases,
and telecom equipment, and various forms of ICT usage. Non-ICT capital is an
aggregate of buildings, structures, and non-ICT equipment.
3.1.A.2. Role of ICT
Evidently, the role of ICT is clearly ICT itself as a form of capital. By distinguishing
between ICT and non-ICT capital it is recognized that ICT may be a special part of
capital that has different features from other types of tangible capital.
3.1.A.3. Heterogeneous capital in the model
The refinement of capital can be seen in the framework presented as the
introduction of various types of capital instead of a homogeneous factor of
Determinants of productivity 9
production. That is, one introduces a vector of inputs K = (K1, K2, …., Km). For each of
these separate inputs one can estimate its contribution to productivity growth
and/or its elasticity.
3.1.B. Labour inputs
For labour, it is possible to make distinctions in the quality of workers, for example
concerning education, tenure, and age. It can be hypothesized that workers with
higher skills contribute more to productivity, even after controlling for a higher
compensation.
3.1.B.1. Role of ICT
There is evidence that the quality of labour and technology are complementary.
Such complementarity also holds for ICT and skills. Thus, ICT may be used more
effectively by a skilled worker compared to an unskilled worker, and vice versa, a
skilled worker is more effective when she avails over ICT.
3.1.B.2. Heterogeneous labour in the model
The refinement of labour can be seen as the introduction of various types labour,
that is one introduces vectors of inputs L = (L1, L2, …., Lm). For each of these
separate types one can estimate its contribution to productivity growth and/or its
elasticity. Alternatively, in the growth accounting framework, a possibility is to use
a quality-adjusted price index for labour cost, thereby adjusting the labour input L,
taking into the quality of labour in determining the contribution of labour to
productivity growth.
3.1.C. Knowledge and innovation
It is also recognized in much of the literature that knowledge production can be
seen as a productive asset for the firm. Knowledge creation includes human capital
in the form of education and training, research, market development and
organizational and managerial efficiency, see, Corrado, Haskel, Jona-Lasinio and
Iommi (2012). The latter study recognizes this as the area where Europe and the
US “arguably have their greatest comparative advantage”. In fact, knowledge
generation should be seen as a form of capital, in the sense that firms invest in the
generation of knowledge, and build up a stock of knowledge that can thought to
have similar features as tangible capital. A widely adopted model in this respect is
that of Corrado, Hulten, and Sichel (2005), who capitalize intangible capital,
distinguishing between knowledge in computerized information, about economic
competencies, and firm-specific human capital in a growth accounting framework.
Computerized information here includes software and databases, as discussed
under ICT capital. The Dutch growth accounts includes these categories as part of
the so-called Knowledge module.

Determinants of productivity 10
Within the recent academic and policy debate there is also much attention for the
phenomenon of so-called ‘Big Data’. The OECD recognizes the “(…) explosive
growth of “big data” and the economic value it generates” as a priority on the
future research agenda. As is it goes with new phenomena, the notion of big data
does not yet seem to be clearly defined, however. Broadly, it comprises investment
in large databases, the ability to analyze these data, and to put this to use in the
creation of business value. The empirical material is yet scarce, and statistical
agencies do not gather information on this. Brynjolfsson et al. (2011) report that
firms that use data-driven decision making (which entails the use of Enterprise
Resource Planning, Supply Chain Management, and Customer Resource
Management, in combination with the use Business Intelligence Systems), have
about 5% higher productivity compared to other firms with similar ICT
endowments.
In other studies using production functions, different variables related to the
knowledge production of firms are often used to parameterize MFP (i.e. A) to
explain differences in productivity (growth). Examples are R&D and innovation,
where one can distinguish further between different types of innovation, e.g.
technological and non-technological innovation. Measurement of innovation,
however, is tricky, and studies usually rely on subjective firm-level surveys or
patent information. Especially non-technological innovation, including different
types of organizational and management practices, is hard to measure, although
there is evidence that especially these types of investment makes or breaks
successful enterprises (Bloom et al. 2012).
Finally, knowledge embedded in the firm’s workers is of course an important
factor, and is often captured in for example the share of workers with higher
education. One can argue whether this is part of knowledge capital or whether it
should be seen as a refinement of the firm’s labour input. A useful distinction could
be the difference between the (prior) education of workers, and the investment in
training of a firm, which often has a firm-specific nature. In particular, it is possible
to distinguish between different types of training, for example the investments in
ICT-related training.
There is a range of policy issues around knowledge based capital, see OECD (2012).
Such framework policies include tax environment, competition policy, education
and training, intellectual property laws and enforcement, as well as policies that
affect financing, and that deal with data security.
3.1.C.1. Role of ICT
The role of ICT in knowledge is partly that the intangible aspects of ICT are
capitalized rather than expensed in the CHS framework. Moreover, as with skills,
ICT is arguably complementary to many forms of knowledge. In particular, ICT and

Determinants of productivity 11
organizational change are found to be complementary in micro-studies (see e.g.
Brynjolfsson and Saunders, 2010, for an overview). ICT helps in reorganizing a
firm, while creating business value from ICT investment requires organizational
change. Moreover, developments in ICT such as the online purchasing of products,
has increased the value of knowledge based assets, in particular brand equity and
reputation, which is about the image and trustworthiness of the selling party.
Finally, ICT is seen as enabling technology that helps in the generation and sharing
of knowledge. Thus, ICT enables innovation (see e.g. Spiezia, 2011), and helps in
the diffusion of it.
3.1.C.2. Knowledge in the model
Specifying knowledge generation as inputs into the production function, can be
done in various ways. Firstly, one can parameterize observed productivity
differences or growth as a function of knowledge variables, as for example in the
work by Griliches (1978) on R&D, and Crépon et al. (1998) on R&D and product
innovation,
LKAVA
)(KNOWfAMFP
One can substitute A for f() and estimate the contribution of knowledge directly, or
one can first estimate a standard production function, and relate knowledge to the
residual in a second step. Complementarities may again be analyzed by adding
cross-terms. A potential candidate for complementary variables is human capital.
Moreover, different types of knowledge may be mutually complementary, for
example combinations of innovation, types of ICT, and firm-specific human capital
are worthwhile exploring.
The enabling effect of ICT may be captured further by adding an additional
equation that determines knowledge as a function of ICT:
)(ICTfKNOW In a more growth accounting oriented framework, knowledge is capitalized and
added to the capital services used by firms. Essentially it then becomes part of the
vector of capital inputs K = (K1, K2, …., Km). In this operation, output and the use of
intermediate goods need to be adjusted, because one should take into account the
knowledge production as a type of output, and in addition knowledge investments
are typically included in categories of intermediate inputs (for example, cost of
training is counted under services). Such a framework is sketched in the Corrado,
Hulten, and Sichel papers, and implemented in for example the Knowledge module
in the Dutch growth accounts.

Determinants of productivity 12
3.2. The business environment of a firm
A firm operates in an environment that influences its behaviour. Syverson (2011)
calls this the external drivers of productivity. Based on our reading of the literature
and Syverson’s overview the most prominent environmental factors seem to be the
regulatory, policy and institutional environment, competition in product markets,
and (knowledge) spillovers and externalities. Environmental factors determine to a
large extent the responsiveness of market shares to exogenous shocks, and the
process of entry and exit. By nature, they are the drivers of productivity that are
most strongly linked to policy instruments, in the sense that they can be levers for
policy makers to influence productivity growth. Again we discuss various
determinants under these groups, the role of and relation to ICT, and finally ways
to analyse these determinants in the framework.
3.2.A. Regulatory, policy, and institutional environment
A firm operates within a set of rules posed by national laws. For example, a firm’s
labour policy is subject to labour market regulation (LMR), the market in which it
operates may be subject to (product market) regulation (PMR), and its production
process may be subject to certain environmental regulations. These conditions
determine to a large extent the actions of a firm.
Moreover, in order to be able to produce effectively, flexible access to inputs is also
vital for firms. This flexibility is partly governed by the regulatory forces discussed
above, but institutional features like the role of unions, the structure of the
financial sector, as well as labour market conditions are crucial. For example, a
shortage in the labour market of qualified labour is detrimental for growth. Also if
access to finance is restricted, businesses are hampered in realizing their
investment opportunities.
3.2.A.1. Relation to ICT
In general, strict regulations can be seen as hampering the flexibility of firms, and
are therefore bad for productivity. ICT, on the other hand, makes firms more
flexible. Thus, one can argue that firms that rely more on ICT, can easier cope with
changes in the regulatory environment. Reversely, however, it can argued that
under a strict labour market policy, firms adopt a careful hiring policy. This could
hamper investing in ICT (or other forms of capital) if such investments require
complementary hiring of employees with ICT skills (see e.g. Bartelsman et al.
2011).
3.2.A.2. Analysis of regulatory, policy, and institutional environment in the model
Assessing the effect of regulations requires variation in the regulatory environment
for identification. Given that such regulations are often country specific, this
usually requires cross-country data, or longer time-series that capture changes in
regulation over time. For example, one can estimate the productivity within
Determinants of productivity 13
countries by applying a harmonized approach (as the framework above), and
compare productivities for countries with different degrees of regulation. Or one
can assess changes in productivity following a particular change in regulation
within a country (for example, the deregulation of an industry, see e.g. Olley and
Pakes, 1996). Also, one can compare the effects on productivity for other
determinants conditional on the regulatory environment. For example, a study by
the London School of Economics (Van Reenen et al. 2010) shows that the positive
effect of ICT on productivity is tempered by the existence of strong LMRs and
PMRs, both via a smaller positive effect on productivity at individual firm
performance, as well as the fact that less productive firms are replaced at a slower
pace.
3.2.B. Competition in the product market
Competition can arise from potential entry, price competition among incumbents
on the national market, as well as from trade-induced pressures. It affects
productivity in (at least) two ways. Firstly, it weeds out bad performing firms
because the market will punish inefficiency (see e.g. Boone, 2000). The resulting
dynamics is an important determinant of productivity, and will be discussed
separately below under 3.3.B. Secondly, competition forces firms to become more
productive in order to survive or gain market share. Too much competition,
however, is not always good, as pointed out by e.g. Aghion et al. (2005). There may
be a turning point in the effect of increasing competition, where firms under too
much competitive pressure do not have the possibility to invest in productivity
enhancing innovation anymore. It is a challenge for policy to find out a balance
between competition, and for example the protection of property rights.
3.2.B.1. Role of ICT in competition
ICT has changed the nature of competition in recent years (Brynjolfsson en
Saunders, 2010). ICT affects the way firms produce, how they gather information
and communicate with customers, suppliers, and competitors. Firms that use ICT
effectively can escape competition and achieve higher profitability, because of
more efficient production, increased ability to collect information on market
developments and flexibility to react to these market developments. Brynjolfsson
et al. (2009) present evidence for a larger spread of productivity in ICT intensive
sectors. On the other hand, in ICT intensive sectors as retail trade and business
consultancy start-up costs are low, which increases competition. Thus, ICT and
competition are important determinants of productivity, but the relation between
them is complex.
Another aspect is competition in the digital economy. This has very specific
features, which play at different market levels (Veugelers, 2012). Because network
effects and economies of scale play a big role in markets for information products,
Determinants of productivity 14
it is for example difficult to draw a line between allowing for standardization and
the prevention of anti-competitive behaviour. Moreover, because there is a need
for products to be compatible, firms engage in collaboration, which is good for
knowledge sharing, but also holds a risk of collusive behaviour.
3.2.B.2. Analysis of competition in the model
The effect of competition on productivity of incumbents can be analyzed by adding
competition as an additional explanatory variable in the regression framework, as
in Nickell (1996). There are a variety of candidates that may serve as indicators for
competition, see Boone et al. (2007), and Polder et al. (2010), all of which may have
their advantages and disadvantages in different contexts. One can also think of
interacting the competition variable with other variables to see if the effects of
other variables differ with the strength of competition. For example, Van Der Wiel
et al. (2008) investigate the speed of convergence to the global and national
frontier, depending on the degree of competition. Finally, given the endogenous
nature of competition, researchers sometimes rely on changes in regulations (see
3.1.A) as instruments.
Competition is also by nature the force that drives the business dynamics that will
be described in 3.3.B, and thereby also contributes to aggregate productivity via
this route. To investigate the role of competition in this process, it is possible to
analyse such dynamics under various regimes of competition, for example by
comparing industries or countries, or within a particular aggregate before and after
an identified change in competition policy.
3.2.C. Spillovers and externalities
A firm’s productivity level can also be affected by other firm’s production practices.
Such spillovers and externalities are closely linked to the knowledge-based
determinants under 3.1.C. The fact that knowledge is to a certain degree not
appropriable, suggests there must be knowledge spillovers between firms. That is,
firms may learn from other firms with respect to best-practice technology/ICT use
and R&D. Moreover, there may be network effects from the use of technology, that
is the value of using technology increases if other firms use it as well. Thus,
spillovers are more related to knowledge (e.g. R&D), and network externalities are
more related to the use of ICT (e.g. enterprise systems for intra-firm linkages).
This feature of ‘knowledge-based capital’ raises interesting policy issues, in that
firms should have the incentive to invest in knowledge/ICT even if some of its
value spills over to other firms. Finally, not all sorts of knowledge are subject to
spillovers, for example brand equity and firm-specific human capital are highly
excludable and non-rivalry (OECD, 2012).
Determinants of productivity 15
3.2.C.1. Relation to ICT
There are various roles of ICT within this context. Firstly, ICT allows firms to gather
information more easily and faster, so that it may be hypothesized that ICT using
firms will benefit more from possible spillovers. Moreover, the use of ICT itself, like
for example different types of e-business systems and e-commerce, may be subject
to network effects, in the sense that the value of ICT increases if for example the
firm’s suppliers and customers also use ICT.
3.2.C.2. Analysis of spillovers in the model
A simple way to test for the presence of spillovers, is to add a measure for these
spillovers in the production function, i.e. the productivity term A in the framework
above is parameterized by a spillover variable. Naturally, the measurement of
spillovers is a lot harder. Learning from best-practice is usually capture by a so-
called distance-to-frontier (DTF), which measures the difference between a firm’s
productivity to the front-runner’s productivity, see e.g. Bartelsman et al. (2006). It
is possible to distinguish between different frontiers: for example the global and
national frontier, or a firm may learn from firms inside and outside its market, or
from firms and institutes (e.g. universities) close to its geographical location.
Spillovers from R&D can be captured by including aggregate R&D of other firms in
the same market. Similarly, network effects from ICT are sometimes captured as
the (aggregate) use/adoption of a particular type of ICT by other firms. While such
analyses can produce results that are indicative for spillovers and positive
externalities, the question of the nature of knowledge diffusion, and how learning
by firms actually takes place, is not addressed.
3.3. Firm and industry dynamics underlying aggregate growth
Besides variables that impact the performance of firms directly, aggregate growth
is also determined by the dynamics of its composing parts. Changes at the
aggregate level can be decomposed into changes at the underlying levels.
3.3.A. Economic growth and industry growth
The gross domestic product (GDP) is the sum of the production (in value added) of
all industries, and economic growth of a country (in terms of GDP growth) is
determined by the economic growth of the underlying industries. Moreover, the
size of an industry determines its weight in overall economic growth, and changes
in the shares of industries are therefore also reflected in changes in aggregate
growth. This phenomenon can be shown by a so-called shift-share analysis (see e.g.
Van Ark, 2001) that splits the growth of the aggregate into a part relating to growth
of the constituting parts, and a part related to changes in the relative size of these.

Determinants of productivity 16
3.3.A.1. The role of ICT
The role of ICT in a study of industry dynamics can be twofold. Firstly, production
may shift towards or away from to the ICT production industry. Secondly, ICT using
industries may display a higher productivity growth than other industries, and, in
addition or by consequence, may also be more successful in creating new jobs.
Growth accounting studies by Van Ark, Jorgenson and others have shown that is an
important explanation of the US-EU productivity gap.
3.3.A.2. Shift-share analysis in the model
In the notation of our model, let aggregate productivity be denoted by P, and the
share of industry j as Sj. Then, a shift-share analysis could look like
j
jttj
j
jtjtt SPSPP 1,
,
where the first part of the decomposition relates to changes in the industries’
productivities (‘intra-effect’), and the second part relates to changes in the relative
size of industries (‘shift effect’). Many refinements can be made to this
decomposition, that enhance the interpretation. The purpose here is to show the
basic principle, and how it fits the productivity framework. Finally, it is possible to
distinguish different groups of industries, for example ICT producing, ICT intensive,
and non-ICT intensive industries (see the contribution of Veldhuizen en
Wittekoek). Note that Pt = Pt – Pt-1. For relative productivity changes Pt/Pt-1 it is
possible to take logs and proceed in the same way.
3.3.B. Industry growth and business dynamics
In a similar vein as above, industry dynamics itself can be decomposed into
dynamics at the firm-level. In this case, firms grow or shrink just like industries do,
but one must also take into account the contribution of attrition and new entry. A
recurrent finding in the empirical literature is that these business dynamics,
especially the process of reallocation where production factors are reallocated
from less productive to more productive firms, are a major source of aggregate
productivity growth (Bartelsman and Doms, 2001, Foster et al. 2002).
3.3.B.1. The role of ICT
Again ICT could increase the flexibility of firms, and therefore their ability to cope
with economic shocks, which increases relative productivity and chances of
survival. Thus, ICT can be an important determinant of the process of reallocation
and exit. This is also related to the competition story above: competition moves
market share toward more efficient producers, thereby increasing overall
productivity.
Determinants of productivity 17
In markets where the use of ICT is intensive, it is also found that there is a higher
amount of turmoil: the productivity spread is higher and there is a higher turnover
of firms in terms of entry and exit (OECD, 2012). Thus, ICT intensive are more
risky, but in the end aggregate productivity will be higher as high-productivity
firms survive and low-productivity firms get replaced by innovative and more
productive new entrants.
3.3.B.2. Analysis of firm-level dynamics in the framework
In line with our previous notation, let Pj again denote industry productivity, and si
the relative size of a firm i in industry j. Then a general decomposition into the
contribution of continuing firms, and entry and exit, is
Xi
titi
Ci
titi
Ci
itit
Ni
ititj PsPsPsPsP 1,1,1,1,
where N, C, and X are respectively the population of entrants, continuing and
exiting firms in year t. Various ways have been proposed to further decompose the
contribution of continuing firms C, which depends on an intra-firm and shift effect
analogous to the industry case above, see Balk and Hoogenboom (2003). Specific
examples of decompositions are Baily, Hulten, and Campbell (1992), Olley and
Pakes (1996), and Petrin and Levinsohn (2003).
Determinants of productivity 18
4. Main findings from the empirical literature
4.1.1. ICT capital
In the empirical macro-literature, a common finding is that the United States has
seen a higher productivity growth over roughly the last two decades than most
other countries, in particular when compared to the European Union (Van Ark et al.
2008). While institutional differences, like more flexible labour market regulations,
and a higher degree of market competition may be part of the underlying factors
explaining these differences, there seems to be a prevalent additional explanation
to this phenomenon. International benchmarking exercises in growth accounting
suggest that the rise of the knowledge economy is the most important explanatory
factor in explaining the US-EU differences. In particular, as demonstrated by
Jorgenson et al. (2008), the surge in productivity in the second half of the 1990s
was driven by the high performance of the IT producing sectors, whereas after the
beginning of the new century or so, aggregate productivity growth was determined
mostly by the growth in heavy IT-using such as retail, trade and financial services.
Jorgenson et al. conclude that the developments in the IT sectors and investments
in IT enabled these sectors to create strongly innovative business processes. These
insights by now have led to the consensus that the familiar Solow ‘productivity
paradox’ has been solved. Industry data have also been used for regression based
analysis. However, identification of an effect of ICT on MFP growth is difficult,
especially when attempting to control for unobserved effects and endogeneity,
suggesting the level of aggregation is not suitable for a causality analysis (Stiroh,
2004, Draca et al. 2006).
Although the growth accounting literature has presented convincing evidence on
the role of IT in explaining productivity growth, there are several caveats. First of
all, as noted by Brynjolfsson and Saunders (2010), these macro-economic trends
do not explain why there is such a high degree of firm heterogeneity within
countries. In particular, the advent of new forms of information and
communication technology seems to have increased this heterogeneity in
performance, even among firms which do not differ in their way of ‘doing’ IT.
Secondly, growth accounting, by definition, is about decomposing high-level
developments into components. Although it has proven to be a powerful and
insightful tool, its results do not necessarily imply causality. To unravel the causal
relations between productivity growth and its potential drivers, one may resort to
econometric techniques, and in light of the heterogeneity mentioned above, many
studies have shifted the focus to firm-level data.
In a much quoted study, Brynjolfsson and Hitt (2000) point out that the business
value of IT is largely determined by how it is used. Especially complementary
organizational changes (business processes, work practices) can be seen as a
Determinants of productivity 19
source of productivity growth. In turn, these changes also enable firms to develop
new or improved products and services. Investment in IT complements changes in
other aspects of the organization. For example, an important aspect of IT is that it
reduces communication costs and facilitates monitoring. Internally, the use of IT
can therefore lead to more efficient decision making, and a flatter, decentralized
organization structure with higher worker responsibility. Moreover, with respect
to a firm’s external relations of the firm, IT reduces the benefits to vertical
integration and creates the opportunity to rely on (specialized) outside suppliers.
Finally, IT allows to reorganize the production structure to increase consumer
benefits in terms of for example timeliness, customization, and offering new
complementary services. Empirical evidence for existence of complementarities
between workplace practices, organizational change and ICT is documented in a
vast literature consisting of case studies as well firm-level econometric work.
Examples include Ichinowski et al. (1997), Black and Lynch (2001), Crespi et al.
(2007), and Bloom et al. (2012).
4.1.2. Human capital
Sianesi and Van Reenen (2003) present an extensive survey of the role of human
capital in growth. They conclude there is substantial evidence for a positive effect
of human capital on productivity. However, they find that, in contract to early
endogenous growth models, the return to education diminishes over time. In
addition, complementarities play an important role with human capital. Because of
a higher skilled staff, a firm is able to invest in R&D and knowledge intensive
capital. Caroli and Van Reenen (2001) find the organizational change has a higher
impact on productivity in firms with more skilled workers. Moreover, they find that
the complementarity between ICT and organizational innovation disappears when
skills are taken into account. Bartel et al. (2007) find that firms increase their
demand for skilled workers when investing in ICT, which is in line with the overall
evidence on skill-biased technological change. Arvanitis (2005) present results for
Switzerland, finding that human capital and ICT contribute positively to
productivity, and also finds evidence for complementarity. However, there is no
evidence for complementarity with organizational change. This study also provides
a summary of various articles looking at the productivity effects of human capital,
organizational change, and ICT, showing that results vary per setting. Finally,
preliminary results in Hagsten and Sabadash (2012) present cross-country micro-
level evidence from the ESSLimit project supporting the view that human capital
complements ICT, especially education with a technical background (loosely
referred to by them as IT-related human capital).
4.1.3. Knowledge
Based on the framework by Corrado, Hulten and Sichel (CHS), the contribution of
knowledge based capital has been quantified in various countries. In the US, 27% of
labour productivity can be attributed to investments in the knowledge capital

Determinants of productivity 20
categories distinguished in the CHS framework, while in Europe this amounts to 20
to 25% on average (with 22% in the Netherlands, see Corrado et al. 2012). A larger
share is still due to MFP growth, namely about 30% in the US, and on average 42%
in Europe (43% in the Netherlands).
Since studies highlighting the effects of organizational capital and its
complementary nature to ICT and human capital have already been discussed
above, we focus here mainly on micro-level studies of innovation here. The
working horse model of the micro-economic literature on the productivity effects
of innovation is the so-called CDM model, after Crépon, Duguet and Mairesse
(1998). This model consists of three equations, where it is assumed that firms
invest in R&D, which leads to innovation via a so-called knowledge production
function (Griliches and Pakes, 1984). Ultimately, this knowledge feeds into the
production function a separate production function. Accounting for selectivity
issues arising from the fact that not every firm invests in R&D, and the endogeneity
issues around R&D and innovation, Crépon et al. find a significant effect of product
innovation on productivity. Many studies have performed analyses in the spirit of
the CDM model, and have collaborated the results, see e.g. Klomp and Van Leeuwen
(2006) for the Netherlands and Lööf and Heshmati (2006) for Sweden. Griffith et
al. (2006) have extended the knowledge production function to include product
and process innovation, but find that process innovation has a smaller impact on
productivity.
In a study for the Netherlands, Polder et al. (2010) present evidence that both R&D
and ICT lead to innovation. R&D is important for innovation in manufacturing, but
not in services. The study distinguishes between product, process, and
organizational innovation, and finds strong evidence that organizational innovation
has the strongest productivity effects. Product and process innovation contribute
to a higher productivity but only in combination with organizational innovation,
which can be interpreted as evidence for complementarity.
Finally, it is worth mentioning the results by Spiezia (2011), who presents evidence
from a cross-country micro-level project carried out at the OECD. The project finds
evidence for the fact that ICT enables innovation. However, it does not find support
that ICT also affects the degree of innovation in terms of innovation novelty.
Somewhat surprisingly the study also concludes that ICT does not lead to an
increase in the probability of collaboration on innovative activities, nor does it
increase the probability of in-house development.
4.2.1. Regulation, policy and institutional factors
Rules, laws and institutional setting, determine the playing field in which a firm
operates. Poor regulation or institutions can be detrimental to economic growth,

Determinants of productivity 21
while an appropriate institutional setting can help efficiency through solving
market failures. For example, Bartelsman et al. (2011) finds that strong labour
market regulations precludes investment in ICTs, which restricts the flexibility of
the firm and markets, and in the end hurts economic growth. On the other hand,
Olley and Pakes (1996) find evidence of aggregate productivity growth after
deregulation in the US Telecom sector, which was mainly caused by a reallocation
of capital towards more productive firms. Haskel and Sadun (2012) document a
drop in average firm-level TFP in multi-store retail chains in the UK, following a
change in regulation increasing the cost of opening large stores.
In a recent extensive study for the UK, Van Reenen et al. (2010), the most
important policy conclusion is that high degrees of product and, especially, labour
market regulation (PMR and LMR), temper the positive impact of ICT on
productivity growth. Firstly, firms under tight LMR and PMR regimes are found to
be restricted in the generation of business value from ICT. Secondly, the positive
effect of ICT in fostering the process of reallocation of production factors towards
more productive units, is hampered by the existence of strong LMR and PMR.
Government support for various kinds of firm’s activities are usually aimed at
increasing, in the end, to stimulate firm performance. For example, EIM/UNU-
MERIT (2007), in their evaluation of the WBSO subsidy program for R&D, find that
R&D subsidy stimulates R&D over and above the level that firms would have
invested in absence of the program. They also find support for indirect increases in
productivity in that firms with higher R&D have higher productivity. Since no effect
on product innovation is found, they interpret this as a sign that R&D may lead to
process innovation. In light of the discussion on spillovers below, however, one
could also argue that R&D increases the absorptive capacity of firms, with respect
to external knowledge.
4.2.2. Competition in the product market
Competition affects productivity through the allocation of market share and
resources to more efficient firms, as well as through efficiency increases within
firms (although there may be a trade-off within foregone innovation due to too
much competitive pressure). In general it is found that competition fosters
productivity growth, see e.g. Nickell (1996). Ahn (2002) provides an extensive
overview of the literature, and evidence on interaction of competition with other
variables such as innovation.
Two studies performed an analysis in the spirit of Nickell (1996) for the
Netherlands. Felsö et al. (2001) used data for the manufacturing, construction, and
trade sectors for the period 1985-1996. Productivity growth showed a significant
positive correlation with the competition measures used: the profit elasticity, the

Determinants of productivity 22
Herfindahl index, market share, and average firm size. Lever and Nieuwenhuijsen
(1998) focussed on the Dutch manufacturing sector. They found that the increase
of concentration in markets (in terms of higher market shares) leads to lower
levels of productivity. Industries with relatively lower levels of market
concentration, higher export shares and higher import shares show more than
average growth of productivity. The authors further conclude that profitability has
a positive and significant effect on productivity. According to the authors, this
finding supports the Schumpeter hypothesis that monopoly profits are necessary
for investments in research and development and innovation.
Finally, Polder et al. (2010) find that firms first experience a negative effect of
increased competition, while in subsequent periods productivity is increased. A
possible explanation is that firms need time to adjust, e.g. through investment in
R&D or by making necessary adjustments in the production process, which may
first have a disruptive effect but leads to productivity gains in later periods.
4.2.3. Spillovers and externalities
We distinguish three types of spillovers/externalities. Firstly, there are spillovers
from best-practice production methods. A firm can learn from best-practices, as
captured by its distance to some technological frontier. Bartelsman et al. (2006)
find that the national technological frontier has a stronger impact on productivity
growth of firms than does the global frontier. This means that firms learn more
from their domestic counterparts. Moreover, the pull of the global frontier falls as
the distance becomes larger. This means that if firms are too far from the global
frontier they cannot catch up anymore. Consequently, if the national frontier is
close to the global frontier, an economy may have the ability to catch up, but
otherwise not. For policy purposes, the relevant question is whether to design
policy to push the technological frontier, or stimulate efficiency and catching up.
Van Der Wiel et al. (2008) corroborates the result that the national frontier is more
important than the global frontier in the Netherlands. They also find important
complementarities, in that competition provides an incentive for catching up to
both frontiers, and that doing R&D facilitates the catching up process. The latter
finding is in line with the ‘two faces of R&D’ argument by Griffith et al. (2004), who
assert a basic level of R&D is required to be able to absorb the knowledge of other
firms.
Secondly, there are spillovers from R&D, as analyzed by e.g. Griliches (1979, 1992).
These are usually measured by aggregating R&D of other firms, possibly weighted
according to technological or geographical distance. Cincera (2005) finds evidence
for a positive effect of R&D spillovers on productivity for different ways of
measuring such spillovers. Bloom et al. (2007) look at the balance between the
Determinants of productivity 23
positive effect of spillovers, and a possible market-stealing effect, and find that the
former effect dominates.
Finally, there may be externalities from ICT usage. These can captured in the same
way as R&D spillovers, as an aggregate of some measure of ICT, where each
firm’s/industry’s contribution is weighted by an appropriate distance measure.
Van Der Wiel and Van Leeuwen (2001, 2004) present firm-level evidence that such
‘ICT spillovers’ matter for the Netherlands. Mun and Nadiri (2002) also find that IT
externalities can explain substantial parts of TFP growth in the US. However, Van
Reenen et al. (2010) find no evidence of such productivity effects for the UK,
although ICT adoption by neighbouring firms does have a positive effect on
adoption. In a recent study under the ESSLimit project, Van Leeuwen and Polder
(2012) also find evidence for cross-country spillovers for adoption of e-business
systems within the firm’s own industry. However, similar spillovers between firms
in other industries within the same country are not apparent.
4.3.1. Industry dynamics
As mentioned above, the productivity gap between the US and EU is usually
attributed to a smaller ICT industry in the latter, as well as a smaller growth of ICT-
using sector. Using a shift-share analyses, Van Ark et al. (2003) find that the lagging
behind of the ICT-using sector in the EU accounts for the largest part of the
difference. This might be attributed to the presence of stronger regulations in
Europe, especially on the labour market, and higher barriers to entry.
4.3.2. Business dynamics
One of the conclusion in the survey article by Pilat (2004) is that in an ICT-driven
economy there is a lot of experimentation, where some firms succeed (and grow),
and other firms do not (and exit). To seize the benefits of ICT, policy should create
a business environment that cushions this process of creative destruction. This
emphasizes the necessity of analysing micro and meso simultaneously, if one is
interested in the sources of economic growth.
The question of the importance of such business dynamics to explain aggregate
productivity changes has been attacked by various studies using decomposition
techniques. Balk (2003) provides an overview of various decomposition
techniques, including the ones by Baily, Hulten and Campbell (1992) and Olley and
Pakes (1996). Balk and Hoogenboom (2003) find for the Netherlands that which
decomposition one uses, matters for the conclusions about what is the most
important component in aggregate growth. Foster et al. (2001) corroborate this
conclusion in their review of the literature, but also find that the importance of
entry is a robust finding in the empirical literature. Foster et al. (2002) finds that

Determinants of productivity 24
for the US services, the largest share of productivity growth is explained by new
entrants replacing less productive exiting firms.
4.4. Concluding remarks on literature review
Our discussion of the literature is necessarily brief. There are topics that are not
covered, like for example the influence of internationalization of markets and the
increasing importance of global value chains. Each of the subthemes above could be
the topic of a literature review in itself, in which case for each theme the review
could easily tend more towards a book rather than a paper.
Our impression is that, although unified by a common cause that is the search for
explaining productivity growth at different levels of aggregation, there is no
unifying framework in which all these determinants can be gathered. Rather, what
is found to be important in one branch of the literature, may be implicitly assumed
away in another branch. However, we have identified the augmented production
function as a common approach to assessing productivity effects, which can also be
linked to the practice of growth accounting which is more rooted in index theory.
We propose to start from this production function model, and analyze different
determinants individually, highlighting possible cross-relations where possible.

Determinants of productivity 25
5. Empirical results
The aim of this section is to provide an illustration and example of the production
function framework, regarding the estimation of a production function on industry-
level data. In addition to the basic production function specification, we distinguish
between IT and non-IT (tangible) capital, add Corrado-Hulten-Sichel intangible
categories, and add various cross-terms to test possible complementarities
between IT and intangibles at the industry-level. Also we consider the extension of
the framework by accounting for the quality of labour, and by adding determinants
beyond factors of production like competition and spillovers.
All variables are sourced from the system of the Dutch Growth Accounts and the
Knowledge Module. Production factors are measured as real costs (thus, for capital
we have the real user costs, and for labour we have the real labour cost). We use
data on 33 industries (within what Statistics Netherlands calls the ‘commercial
sector’) for the period 1996 to 2008 (= 14 x 33 = 492 observations).
5.1 Standard Growth accounting and OLS estimation
Following Stiroh (2005) we depart from a specification based on gross output Y,
using j for industry and t for years,
(1) jtttjtjt
k
kjtkjtjt DMLKAY lnlnlnln
where K is capital, L is labour, D is a year dummy, and a random disturbance. The
Ajt variables represent an unobserved productivity shock. Aggregation over capital
types may obscure considerable heterogeneity, which motivates us to distinguish
different types of capital K (k = 1,…,5):
1. IT capital (only hardware), KNIT;
2. non-IT tangible capital, KIT;
3. Intellectual Property (IP) ;
4. Economic competencies (EC);
5. Computerized information (CI),
where the latter three categories are the Corrado-Hulten-Sichel (CHS) categories of
capitalized knowledge (or intangibles). Moreover, we investigate various
complementarities of IT capital with intangibles:
(1)’ ttjtjt
k
kjtkjt DMLKY lnlnln
jtjtjtjtjtjtjt KKKKKK 411541143113 lnlnlnlnlnln .

Determinants of productivity 26
According to neoclassical theory, the factor elasticities are equal to their cost
shares. Table 1 gives the (average) cost shares for all factor considered. If
estimated elasticities are above these costs shares, a factor can be said to earn
above-normal returns. From table 1 it is clear that the IT part in both tangible and
intangible capital is very small. Normal returns would therefore imply very low
elasticities.
Table 1. Cost shares of production factors.
unweighted employment weighted
capital 0.164 0.144
tangibles 0.106 0.083
IT 0.004 0.005
non-IT 0.102 0.078
intangibles 0.058 0.061
computerized information 0.007 0.007
economic competencies 0.032 0.045
intellectual properties 0.019 0.009
labour 0.311 0.414
intemediates 0.525 0.442
Turning to the estimations, because of possible heterogeneity due to differences in
industry size, we use weighted OLS (based on log output), in line with Stiroh. We
also employ fixed effects to account for industry-specific characteristics and
measurement error.
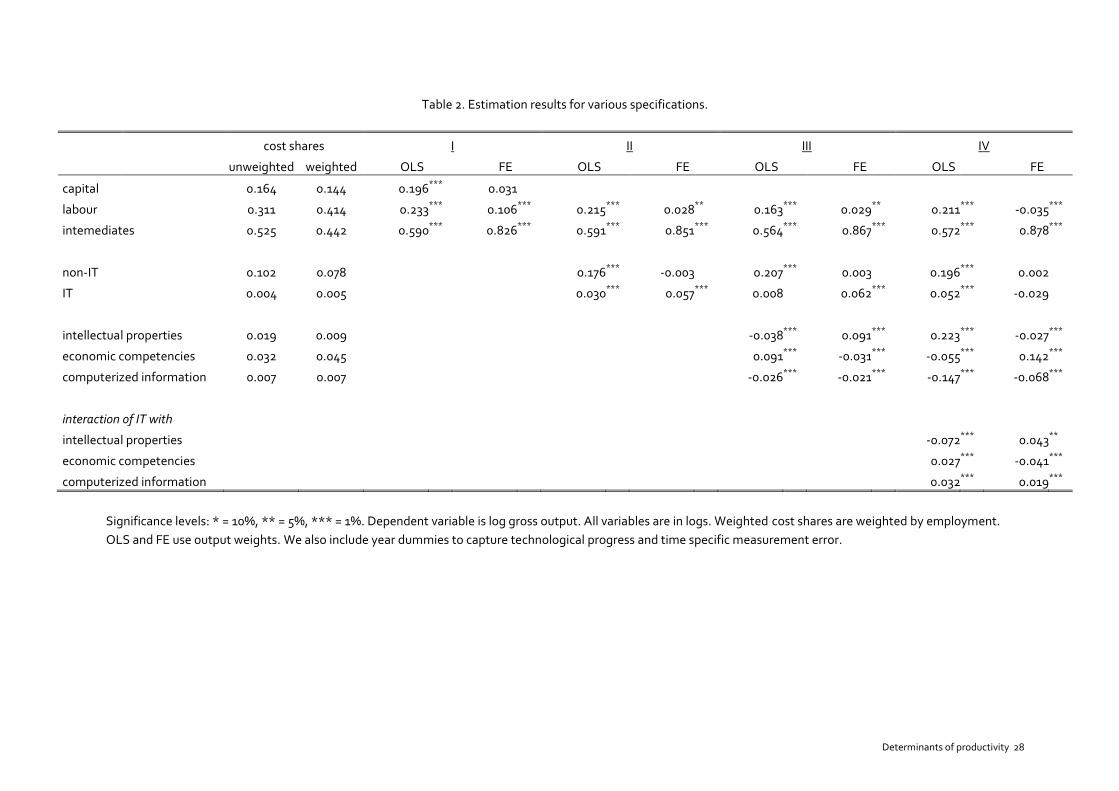
Table 2 presents the results for various specifications. Each specification is
estimated by OLS and fixed-effects (by including industry dummies, i.e. the ‘within’
estimator). The specifications are:
I. benchmark with (aggregate) capital, labour, intermediates;
II. like I with distinction between IT and non-IT capital;
III. like II, and CHS categories included;
IV. like III, but interaction terms of IT capital with CHS terms included.
For comparison we repeat the cost shares of each factor in the table.
In the basic specification we see that the OLS estimates differ somewhat from the
cost shares, but are roughly in line. Capital and materials earn above normal
returns, labour below. The picture shifts substantially using the fixed effects
estimators, especially for capital which be-comes insignificant. This is in line with
evidence reviewed by Stiroh and his own estimations for the US, although in our

Determinants of productivity 27
case aggregation over different types of capital may have a reinforcing effect. Under
specification (II), we find that both IT and non-IT capital have strong positive (and
‘above normal’) productivity effects in the OLS estimation. However, non-IT capital
drops to insignificance again when fixed effects are added, while also the labour
elasticity drops dramatically. The return to IT capital, on the other hand, increases.
Specification (III) adds the CHS categories, and also shows contrasting results
between OLS and FE. Under OLS, non-IT capital is significant, and IT capital is not,
while under FE it is the other way around. Intellectual properties have a negative
effect under OLS, while under FE it has a positive effect. For economic
competences, we see the reversed picture: a positive effect under OLS, but negative
under FE. The results for computerized information are consistent, but negative,
which would mean a disappointing result about the contribution of IT.
Our most detailed specification also includes interaction terms between IT capital
and the CHS categories. This specification gives in our view very interesting results.
In the OLS esti-mation, both non-IT and IT capital earn significantly above normal
returns. In addition, intellectual property has a strong and positive coefficient. By
contrast, economic competencies and computerized information have negative
direct effects. However, looking at the interaction terms puts the direct effects into
a different light. Interestingly, the interaction terms all have the opposite signs of
the direct effects of the CHS categories. Thus, the negative effect of economic
competencies and computerized information turns into a positive effect when the
value for (log) IT capital is high enough. Similarly, for intellectual property, the
effect turns to negative when IT capital increases.
Determinants of productivity 28
Table 2. Estimation results for various specifications.
cost shares I II III IV
unweighted weighted OLS FE OLS FE OLS FE OLS FE
capital 0.164 0.144 0.196 ***
0.031
labour 0.311 0.414 0.233 ***
0.106 ***
0.215 ***
0.028 **
0.163 ***
0.029 **
0.211 ***
-0.035 ***
intemediates 0.525 0.442 0.590 ***
0.826 ***
0.591 ***
0.851 ***
0.564 ***
0.867 ***
0.572 ***
0.878 ***
non-IT 0.102 0.078 0.176 ***
-0.003 0.207 ***
0.003 0.196 ***
0.002
IT 0.004 0.005 0.030 ***
0.057 ***
0.008 0.062 ***
0.052 ***
-0.029
intellectual properties 0.019 0.009 -0.038 ***
0.091 ***
0.223 ***
-0.027 ***
economic competencies 0.032 0.045 0.091 ***
-0.031 ***
-0.055 ***
0.142 ***
computerized information 0.007 0.007 -0.026 ***
-0.021 ***
-0.147 ***
-0.068 ***
interaction of IT with
intellectual properties -0.072 ***
0.043 **
economic competencies 0.027 ***
-0.041 ***
computerized information 0.032 ***
0.019 ***
Significance levels: * = 10%, ** = 5%, *** = 1%. Dependent variable is log gross output. All variables are in logs. Weighted cost shares are weighted by employment.
OLS and FE use output weights. We also include year dummies to capture technological progress and time specific measurement error.

Determinants of productivity 29
Thus, we find a non-linear effect for the CHS categories, depending on the
magnitude of IT capital in an industry. Note that the marginal effects for the CHS
categories (Kk, k = 3,4,5) depends on IT capital (K1)
logY/logKk = k + klogK1.
So that, if k and k have opposite signs, the sign of the marginal effect flips if
logK1 > -k/k.
Given the results, this implies the points of infliction in table 3. The share of
observations gives the number for which IT capital is above the threshold. Thus, we
find that while intellectual property has a positive direct effect on productivity, the
effect changes to negative when logK1 = 3.084, which is true for almost 80% of the
observations. In most cases, the effect of intellectual property is negative,
therefore, and there seems to be substitution rather than complementarity with IT
capital. On the other hand, economic competencies has a negative direct effect, but
the effect changes to positive with IT capital, and in about 96% of observations its
effect will be positive, pointing at strong complementarity between this type of
intangibles with IT capital. Computerized information has a positive effect in about
20% of the cases. There is again a lot of contrast of the OLS with the FE results,
where the effect of intellectual properties is de facto positive, economic
competencies has a negative effect in 67% of the cases, and computerized
information has a positive effect in 63% of the cases.
Table 3. Infliction points for the marginal effect of CHS categories
(value for logKjt where sign of effect changes).
OLS % obs FE % obs
intellectual properties 3.084 0.797 0.623 1
economic competencies 1.990 0.958 3.461 0.674
computerized information 4.612 0.203 3.550 0.634
In summary, we find the following. There are large contrasts between OLS and FE
results. However, in almost each specification IT capital earns an above normal
return. Moreover, the effect of intangibles is found to interact with IT capital. At
face value, the OLS estimations seem more plausible, especially in relation to the
cost shares of the various inputs. In particular the elasticity of labour seems
implausibly low in the FE estimations, even turning to negative in our most
elaborate specification. However, our estimations may suffer from omitted variable
or simultaneity biases. The section 5.3 we look at two recently suggested

Determinants of productivity 30
alternative estimation approaches that are often used for production function
estimation in the literature. Firstly, however, we extend the model with additional
variables that may impact productivity.
5.2 Extending the model with new variables
5.2.1 Adjusting labour input for quality
Consider the average labour cost per hour in year t,
and its equivalent in t+1,
. The value index of labour cost is
, and the volume index of labour based
on hours worked is
. Using that the volume index is the value index divided by
the price index, we have
This is the common (implied) price index of labour. It is clear that this index does
not account for the fact that the quality of an hour worked is different for different
types of labour. For example, the price index drops if relatively young workers –
with lower wages – enter the market. However, this drop is then caused by a
compositional effect rather than a change in the price of labour.
Recently, CBS has developed a price index for labour cost that corrects for changes
in the composition of labour (see Van Den Berg and Peltzer, 2011). Analogous to
the consumption price index, labour is divided into various categories related to
the “quality of labour”. For each cell, one can calculate the average labour cost per
hour. To avoid that compositional effects play a role in the aggregate price index,
one can determine the distribution of hours worked over the various cells in a
particular base year. By weighting the average labour cost by the distribution in the
base year, one obtains a price index that is free of composition effects. Essentially,
one weighs together the per hour labour cost in each category, imposing that the
distribution of hours worked over the category does not change.
By using the pure price index of labour, call it , where QA denotes “quality
adjusted”, we achieve that the quality of labour is included in the volume of labour
(i.e. deflated labour cost). The difference between the two indices,
, is
labelled the “compositional effect” (“structuureffect” is the Dutch term that Van
Den Berg and Peltzer maintain).
Determinants of productivity 31
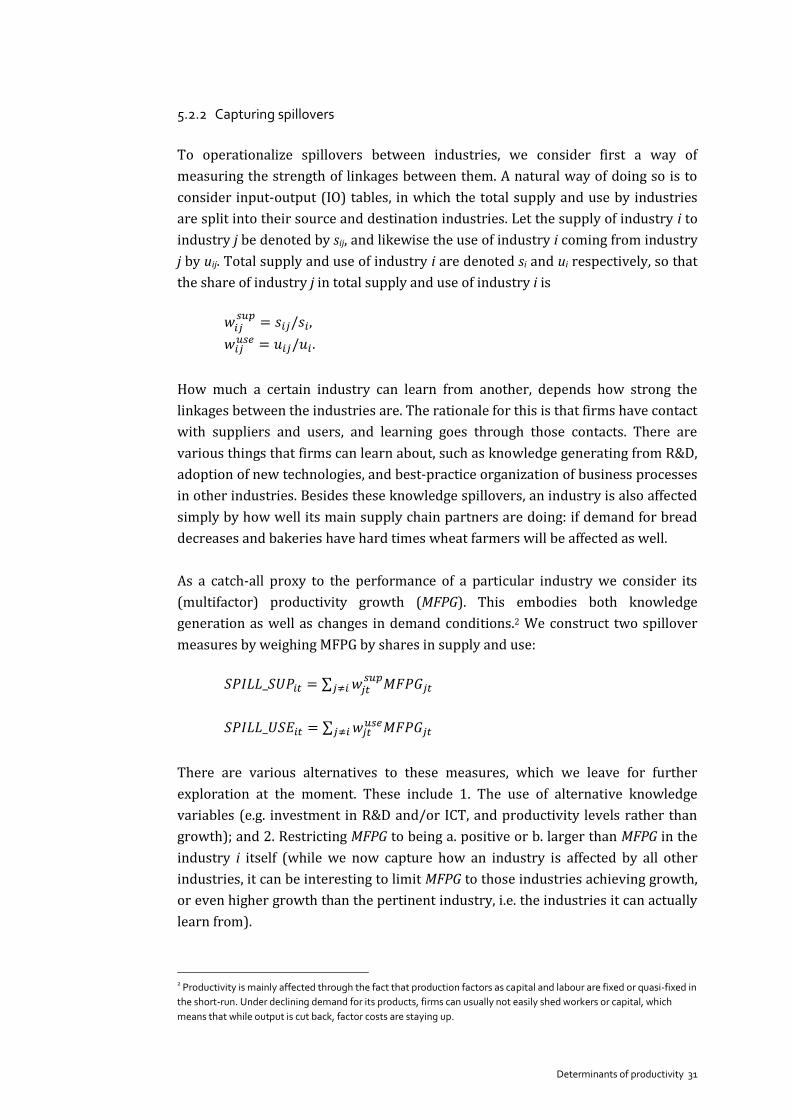
5.2.2 Capturing spillovers
To operationalize spillovers between industries, we consider first a way of
measuring the strength of linkages between them. A natural way of doing so is to
consider input-output (IO) tables, in which the total supply and use by industries
are split into their source and destination industries. Let the supply of industry i to
industry j be denoted by sij, and likewise the use of industry i coming from industry
j by uij. Total supply and use of industry i are denoted si and ui respectively, so that
the share of industry j in total supply and use of industry i is
,
.
How much a certain industry can learn from another, depends how strong the
linkages between the industries are. The rationale for this is that firms have contact
with suppliers and users, and learning goes through those contacts. There are
various things that firms can learn about, such as knowledge generating from R&D,
adoption of new technologies, and best-practice organization of business processes
in other industries. Besides these knowledge spillovers, an industry is also affected
simply by how well its main supply chain partners are doing: if demand for bread
decreases and bakeries have hard times wheat farmers will be affected as well.
As a catch-all proxy to the performance of a particular industry we consider its
(multifactor) productivity growth (MFPG). This embodies both knowledge
generation as well as changes in demand conditions.2 We construct two spillover
measures by weighing MFPG by shares in supply and use:
∑
∑
There are various alternatives to these measures, which we leave for further
exploration at the moment. These include 1. The use of alternative knowledge
variables (e.g. investment in R&D and/or ICT, and productivity levels rather than
growth); and 2. Restricting MFPG to being a. positive or b. larger than MFPG in the
industry i itself (while we now capture how an industry is affected by all other
industries, it can be interesting to limit MFPG to those industries achieving growth,
or even higher growth than the pertinent industry, i.e. the industries it can actually
learn from).
2 Productivity is mainly affected through the fact that production factors as capital and labour are fixed or quasi-fixed in
the short-run. Under declining demand for its products, firms can usually not easily shed workers or capital, which
means that while output is cut back, factor costs are staying up.

Determinants of productivity 32
5.2.3 Measuring competition
While there have been suggested many ways to assess competition, there is no
definitive measure for this concept yet (Boone et al. 2007, Polder et al. 2010). For
the moment, we opt for a metric that is simple compute at the industry level,
namely the Price Cost Margin
.
Alternatively, it is possible to calculate mark-ups at firm-level (see the contribution
by Van Leeuwen in this project), and take the average or median of those to arrive
at an industry-level indicator. Another alternative is to use the profit elasticity (or
‘Boone’ indicator, after Boone, 2001), which can be estimated from firm-level
regression by industry. We leave the implementation of the alternative competition
indicators for future research.
5.2.4 Estimation results with additional variables
Controlling for quality of labour
Table 4 presents the OLS estimation results for the industry productivity
regressions. Since the price index used to derive a quality corrected volume index
for labour is available only for the period 2002-2008, we also re-estimate the
regression without controlling for quality, to avoid that the comparison is affected
by the time period used (recall that the estimations in Table 2 above were carried
out for the period 1996-2008).
Looking first at the differences caused by estimation on the basis of the shorter
time period, we see that most are non-substantial. However, it seems that the effect
of IT capital is estimated to be stronger in the latter period, which is consistent
with an increasing of importance of IT capital over time.
When considering the differences between the estimations based on labour
volumes derived from changes in hours worked and those derived from a quality
adjusted volume index, differences are also negligible. While we see that the
estimated labour elasticity increases slightly, the differences are non-significant.
Other coefficients are also barely affected. However, we see that IT capital becomes
insignificant when controlling for quality of labour. This is an interesting finding,
since it suggests that industries with higher IT capital may also have higher quality
labour, and failing to control for the latter attributes higher productivity to IT
capital.

Determinants of productivity 33
Although controlling for labour seems relevant in our context of investigating the
relation of productivity and IT, we will opt for the original labour volumes based on
hours worked in the remaining estimations in the paper, because of the limited
period for which quality adjusted figures can be constructed. For future research,
we aim to investigate the possibility of making a longer time-series of quality
adjusted labour volumes.
Adding spillovers
Table 5 shows the results for our two base specifications when adding measures of
spillovers. As discussed above we distinguish between spillovers from supplying
industries and spillovers from using industries. Surprisingly, we find strong
negative effects associated with our spillover indicators. This holds for both
spillovers from suppliers and users, and in both the specifications with and without
interactions. In the latter specification, we do not find evidence of any interaction
of spillovers with IT capital. Finally, we have also investigated whether there may
be a lag for knowledge to transfer from one industry to another, by including
lagged spillovers. The results of these estimations are not reported, but are similar
to those reported in Table 5.
Clearly, the negative effect on our spillover measures runs against the intuition of
industries benefiting from knowledge generation in upstream or downstream
industries. Thinking about what could be driving these results, our tentative
interpretation is that industries that perform well (in terms of MFP growth) may
have increased market power. This could affect their ability to set or negotiate
prices. That is, suppliers set higher prices if demand for their product increases,
and users with market power negotiate lower prices (e.g. retailers putting pressure
on suppliers to reduce prices). Thus, our indicator may in fact be picking up market
power of up- and downstream industries, which is negatively related to
performance.
Further research should investigate of other variables than MFP growth in the
spillover measure. This could include labour productivity and investment in R&D
and/or ICT.
Adding competition
Table 6 shows the results for adding the competition variable (nb. we use log(1-
PCM), as PCM itself is inversely related to competition). In the specifications in the
left panel, competition is added as an explanatory variable and interacted with IT
capital. We find a strong negative effect, especially in the specification without
interactions. Moreover, we find that the coefficients of capital and labour are
substantially affected. Non-IT capital obtains an implausible negative effect, while
the labour coefficient almost doubles with respect to earlier OLS estimations. In

Determinants of productivity 34
our view, this is caused by the fact that PCM is a function of output, labour and
intermediate inputs, leading to collinearity with the other variables.
Therefore, instead of using the PCM variable as an explanatory variable, we use it
to perform a sample split of high and low competition regimes, based on the
median value of PCM. The results for this sample split are in the right panel for the
specification without interactions only. We find that in the low competition regime,
non-IT capital is more important than IT-capital, and the latter is even associated
with a negative effect on performance. Moreover, economic competencies and
computerized information positively affect performance. Conversely, IT capital is
more important in the high competition regime, where non-IT capital is not
significant. Whereas the elasticity of economic competencies and computerized
information are now insignificant, intellectual properties now have significantly
negative effect. A loose interpretation of the differences between the low and high
competition regime could be that under low competition firms have the chance to
invest in and reap the benefits of innovation (intangibles), whereas under high
competition firms are forced to work more efficiently by automizing through IT.
We have also experimented with a squared competition term to investigate a
possible non-linear effect. Aghion et al. (2005) and various other empirical studies
have identified an inverted U-shape relation between innovation and competition.
Such a relation may carry over to productivity if productivity is a linear function of
innovation. However, in unreported estimations, we do not find evidence for such a
relation. (Rather, we find a positive sign on the quadratic term.)
Further research should focus on the use of more sophisticated measures of
competition, as the profit elasticity and mark-ups, both of which are derived from
firm-level regressions.
5.3 Econometric considerations
To account for endogeneity of inputs one finds various methods in the literature,
see e.g. Griliches and Mairesse (1998) and Arellano and Honoré (2001). One can
distinguish two types of main approaches. Firstly, there is the ‘Dynamic Panel Data
(DPD)’ approach, in the spirit of Arellano and Bond (1991), and developed further
by among others Arellano and Bover (1995) and Blundell and Bond (1998, 2000).
Secondly, there is the ‘structural’ approach as advocated by Olley and Pakes (1996)
and Levinsohn and Petrin (2003), more recently extended by Ackerberg, Caves and
Frazier (2006).
We discuss and apply both the approaches by Blundell and Bond (BB) and
Ackerberg, Caves and Frazier (ACF). From our reading of the literature, these two
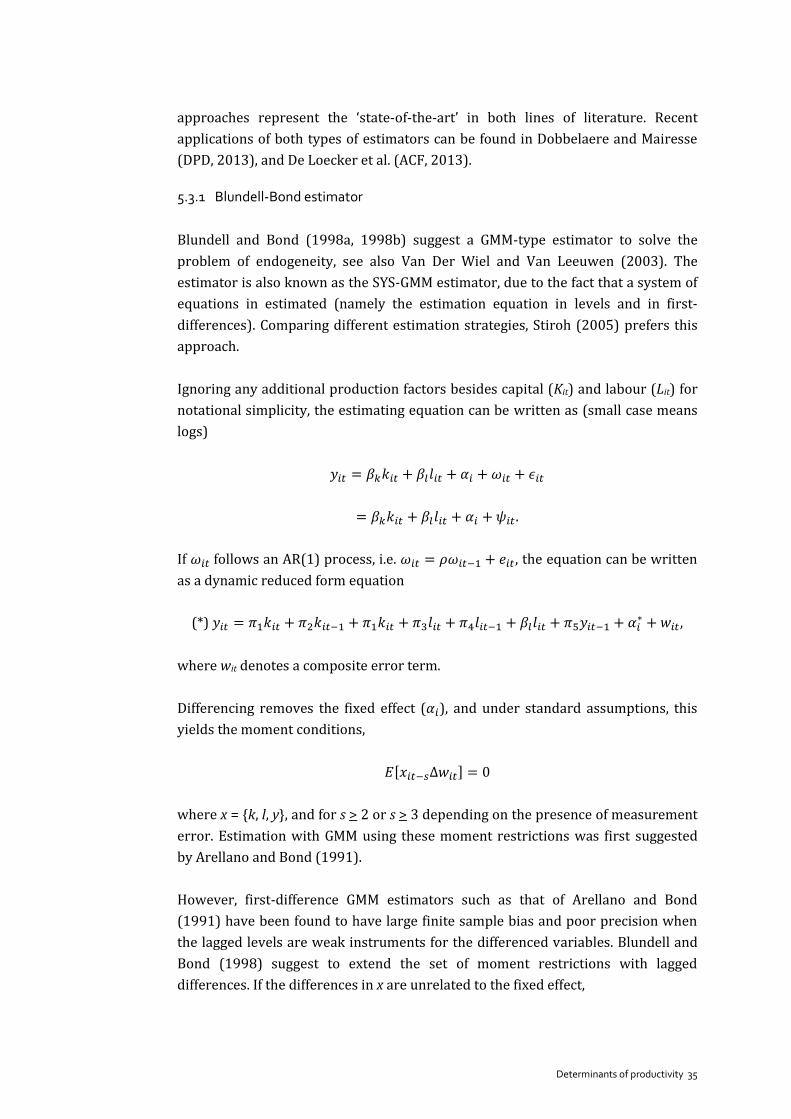
Determinants of productivity 35
approaches represent the ‘state-of-the-art’ in both lines of literature. Recent
applications of both types of estimators can be found in Dobbelaere and Mairesse
(DPD, 2013), and De Loecker et al. (ACF, 2013).
5.3.1 Blundell-Bond estimator
Blundell and Bond (1998a, 1998b) suggest a GMM-type estimator to solve the
problem of endogeneity, see also Van Der Wiel and Van Leeuwen (2003). The
estimator is also known as the SYS-GMM estimator, due to the fact that a system of
equations in estimated (namely the estimation equation in levels and in first-
differences). Comparing different estimation strategies, Stiroh (2005) prefers this
approach.
Ignoring any additional production factors besides capital (Kit) and labour (Lit) for
notational simplicity, the estimating equation can be written as (small case means
logs)
.
If follows an AR(1) process, i.e. , the equation can be written
as a dynamic reduced form equation
(*) ,
where wit denotes a composite error term.
Differencing removes the fixed effect ( ), and under standard assumptions, this
yields the moment conditions,
[ ]
where x = {k, l, y}, and for s > 2 or s > 3 depending on the presence of measurement
error. Estimation with GMM using these moment restrictions was first suggested
by Arellano and Bond (1991).
However, first-difference GMM estimators such as that of Arellano and Bond
(1991) have been found to have large finite sample bias and poor precision when
the lagged levels are weak instruments for the differenced variables. Blundell and
Bond (1998) suggest to extend the set of moment restrictions with lagged
differences. If the differences in x are unrelated to the fixed effect,

Determinants of productivity 36
[ ]
for s = 1 or 2, depending on measurement error (and moments for larger s can be
shown to be redundant). Note that the second set of the moment restrictions does
not require the actual estimation of , since it is the composite term
,
and this can be calculated directly from (*) for given candidate parameter
estimates.
The complete set of moment restictions is used to obtain a GMM estimation of the
reduced form parameters. Finally, the structural parameters can be derived from
a Minimum Distance procedure, noting that , , ,
and (see e.g. Wooldridge, 2003).
5.3.2 Olley and Pakes
In a seminal paper, Olley and Pakes (1996) considered the estimation of the model
Unlike the DPD literature, their approach does not consider a fixed effect. Similar to
the DPD literature, however, a first-order Markov process is assumed for . The
main insight of Olley-Pakes is that if one can assume that investment is a non-
monotonic function of productivity (and other state variables like capital), one
can invert this function to obtain as a function of investment. This gives
In the first stage of the estimation is approximated non-parametrically by
a polynomial in iit and kit. Thus, one obtains an estimate of and . To
obtain an estimate of , it is noted that
[ | ]
where is orthogonal to all information available at time t-1. Since Olley and
Pakes assume that the level of kit is determined at t-1, it holds that
[ ] .
Noting that , we can construct as a function of
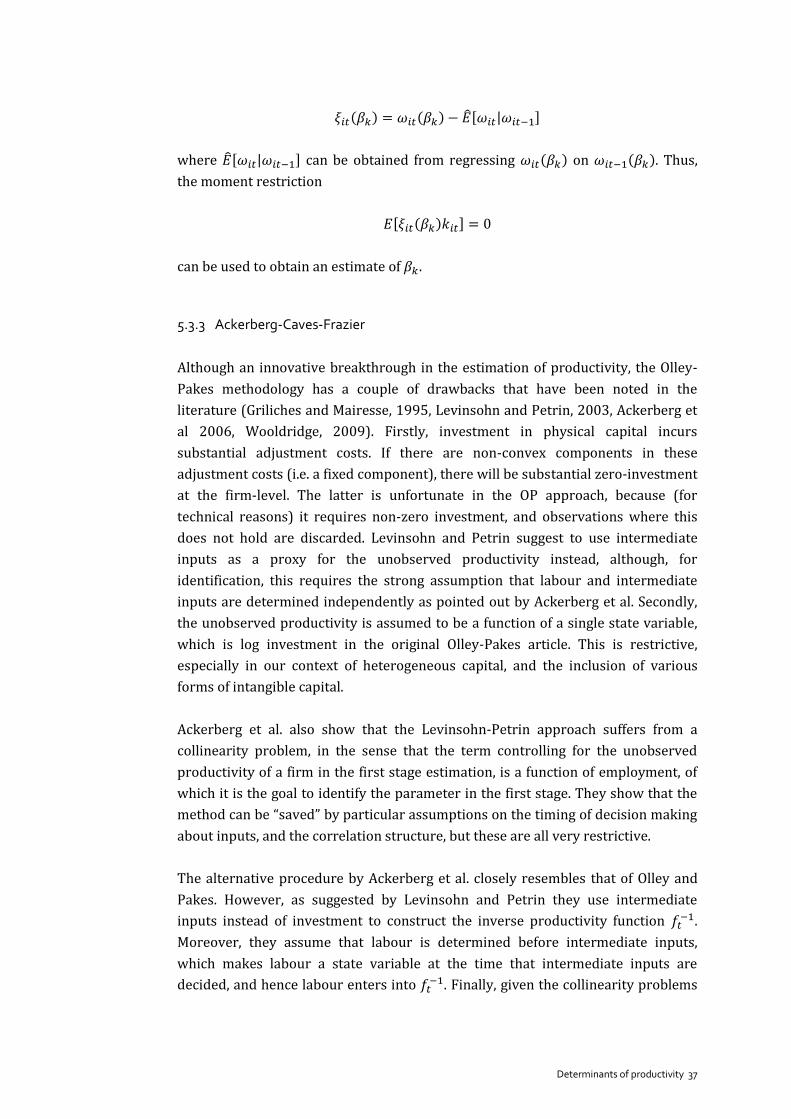
Determinants of productivity 37
[ | ]
where [ | ] can be obtained from regressing on . Thus,
the moment restriction
[ ]
can be used to obtain an estimate of .
5.3.3 Ackerberg-Caves-Frazier
Although an innovative breakthrough in the estimation of productivity, the Olley-
Pakes methodology has a couple of drawbacks that have been noted in the
literature (Griliches and Mairesse, 1995, Levinsohn and Petrin, 2003, Ackerberg et
al 2006, Wooldridge, 2009). Firstly, investment in physical capital incurs
substantial adjustment costs. If there are non-convex components in these
adjustment costs (i.e. a fixed component), there will be substantial zero-investment
at the firm-level. The latter is unfortunate in the OP approach, because (for
technical reasons) it requires non-zero investment, and observations where this
does not hold are discarded. Levinsohn and Petrin suggest to use intermediate
inputs as a proxy for the unobserved productivity instead, although, for
identification, this requires the strong assumption that labour and intermediate
inputs are determined independently as pointed out by Ackerberg et al. Secondly,
the unobserved productivity is assumed to be a function of a single state variable,
which is log investment in the original Olley-Pakes article. This is restrictive,
especially in our context of heterogeneous capital, and the inclusion of various
forms of intangible capital.
Ackerberg et al. also show that the Levinsohn-Petrin approach suffers from a
collinearity problem, in the sense that the term controlling for the unobserved
productivity of a firm in the first stage estimation, is a function of employment, of
which it is the goal to identify the parameter in the first stage. They show that the
method can be “saved” by particular assumptions on the timing of decision making
about inputs, and the correlation structure, but these are all very restrictive.
The alternative procedure by Ackerberg et al. closely resembles that of Olley and
Pakes. However, as suggested by Levinsohn and Petrin they use intermediate
inputs instead of investment to construct the inverse productivity function .
Moreover, they assume that labour is determined before intermediate inputs,
which makes labour a state variable at the time that intermediate inputs are
decided, and hence labour enters into . Finally, given the collinearity problems

Determinants of productivity 38
of the Levinsohn-Petrin approach, Ackerberg et al. refrain from identifying any
coefficients at the first stage. Thus, they estimate
Now we have that . Analogous to Olley and
Pakes we can use the moment restriction
[ ]
where
[ | ]
and [ | ] can again be obtained from regressing on .
To identify we need an additional moment restriction. Since lt is not determined
at time t-1, it is not orthogonal to , but its lag can be used:
[ ] .
5.4 Results and comparison of methods
One faces various choices in modelling the production function, all of which can
possibly affect outcomes. To illustrate differences between the Blundell-Bond and
the Ackerberg-Caves-Frazier methodologies, we employ our two basic specification
with the CHS categories and interactions with IT capital:
5.4.1 Blundell-Bond estimations
In Table 7, we report the results for the Blundell-Bond estimator. We use a gross-
output specification (preferred by Stiroh, 2005, and Basu and Fernald, 1997), and a
value-added specification (preferred by Bond and Söderbom, 2005). The latter
specification makes it easier to compare with the results of the ACF method. To
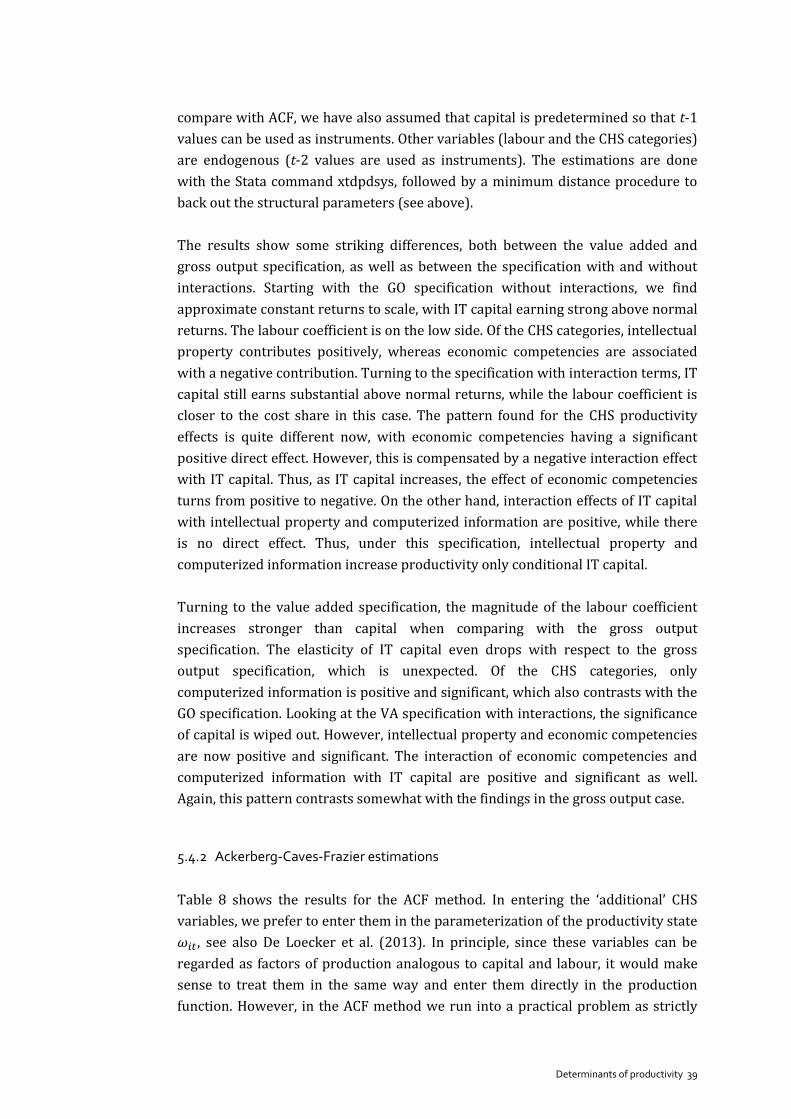
Determinants of productivity 39
compare with ACF, we have also assumed that capital is predetermined so that t-1
values can be used as instruments. Other variables (labour and the CHS categories)
are endogenous (t-2 values are used as instruments). The estimations are done
with the Stata command xtdpdsys, followed by a minimum distance procedure to
back out the structural parameters (see above).
The results show some striking differences, both between the value added and
gross output specification, as well as between the specification with and without
interactions. Starting with the GO specification without interactions, we find
approximate constant returns to scale, with IT capital earning strong above normal
returns. The labour coefficient is on the low side. Of the CHS categories, intellectual
property contributes positively, whereas economic competencies are associated
with a negative contribution. Turning to the specification with interaction terms, IT
capital still earns substantial above normal returns, while the labour coefficient is
closer to the cost share in this case. The pattern found for the CHS productivity
effects is quite different now, with economic competencies having a significant
positive direct effect. However, this is compensated by a negative interaction effect
with IT capital. Thus, as IT capital increases, the effect of economic competencies
turns from positive to negative. On the other hand, interaction effects of IT capital
with intellectual property and computerized information are positive, while there
is no direct effect. Thus, under this specification, intellectual property and
computerized information increase productivity only conditional IT capital.
Turning to the value added specification, the magnitude of the labour coefficient
increases stronger than capital when comparing with the gross output
specification. The elasticity of IT capital even drops with respect to the gross
output specification, which is unexpected. Of the CHS categories, only
computerized information is positive and significant, which also contrasts with the
GO specification. Looking at the VA specification with interactions, the significance
of capital is wiped out. However, intellectual property and economic competencies
are now positive and significant. The interaction of economic competencies and
computerized information with IT capital are positive and significant as well.
Again, this pattern contrasts somewhat with the findings in the gross output case.
5.4.2 Ackerberg-Caves-Frazier estimations
Table 8 shows the results for the ACF method. In entering the ‘additional’ CHS
variables, we prefer to enter them in the parameterization of the productivity state
, see also De Loecker et al. (2013). In principle, since these variables can be
regarded as factors of production analogous to capital and labour, it would make
sense to treat them in the same way and enter them directly in the production
function. However, in the ACF method we run into a practical problem as strictly
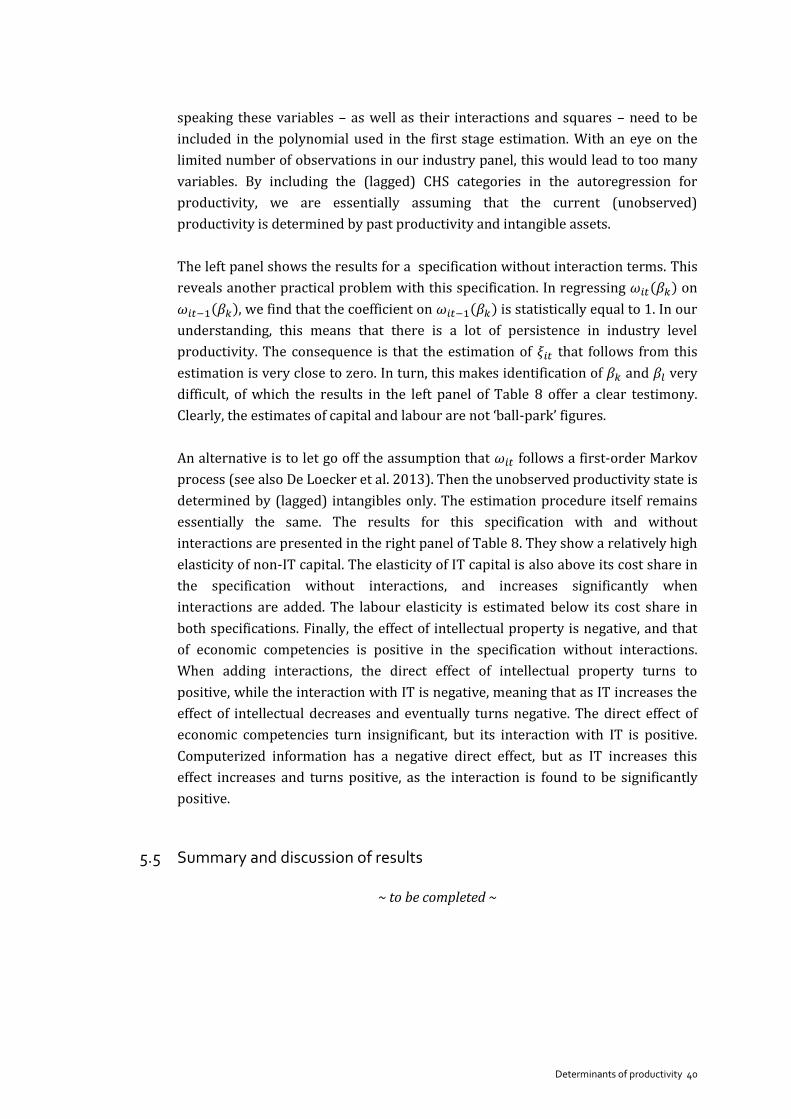
Determinants of productivity 40
speaking these variables – as well as their interactions and squares – need to be
included in the polynomial used in the first stage estimation. With an eye on the
limited number of observations in our industry panel, this would lead to too many
variables. By including the (lagged) CHS categories in the autoregression for
productivity, we are essentially assuming that the current (unobserved)
productivity is determined by past productivity and intangible assets.
The left panel shows the results for a specification without interaction terms. This
reveals another practical problem with this specification. In regressing on
, we find that the coefficient on is statistically equal to 1. In our
understanding, this means that there is a lot of persistence in industry level
productivity. The consequence is that the estimation of that follows from this
estimation is very close to zero. In turn, this makes identification of and very
difficult, of which the results in the left panel of Table 8 offer a clear testimony.
Clearly, the estimates of capital and labour are not ‘ball-park’ figures.
An alternative is to let go off the assumption that follows a first-order Markov
process (see also De Loecker et al. 2013). Then the unobserved productivity state is
determined by (lagged) intangibles only. The estimation procedure itself remains
essentially the same. The results for this specification with and without
interactions are presented in the right panel of Table 8. They show a relatively high
elasticity of non-IT capital. The elasticity of IT capital is also above its cost share in
the specification without interactions, and increases significantly when
interactions are added. The labour elasticity is estimated below its cost share in
both specifications. Finally, the effect of intellectual property is negative, and that
of economic competencies is positive in the specification without interactions.
When adding interactions, the direct effect of intellectual property turns to
positive, while the interaction with IT is negative, meaning that as IT increases the
effect of intellectual decreases and eventually turns negative. The direct effect of
economic competencies turn insignificant, but its interaction with IT is positive.
Computerized information has a negative direct effect, but as IT increases this
effect increases and turns positive, as the interaction is found to be significantly
positive.
5.5 Summary and discussion of results
~ to be completed ~

Determinants of productivity 41
References (incomplete)
Aghion, P., N. Bloom, R. Blundell, R. Griffith, and P. Howitt (2005), ‘Competition and
innovation: an inverted U relationship’, Quarterly Journal of Economics, vol.
120(2), pp. 701-728.
Ahn, S. (2002), ‘Competition, Innovation and Productivity Growth: A Review of
Theory and Evidence’, OECD Economics Department Working Papers, No. 317,
OECD Publishing, doi:10.1787/182144868160.
Arvanitis, Spyros(2005) 'Computerization, workplace organization, skilled labour
and firm productivity: Evidence for the Swiss business sector', Economics of
Innovation and New Technology, 14: 4, 225 — 249.
Baily, M.N., C. Hulten, en D. Campbell (1992), ‘Productivity dynamics in
manufacturing plants’, Brookings Paper on Economic Activity: Microeconomics, pp.
187-249.
Balk, B.M. (2003), ‘The residual: on monitoring and benchmarking firms,
industries, and economies with respect to productivity’, Journal of Productivity
Analysis, 20, pp. 5-47.
Balk, B.M. en E. Hoogenboom-Spijker (2003), ‘The measurement and
decomposition of productivity change: exercises on the Netherlands’
manufacturing industry’, CBS Discussion paper 03001.
Bartelsman, E.J. en M. Doms (2000), ’Understanding productivity: lessons from
longitudinal microdata’, Journal of Economic Literature, 38, pp. 569-594.
Bartelsman E.J., Pieter A. Gautier, and Joris de Wind, “Employment Protection,
Technology Choice, and Worker Allocation”, DNB Working Paper, No. 295, May
2011.
Black, Sandra E., and Lisa M. Lynch. 2001. “How to compete: the impact of
workplace practices and information technology on productivity.” The Review of
Economics and Statistics, 83(3): 434-445.
Bloom, N., M. Schankerman, and J. Van Reenen. (2007), “Identifying Technology
Spillovers and Product Market Rivalry”, NBER Working Paper 13060.
Bloom, N., R. Sadun, and J. Van Reenen (2012), “Americans do I.T. better: US
multinationals and the productivity miracle”, American Economic Review.

Determinants of productivity 42
Boone, J. (2000), ‘Competition’, CentER Discussion Paper 2000-104.
Boone, J., J.C. van Ours and H. van der Wiel (2007), ‘How (not) to measure
competition’ (Working paper).
Brynjolfsson, McAfee, Sorell and Zhu (2009), Scale without mass: business process
replication and industry dynamics, working paper MIT.
Brynjolfsson, Erik, and Lorin M. Hitt. 2000. “Beyond Computation: Information
Technology, Organizational Transformation and Business Performance.” Journal of
Economic Perspectives, 14(4): 23-48.
Brynjolfsson, Erik, Lorin Hitt, Heekyung Kim (2011), Strength in Numbers: How
Does Data-Driven Decision Making Affect Firm Performance?, MIT Working Paper.
Brynjolfsson, Erik, and Adam Saunders (2010), Wired for Innovation, MIT Press.
Cincera, M. (2005), ‘Firms’ productivity growth and R&D spillovers: an analysis of
alternative technological proximity measures’, Economics of Innovation and New
Technology, vol. 14(8), pp. 657-682.
Corrado, J. Haskel, C. Jona-Lasinio and M. Iommi (2012), Joint database on
intangibles for European policymaking – data from INNODRIVE, COINVEST and the
Conference Board.
Corrado, C. , C. Hulten, and D. Sichel (2006), “Intangible Capital and Economic
Growth”, Working Paper 2006-24, Federal Reserve Board.
Crépon, Bruno, Emmanuel Duguet, and Jacques Mairesse. 1998. “Research,
innovation and productivity : an econometric analysis at the firm level.” Economics
of Innovation and New Technology, 7: 115-158.
Crespi, Gustavo, Chiara Criscuolo, and Jonathan Haskel. 2007. “Information
technology, organizational change and productivity growth: evidence from UK
firms.” CEP Discussion Paper no. 783.
Draca, M., R. Sadun, and J. Van Reenen (2006), “Productivity and ICT: a review of
the evidence”, CEP Discussion Paper No. 749.
EIM/UNU-MERIT (2007), “WBSO Evaluation 2001-2005, Impacts, target group
reach - and implementation”, Ministry of Economic Affairs Research Series.

Determinants of productivity 43
Felsö, F., M.L. Kok, and J. Theeuwes (2001), ‘Marktwerking en productiviteit’, SEO-
rapport nr. 598.
Foster, L., J. Haltiwanger en C.J. Krizan (2001), ‘Aggregate productivity growth:
lessons from microeconomic evidence’, in: New Developments In Productivity
Analysis, Hulten, C.R., E.R. Dean, E.R. en M.J. Harper (eds.), pp. 303-363.
Foster, L., J. Haltiwanger en C.J. Krizan (2002), ‘The link between aggregate and
micro productivity growth: evidence from retail trade’, CES-paper 02-18.
Gelauff, G. L. Klomp, S. Raes, and T. Roelandt, eds. (2004), Fostering Productivity:
Patterns, Determinants, and Policy Implications, Elsevier.
Griffith, R., S. Redding and J. v. Reenen, 2004, Mapping the two faces of R&D:
Productivity
growth in a panel of OECD industries, Review of Economics and Statistics, vol. 86,
no. 4, pp.
883–895.
Griffith, Rachel, Elena Huergo, Jacques Mairesse, and Bettina Peters. 2006.
“Innovation and productivity across four European countries.” Oxford Review of
Economic Policy, 22(4): 483-498.
Griliches, Zvi. 1979. “Issues in assessing the contribution of research and
development to productivity growth.” Bell Journal of Economics, 10(1): 92-116.
Griliches, Z. (1992) The Search for R&D Spillovers. Scandinavian Journal of
Economics, 94, 29–48.
Hagsten, E. and A. Sabadash (2012), “The Role Played by ICT Human Capital in Firm
Productivity”, Paper presented at the CAED Nuremberg 2012.
Hulten, C. (2001), ‘Total Factor Productivity: a short biography’, in: New
Developments In Productivity Analysis, Hulten, C.R., E.R. Dean, E.R. en M.J. Harper
(eds.), pp. 1-47.
Ichinowski, C., K. Shaw, and G. Prennushi (1997) “The effects of Human Resource
Management Practices on Productivity ”, American Economic Review, 87(3), pp.
291-313.
Jorgenson, Dale W., Mun S. Ho, and Kevin J. Stiroh. 2008, “A Retrospective Look at
the U.S. Productivity Growth Resurgence.” Journal of Economic Perspectives, 22(1):
3-24.
Determinants of productivity 44
Lever, M.C.H. and H.R. Nieuwenhuijsen (1998) ‘The impact of competition on
productivity in Dutch manufacturing’, EIM/CBS strategic study, Zoetermeer.
Lööf, H. en A. Heshmati (2002), ‘The link between firm level innovation and
aggregate productivity growth’, SISTER Working paper 2002-15.
Milgrom, Paul, and John Roberts. 1990. “The economics of modern manufacturing,
technology, strategy and organizations.” American Economic Review, 80: 511-528.
Milgrom, P. and J. Roberts (1995). Complementarities and fit: Strategy, structure,
and organizational change in manufacturing. Journal of Accounting and Economics
19(2,3):
179-208.
Mun, S-B and M.I. Nadiri, 2002, Information technology externalities: empirical
evidence from 42 U.S. industries, NBER Working Paper 9272, October 2002.
Nickell, S.J. (1996), ‘Competition and corporate performance’, Journal of Political
Economy, Volume 104, No.4, p.724-746.
OECD (2012), “New Sources of Growth Knowledge-Based Capital Driving
Investment
and Productivity in the 21st Century: interim project findings”.
Olley, G. Steven, and Ariel Pakes. 1996. “The dynamics of productivity in the
telecommunications equipment industry.” Econometrica, 64(6): 1263-1297.
Petrin, A. en J. Levinsohn (2005), ‘Measuring aggregate productivity growth using
plant-level data’, NBER Working Paper 11887.
Pilat, D. (2004), “The ICT productivity paradox: insights from micro data”, OECD
Economic Studies No. 38, 2004/1.
Polder, Michael, Leeuwen, George van, Mohnen, Pierre, Raymond, Wladimir
(2010),. "Product, process and organizational innovation: drivers, complementarity
and productivity effects," UNU-MERIT Working Paper Series 035, United Nations
University, Maastricht Economic and social Research and training centre on
Innovation and Technology.
Polder, Michael, Erik Veldhuizen, Dirk van den Bergen and Eugène van der Pijll
(2010), “Micro and macro indicators of competition: comparison and relation with
productivity change”, Statistika, no. 5, pp. 403-427

Determinants of productivity 45
Sianesi, B. and Van Reenen, J. (2003). ‘Education and Economic Growth: A Review
of the Literature’. Journal of Economic Surveys, 17(2): 157-200.
Spiezia, V. (2011), “Are ICT Users More Innovative? An Analysis of ICT-Enabled
Innovation in OECD Firms”, OECD Journal: Economic Studies Volume 2011.
Stiroh, K. J. (2004). ‘Reassessing the Impact of IT in the Production Function: A
Metaanalysis and Sensitivity Tests’. Mimeo, New York Federal Reserve.
Syverson, C. (2011), “What determines productivity”, Journal of Economic
Literature, vol. XLIX, pp. 326-365.
Van Ark, B. (2001), “The Renewal of the Old Economy: Europe in an Internationally
Comparative Perspective”, OECD STI Working Paper, no. 2001/5
Van Ark, B., R. Inklaar, R.H. McGuckin (2003), “ICT and productivity in Europe and
the United States: Where do the differences come from?”, working paper, The
Conference Board.
Van Ark, Bart, Mary O’Mahony, and Marcel P. Timmer. 2008. “The Productivity Gap
between Europe and the United States: Trends and Causes.” Journal of Economic
Perspectives, 22(1): 25-44.
Van Der Wiel, H. and G. Van Leeuwen (2001), “Do ICT spillovers matter?”, CPB
Discussion Paper No. 26.
Van Der Wiel, H. and G. Van Leeuwen (2004), “ICT and productivity”, in ‘Fostering
Productivity: Patterns, Determinants and Policy Implications’, Contributions to
Economic Analysis, no. 263, 2004, Elsevier Publishers, Amsterdam.
Wiel, H. van der, H. Creusen, G. van Leeuwen and E. van der Pijll, 2008, Cross your
border and look around, CPB Document 170, CPB & Statistics Netherlands.
Van Leeuwen, George, and Luuk Klomp. 2006. “On the contribution of innovation to
multi-factor productivity growth.” Economics of Innovation and New Technology,
15: 367-390.
Van Leeuwen, G. and M. Polder (2012), “E-business Systems and Productivity:
Using Distributed Micro Data Analysis (DMD) for exploring the link between ICT
related Innovation Adoption and Productivity”, paper presented at the final
conference of the ESSLimit project at IPTS/JRC, Sevilla, October 2012.

Determinants of productivity 46
Van Reenen, J., N. Bloom, Draca, M., T. Kretschmer, and R. Sadun (2010), “The
Economic Impact of ICT: Final Report”, London School of Economics.
Veugelers R. (2012), “New ICT sectors: platforms for European growth?”, Bruegel
Policy Contribution, Issue 2012/14.
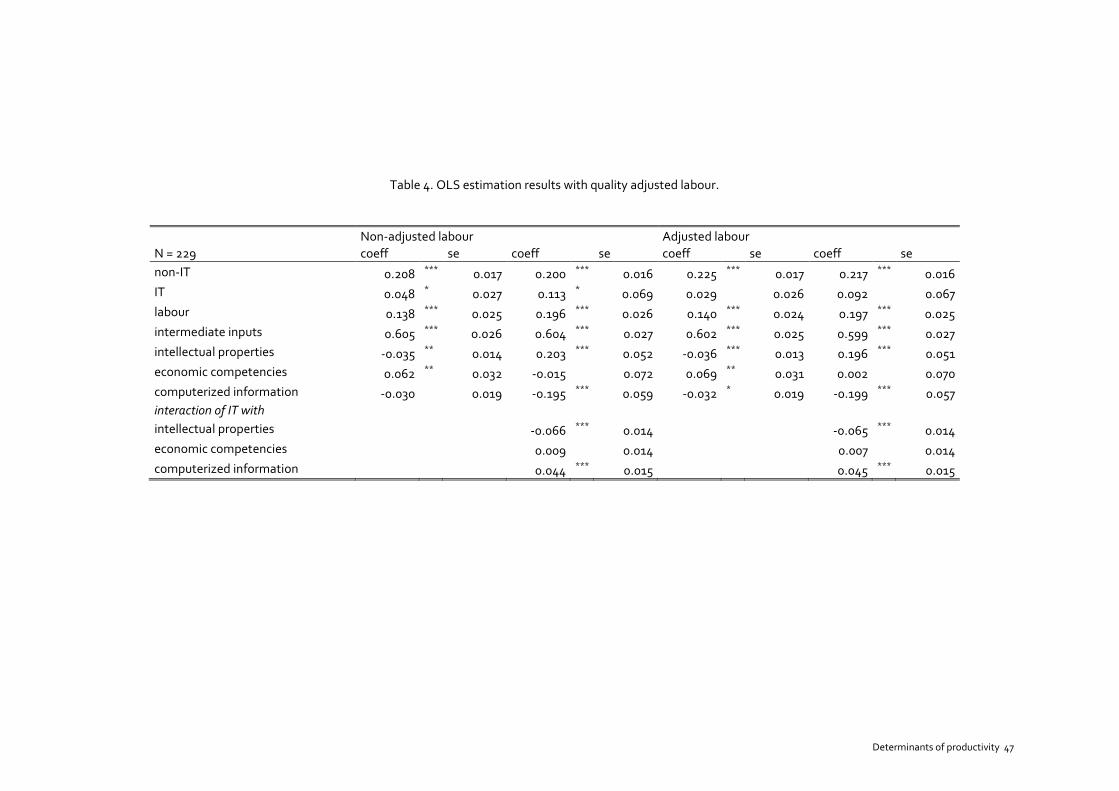
Determinants of productivity 47
Table 4. OLS estimation results with quality adjusted labour.
Non-adjusted labour Adjusted labour
N = 229 coeff
se coeff
se coeff
se coeff
se
non-IT 0.208 ***
0.017 0.200 ***
0.016 0.225 ***
0.017 0.217 ***
0.016
IT 0.048 * 0.027 0.113
* 0.069 0.029
0.026 0.092
0.067
labour 0.138 ***
0.025 0.196 ***
0.026 0.140 ***
0.024 0.197 ***
0.025
intermediate inputs 0.605 ***
0.026 0.604 ***
0.027 0.602 ***
0.025 0.599 ***
0.027
intellectual properties -0.035 **
0.014 0.203 ***
0.052 -0.036 ***
0.013 0.196 ***
0.051
economic competencies 0.062 **
0.032 -0.015
0.072 0.069 **
0.031 0.002
0.070
computerized information -0.030
0.019 -0.195 ***
0.059 -0.032 * 0.019 -0.199
*** 0.057
interaction of IT with
intellectual properties
-0.066
*** 0.014
-0.065
*** 0.014
economic competencies
0.009
0.014
0.007
0.014
computerized information
0.044
*** 0.015
0.045
*** 0.015
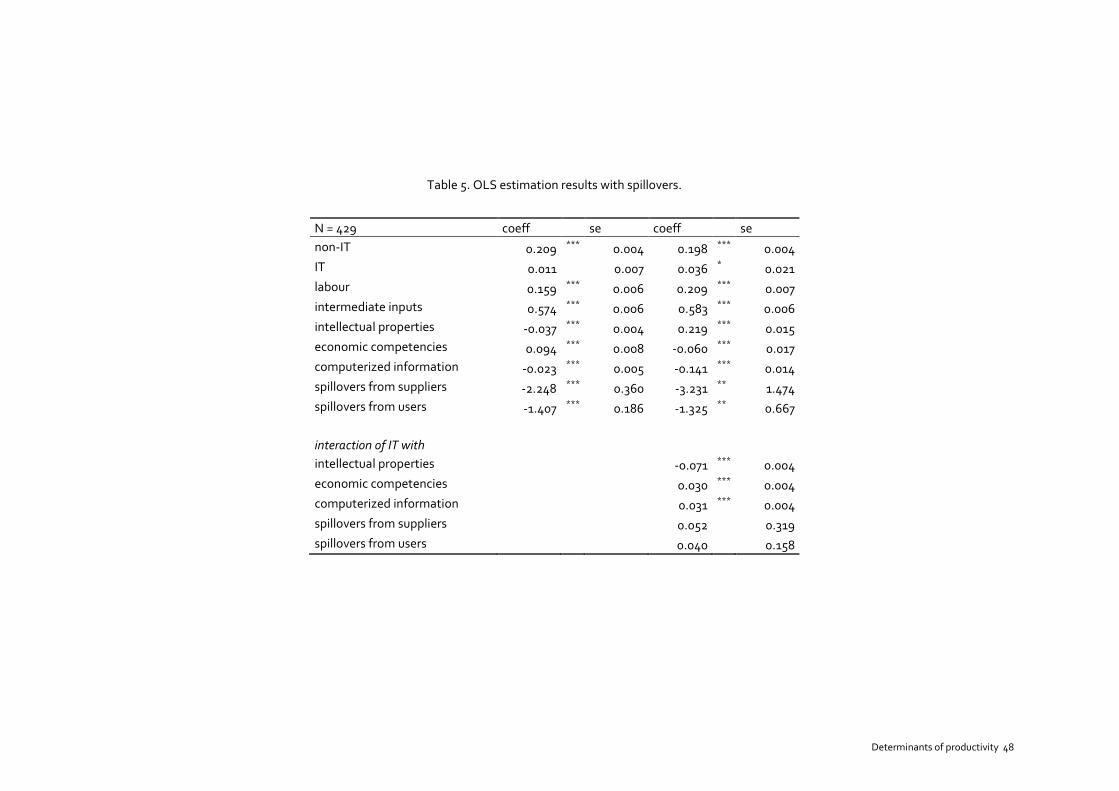
Determinants of productivity 48
Table 5. OLS estimation results with spillovers.
N = 429 coeff
se coeff
se
non-IT 0.209 ***
0.004 0.198 ***
0.004
IT 0.011
0.007 0.036 * 0.021
labour 0.159 ***
0.006 0.209 ***
0.007
intermediate inputs 0.574 ***
0.006 0.583 ***
0.006
intellectual properties -0.037 ***
0.004 0.219 ***
0.015
economic competencies 0.094 ***
0.008 -0.060 ***
0.017
computerized information -0.023 ***
0.005 -0.141 ***
0.014
spillovers from suppliers -2.248 ***
0.360 -3.231 **
1.474
spillovers from users -1.407 ***
0.186 -1.325 **
0.667
interaction of IT with
intellectual properties
-0.071
*** 0.004
economic competencies
0.030
*** 0.004
computerized information
0.031
*** 0.004
spillovers from suppliers
0.052
0.319
spillovers from users
0.040
0.158

Determinants of productivity 49
Table 6. OLS estimation results with competition.
N = 429 coeff
se coeff
se coeff
se coeff
se
non-IT -0.034 ***
0.005 -0.032 ***
0.005 0.190 ***
0.018 0.012
0.030
IT 0.040 ***
0.005 -0.023
0.014 -0.127 ***
0.039 0.105 ***
0.033
labour 0.334 ***
0.005 0.365 ***
0.006 0.225 ***
0.028 0.259 ***
0.031
intermediate inputs 0.755 ***
0.005 0.740 ***
0.005 0.398 ***
0.031 0.782 ***
0.026
intellectual properties -0.007 ***
0.003 0.112 ***
0.012 0.008
0.019 -0.048 ***
0.012
economic competencies -0.039 ***
0.006 -0.109 ***
0.012 0.131 ***
0.032 -0.055
0.034
computerized information -0.038 ***
0.004 -0.144 ***
0.010 0.069 **
0.028 -0.033
0.020
competition -1.173 ***
0.019 -1.187 ***
0.003
interaction of IT with
intellectual properties
-0.033
*** 0.003
economic competencies
0.013
*** 0.003
computerized information
0.029
*** 0.039
competition
0.020
0.013

Determinants of productivity 50
Table 7. Estimation results for SYS-GMM estimation (Blundell-Bond).
N = 396 Gross-output Value added
coeff
se coeff
se coeff
se coeff
se
non-IT capital 0.114 ***
0.026 0.096 ***
0.026 0.213 ***
0.076 0.045
0.078
IT capital 0.116 ***
0.009 0.112 ***
0.033 0.047 **
0.020 0.049
0.082
labour 0.074 ***
0.025 0.142 ***
0.026 0.417 ***
0.063 0.551 ***
0.079
intermediate inputs 0.754 ***
0.025 0.734 ***
0.022
intellectual property 0.037 ***
0.014 -0.010
0.016 0.027
0.045 0.078 * 0.047
economic competencies -0.054 **
0.021 0.109 ***
0.029 0.030
0.051 0.154 **
0.071
computerized information 0.002
0.004 -0.019
0.012 0.041 ***
0.011 -0.033
0.026
IT capital x IP
0.015 ***
0.004
0.002
0.013
IT capital x EC
-0.029 ***
0.005
0.034 ***
0.011
IT capital x CI
0.009 ***
0.005
0.033 ***
0.011
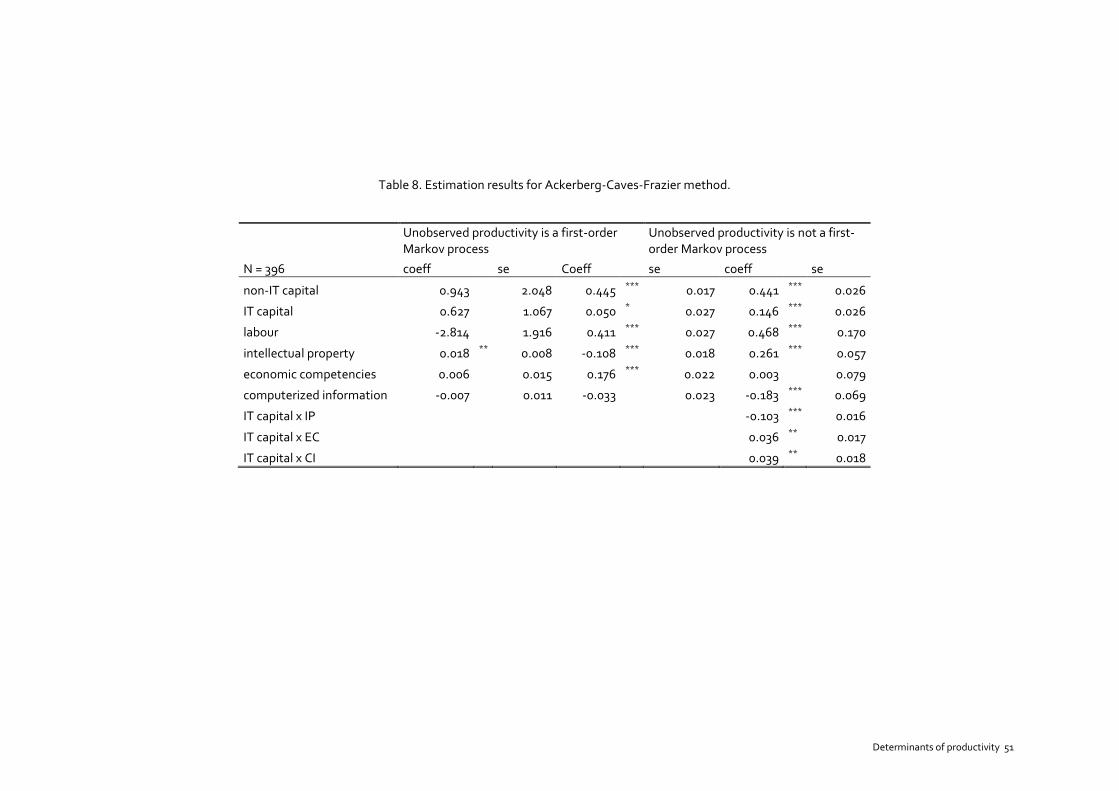
Determinants of productivity 51
Table 8. Estimation results for Ackerberg-Caves-Frazier method.
Unobserved productivity is a first-order Markov process
Unobserved productivity is not a first-order Markov process
N = 396 coeff
se Coeff
se coeff
se
non-IT capital 0.943
2.048 0.445 ***
0.017 0.441 ***
0.026
IT capital 0.627
1.067 0.050 * 0.027 0.146
*** 0.026
labour -2.814
1.916 0.411 ***
0.027 0.468 ***
0.170
intellectual property 0.018 **
0.008 -0.108 ***
0.018 0.261 ***
0.057
economic competencies 0.006
0.015 0.176 ***
0.022 0.003
0.079
computerized information -0.007
0.011 -0.033
0.023 -0.183 ***
0.069
IT capital x IP
-0.103 ***
0.016
IT capital x EC
0.036 **
0.017
IT capital x CI
0.039 **
0.018