determinants of labor productivity
TRANSCRIPT
1
Determinants of Labor Productivity: An Empirical Investigation of Productivity Divergence
(Misbah Tanveer Choudhry) University of Groningen The Netherlands February 2009 Abstract: This paper investigates the determinants of labor productivity growth using a cross country panel data set of 45 countries for the period of 1980-2005. The results reveal the positive and significant role of education, ICT investment, financial depth and FDI for labor productivity growth. However, increase in labor force participation, employment in agriculture sector and price volatility impacts the productivity growth negatively. On the basis of long term structural determinants, we find that divergence in labor productivity across different income groups and regions can be explained by diversity in ICT investment, human capital, financial depth and employment distribution in different sectors. JEL Classifications: C22, C23, O47 Keywords: labour productivity growth, labour force participation, panel fixed effects
Corresponding author: Misbah Tanveer Choudhry ,University of Groningen, Department of Economics and
Econometrics, Faculty of Economics & Business, P.O. Box 800, 9700 AV, Groningen, The Netherlands,
phone: +31 50 363 6315, e-mail: [email protected].
2
I: Introduction:
This study intends to identify the potential determinants of labor productivity for
developing and emerging economies belonging to different income groups. There are
studies in literature which focused on the same question (Bourles et al 2007, Belorgey et
al, 2006 and Gust and Marquez 2004),But these studies mainly investigate the impact of
information and communication technology development for productivity growth for the
panel of highly developed economies. Their main aim is to explain the productivity
differential between Europe and US. Moreover most of above mentioned studies covered
the period of 1992-2001. There are various countries specific case studies exploring the
determinant of labor productivity growth in a particular country (Dixon and Macdonald
1992, Brandolini et al 2001 and Rice et al 2006).Our focus is not just on the role of ICT
for labor productivity growth but also on other socio economic indicators which are
essential for labor productivity growth. Moreover we are interested in exploring the
factors behind the productivity differential across different groups of countries and
regions in the world.
In this study we use the cross country panel of 45 countries to find out the determinants
of labor productivity (output per worker) during the time period of 1980-2005. Our
hypothesis is that different explanatory variables behave in a different manner for the
economies belonging to different income groups. To empirically test this hypothesis we
applied the cross country fixed effects panel estimation approach on annual data for the
period of 1980-2005.
We find that the increase in labor force participation rate impacts the labor productivity
growth negatively and confirms the diminishing returns. There is presence of conditional
“convergence” in our sample countries. We also find that role of ICT investment in labor
productivity growth is positive and significant in short run as well as in long run.
Empirical analysis by different income groups showed that in lower and middle income
3
economies the impact of urbanization is positive while it is not significant for high
income group economies. Similarly, impact of openness and gross capital formation is
not same for all income groups. Long term structural analysis of determinants of apparent
labor productivity levels in 2005, emphasize on the role of human capital, financial sector
development, stable macroeconomic indicators, ICT investment and employment
distribution in different sectors of the economy.
Our findings suggest that factors which are mainly responsible for poor labor productivity
performance in developing and lower income economies of south Asia and Africa are
high share of employment in agriculture sector, low ICT expenditure, low level of
education, high inflation rate and low financial development.
Our findings confirm that labor productivity diversity between Europe and USA can be
explained by low ICT investment, education level and financial depth in Europe as
compared to US. The comparison between Europe and Eastern European countries show
that low level of labor productivity in Eastern Europe is explained by low level of ICT
investment, high share of agricultural employment; high inflation and low level of
financial depth and FDI as compared to European economies.
This paper will proceed in a following manner. Section II discusses the labor productivity
growth across countries and regions during the period of 1980-2005. Empirical
estimation of potential determinant of labor productivity growth is examined in section
III. Section IV is about the estimation of long run structural determinants of labor
productivity level in 2005. In section V, we apply the findings of our long run
determinants of labor productivity to figure out the factors responsible for differential in
labor productivity across regions. Finally the last section presents summary of findings
and suggests policy measures to boost the labor productivity in low income developing
economies.
4
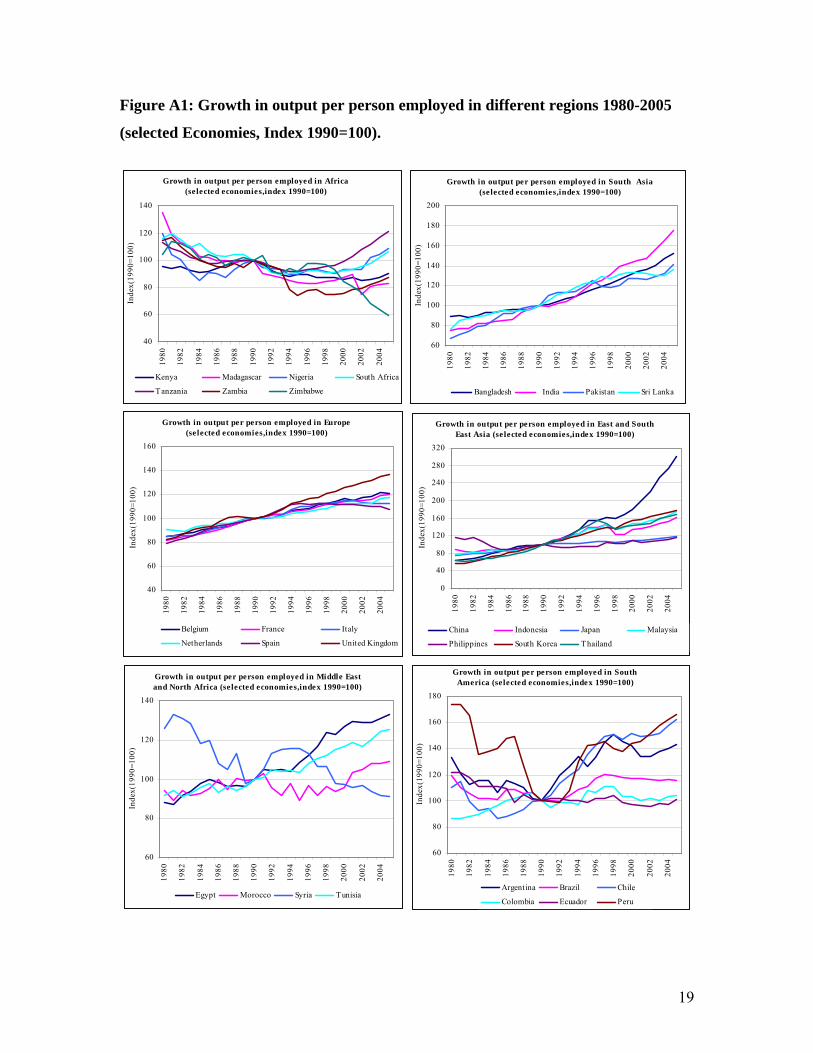
II: Examining Labor Productivity across Regions:
In this section, we present the labor productivity growth across different regions for the
period of 1980-2005. There is a divergence in productivity growth among different
regions of the world. Although the productivity growth varies across different regions,
but within the regions, there is reasonable diversity with regard to productivity growth. In
South America, Chile showed impressive and consistent increase in labor productivity.
Peru also performed well but Ecuador performance remained poor and its productivity
level in 2005 is lower than in 1980s. Other economies like Brazil, Colombia have seen
slight increase in productivity over the last decade. In south east and East Asian region,
all selected economies registered increase in productivity level during 1990s.
In East Asia; all economies in region were more or less on equal growth path until 1993,
after that China productivity growth increased more rapidly than other economies. Korea
also performed well but rapid increase in China’s productivity can be attributed to
catching up with other economies in the region as China has lower initial productivity
level in the region. In south East Asia, there has been an upward trend in productivity
since 1990 but that was at moderate pace .i.e. slower than other Asian sub region and
more than from developing economies see figure P1 in appendix.
South Asian region has seen improvement in terms of productivity growth since 1990.
The productivity levels vary considerably between countries. India has managed to
increase its output very fast compared to Pakistan, Sri Lanka and Bangladesh .India
manage to increase output produced by per person employed by more than 75 percent
during 1990-2005. Pakistan and Sri Lanka started well in early 1990s but than in late
1990s entered into period of productivity decline. Pakistan revived again but Sri Lanka’s
productivity has stagnated since 1998. Bangladesh showed slow and gradual increase in
labor productivity during the same time period.
5
In Middle East and North Africa, labor productivity in selected economies showed
mixed trends. There has been steady upward trend in Egypt and Tunisia, a declining trend
in Syria since 1998 and volatile pattern in Morocco. Africa is the only region that had
seen decrease in labor productivity since 1990. Productivity level in 2005 is lower than in
1980. Only Tanzania, Nigeria and South Africa showed slight increase in productivity
level after 2001.
III: Empirical Estimation:
To find out the main determinant of labor productivity in developing and emerging
economies during 1980-2005, we estimated the following model for a cross country panel
of 45 countries belonging to different income group economies see table A1 for sample
countries list.
εβββββββα ititititititititititi UrbFDIGCFInfICTipeyPartLP +++++++++= ∂7654321,
Where i represent country and t is time period. LP denotes the labor productivity growth,
measured as GDP per employed person; Part is change in labor force participation
measured as ratio of employed labor force to total population. , ipey is an initial level of
labor productivity in an economy. ICT is information and communication technology
expenditure as percentage of GDP, Inf is inflation rate, GCF is gross capital formation,
FDI is foreign direct investment and Urb is percentage of urban population in total
population. ∂it is country specific fixed effects. These fixed effects allows for different
labor market institutions and cultural and social norms across countries. The detailed
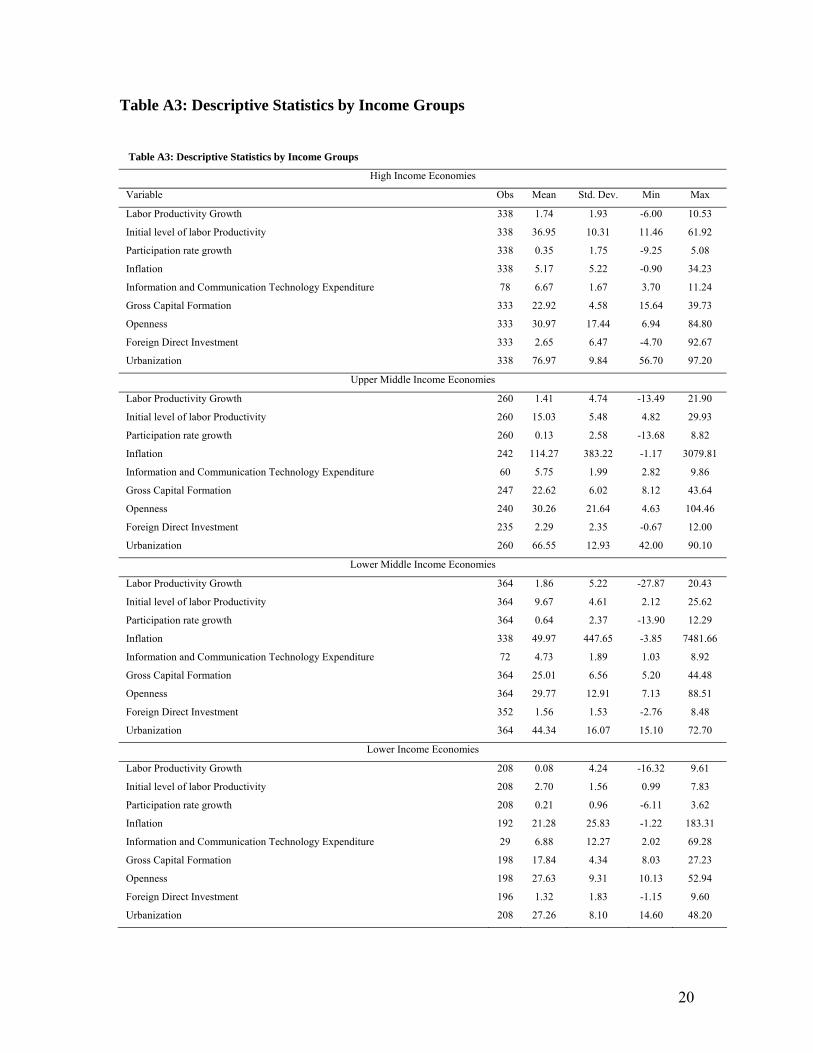
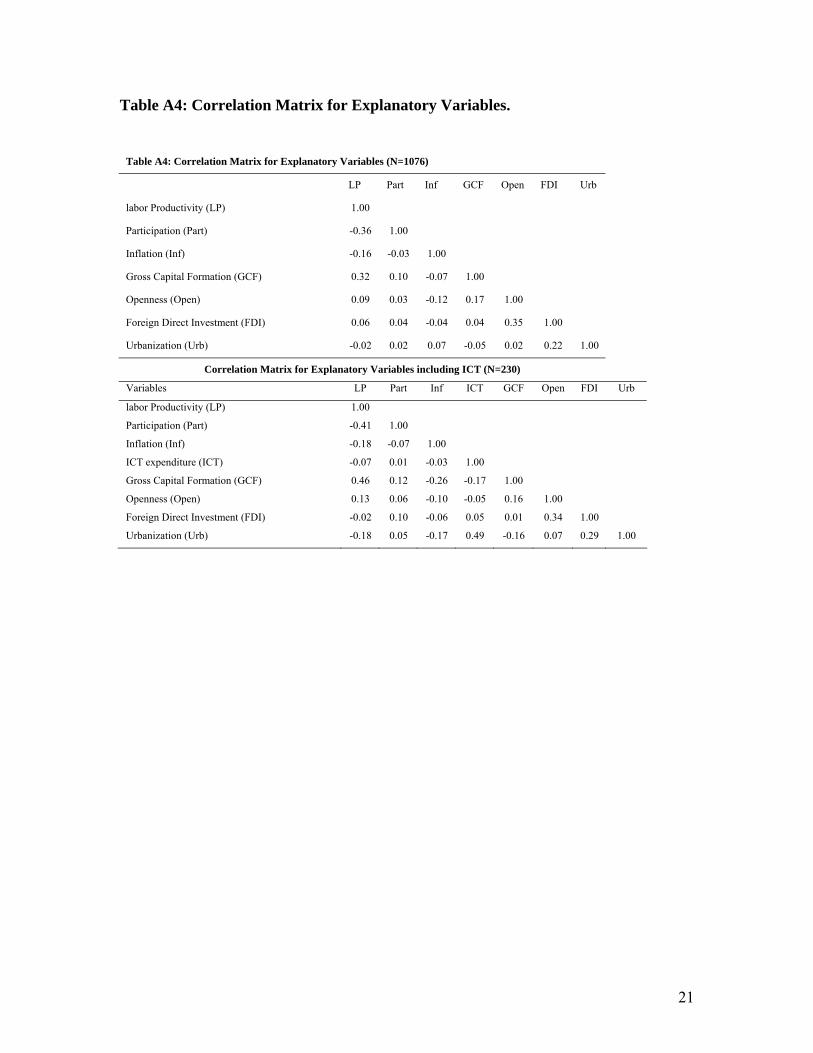
description and source of data set is presented in table A2 in appendix. Descriptive
statistics of data by income group and correlation matrix between different explanatory
variables is also presented in table A3 and A4 in appendix.
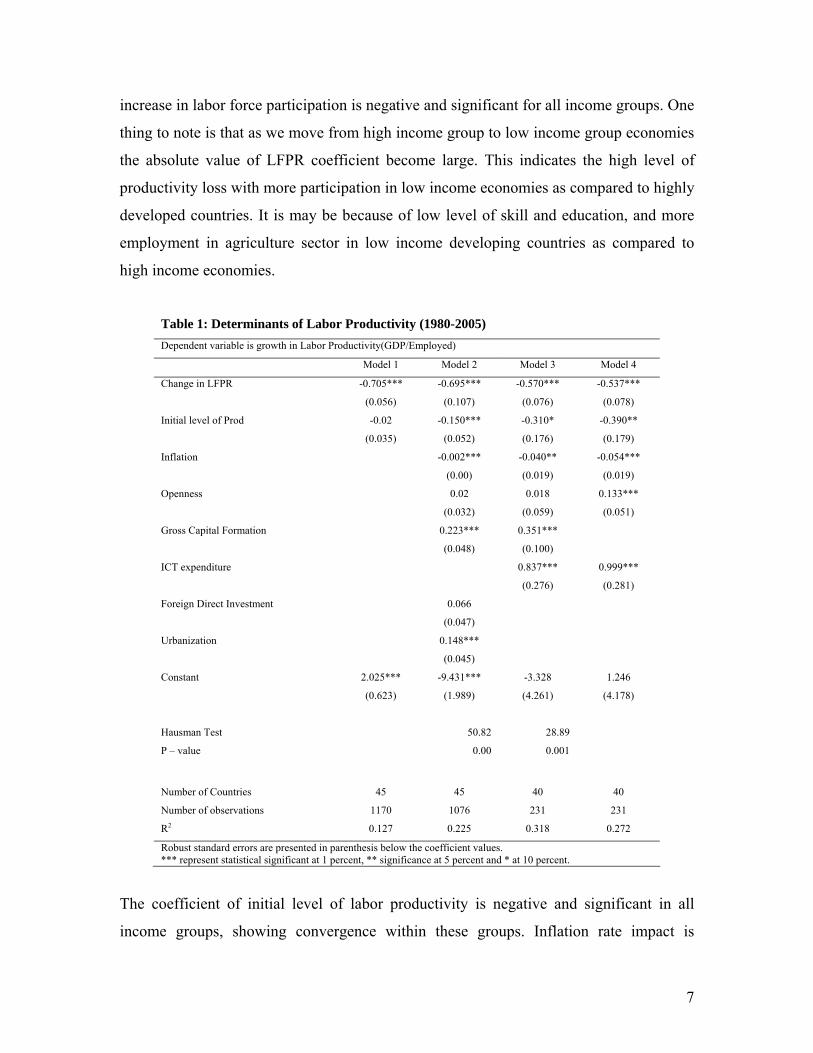
We estimated this model by using fixed effects panel approach and results are presented
in table 1. In first column, we look at the impact of increase in labor force participation
rate on labor productivity. The impact is significant and negative as expected as it reflects
6
the entry of unskilled and inexperienced labors in the workforce. In model 2, we
introduced more explanatory variables in our estimated model which can affect the labor
productivity growth. The inclusion of these explanatory variables for testing their impact
on labor productivity growth is justified in literature by Levine and Renelt (1992),
Mankiv et al (1992) and Barro and Sala-i-Martin (1995).
We find that initial labor productivity variable is significant and negative which reflects
the conditional convergence in per capita productivity growth in our sample countries.
The impact of urbanization, foreign direct investment and gross capital formation is
positive and significant. The high level of urbanization in an economy reflects that
employed people are more engaged in non farm activities. Most probably they are
working in services or industrial sectors which are suppose to be sectors with high labor
productivity as compared to agriculture sector (high underemployment in agriculture).
We will check the impact of employment in different sectors on labor productivity in
next section of this paper. Inflation rate coefficient is negative and significant as price
volatility in an economy leads to low investment and economic growth.
The role of ICT for labor productivity growth is captured by the ICT expenditure as
percentage of GDP. The data for this variable is not available for all economies in our
sample and is available from 2000 onward. As a result one can notice the significant
change in number of observations in model 3. The impact of ICT is positive and
significant1 .This finding is in consonance with previous studies findings (Oliner and
Sichel 2002, Roeger 2001 and Gust and Marquez 2004). In the last specification in
model 4, we exclude the variable of gross capital formation from the model as it may also
include the investment on ICT. The results remain the same.
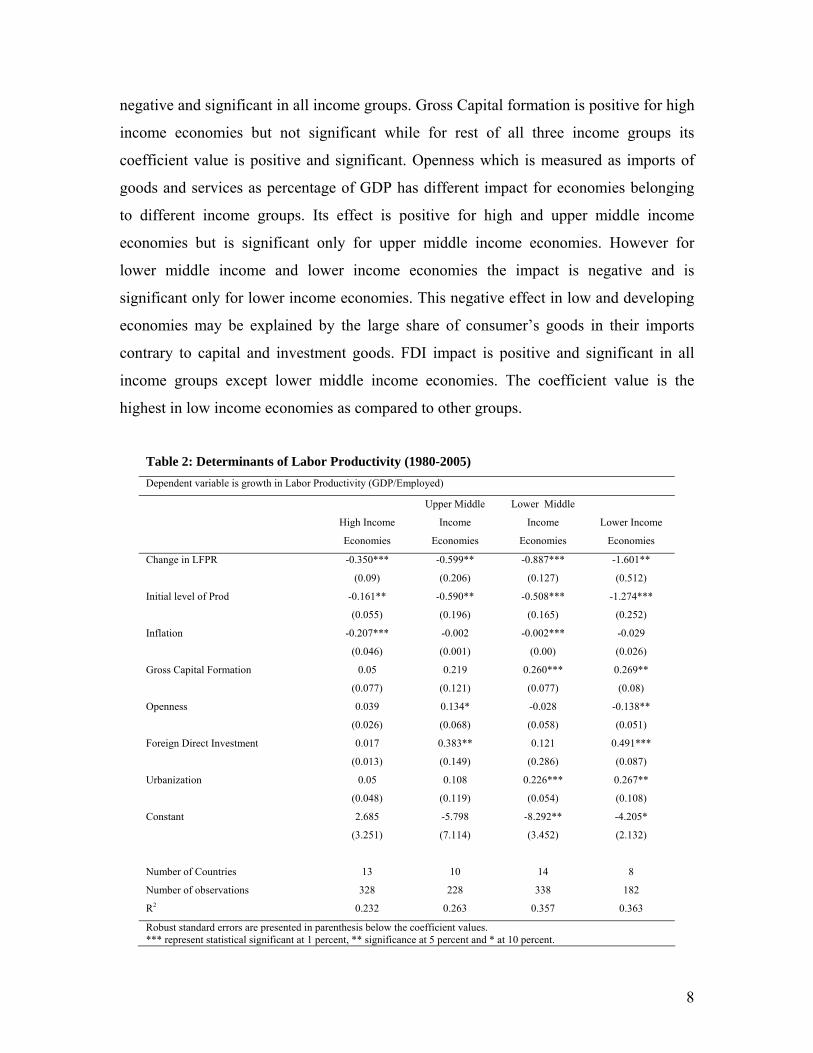
To test whether these explanatory variables behave differently for the economies at
different stage of economic development, we re-estimate the same model but now for
economies belonging to different income groups see table 2. We find that the impact of
1 We are used other ICT indicators (Hardware investment, software investment) in place of ICT expenditure to check the robustness of its role. The results remain the same.
7
increase in labor force participation is negative and significant for all income groups. One
thing to note is that as we move from high income group to low income group economies
the absolute value of LFPR coefficient become large. This indicates the high level of
productivity loss with more participation in low income economies as compared to highly
developed countries. It is may be because of low level of skill and education, and more
employment in agriculture sector in low income developing countries as compared to
high income economies.
The coefficient of initial level of labor productivity is negative and significant in all
income groups, showing convergence within these groups. Inflation rate impact is
Table 1: Determinants of Labor Productivity (1980-2005) Dependent variable is growth in Labor Productivity(GDP/Employed) Model 1 Model 2 Model 3 Model 4
Change in LFPR -0.705*** -0.695*** -0.570*** -0.537***
(0.056) (0.107) (0.076) (0.078)
Initial level of Prod -0.02 -0.150*** -0.310* -0.390**
(0.035) (0.052) (0.176) (0.179)
Inflation -0.002*** -0.040** -0.054***
(0.00) (0.019) (0.019)
Openness 0.02 0.018 0.133***
(0.032) (0.059) (0.051)
Gross Capital Formation 0.223*** 0.351***
(0.048) (0.100)
ICT expenditure 0.837*** 0.999***
(0.276) (0.281)
Foreign Direct Investment 0.066
(0.047)
Urbanization 0.148***
(0.045)
Constant 2.025*** -9.431*** -3.328 1.246
(0.623) (1.989) (4.261) (4.178)
Hausman Test 50.82 28.89
P – value 0.00 0.001
Number of Countries 45 45 40 40
Number of observations 1170 1076 231 231
R2 0.127 0.225 0.318 0.272
Robust standard errors are presented in parenthesis below the coefficient values. *** represent statistical significant at 1 percent, ** significance at 5 percent and * at 10 percent.
8
negative and significant in all income groups. Gross Capital formation is positive for high
income economies but not significant while for rest of all three income groups its
coefficient value is positive and significant. Openness which is measured as imports of
goods and services as percentage of GDP has different impact for economies belonging
to different income groups. Its effect is positive for high and upper middle income
economies but is significant only for upper middle income economies. However for
lower middle income and lower income economies the impact is negative and is
significant only for lower income economies. This negative effect in low and developing
economies may be explained by the large share of consumer’s goods in their imports
contrary to capital and investment goods. FDI impact is positive and significant in all
income groups except lower middle income economies. The coefficient value is the
highest in low income economies as compared to other groups.
Table 2: Determinants of Labor Productivity (1980-2005) Dependent variable is growth in Labor Productivity (GDP/Employed)
High Income
Economies
Upper Middle
Income
Economies
Lower Middle
Income
Economies
Lower Income
Economies
Change in LFPR -0.350*** -0.599** -0.887*** -1.601**
(0.09) (0.206) (0.127) (0.512)
Initial level of Prod -0.161** -0.590** -0.508*** -1.274***
(0.055) (0.196) (0.165) (0.252)
Inflation -0.207*** -0.002 -0.002*** -0.029
(0.046) (0.001) (0.00) (0.026)
Gross Capital Formation 0.05 0.219 0.260*** 0.269**
(0.077) (0.121) (0.077) (0.08)
Openness 0.039 0.134* -0.028 -0.138**
(0.026) (0.068) (0.058) (0.051)
Foreign Direct Investment 0.017 0.383** 0.121 0.491***
(0.013) (0.149) (0.286) (0.087)
Urbanization 0.05 0.108 0.226*** 0.267**
(0.048) (0.119) (0.054) (0.108)
Constant 2.685 -5.798 -8.292** -4.205*
(3.251) (7.114) (3.452) (2.132)
Number of Countries 13 10 14 8
Number of observations 328 228 338 182
R2 0.232 0.263 0.357 0.363
Robust standard errors are presented in parenthesis below the coefficient values. *** represent statistical significant at 1 percent, ** significance at 5 percent and * at 10 percent.
9
We also have applied the dynamic panel GMM model to capture the impact of any
endogeneity and measurement error in the model. The results remain very similar. We
choose to go further in our analysis with the fixed effects panel model because otherwise
it would not be possible to do analysis by income groups because of small sample size in
different categories.
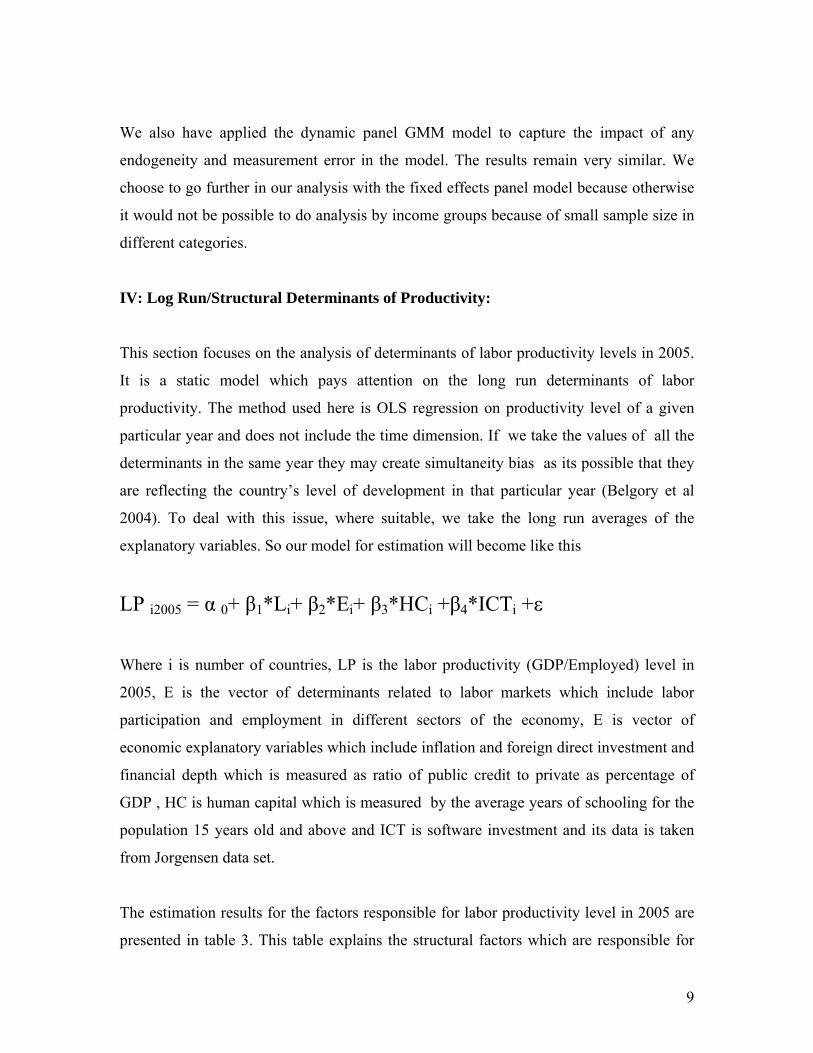
IV: Log Run/Structural Determinants of Productivity:
This section focuses on the analysis of determinants of labor productivity levels in 2005.
It is a static model which pays attention on the long run determinants of labor
productivity. The method used here is OLS regression on productivity level of a given
particular year and does not include the time dimension. If we take the values of all the
determinants in the same year they may create simultaneity bias as its possible that they
are reflecting the country’s level of development in that particular year (Belgory et al
2004). To deal with this issue, where suitable, we take the long run averages of the
explanatory variables. So our model for estimation will become like this
LP i2005 = α 0+ β1*Li+ β2*Ei+ β3*HCi +β4*ICTi +ε
Where i is number of countries, LP is the labor productivity (GDP/Employed) level in
2005, E is the vector of determinants related to labor markets which include labor
participation and employment in different sectors of the economy, E is vector of
economic explanatory variables which include inflation and foreign direct investment and
financial depth which is measured as ratio of public credit to private as percentage of
GDP , HC is human capital which is measured by the average years of schooling for the
population 15 years old and above and ICT is software investment and its data is taken
from Jorgensen data set.
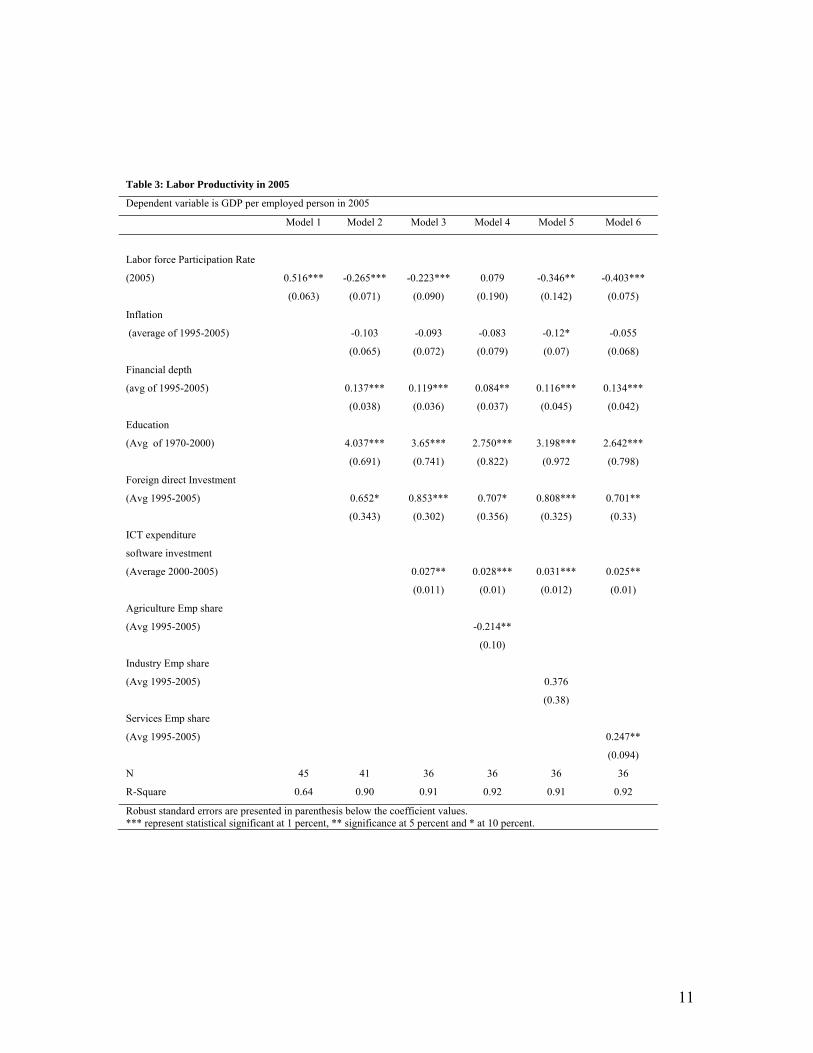
The estimation results for the factors responsible for labor productivity level in 2005 are
presented in table 3. This table explains the structural factors which are responsible for

10
the difference in productivity level among 40 countries belonging to different income
groups and regions in the world. Results in table 2 shows the labor market indicators are
very important in determining the difference in labor productivity .Labor force
participation rate impact is negative as we already found in panel analysis. Moreover, the
high share of employment in agriculture is responsible for low level of labor productivity.
Negative impact of agricultural employment on labor productivity explains the low level
labor productivity in case of most developing and low income economies from South
Asia and Africa. Industrial’s employment impact is positive but not significant and high
employment in services sector leads to high productivity, as an implication of this finding
we can see that in most developed economies and European region, services sector is
responsible for more than 2/3rd of total employment.
Impact of education is positive and significant and explains reasonable share of
differences in productivity between high income economies and low income economies.
A country’s economic indicators emerge as significant determinants of labor
productivity; inflation has negative impact on productivity as it raises the uncertainty
level in economy and which hinders investment, financial depth has positive and
significant impact on labor productivity as it promotes efficient allocation of financial
resources in productive channels, and foreign direct investment measured by net inflows
of foreign capital has positive significant impact on productivity level. As FDI has not
only direct effects through inflow of capital but also has spillover by bringing modern
technology and providing training to domestic labor force in host country.
Impact of average ICT spending measured by average software investment during 1990-
2005, is positive and significant. We also used average per capita ICT expenditure and
hardware investment as a proxy for contribution made by ICT, results remain the same.
ICT role in labor productivity is significant and positive and is responsible for
productivity differences across countries.
11
Table 3: Labor Productivity in 2005
Dependent variable is GDP per employed person in 2005
Model 1 Model 2 Model 3 Model 4 Model 5 Model 6
Labor force Participation Rate
(2005) 0.516*** -0.265*** -0.223*** 0.079 -0.346** -0.403***
(0.063) (0.071) (0.090) (0.190) (0.142) (0.075)
Inflation
(average of 1995-2005) -0.103 -0.093 -0.083 -0.12* -0.055
(0.065) (0.072) (0.079) (0.07) (0.068)
Financial depth
(avg of 1995-2005) 0.137*** 0.119*** 0.084** 0.116*** 0.134***
(0.038) (0.036) (0.037) (0.045) (0.042)
Education
(Avg of 1970-2000) 4.037*** 3.65*** 2.750*** 3.198*** 2.642***
(0.691) (0.741) (0.822) (0.972 (0.798)
Foreign direct Investment
(Avg 1995-2005) 0.652* 0.853*** 0.707* 0.808*** 0.701**
(0.343) (0.302) (0.356) (0.325) (0.33)
ICT expenditure
software investment
(Average 2000-2005) 0.027** 0.028*** 0.031*** 0.025**
(0.011) (0.01) (0.012) (0.01)
Agriculture Emp share
(Avg 1995-2005) -0.214**
(0.10)
Industry Emp share
(Avg 1995-2005) 0.376
(0.38)
Services Emp share
(Avg 1995-2005) 0.247**
(0.094)
N 45 41 36 36 36 36
R-Square 0.64 0.90 0.91 0.92 0.91 0.92
Robust standard errors are presented in parenthesis below the coefficient values. *** represent statistical significant at 1 percent, ** significance at 5 percent and * at 10 percent.
12
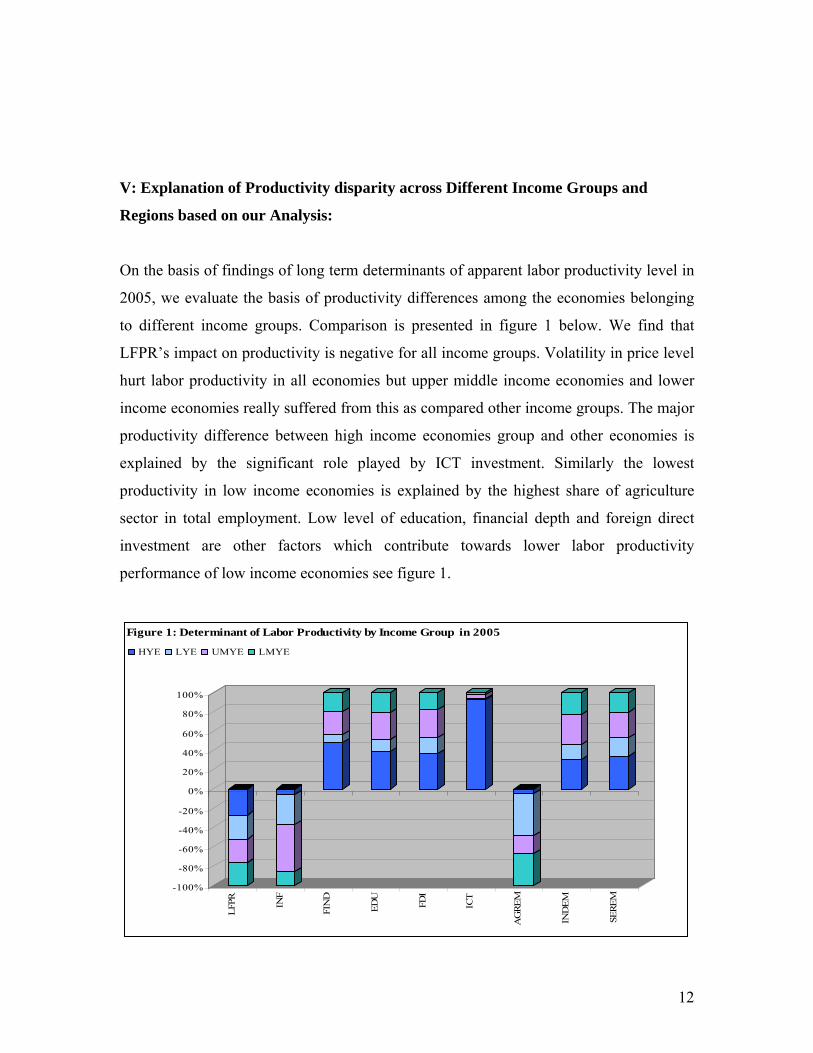
V: Explanation of Productivity disparity across Different Income Groups and
Regions based on our Analysis:
On the basis of findings of long term determinants of apparent labor productivity level in
2005, we evaluate the basis of productivity differences among the economies belonging
to different income groups. Comparison is presented in figure 1 below. We find that
LFPR’s impact on productivity is negative for all income groups. Volatility in price level
hurt labor productivity in all economies but upper middle income economies and lower
income economies really suffered from this as compared other income groups. The major
productivity difference between high income economies group and other economies is
explained by the significant role played by ICT investment. Similarly the lowest
productivity in low income economies is explained by the highest share of agriculture
sector in total employment. Low level of education, financial depth and foreign direct
investment are other factors which contribute towards lower labor productivity
performance of low income economies see figure 1.
-100%
-80%
-60%
-40%
-20%
0%
20%
40%
60%
80%
100%
LFPR IN
F
FIN
D
EDU
FDI
ICT
AG
REM
IND
EM
SERE
M
Figure 1: Determinant of Labor Productivity by Income Group in 2005
HYE LYE UMYE LMYE
13
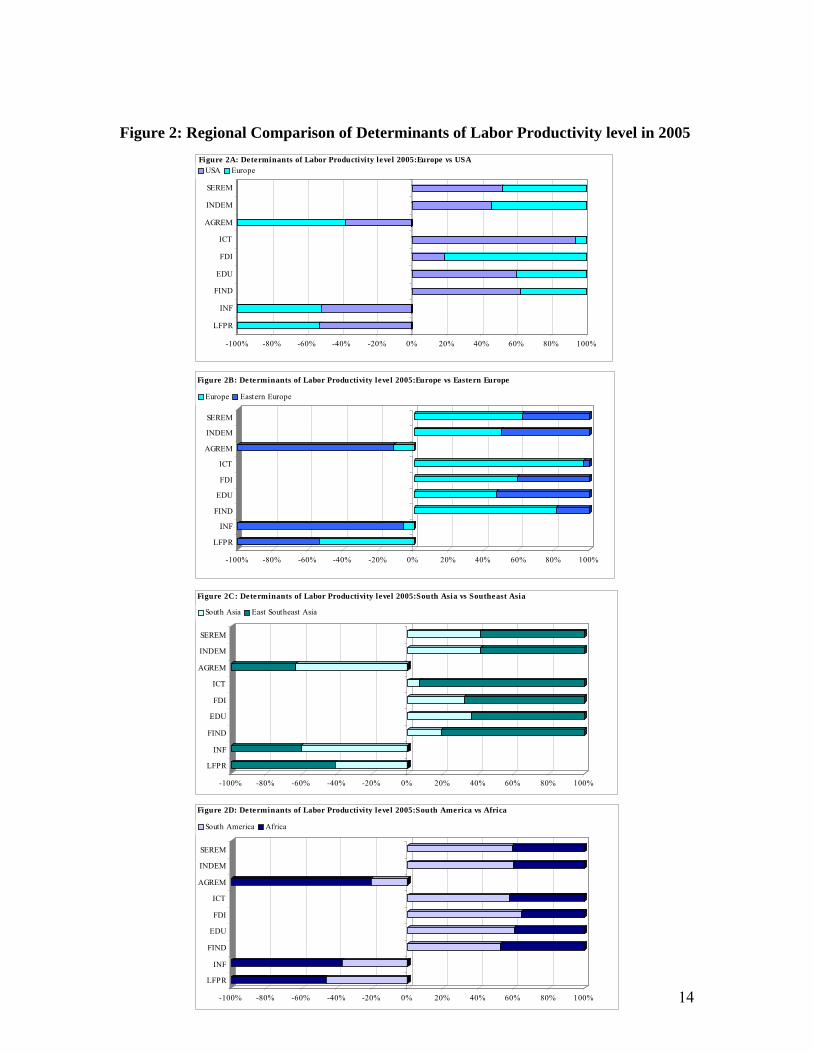
The regional level comparisons highlight some interesting facts further.
The most discussed topic in literature is the difference in labor Productivity
performance between United States and Europe (Netherlands, Spain, France,
Belgium, Italy and United Kingdom). Our analysis of long term determinants of
labor productivity shows that major contribution towards productivity difference
between them is explained by the ICT investment. These findings are in
consonance with findings in literature (Bart et al 2003, Belorgy et al 2006, and
Jorgenson 2007). Financial depth, education and employment in different sectors
are other important factors which explain the differences in labor productivity
between United States and Europe see figure 2A.
The comparison between Europe and Eastern European countries show that low
level of labor productivity in Eastern Europe is explained by low level of ICT
investment, high share of agricultural employment; high inflation and low level of
financial depth and FDI as compared to European economies see Figure 2B. The
education level in eastern economies is quite reasonable in Eastern Economies.
From comparison perspective, another region of interest is the comparison of
labor productivity performance of Eastern and Southeastern Asian economies
with South Asia. The high growth in south eastern economies is often referred as
“Economic Miracle” in literature (Krugman 1994, Bloom and Williamson
1998).In figure 2C, one can notice that in South Asian economies (Pakistan, India,
Bangladesh and Sri Lanka), low labor productivity performance is mainly due to
high agricultural employment, low level of education, financial depth, FDI and
ICT investment as compared to Eastern and Southeast Asian economies.
14
Figure 2: Regional Comparison of Determinants of Labor Productivity level in 2005
-100% -80% -60% -40% -20% 0% 20% 40% 60% 80% 100%
LFPR
INF
FIND
EDU
FDI
ICT
AGREM
INDEM
SEREM
Europe Eastern Europe
Figure 2B: Determinants of Labor Productivity level 2005:Europe vs Eastern Europe
-100% -80% -60% -40% -20% 0% 20% 40% 60% 80% 100%
LFPR
INF
FIND
EDU
FDI
ICT
AGREM
INDEM
SEREM
South Asia East Southeast Asia
Figure 2C: Determinants of Labor Productivity level 2005:South Asia vs Southeast Asia
-100% -80% -60% -40% -20% 0% 20% 40% 60% 80% 100%
LFPR
INF
FIND
EDU
FDI
ICT
AGREM
INDEM
SEREM
USA EuropeFigure 2A: Determinants of Labor Productivity level 2005:Europe vs USA
-100% -80% -60% -40% -20% 0% 20% 40% 60% 80% 100%
LFPR
INF
FIND
EDU
FDI
ICT
AGREM
INDEM
SEREM
South America Africa
Figure 2D: Determinants of Labor Productivity level 2005:South America vs Africa
15
Sub-Sharon African economies comparison with South American economies
(Argentina, Brazil, Peru, Ecuador, Colombia and Chile) is presented in figure 2D.
High level of inflation, labor participation and agricultural employment impact
negatively labor productivity in African economies. The performance of South
American economies in all indicators which affects the long term labor
productivity is far better as compared to African economies.
The comparison among different regions of the world also highlights that ICT
investment, employment distribution in different sectors, financial depth and education
level explains the major differences in apparent labor productivity level in 2005.
VI: Conclusion:
We analyzed the determinants of labor productivity for the group of 40 countries,
representing four different income groups in the world. This study confirms the
diminishing return to labor force participation rate both in short run as well as in the long
run. We find that negative impact of increased labor force participation is high in lower
and lower middle income economies compared to high income and upper middle income
economies. Similarly we find that process of urbanization impacts the labor productivity
growth significantly and positively in lower and lower middle income group economies.
The role of ICT is positive and significant for all income groups.
Long term analysis of labor productivity shows that disparity between labor productivity
across different income groups and regions of the world are well explained by the
diversity in the education level, employment distribution in different sectors, financial
depth and ICT investment. The lower income economies are trapped in low labor
productivity mainly because of high share of employment in agriculture sector, low
financial sector development, poor level of education, high volatility in prices and meager
level of ICT investment.
16
This analysis suggests that the difference in labor productivity between European
countries and the United States is mainly because of high ICT investment, high financial
depth and education level in the USA as compared to Europe. Similar analysis across
different regions provides explanation for labor productivity differences around the
world.
On the basis of above analysis, economic policy recommendations for different regions
are as following.
To reduce the productivity gap between the USA and Europe, there is need to increase
the skill level and average education attainment in working age population in European
economies along with the increase in ICT related investment. These two potential
measures are interdependent as ICT use requires high skilled labor as compared to use of
other techniques in production.
Eastern European economies can reduce the labor productivity gap with the Western
Europe by producing more employment in non farm activities, attracting foreign direct
investment, controlling price level and emphasizing more on ICT diffusion in production
process.
Africa and South Asian countries (except India) performance in labor productivity is not
very encouraging. Labor productivity level in 2005 in sub Saharan African economies
was the lowest among all regions. For South Asian and African Economies, there is need
to pay more attention on average education attainment level, producing productive
employment in non farm activities, to attract FDI, increase financial depth and ICT
investment .But foremost priority should be the increase in education and training of
working age population because without this all other measures will not be achievable.
17
References: Ark, van.B ., Inklaar, R., McGuckin, R. H. ( 2003). "The Contribution of ICT-Producing and ICT-Using Industries to Productivity Growth: A Comparison of Canada, Europe and the United States," International Productivity Monitor, Centre for the Study of Living Standards, vol 6, pp 56-63. Barro, R., and X. Sala-i-Martin (1995). Economic Growth. New York: McGraw-Hill Barro, R.J., J.W. Lee (2000). "International Data on Educational Attainment: Updates and Implications." CID Working Paper 42. Belorgey, N., Lecat, R., Maury, T. (2006)."Determinants of productivity per employee: An empirical estimation using panel data," Economics Letters, Elsevier, vol. 91(2), pages 153-157, May. Bloom, D.E., Williamson, J.G. (1998). “Demographic Transition and Economic miracles in Emerging Asia”, World Bank Economic Review, 12 (3):419-55. Bourles, R., Cette, G. (2007)."Trends in "structural" productivity levels in the major industrialized countries," Economics Letters, Elsevier, vol. 95(1), pages 151-156, April. Brandolini, A., Cipollone, P. (2001). "Multifactor Productivity and Labour Quality in Italy, 1981-2000," Temi di discussione (Economic working papers) 422, Bank of Italy, Economic Research Department. Dixon,P.B & McDonald,D. (1992). "A Decomposition of Changes in Labour Productivity in Australia: 1970-71 to 1989-90," The Economic Record, The Economic Society of Australia, 68 (201), pp 105-17. Gust, C., J.Marquez . (2004). “International Comparisons of Productivity Growth: The Role of Information Technology and Regulatory Practices”, Labour Economics, Vol. 11. Hausman, J. (1978). “Specification Tests in Econometrics”, Econometrica 46 (3), pp. 262-280. Jorgenson, D.W., Vu,K. (2007)."Information Technology and the World Growth Resurgence," German Economic Review, Blackwell Publishing, 8 (2), pp 125-145. Krugman, P. (1994). “The Myth of Asia’s Miracle,” Foreign Affairs, 73 (6), pp. 62-78. Levine, R., Renelt, D. (1992). "A Sensitivity Analysis of Cross-Country Growth Regressions," American Economic Review, American Economic Association, 82(4), pp 942-63. Mankiw, N., D. Romer, and Weil, D. (1992). “A Contribution to the Empirics of Economic Growth,” Quarterly Journal of Economics, 107 (2), pp 407–437. Oliner,S.D., Sichel,D.E. (2002)."Information technology and productivity: where are we now and where are we going?," Finance and Economics Discussion Series 2002-29, Board of Governors of the Federal Reserve System (U.S.). Rice, P., Venables, A.J ., Patacchini, E. ( 2006). "Spatial determinants of productivity: Analysis for the regions of Great Britain," Regional Science and Urban Economics, Elsevier, 36(6), pp 727-752. Roeger, W. (2001). “The contribution of information and communication technologies to growth in Europe and the United States: a macroeconomic analysis” , Economic Papers No. 147. European Commission, Brussels. The Conference Board and Groningen Growth and Development Centre, Total Economy Database, January 2008, http://www.conference-board.org/economics World Bank (2007). "World Bank Development Indicators CD-ROM."
18
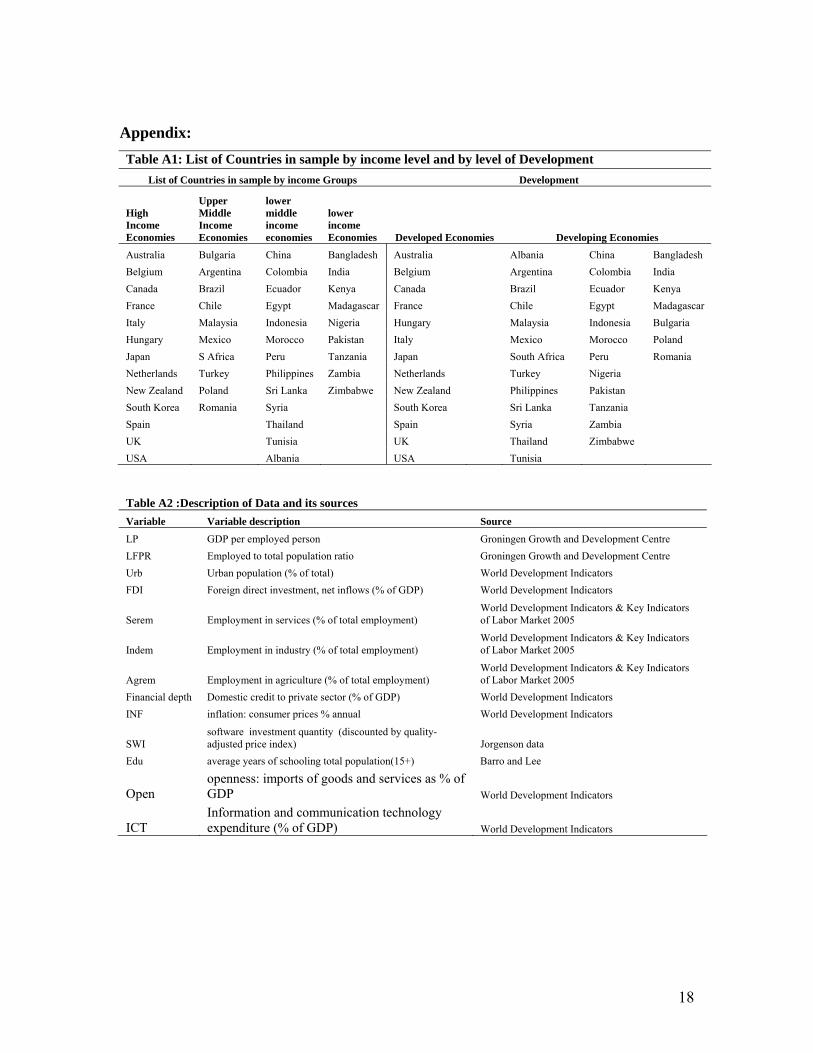
Appendix: Table A1: List of Countries in sample by income level and by level of Development
List of Countries in sample by income Groups Development
High Income Economies
Upper Middle Income Economies
lower middle income economies
lower income Economies Developed Economies Developing Economies
Australia Bulgaria China Bangladesh Australia Albania China Bangladesh Belgium Argentina Colombia India Belgium Argentina Colombia India Canada Brazil Ecuador Kenya Canada Brazil Ecuador Kenya France Chile Egypt Madagascar France Chile Egypt Madagascar Italy Malaysia Indonesia Nigeria Hungary Malaysia Indonesia Bulgaria Hungary Mexico Morocco Pakistan Italy Mexico Morocco Poland Japan S Africa Peru Tanzania Japan South Africa Peru Romania Netherlands Turkey Philippines Zambia Netherlands Turkey Nigeria New Zealand Poland Sri Lanka Zimbabwe New Zealand Philippines Pakistan South Korea Romania Syria South Korea Sri Lanka Tanzania Spain Thailand Spain Syria Zambia UK Tunisia UK Thailand Zimbabwe USA Albania USA Tunisia
Table A2 :Description of Data and its sources
Variable Variable description Source
LP GDP per employed person Groningen Growth and Development Centre LFPR Employed to total population ratio Groningen Growth and Development Centre Urb Urban population (% of total) World Development Indicators FDI Foreign direct investment, net inflows (% of GDP) World Development Indicators
Serem Employment in services (% of total employment) World Development Indicators & Key Indicators of Labor Market 2005
Indem Employment in industry (% of total employment) World Development Indicators & Key Indicators of Labor Market 2005
Agrem Employment in agriculture (% of total employment) World Development Indicators & Key Indicators of Labor Market 2005
Financial depth Domestic credit to private sector (% of GDP) World Development Indicators INF inflation: consumer prices % annual World Development Indicators
SWI software investment quantity (discounted by quality-adjusted price index) Jorgenson data
Edu average years of schooling total population(15+) Barro and Lee
Open openness: imports of goods and services as % of GDP World Development Indicators
ICT Information and communication technology expenditure (% of GDP) World Development Indicators
19
Figure A1: Growth in output per person employed in different regions 1980-2005
(selected Economies, Index 1990=100).
Growth in output per person employed in Africa (se lected economies,index 1990=100)
40
60
80
100
120
140
1980
1982
1984
1986
1988
1990
1992
1994
1996
1998
2000
2002
2004
Inde
x(19
90=1
00)
Kenya Madagascar Nigeria South Africa
Tanzania Zambia Zimbabwe
Growth in output per person employed in East and South East Asia (se lected economies,index 1990=100)
0
40
80
120
160
200
240
280
32019
80
1982
1984
1986
1988
1990
1992
1994
1996
1998
2000
2002
2004
Inde
x(19
90=1
00)
China Indonesia Japan Malaysia
Philippines South Korea Thailand
Growth in output per person employed in Europe (se lected economies,index 1990=100)
40
60
80
100
120
140
160
1980
1982
1984
1986
1988
1990
1992
1994
1996
1998
2000
2002
2004
Inde
x(19
90=1
00)
Belgium France Italy
Netherlands Spain United Kingdom
Growth in output per person employed in Middle East and North Africa (se lected economies,index 1990=100)
60
80
100
120
140
1980
1982
1984
1986
1988
1990
1992
1994
1996
1998
2000
2002
2004
Inde
x(19
90=1
00)
Egypt Morocco Syria Tunisia
Growth in output per person employed in South America (se lected economies,index 1990=100)
60
80
100
120
140
160
180
1980
1982
1984
1986
1988
1990
1992
1994
1996
1998
2000
2002
2004
Inde
x(19
90=1
00)
Argentina Brazil Chile
Colombia Ecuador Peru
Growth in output per person employed in South Asia (se lected economies,index 1990=100)
60
80
100
120
140
160
180
200
1980
1982
1984
1986
1988
1990
1992
1994
1996
1998
2000
2002
2004
Inde
x(19
90=1
00)
Bangladesh India Pakistan Sri Lanka
20
Table A3: Descriptive Statistics by Income Groups
Table A3: Descriptive Statistics by Income Groups
High Income Economies
Variable Obs Mean Std. Dev. Min Max
Labor Productivity Growth 338 1.74 1.93 -6.00 10.53
Initial level of labor Productivity 338 36.95 10.31 11.46 61.92
Participation rate growth 338 0.35 1.75 -9.25 5.08
Inflation 338 5.17 5.22 -0.90 34.23
Information and Communication Technology Expenditure 78 6.67 1.67 3.70 11.24
Gross Capital Formation 333 22.92 4.58 15.64 39.73
Openness 333 30.97 17.44 6.94 84.80
Foreign Direct Investment 333 2.65 6.47 -4.70 92.67
Urbanization 338 76.97 9.84 56.70 97.20
Upper Middle Income Economies
Labor Productivity Growth 260 1.41 4.74 -13.49 21.90
Initial level of labor Productivity 260 15.03 5.48 4.82 29.93
Participation rate growth 260 0.13 2.58 -13.68 8.82
Inflation 242 114.27 383.22 -1.17 3079.81
Information and Communication Technology Expenditure 60 5.75 1.99 2.82 9.86
Gross Capital Formation 247 22.62 6.02 8.12 43.64
Openness 240 30.26 21.64 4.63 104.46
Foreign Direct Investment 235 2.29 2.35 -0.67 12.00
Urbanization 260 66.55 12.93 42.00 90.10
Lower Middle Income Economies
Labor Productivity Growth 364 1.86 5.22 -27.87 20.43
Initial level of labor Productivity 364 9.67 4.61 2.12 25.62
Participation rate growth 364 0.64 2.37 -13.90 12.29
Inflation 338 49.97 447.65 -3.85 7481.66
Information and Communication Technology Expenditure 72 4.73 1.89 1.03 8.92
Gross Capital Formation 364 25.01 6.56 5.20 44.48
Openness 364 29.77 12.91 7.13 88.51
Foreign Direct Investment 352 1.56 1.53 -2.76 8.48
Urbanization 364 44.34 16.07 15.10 72.70
Lower Income Economies
Labor Productivity Growth 208 0.08 4.24 -16.32 9.61
Initial level of labor Productivity 208 2.70 1.56 0.99 7.83
Participation rate growth 208 0.21 0.96 -6.11 3.62
Inflation 192 21.28 25.83 -1.22 183.31
Information and Communication Technology Expenditure 29 6.88 12.27 2.02 69.28
Gross Capital Formation 198 17.84 4.34 8.03 27.23
Openness 198 27.63 9.31 10.13 52.94
Foreign Direct Investment 196 1.32 1.83 -1.15 9.60
Urbanization 208 27.26 8.10 14.60 48.20
21
Table A4: Correlation Matrix for Explanatory Variables.
Table A4: Correlation Matrix for Explanatory Variables (N=1076)
LP Part Inf GCF Open FDI Urb
labor Productivity (LP) 1.00
Participation (Part) -0.36 1.00
Inflation (Inf) -0.16 -0.03 1.00
Gross Capital Formation (GCF) 0.32 0.10 -0.07 1.00
Openness (Open) 0.09 0.03 -0.12 0.17 1.00
Foreign Direct Investment (FDI) 0.06 0.04 -0.04 0.04 0.35 1.00
Urbanization (Urb) -0.02 0.02 0.07 -0.05 0.02 0.22 1.00
Correlation Matrix for Explanatory Variables including ICT (N=230) Variables LP Part Inf ICT GCF Open FDI Urb
labor Productivity (LP) 1.00
Participation (Part) -0.41 1.00
Inflation (Inf) -0.18 -0.07 1.00
ICT expenditure (ICT) -0.07 0.01 -0.03 1.00
Gross Capital Formation (GCF) 0.46 0.12 -0.26 -0.17 1.00
Openness (Open) 0.13 0.06 -0.10 -0.05 0.16 1.00
Foreign Direct Investment (FDI) -0.02 0.10 -0.06 0.05 0.01 0.34 1.00
Urbanization (Urb) -0.18 0.05 -0.17 0.49 -0.16 0.07 0.29 1.00