determinants of growth through m&as
TRANSCRIPT

Determinants of Growth through Mergers and Acquisitions:
An Empirical Analysis
by
Mathieu Luypaert
European University College Brussels (EHSAL)
Department of Accountancy, Finance and Insurance
Katholieke Universiteit Leuven
Nancy Huyghebaert∗
Department of Accountancy, Finance and Insurance
Katholieke Universiteit Leuven
Abstract
This paper empirically investigates the determinants of external growth through mergers and
acquisitions (M&As) in a typical Continental European country, Belgium. For this purpose, we use
data on 378 private and listed firms that engaged in 816 M&A transactions during 1997–2005, and
match this sample with companies that did not pursue any external growth. By analyzing bidder
characteristics, industry and aggregate market variables, we are able to determine what motives are
important in the decision to acquire. Our results show that intangible capital, leverage and firm size
significantly positively affect the decision to grow through M&As whereas the proportion of debt
that consists of bank loans and ownership concentration have a negative impact. Furthermore,
M&As are significantly more likely in industries that were recently deregulated, that are less
concentrated and where industry incumbents are operating at a relatively low scale. Also, the data
indicate that internal and external investments are independent growth strategies. The results
further show that the determinants of the M&A decision differ significantly in low- versus high-
growth industries. Finally, investigating related versus diversifying M&As provides evidence
supporting the market power and bankruptcy avoidance theory.
Keywords: mergers and acquisitions, growth, motives, ownership, financing
JEL: G32, G34
∗
The authors thank Katrien Craninckx, Stefan Duchateau, Filip Roodhooft, Tom Van Caneghem, Cynthia Van Hulle,
Christine Van Liedekerke and the participants at the 25th
Erasmus Finance Day (Rotterdam) for useful comments on an
earlier draft of this paper. They also gratefully acknowledge the help of Geert Gielens, Bureau Van Dijk, Graydon
Belgium and ING in collecting the data. Corresponding author: Mathieu Luypaert, EHSAL, Stormstraat 2, 1000
Brussel, Belgium, tel.: 32-2-609-82-81, e-mail: [email protected]

1
1. Introduction
Mergers and acquisitions (M&As) are a popular means of growth for companies. In 2005 alone,
29,585 deals were announced worldwide, accounting for an aggregate deal value of USD 1 trillion
in the USA and USD 883 billion in Europe.1 There are various reasons why firms may choose to
grow through M&A instead of expanding internally (e.g., Trautwein, 1990; Weston et al., 2001;
Gaughan, 2002). Acquiring a target in a line of business in which the bidding company wants to
enlarge is often a faster way to grow than via internal expansion because the target is an
organization already in place, with its own production capacity, distribution network, and clientele.
This also reduces the risk of investing for the growing company. Besides, growing through M&A
may be a cheaper alternative than internal expansion, in particular when the replacement cost of
assets is higher than the market value of target assets. Finally, and in contrast to organic growth,
M&As can be (partly) paid for with stock. This may be interesting for firms that do not have
enough cash reserves and/or have fully used their debt capacity. The finance literature to date has
concluded that especially during booming stock markets, bidding companies tend to pay for M&As
with stock (e.g., Martin, 1996; Faccio and Masulis, 2005). Yet, as M&As and internal growth are
not mutually exclusive investment decisions, firms may consider them as complements rather than
being substitutes.
This paper investigates the determinants of bidder growth through M&A using logit
regression analysis. More specially, we wish to determine what bidder characteristics, industry and
aggregate market variables are relevant in a firm’s decision to expand externally. Several studies
have used logit or probit regression analysis to examine company features that likely make firms
takeover targets (e.g., Dietrich and Sorenson, 1984; Palepu, 1986; Barnes, 1999; Powell, 2001).
Only a few studies have investigated characteristics of bidding companies. Trahan (1993) and
Sorenson (2000), for example, use data from the USA whereas Hay and Liu (1998) analyse M&A
transactions in the UK. Also, Trahan (1993) and Hay and Liu (1998) study M&As in the fourth
1 Source: FactSet Mergerstat Release: Global M&A Wrap Up for 2005

2
merger wave, investigating a sample from 1984–1987 and 1971–1989, respectively, while Sorenson
(2000) sampled data from 1996, i.e. before the fifth merger wave actually took off. These studies
conclude that the probability of making an acquisition is significantly related to several bidder
characteristics. In particular, they document a positive relation with profitability, the market-to-
book ratio and firm size whereas the impact of leverage is significantly negative.2 However, these
authors do not thoroughly investigate the impact of industry and aggregate market variables on the
decision to grow through M&As.3 Consequently, firm size may spuriously capture the impact of
industry concentration whereas the market-to-book ratio may reflect the ease of bidding companies
to compensate target shareholders with stock in case of booming stock markets. In contrast, this
paper pays careful attention to industry characteristics, such as the potential for economies of scale,
industry concentration, sales growth and deregulation, and aggregate market variables, such as the
historical volume of M&As, stock prices, GDP growth and the yield spread.
Next, as M&As and internal growth are not mutually exclusive investment decisions, this
paper analyzes their interrelationship. On the one hand, a growing company could choose to grow
through M&As in addition to internal expansion. Firms with many investment opportunities and
easy access to financial resources may engage in both internal and external growth in order to take
full advantage of their competitive advantage(s) in the fastest possible way. Consistent with this
idea, Hay and Liu (1998) argue that a firm that is seeking to grow aggressively will often view
2 A few studies have examined the relation between some isolated firm characteristics and the likelihood of engaging in
M&As. As an example, Lehto and Lehtoranta (2004) investigate investments in R&D whereas Harford (1999) analyzes
the role of cash reserves. Other studies indirectly examine the motives behind M&As. Berkovitch and Narayanan
(1993) and Ismail (2005), for example, analyze the correlation between target and total gains in M&As and draw some
inferences on the rationales underlying M&As. Berkovitch and Narayanan (1993) investigate a sample of 330 US
tender offers during 1963–1988 whereas Ismail (2005) examines 76 M&As in the European banking industry during
1987–1999. Their results show that when total M&A gains are positive, the correlation between target and total gains is
positive. They argue that this suggests synergy benefits are the primary motive in these M&As. On the other hand,
when total M&A gains are negative, the correlation between target and total gains is negative, which they see as
evidence of agency problems underlying these M&As. For their entire sample, the correlation between target and
acquirer gains is not significantly different from zero, which, they argue, is consistent with the hubris hypothesis.
However, several other forces may be driving mergers and acquisitions, such as the wish to increase market power, an
industry restructuring, etc. 3 Only Hay and Liu (1998) have investigated the role of market structure to some extent by means of bidder market
share and by identifying the industries that are dominated by a firm or a group of firms versus fragmented industries.
They find that bidder market share is significantly negatively related to growth by acquisition. Also, dominant firms in
industries with a dominant group have higher acquisition growth rates. This was not the case for single dominant firms
and firms in fragmented industries.

3
acquisitions and internal growth as complementary strategies. Alternatively, external and internal
growth could be substitutes if companies are financially constrained, for example. Finally,
companies may specialize in either internal or external growth and these growth strategies, as a
result, may be unrelated. Empirical research on the relation between external and organic growth is
limited and has found conflicting results. Hay and Liu (1998), for example, examine M&As in the
UK during the period 1971–1989 and conclude that M&As and internal expansion are
complements. By contrast, Dickerson et al. (2003), using data on UK quoted firms in
manufacturing during 1948–1970 and 1975–1990, find that the relation between internal growth
and the likelihood of engaging in M&As is significantly negative, indicating that these growth
strategies are substitutes.
To examine the above research questions, we use data on a sample of Belgian bidders during
1997–2005. Belgium has a typical Continental European blockholder system (Bratton and
McCahery, 1999). Only a few companies are listed and there is a relatively high degree of
ownership concentration in publicly quoted firms when compared with Anglo-Saxon countries.
Holding companies, industrial corporations and families are the main investors in listed firms.
Moreover, control in listed companies is levered by pyramidal and complex ownership structures
(e.g., Renneboog, 2000; Faccio and Lang, 2002; Faccio and Masulis, 2005). This makes the threat
of becoming a hostile takeover target non-effective for a lot of listed firms. Faccio and Masulis
(2005), who investigate a sample of 3,667 European listed bidders during the period 1997–2000,
among which 40 Belgian acquirers, find that the ultimate voting stake of the bidder’s largest
shareholder on average amounts to 32.04% in Belgium. This percentage is similar to that in the
other Continental European countries included in their sample, such as France (30.01%) and
Germany (30.57%). Also, they show that most Belgian bids are entirely cash financed (87.50%),
which again is comparable to France (78.97%) and Germany (84.89%).
Overall, our study makes an interesting contribution to the literature for the following
reasons. First, the motives underlying M&As are under-researched in the finance literature today.

4
Rather, prior studies have either focussed on the clustering of M&As over time or the value creation
in M&As. The time-series literature on M&A activity has provided some explanations for why
M&A activity tends to occur in waves (e.g., Gort, 1969; Roll, 1986; Golbe and White, 1988;
Mitchell and Mulherin, 1996; Shleifer and Vishny, 2001; Rhodes-Kropf and Viswanathan, 2004).
Empirical research on M&A value creation has focussed on the announcement returns in mergers or
acquisitions. Studies on US data typically find that announcement returns are significantly positive
for targets while they are zero or even negative for acquirers.4 For European bidders, though,
announcement returns are positive or zero (e.g., Goergen and Renneboog, 2004; Campa and
Hernando, 2004). Other studies have investigated the long-run performance of acquiring companies
but the results are again not one-sided. Subsequent research has tried to link these announcement
returns and long-run performance results to M&A deal features and bidder characteristics.5
Second, the limited number of studies on bidder motives in M&As mainly have examined
M&As in the fourth merger wave, using data from the USA or the UK, whereas we use a set of
M&A transactions from Belgium, a typical Continental European country, during 1997–2005, i.e.
during the fifth merger wave. M&As during the 1980s, and particularly those in the USA, were
initiated for different reasons than today’s transactions. Gaughan (2002), for example, argues that
M&As during the fourth wave were the result of significant inefficiencies in the way corporations
were run on the one hand and the increased size of financial markets on the other. Also, the M&A
wave of the 1980s was characterized by heavy use of leverage and hostility. In contrast, the current
wave was largely initiated by global competition, technological change and deregulation (e.g.,
Weston and Jawien, 1999). In Europe, the integration process further strengthened this merger
wave. According to Bruner (2004), the development of the European Union made it easier to
4 Jensen and Ruback (1983), Jarrell et al. (1988), Weston et al. (2001), Sudarsanam (2003) and Bruner (2004) provide
an overview of the conclusions from various studies on the announcement returns of US M&As during different waves. 5 For example, Jensen and Ruback (1983) investigate the type of transaction whereas Travlos (1987), Loughran and
Vijh (1997), Linn and Switzer (2001) examine the method of payment; cross-border versus domestic transactions are
studied by Danbolt (2004), Goergen and Renneboog (2004), Conn et al. (2005), among others. Morck et al. (1990)
investigate diversifying versus focusing M&As whereas Chang (1998) and Fuller et al. (2002) examine whether or not
the target is publicly quoted. Finally, other studies have studied the role of bidder characteristics, such as the q-ratio,
firm size, excess cash and managerial stock ownership (e.g., Servaes, 1991; Moeller et al., 2004; Harford, 1999;
Lewellen et al., 1985).

5
transfer technology and intellectual capital, exploit economies of scale, realize capital market
integration and reduce the idiosyncrasies of government regulation and tax policies. Hence, there is
a need to also incorporate industry and overall market variables when analyzing the determinants of
M&A activity in a Continental European context. Compared with the previous studies by Trahan
(1993), Hay and Liu (1998) and Sorenson (2000), we are the first to include various industry and
market variables in our analyses.
Moreover, corporate ownership and governance structures in Continental Europe, for
example in Belgium, are very different from those in Anglo-Saxon countries. The number of listed
firms is much higher in the USA or UK than in the average Continental European country. Not
surprisingly, market capitalisation as a percentage of GDP amounts to 143.21% in the USA in 2005
while the average for EU-countries is only 79.68% (Eurostat). Hence, while the existing literature
has largely focused on listed acquiring companies, it seems necessary to also include private bidders
in a Continental European M&A study, which this paper does. Our sample indeed involves both
publicly quoted and private bidders. Private firms may find it more difficult to finance their growth,
especially M&As, as the latter deals cannot be staged, unlike some internal investments. If firm
owners are financially constrained, they may have no alternative than to finance M&As by means of
debt. Indeed, target shareholders may be unwilling to accept bidder stock when their company is
taken over by a private company. In sum, when access to relatively cheaply priced debt financing is
limited, the opportunities to grow through M&A are likely to be restricted for private enterprises.
In contrast, listed companies can raise new equity rather easily through open-market stock issues or
they can even offer new shares as compensation for their M&A in a stock swap. Besides, Pagano et
al. (1998) show that a stock market introduction also reduces the cost of debt. Hence, quoted
companies can more easily finance M&A transactions. However, listed firms in Continental
Europe have much more concentrated ownership structure than those in the USA. La Porta et al.
(1998), for example, show that for the ten largest publicly traded companies in various countries,
the median ownership stake of the three largest shareholders amounts to 62% in Belgium while it is

6
only 15% in the UK and 12% in the USA. As large reference shareholders in Continental Europe
typically have more control over the firm’s resources and decisions, agency problems between
managers and these shareholders should be less severe in Continental Europe on average while,
simultaneously, controlling shareholders in listed (and non-quoted) firms may be reluctant to issue
stock as compensation in M&A in order not to dilute their control.6 Hence, to differentiate between
ownership concentration resulting in less agency problems of equity vis-à-vis ownership
concentration restricting M&As because of the desire to maintain control, we will also examine
whether the role of ownership concentration is the same in related versus unrelated M&As. Indeed,
when managers pursue diversification of their human capital rather than shareholder wealth
maximization, they may engage in diversifying M&As (see, for example, Amihud and Lev, 1981;
Morck et al., 1990). In addition, as Jensen (1986) points out that agency problems of equity are
more important for firms with limited growth prospects, we will also split up the sample in low- and
high-growth firms, respectively.
Our multivariate results show that intangible assets significantly positively influence the
decision to grow through M&As. Further, internal cash flow generation and the stock of cash slack
resulting from retained earnings seem to have no impact. Firm size is significantly positively
related to the decision to engage in a merger or acquisition. The decision to grow externally is also
affected by the firm’s debt structure. Specifically, the debt ratio positively affects the decision to
acquire whereas the portion of bank loans in the total debt has a significantly negative impact. Firm
ownership concentration negatively influences the M&A decision. Yet, the interaction term
between ownership concentration and internal cash flow generation and the cash reserves,
respectively, is not significantly related to the probability of expanding through a merger or
acquisition. Overall, these results are inconsistent with Jensen’s free cash flow theory. In stead, our
results suggest that companies with substantial intangible capital can add more value to takeover
targets whereas the desire to maintain control limits a firm’s external growth options. Furthermore,
6 We do want to point out that governance structures in the USA have become more performing in the last decades (e.g.,
Holmstrom and Kaplan, 2001).

7
we find that M&As are significantly related to industry characteristics. M&As are more likely in
industries that are less concentrated and where industry incumbents are operating at a relatively low
scale. In addition, M&As are significantly more likely in industries that have recently been
deregulated.
When the sample is subsequently split into low- and high-growth industries, we find some
important differences regarding the determinants of M&As. Leverage is no longer significant in the
subsample of low-growth industries whereas, for companies in high-growth industries, the debt
ratio becomes significantly negative. Also, ownership concentration and paying out dividends are
only significant in explaining the probability of engaging in M&As in low-growth industries.
Furthermore, while industry concentration and the scale of industry incumbents are only significant
in explaining M&As in high-growth industries, deregulation seems only to matter in low-growth
industries. Finally, there is some evidence that GDP growth significantly negatively affect the
M&A decision of companies in low-growth industries.
Finally, distinguishing between related versus diversifying mergers and acquisitions learns
that large non-dividend paying companies with more intangibles and a smaller debt ratio are more
inclined to engage in diversifying M&As. Not surprisingly, when industry incumbents are
operating a relatively large scale, acquiring companies are more likely to initiate unrelated M&As.
Furthermore, the relation with industry growth is U-shaped whereas industry concentration bears an
inverse U-shaped relation with the likelihood of a related M&A deal. Finally, a merger or
acquisition is more likely to be related in periods of low stock prices.
The remainder of this paper is organized as follows. Section 2 provides an overview of the
different hypotheses regarding the decision to grow through M&A. Section 3 describes the sample.
The results from the logit regression analysis as well as several robustness checks are presented in
Section 4. Section 5 concludes this paper.
2. Hypotheses

8
A number of arguments have been developed to explain why firms may choose to grow through
M&As, besides or instead of internal expansion (see, for example, Trautwein, 1990; Weston et al.,
2001; Gaughan, 2002). In this section, we derive a set of testable predictions developed from these
arguments. Important to note is that this study focuses exclusively on bidder characteristics,
industry and aggregate market variables. Hence, although firms with net operating losses carried-
forward may become attractive takeover targets and hence bidders may engage in M&As to reduce
their overall tax bill, this type of motive cannot be captured by our study. Likewise, a merger or
acquisition may be initiated because of unique target technology or managerial capabilities, but this
rationale again cannot be gauged by looking solely at bidder features.
2.1. Synergies
Synergy benefits refer to the ability of a corporate combination to be more profitable than the
individual firms that are combining (Gaughan, 2002). Trautwein (1990) distinguishes between
three types of synergy benefits: operating, financial and managerial synergies. Operating synergy
assumes that economies of scale exist in an industry and that prior to their M&A, firms are
operating at levels of activity that fall short of achieving the potential for economies of scale
(Weston et al., 2001). Expansion through a merger or acquisition increases the size of the company
and hence may lower per-unit costs. Financial synergy refers to the impact of a merger or
acquisition on the combined firm’s cost of capital. This can be achieved by lowering the systematic
risk of the firm’s investment portfolio. Alternatively, increasing firm size may improve company
access to cheaper financing and/or create an internal market where capital can be allocated more
efficiently. Finally, managerial synergies may arise from combining firms of unequal managerial
capabilities.
This paper examines only the effects of operating and financial synergies underlying the
decision to grow through M&A because we cannot differentiate between the managerial capabilities
of the target and bidding companies from including only bidder characteristics. Operating synergies

9
will be examined by analysing the potential for economies of scale in an industry. For this purpose,
we calculate the minimum efficient scale (MES) in an industry by means of the median of the
natural logarithm of total assets in the firm’s corresponding four-digit SIC industry.7 Following
Huyghebaert and Van de Gucht (2004), we only consider industry incumbents older than ten years
to determine the industry MES, as business start-ups typically enter the industry at a smaller scale.
We expect a positive relation between the potential for scale economies and external growth as
M&As may allow companies to realize economies of scale much faster, ceteris paribus.
Furthermore, we expect economies of scale to be important only in related mergers and
acquisitions.
Besides, new products and/or technologies may create an opportunity to realize synergies
(Hall et al., 1990; Lehto and Lehtoranta, 2004). Hence, we will also examine the effect of
intangible assets on the decision to grow through M&As, because the larger a firm’s intangible
capital, the greater the potential for synergy benefits from transferring knowledge to another firm.
M&As can also be used as a means to transfer knowledge in situations where collaborative and
contractual schemes do not work (Lehto and Lehtoranta, 2006). Consistent with the above
arguments, the empirical results of Lehto and Lehtoranta (2004) show that a firm’s R&D stock
(scaled by sales at constant prices) positively contributes to its likelihood of becoming an acquirer.
By contrast, Blonigen and Taylor (2000) document a significantly negative relation between R&D
investments (scaled by turnover and total assets, respectively) and the probability of engaging in
M&A in high-technology industries. They conclude that firms in these industries specialize in
either internal development of R&D or acquisitions. We will use the ratio of intangible assets
(minus the accumulated goodwill paid in earlier M&As) to total assets and expect a positive relation
with the decision to grow through M&A, both in related and unrelated transactions. According to
the fourth directive of the European Community (25 July 1978), costs of research and development,
concessions, patents, licences, trade marks and similar rights and assets may be capitalised on the
7 Alternatively, we will replace the log of total assets by the log of total sales and by the log of the number of employees
as a robustness check.

10
balance sheet if they were acquired or created by the company itself, in so far as national law
permits their being shown as assets. Belgian accounting law allows companies to capitalise their
outlays on research and development, concessions, patents, licenses, and know-how when these are
obtained by purchasing them, through own investments and through a merger or acquisition. When
capitalising an internally created intangible asset, the book value equals the sum of all costs made to
realize it, if these costs are not higher than a prudent estimate of the future return from this
intangible asset, while the book value of externally acquired intangible assets equals the purchasing
price (Article 60 KB 30/01/2001).8 Companies can choose to expense these outlays immediately in
their income statement. Gaeremynck et al. (1998) investigate the capitalisation of research and
development spending for 321 Flemish R&D spending firms. They find that only 65 capitalized
their R&D spending. They further show that the decision to capitalise is significantly positively
related to the position of the stake-holders (measured by return on investment and operational cash
flow), the size of the firm and its R&D intensity (at least for firms in R&D-intensive sectors), while
it is negatively related to the ability to repay debt. The positive relation between the decision to
capitalize and R&D indicates that intangible assets is indeed a good proxy for R&D intensity.
Overall, it is important to control for the effect of company size. Large firms may be better
able to realize efficiencies from, for example, the internalisation of talent or technologies from a
target firm because they can apply these assets on a sufficiently large scale. Furthermore, large
firms often have the financial resources needed to acquire other companies. Hence, combining with
a financially constrained target may create an internal capital market, where capital is available at
lower costs. Hence, we expect a positive relation between firm size (proxied by the natural
logarithm of total assets) and the probability of engaging in M&A.9 Evidence for this relation was
8 Since 2005, Belgian publicly quoted companies have to file their annual accounts according to International
Accounting Standards. IAS 38 requires an enterprise to recognize an intangible asset, whether purchased or self-
created, if it is probable that the future economic benefits that are attributable to the asset will flow to the enterprise and
the cost of the asset can be measured reliably. However, research costs always have to be expensed to the income
statement. Development costs may be capitalized but only after the technical and commercial feasibility of the assets
for sale or use have been established. In our sample, however, we only look at annual accounts before 2005 which are
filed according to Belgian accounting law. 9 We also estimate the models after replacing the log of total assets by the log of total sales and by the log of the number
of employees as a robustness check. However, it is not be possible to collect sales figures for all these companies as

11
already documented by Trahan (1993), Harford (1999) and Maksimovic and Philips (2001), among
others. Furthermore, we expect large firms to engage especially in diversifying M&As as there may
be fewer opportunities for further growth in their own industry.
Finally, we will investigate the motive to realize financial synergies by looking at the capital
structure of potential bidders. By engaging in diversifying M&As, highly leveraged firms may seek
to reduce their systematic risk and realize a lower cost of capital. Exploiting such M&As can create
additional borrowing capacity due to a coinsurance effect. The latter refers to the fact that
combining two cash flow streams is less risky than the sum of the cash flow streams separately,
provided that these cash flows are not highly correlated (Lewellen, 1970). We will measure firm
leverage by means of the debt-to-total assets ratio.
2.2. Market power
In highly concentrated industries, firms tend to recognize the impact of their actions and policies on
one another. This may influence firm reactions to changes in competitive behaviour, like price
reductions, and possibly result in tacit collusion (Weston et al., 2001). Horizontal mergers and
acquisitions in concentrated industries may help companies to realize monopoly returns. This
suggests a positive relation between industry concentration and external growth, particularly when
M&A deals are related transactions. Consistent with this market power argument, Eckbo (1983)
finds positive abnormal returns for rival firms around the announcement of an M&A of two
competing companies. Yet, Eckbo also finds slightly positive abnormal returns when a lawsuit is
filed by antitrust authorities, suggesting that horizontal M&As signal potential efficiency gains for
rival firms rather than benefits from increased market power. Likewise, highly concentrated
industries could have a lower incidence of M&As when there is less room for further consolidation,
especially since antitrust authorities closely examine new deals. Consistent with the latter
small firms are not obliged to publish their sales. A company is regarded as small if not more than one of the following
criteria is exceeded: an average annual workforce of 50 employees, an annual turnover (excluding VAT) of € 7,300,000
and total assets of € 3,650,000. If the average annual workforce exceeds 100 employees, a company is always
considered as large. In our sample, 50.68% of the firms are small according to these criteria.

12
arguments, Andrade and Stafford (2004) find that industry concentration has a negative impact on
the decision to grow through M&As. We will use the Herfindahl-Hirschman (HH) index to
measure the extent of concentration within an industry. This measure is defined as the sum of
squared market shares of all industry incumbents in the corresponding four-digit SIC industry. Its
relation with the probability of M&A is an empirical question: positive when firms pursue increased
market power and negative when further consolidation is difficult to achieve. Hence, we will also
introduce a quadratic term in industry concentration to capture possible non-linearities. We then
expect the simple term to have a positive coefficient whereas that of the quadratic term should be
negative.
2.3. Industry shocks
Mitchell and Mulherin (1996), Andrade and Stafford (2004), Powell and Yawson (2005), among
others, examine the effect of industry shocks on M&A activity across industries. A first important
shock they investigate is sales growth. Firms in mature or declining industries may want to shift
their resources into growing industries, to guarantee their long-run survival. Myers and Majluf
(1984), for example, argue that the acquisition of targets with good growth prospects but limited
cash by companies with plenty of financial slack but limited investment opportunities may be value-
enhancing. Also, firms in low-growth industries may be obliged to consolidate in their own
industries; this notion is commonly referred to as the bankruptcy-avoidance hypothesis. Hence, we
expect companies in low-growth industries to engage especially in related M&As. Consistent with
these arguments, Powell and Yawson (2005) find that takeovers tend to occur especially in low-
growth industries. By contrast, others have argued that especially firms in high-growth industries
are more likely to be acquirers, especially when their profitability allows buying industry peers.
These companies then try to benefit as much as possible from the high growth in their industry by
expanding through M&As, which often is the fastest way to grow. Hence, industry growth may be
especially important in explaining related M&As. In sum, the relation between industry growth and
13
the likelihood of acquisition is an empirical question. We will investigate it by calculating the sales
growth rate in each four-digit SIC industry in our sample. We will investigate both a single and a
quadratic term of industry sales growth to capture a potential non-linear relation.
Besides, industry deregulation is also likely to be an important determinant of M&A activity
across industries (e.g., Mitchell and Mulherin, 1996; Mulherin and Boone, 2000; Andrade et al.,
2001). Deregulation removes artificial constraints on the size of industry incumbents and induces
market entry by new enterprises. In order to adapt to the changes engendered by deregulation,
industries need to restructure and mergers and acquisitions can facilitate this process. Hence, we
expect that firms tend to engage in M&As especially in industries subjected to deregulation, ceteris
paribus. To test this hypothesis, we create a dummy variable that equals one for industries that
were deregulated during the sampling period and zero otherwise. Of all industries that are included
in our sample, only communication services and railroad companies experienced a deregulation
during 1997–2005.
Finally, it may be important to control for overall economic growth in the above regression
models. By incorporating the growth rate of real GDP in the previous year as an additional
explanatory variable, we can better isolate the effect of industry growth from that of the overall
economy. We expect a positive relation between GDP growth and M&As because companies may
seek immediate increases in operating capacity when the economy is growing. The desire for firm
growth through M&A might, in turn, be tempered by bad business conditions. Steiner (1975) and
Guerard (1985, 1989) provide evidence for a positive relation between GDP and M&A activity.
Melicher et al. (1983) investigate the relation between industrial production, business failures, stock
prices, interest rates and M&A activity in the USA between 1947 and 1977. Their research presents
interesting insights into the lead-lag relationship between macro-economic and capital market
conditions. Yet, they only find a weakly positive relation between economic conditions and M&A
activity, with changes in industrial production lagging behind changes in M&A activity. Other

14
studies have found a negative relation between GDP growth and M&A activity (see, for example,
Beckenstein, 1979; Becketti, 1986).
2.4. Agency problems
Jensen (1986) argues that takeovers could be driven by agency problems between the management
of a firm and its shareholders. Managers may have incentives to expand their firm beyond its
optimal size. The reason is that growth generally increases managerial power and compensation.
Moreover, it enables managers to diversify their wealth (including human capital) and improve job
security when the target’s cash flows are less than perfectly correlated with those of their own firm
(Morck et al., 1990). Hence, when these agency problems of equity are prevalent, we expect firms
to pursue M&As, which allow growing at a faster rate, and diversifying M&As in particular.
Jensen (1986) further argues that especially managers of firms with large free cash flows
tend to engage in value-decreasing takeovers. Hence, we expect a positive relation between internal
cash generation and the decision to grow externally. We include EBITDA/total assets in our
regression specification to proxy for internal cash flow generation. Alternatively, we will examine
the cash ratio, to capture the effect of ready available cash reserves (instead of the annual cash
generation). Consistent with this hypothesis, Harford (1999) finds that cash-rich firms are more
likely to acquire other companies.
An important remark regarding agency problems of equity underlying the relation between
EBITDA/total assets (cash ratio) and the M&A probability is that this relation should be weaker for
firms with a highly concentrated ownership structure. Indeed, agency problems of equity tend to be
less severe if a company’s shares are highly concentrated in the hands of a few shareholders, as
these investors tend to monitor the firm’s management more closely. In Belgium, relatively few
companies are listed on the stock exchange. Market capitalisation as a percentage of GDP amounts
to only 81.92% in Belgium in 2005 while it equals 143.21% in the USA. Also, the majority of the
shares in listed companies often are owned by a few institutional investors, industrial corporations

15
or families (Renneboog, 2000). As a result, the probability that managers in these firms will engage
in value-destroying M&As can be expected to be lower. For private enterprises, ownership is even
more concentrated and hence agency problems of equity are unlikely. In order to investigate the
effects of ownership, we calculate an ownership concentration index using the sum of squared
ownership percentages by a firm’s various shareholders (see, for example, Agrawal and Mandelker,
1990; Duggal and Millar, 1999).10
We subsequently introduce interaction terms between ownership
concentration and EBITDA/assets and the cash ratio, respectively, to capture the above managerial
incentive problem story more accurately.11
If agency problems of equity are prevalent, we expect
these interaction terms to be significantly negative. The reason is that a highly concentrated
ownership structure may allow restraining the wasteful investment of free cash flows.
Furthermore, ownership concentration by itself could capture the notion that firm owners
may care about preserving control. Hence, they will avoid issuing stock as compensation in
mergers and acquisitions. As their means of financing M&As is now restricted, this could
negatively influence the probability of growth through M&A. So, based upon the above arguments,
we expect a negative relation between ownership concentration and the probability of initiating an
M&A in a particular year. Yet, a negative impact of ownership concentration by itself does not
allow us to conclude that agency problems of equity are at work.
Finally, we control for the fact that firms paying out a large portion of their earnings as
dividends have less cash available to spend on acquisitions (Jensen, 1986). Hence, the dividend
payout ratio and the probability of external growth should be negatively related. Nevertheless,
Trahan (1993) finds that listed firms that pay out a large portion of their earnings as dividends tend
to become acquirers. He argues that firms with high payout ratios may temporarily reduce their
dividends to finance the merger or acquisition. Yet, Trahan (1993) also finds that M&A
10
In Belgium, shareholders in publicly quoted companies have to report their ownership as soon as it reaches 5% of the
company’s capital stock and any subsequent multiple thereof. Companies can lower this threshold from 5% to 3%. For
private companies, we were able to collect data on smaller ownership stakes, if available. 11
Such interaction terms were not included in previous studies using US/UK data from the fourth M&A wave as
publicly quoted firms in those countries generally were assumed to suffer from agency problems of equity, given their
widely dispersed ownership. However, in our sample of Belgian firms, where listed companies and especially private
firms have a highly concentrated ownership structure, agency problems may be less important on average.

16
announcement returns on average are lower for bidders that pay out large dividends. As many
companies in our sample do not pay out any earnings, we will include a dummy variable that equals
one if the company pays dividends and zero otherwise, and expect a negative relation with external
growth.
Likewise, Jensen (1986) argues that the presence of debt reduces the free cash flows
available for spending at managerial discretion. As a result, a firm’s debt/assets ratio could
negatively affect external growth. We will also examine the debt mix, i.e. the ratio of bank loans to
total debt. Diamond (1984) and James (1987), among others, argue that banks have a cost
advantage in producing and transferring information. Consequently, banks may help avoiding
managerial over-investment problems. Another argument leading to a negative relation between
bank loans/debt and the probability of M&A is provided by Wilner (2000) and Huyghebaert et al.
(2006). They argue that credit market lenders, such as banks, follow stricter liquidation rules than
suppliers upon a company’s financial distress. Hence, companies may follow more conservative
investment policies when their debt largely consists of bank loans.
2.5. Hubris
Roll (1986) argues that hubris, i.e. the excessive self-confidence of managers, is an important factor
in explaining mergers and acquisitions. If there are no aggregate gains in takeovers, M&As may be
caused by the bidder management’s faith that their higher valuation of the target company is
correct. Even with synergy gains and/or benefits from a change in control, competition among
multiple bidders may lead the winning bidder to pay too much for the target firm. Overall, we
expect hubris to be more prevalent in periods of high M&A activity, due to the herding behavior of
managers. Scharfstein and Stein (1990) develop a model of investment decisions driven by herding
behavior. They show that managers will mimic early movers, ignoring their own information.12
The above arguments suggest a clustering of M&As over time, which has been demonstrated by
12
To be noted, Cabral (2002) argues that it can be rational for a manager to mimic other firms’ M&A decisions, despite
its private information against the takeover. In this case, a clustering of M&A activity does not need to imply
managerial hubris.

17
Mitchell and Mulherin (1996), Mulherin and Boone (2000), Andrade and Stafford (2004), Powell
and Yawson (2005), among others. To test the effect of hubris on the decision to grow through
M&A, we introduce the volume of M&As in the previous year relative to the total number of
M&As in the period 1997–2005 as an explanatory variable in our regression analysis and expect a
positive parameter estimate.
Malmendier and Tate (2004) show that over-confident managers tend to get involved in
diversifying M&As. They also document that these transactions in particular are unlikely to create
value for the acquiring company. Hence, we expect that the volume of M&As should also be
negatively related to the relatedness of M&A transactions under the hubris hypothesis.
2.6. Under-valuation/over-valuation hypothesis
If stock prices are sufficiently depressed, the takeover of a listed company may constitute a bargain
relative to investing in new facilities from scratch (Golbe and White, 1988). Moreover, the
valuation of non-quoted firms will also be lower in case of depressed stock prices, through the use
of industry multiples or through the use of a higher risk premium when valuing target stock. This
under-valuation hypothesis suggests that stock prices and the decision to grow through M&A might
be negatively related. Consistent with these arguments, Golbe and White (1988) find a negative
relation between Tobin’s q, which captures the market value of the target relative to the replacement
cost of its assets, and M&A activity.
On the other hand, rising stock prices can facilitate the financing of mergers and acquisitions
when transactions can be compensated with stock. Myers and Majluf (1984) already argued that
managers are more likely to issue new shares when they consider their stock to be over-valued.
Shleifer and Vishny (2001) and Rhodes-Kropf and Viswanathan (2004) apply this idea of
asymmetric information between firm-insiders and outsiders to explain M&A activity. Shleifer and
Vishny (2001) model the behaviour of acquiring managers and conclude that managers in over-
valued firms have an incentive to engage in stock acquisitions. Rhodes-Kropf and Viswanathan

18
(2004) demonstrate that target shareholders will accept these stock offers because they tend to over-
estimate the value of synergy benefits in an over-valued market. Martin (1996) and Faccio and
Masulis (2005) find that bidding companies indeed are more inclined to pay with stock for their
M&As in booming stock markets. This suggests a positive relation between stock prices and
external growth. Nelson (1959), Melicher et al. (1983), Guerard (1985, 1989) and Becketti (1986),
among others, further find that an increase in stock prices is followed by an increase in merger
activity. Yet, it remains to be seen whether such a positive relation would hold in a sample of
M&A bidders that is largely dominated by private companies, as ours. We will capture stock
market performance in Belgium by means of the total return on the Belgian All Shares Index
(BASI). Its relation with the incidence of M&As is an empirical question.
In addition, we will control for the yield spread between corporate and government bonds
and the term spread between the yield on long-term government bonds and the yield on Treasury
notes, as these may influence financing decisions and hence investments. The higher the yield
spread, the more expensive it will be for a firm to borrow money. Overall, this will negatively
impact firm investment rates, but as M&As can also be financed by means of stock (rather than
public or private debt), the yield spread may positively affect the decision to grow through M&As.
We measure the yield spread as the difference between the average yield on European corporate
bonds with rating BBB and a duration of five years and the average yield on European government
bonds, also with a duration of five years.13
Furthermore, the yield spread can also be considered as
a measure for the economy’s overall risk assessment by investors. When investors become more
risk averse, they will demand a higher risk premium, ceteris paribus. Next, relatively high yields on
long-term bonds can be attributed to expectations of future increases in the interest rate while
relatively low yields on long-term bonds may be an indication of expectations of falling short-term
interest rates. Hence, a positive relation between the term spread and the decision to engage in
M&As may arise because relatively high yields on long-term bonds will make it more expensive to
13
Alternatively, we will estimate the model with the yield spread on bonds with a modified duration of ten years instead
of five years.

19
finance internal investments compared to M&As as M&As can also be financed by means of stock
issuance or a stock swap. We propose to work with the difference between the average yield on
Belgian government bonds with a duration of five years and the yield on a Belgian Treasury Note
with a maturity of three months.14
2.7. External versus internal investment
Growth through M&As and internal growth are not mutually exclusive investment decisions. Both
have several advantages and disadvantages. Mergers and acquisitions are the fastest way to expand,
because the target is an organization already in place, with its own production capacity, distribution
network, and clientele. Also, external growth is often the most efficient way to obtain managerial
talent and new/complementary technologies from a target company. However, by purchasing an
existing company, the firm may not get exactly what it wants. Mergers and acquisitions often
require additional internal investments in order to make best use of the acquired assets within the
bidding company. Moreover, internal investment may be needed when it is not possible to obtain
the required assets through M&A. These advantages and disadvantages suggest that internal and
external growth are not necessarily substitutes, but that the choice of growth strategy may depend
on the situation.
When a firm has many investment opportunities and easy access to external financing or can
issue stock to finance its M&As, it may view internal and external growth as complementary
strategies. Hay and Liu (1998), for example, argue that a firm that is seeking to grow aggressively
will often view M&As and internal growth as complementary strategies. These authors investigate
a sample of 110 manufacturing firms in the UK during 1971–1989 and find that the incidence of a
takeover by a given firm is positively related to the investment rate of that firm. Their sample only
includes listed firms, which probably are less financially constrained than private enterprises.
Hence, some firms may lack the financial resources necessary to grow both internally and
14
Alternatively, we work with the yield on a Belgian Treasury Note with a maturity of six months to test the robustness
of the results.

20
externally. If owners are financially constrained, firms may have no alternative than to finance
M&As by means of debt, especially when target shareholders are unwilling to accept stock as
compensation or when bidder owners wish to maintain control. Hence, a company may need to
choose to grow through M&As, to the detriment of internal growth. Dickerson et al. (2003), for
example, using data on UK quoted manufacturing companies during the periods 1948–1970 and
1975–1990, find that the relation between internal growth and the likelihood of takeover is
significantly negative.
Nevertheless, it is also possible that internal and external expansion are independent growth
strategies. The decision to grow through M&A could be determined by the availability of good
external investment opportunities and the available resources to finance them, but may be
independent of internal growth. This would suggest that internal growth is not significantly related
to the decision to grow through M&A. Also, companies may specialize in one way of growth.
Some firms may concentrate on searching potential targets and integrating the acquired assets, but
they may find it difficult to create a plant from scratch. Conversely, other companies may have a
history of successful internal growth, but may not have the ability to manage a merger or
acquisition. Hence, the relation between internal growth and the likelihood of M&A is an empirical
question, especially in a sample that is dominated by private bidders.
We will use the investment rate (the ratio of the change in tangible fixed assets (PPE), to
which we add back depreciation, to total assets) as a proxy for internal growth. However, external
growth may also positively influence a firm’s fixed assets. To avoid this problem, we will also test
the relation between the investment rate and external growth for a sample of acquiring firms that
made one or more M&As in only one year during the sample period. Furthermore, to test the idea
that financially constrained firms may find it difficult to finance their growth, we include an
interaction term between the investment rate and (one minus the debt ratio) in our regression model,
assuming that firms with a high debt ratio may have already fully used their borrowing capacity.
Alternatively, we will include an interaction term between the investment rate and a dummy

21
variable that equals one for companies that are publicly quoted. If financial constraints limit
complementary external growth, these interaction variables should be significantly positively
related to the likelihood of M&A.
3. Sample
In this section, we discuss our sample selection criteria. Using the Zephyr database, we identified a
sample of 378 Belgian bidders that announced at least one merger or acquisition during the period
1997–2005. The Zephyr database contains detailed information on over 400,000 M&A transactions
worldwide. M&As involving public as well as private bidders are covered and there is no minimum
deal value in order for M&As to be included in this database. We did not impose any restrictions
on the target firms in order for M&A transactions to be retained in our sample. Hence, our sample
includes data on domestic as well as cross-border mergers and acquisitions. On average, 53.19% of
the M&As in our sample are cross-border deals. The three other countries Belgian bidders most
actively aim for M&A targets are France (12.13%), The Netherlands (9.31%) and Germany
(5.27%). Also, 41.30% of the bidders in our sample are publicly quoted, while only 2.57% of the
target firms are publicly quoted.
Belgium has a typical Continental European blockholder system (Bratton and McCahery,
1999). Only a few companies are listed and there is a high degree of ownership concentration, even
in publicly quoted firms. Holding companies, industrial corporations and families are the main
investors and control in listed companies is levered by pyramidal and complex ownership structures
(Renneboog, 2000). Furthermore, Faccio and Masulis (2005), who investigate a sample of 3,667
European listed bidders during 1997–2000, show that the ultimate voting stake of the bidder’s
largest shareholder averages to 32.04% for Belgian firms, which is similar to that in France
(30.01%) and Germany (30.57%). In addition, most Belgian bids (87.50%) are entirely cash
financed, like in the other Continental European countries in their sample (78.97% in France and
84.89% in Germany). Hence, our sample of Belgian bidders likely is representative for the

22
Continental European market. Furthermore, Figure 1 shows that M&A activity in Belgium follows
the same pattern as that of the European Union. M&A activity increased steadily from 1997 till
2000. After a small decline in 2001 and 2002, M&A activity ticked up again afterwards and was at
its highest level in 2005.
<insert Figure 1>
The reason why we focus on Belgian bidders is that the information in the Zephyr database
can be easily combined with the financial statement information in the Belfirst database.15
The
latter database contains detailed information on the annual accounts of more than 330,000 Belgian
companies. In Belgium, small companies are allowed to file their financial statements in an
abbreviated form while large companies have to file full accounts.16
In our sample, 49.32% of
bidders report full accounts. The Belfirst database also provides information on the activities of the
bidding companies, by means of their four-digit SIC industry codes. This information allowed us to
calculate the relevant industry variables. We have excluded banks, insurance companies, real estate
companies and holdings from our analyses, i.e. all companies with a main SIC code starting with 6.
The reason is that these companies are still largely subject to extensive regulation whereas their
accounting methods and reporting practices are different from those in other industries. Moreover,
holdings have stakes in companies from various industries, which makes it difficult to investigate
the role of industry characteristics.
For each sample firm, we randomly selected from Belfirst a non-acquiring company in the
same industry, i.e. a firm with the same main four-digit SIC code that did not engage in any M&A
during the whole sampling period. This matching procedure has already been used in the literature
(e.g., Sorenson, 2000). We prefer random matching because when observations are not randomly
drawn from the population, a selection bias may arise (Heckman, 1979). Hence, standard
estimators and tests may result in misleading inferences (e.g., Verbeek, 2004). Matching acquiring
15
The Zephyr database and the Belfirst database are both commercialized by Bureau Van Dijk Electronic Publishing. 16
A company is regarded as small if not more than one of the following criteria is exceeded: an average annual
workforce of 50 employees, an annual turnover (excluding VAT) of € 7,300,000 and total assets of € 3,650,000. If the
average annual workforce exceeds 100 employees, a company is always considered as large.

23
and non-acquiring firms by means of certain criteria, like for example firm size, may induce
problems as size itself could be an important determinant in explaining the M&A decision. Carson
and Hoyt (2003), for example, investigate financial distress in the US life insurance industry and
provide empirical evidence that matching on the basis of total assets and state of domicile results in
biased conclusions. Variables identified as important measures of insolvency, coefficients and
classification rates in their study differ across different matched-pair samples. Manski and Lerman
(1977), Zmijewski (1984) and Palepu (1986) show that the use of a matched-pair sample design
causes both parameter and probability estimates to be asymptotically biased because a firm’s
probability of being selected in the sample is a function of the dependent variable. However,
matched-pair sampling is often justified on the grounds of efficiency, especially in the presence of
high search costs. Hence, we choose to use a matched-pair design where matching is random
except for industry relatedness.
An acquiring company is included in our sample only for the year(s) in which the firm
initiates a merger or acquisition. The matching firm is also only included in the sample for the
corresponding year. The Belfirst database was also the main information source for bidder
ownership information.17
Stock market return data were calculated based upon the Belgian All
Shares Index (BASI), which was collected from Belgostat. The GDP growth rate at constant prices
was downloaded from Eurostat whereas bond yields were retrieved from Bloomberg.
In our analyses, we include all announced transactions that are covered by the Zephyr
database, irrespective of whether they were completed or not. The reason why we focus on
announced transactions is that our research investigates the motives behind the decision to grow
through a merger or acquisition, regardless of the outcome of the transaction. Indeed, an intended
transaction may not go through, because of, for example, a competing offer, no shareholder
approval or antitrust problems. These actions are outside the scope of the firm’s management.
17
Belfirst did not report the ownership information for all sample firms. We were able to collect ownership data on 435
sample firms and 84 matching firms. After contacting a randomly selected subsample of matching firms on which we
did not have any ownership information, we learned that for almost all of these firms, 100% of the shares were being
held by members of the same family. Hence, we made the assumption that the ownership concentration index equals
one for all privately-held matching companies on which we did not have any ownership data.

24
Table 1 provides an overview of the current status of the 918 transactions that were captured from
the zephyr database. This table shows that approximately 80% of the transactions in our sample
were completed. Hence, only a small part of the announced transactions in our sample did not go
through.
<insert Table 1>
Furthermore, some of the announced mergers or acquisitions are transactions whereby the
bidding company already owned a controlling stake in the target company and simply increased this
stake at the considered M&A. Hence, these transactions cannot really capture the intention of a
company to follow an external growth strategy instead of investing from scratch, which is the focus
of this paper. Van Hulle et al. (1991) show that Belgian bidders indeed often own large toeholds in
the target before they engage in takeover bids. Table 2 shows the prior M&A ownership stake of
the bidding company. For our analysis, we drop all transactions whereby the bidding company
already owns 50% of the shares before the M&A. This case concerns 85 out of 918 transactions.18
<insert Table 2>
Next, some of our sample firms may belong to a corporate group rather than being
independent. La Porta et al. (1998), for example, show that the image of the Berle and Means
(1932) corporation with a widely dispersed ownership structure is only relevant for listed firms in
Anglo-Saxon countries. In Continental Europe, on the other hand, firms are typically controlled by
families, industrial corporations or even the State. Furthermore, La Porta et al. show that Belgium
is the country with the highest presence of pyramidal structures in their sample. These findings are
confirmed by Renneboog (2000), who also shows that holding companies are important investors in
Belgian listed firms. These are often part of the pyramidal ownership structures and are used to
lever control. Dewaelheyns and Van Hulle (2006) show that ignoring group ties may have a
negative impact on predictive reliability in the context of failure prediction models.
18
La Porta et al. (1999) and Dinç (2005), among others, argue that an entity may have a controlling stake if this
shareholder’s voting rights exceed 20%. Hence, we also investigate whether our results are different when we look
only at transactions whereby the bidding company’s ownership stake is 20% or less before the M&A announcement.
We identified 16 additional transactions where the bidder’s ownership stake before the merger was between 20% and
50%. However, the results do not change when we drop these transactions from the sample.

25
The inclusion of group firms in our sample may lead to two problems. First, if we only look
at direct ownership, our measure of ownership structure will be biased. Ultimate shareholders may
control these direct shareholders through multiple tiers of ownership (e.g. Renneboog, 2000;
Buysschaert et al., 2004). Therefore will look at a shareholder’s direct as well as its indirect
ownership stake to calculate its ultimate ownership. Second, an internal capital market may be
created between members of an industrial group and assets may be shifted from one entity to
another. Deloof (1998) provides evidence for the importance of internal capital markets for Belgian
private firms. By using consolidated financial statements, when available, this problem can be
overcome. When the acquiring company is a member of an industrial group but does not
consolidate itself, we look at the consolidated financial statements at the level of the ultimate
owner.
All the explanatory variables in our analysis are lagged during one year.19
This may cause a
problem only when a company undertakes an IPO in the same year as they make a merger or
acquisition because the IPO may have a serious impact on several of our explanatory variables. In
our sample, 17 transactions took place in the same year as the bidder’s IPO. We will drop these
transactions from the sample.
This resulted in a sample of 378 bidders that engaged in 816 M&A transactions between
1997 and 2005. Including acquiring firms that made more than one acquisition in a particular year
only once for that specific year resulted in a sample of 585 observations. Overall, 470 bidders
engaged in one M&A, 66 in two M&As and 49 in three or more M&A transactions in a particular
year. The sample is largely dominated by takeovers (96.57%) rather than mergers (3.43%).
Combining the sample firms with the matching firms resulted in a total sample of 1,170
observations from 155 different four-digit SIC industries. The industry distribution is shown in
Table 3. The three industries most represented in this sample are food and kindred products,
business services, and engineering and management services.
19
Alternativaly, we will estimate the model were the explanatory firm variables are measured as the average of the
value during the three years before the transaction.

26
<insert Table 3>
Table 4 provides an overview of the distribution of M&A transactions during the sampling
period and their method of payment. Cash is being used more as payment method when the bidder
is a privately held company (67.74% vis-à-vis 53.60% for public bidders). This is consistent with
the idea that target shareholders may be unwilling to accept stock when their company is taken over
by a private bidder.
<insert Table 4>
Table 5 presents an overview of the explanatory variables and the hypothesized sign of their
relation with the probability of takeover. The data for both the acquiring and matching firms are
measured one year before the transaction. To limit the influence of outliers, all variables are
winsorized at 5–95%, i.e. extreme values are replaced by the corresponding percentiles. Table 6
contains summary statistics on the explanatory variables and reports for the firm-level
characteristics the p-values corresponding to a parametric t-test and a non-parametric Wilcoxon
signed-rank test, respectively. These tests investigate whether the variables are significantly
different across acquiring and non-acquiring companies. Intangible assets (minus the goodwill paid
in earlier M&A deals) are significantly higher in the acquiring sample (1.43%) than in the non-
acquiring matching sample (0.64%) according to a Wilcoxon signed-rank test. Our results further
show that EBITDA/total assets equals 10.27% for acquirers and 11.64% for non-acquirers. Further,
the cash ratio is significantly larger for the non-acquiring companies (17.31%) than for the bidders
(10.27%). The ownership concentration index amounts to 49.08% in the sample of firms that
initiate M&As, which is significantly below the 95.54% for companies that do not engage in
M&As. Furthermore, acquirers have significantly less debt outstanding than non-acquirers. The
average debt/assets ratio for the acquiring sample equals 60.20% while it is 60.89% for the non-
acquirers. However, acquirers have a significantly higher proportion of bank loans in total debt
outstanding (41.37% vis-à-vis 30.39%). The data further show that acquirers pay out a larger
portion of their earnings as dividends. The payout dummy equals one for 45.47% of the bidders

27
and 11.28% of the matching firms. Bidding companies are also significantly larger than non-
acquiring firms. The results on the investment rate show that non-acquirers invest more in new
tangible fixed assets. Yet, this difference is only statistically significant according to a parametric t-
test.
We do not separately report the industry and aggregate market variables for the two samples,
as these are the same due to our matching procedure. First, we observe that the average size of
industry incumbents (6.55) is comparable to that of non-acquiring firms (5.87), indicating that our
random selection procedure has worked properly. Next, the average industry has a HH-
concentration index of only 16.32% and grows by 5.26% per annum. The average volume of
M&As relative to the total number of M&As equals 12.63%. The return on the Belgian All Shares
Index averages to 10.47% per annum during 1997–2005, with a standard deviation of 23.31%.
GDP grows by 2.24% on average and the average yield spread equals 1.09% whereas the average
term spread equals 1.21%.
<insert Tables 5-6>
4. Results
In this section, we discuss the results of various logit regression analyses. We first examine the
entire sample of acquiring and matching firms. In a second step, we split the sample according to
industry growth. Finally, we examine the choice between related and unrelated M&As.
4.1. Logit regression analysis on the entire sample
We estimate a logit regression model whereby the dependent variable is a binomial choice variable
that equals one if the company grows through a merger or acquisition in a particular year and zero
otherwise. A company and its matching firm are included only for the year of M&A in the analyses
whereas the explanatory variables are lagged during one year.20
A definition of the explanatory
20
We also test the robustness of our results by estimating a model whereby the explanatory firm variables are calculated
as the mean value over the past three years. The results from this robustness check (not reported in the text) show that
28
variables and the hypothesized sign of their relation with the probability of takeover was presented
in Table 5. Table 7 reports the correlations between the different explanatory variables in our
model. The pairwise correlation between stock market returns (BASI) and the yield spread equals -
0.80, indicating that multicollinearity is likely to be a problem for these variables. Hence, we do
not take up these two variables in the same regression model. The results of the logit regression
models are presented in Table 8. Panel A of Table 8 reports the results when including
EBITDA/total assets whereas the cash ratio is included in Panel B. In column 1 of each panel, we
report the models without interaction terms between ownership concentration and EBITDA/total
assets and the cash ratio, respectively. In column 2, we add these interaction terms. Column 3 of
each panel shows the results of the model without the quadratic terms of industry concentration and
industry growth. In column 4 we report the results of the models without ownership concentration
because this variable is only known for 435 out of the 585 acquiring firms in our sample.
<insert Tables 5–6>
The results in Table 8 show that the ratio of intangible to total assets is significantly
positively related to the probability of growing through an M&A, supporting the hypothesis that
synergy benefits from transferring knowledge and technology to another firm are an important
motive underlying mergers and acquisitions. This conclusion is consistent with the findings of
Lehto and Lehtoranta (2004).
We do not find any significant relation with internal cash flow generation, proxied by
EBITDA/total assets, nor with the available cash reserves, measured by the cash ratio. So, in
contrast to Harford (1999), we do not find that cash-rich firms are more probable to initiate M&As.
Furthermore, the coefficients on the interaction terms with ownership concentration are neither
significant, suggesting that agency problems are not the main driving factor behind the M&As of
firms with large internal cash flows. This finding may not be too surprising, given that the
descriptive statistics already showed a rather high ownership concentration in our sample and,
most of our conclusions are indeed robust, except for the ratio of intangible assets to total assets which becomes
insignificant and the bank debt variable which becomes only borderline significant (p-value of approximately 0.10).

29
hence, indicating that shareholders have a large interest in monitoring firm management. Yet, the
data do show that firms with a higher ownership concentration tend to engage less in mergers and
acquisitions. Although a negative coefficient could indicate that shareholders of closely held firms
may temper agency problems of equity by effectively monitoring the firm’s management, our
findings likely indicate that firms with a highly concentrated ownership structure care more about
preserving control and hence may find it difficult to finance their M&As.
The results further show that the debt/assets ratio is significantly positively related to
external growth in column 1 of Panel A. This is inconsistent with the findings of Hay and Liu
(1998) and contradicts the predictions of Jensen’s free cash flow theory (1986). Yet, a positive
relation may not be too surprising, given that we already documented earlier that agency problems
are not a major driving force behind the M&As in our sample. Then, a positive coefficient may
result when companies with high leverage are able and willing to issue stock as compensation for
their M&As (stock swap).
The significantly negative coefficient on the bank debt mix variable is consistent with the
bank monitoring idea. Yet, as agency problems are not a major driving force behind the M&As in
our sample, a negative coefficient on the portion of bank loans variable could also indicate that the
obligation to make interest payments and repay the loan principal limits the possibility to finance
M&As while simultaneously bank loan covenants could constrain external growth decisions.
Furthermore, firms with a high proportion of bank loans may follow more conservative external
growth decisions. Again consistent with the lack of agency problems in our sample, we find that
the dividend payout dummy is significantly positively related to the decision to grow through
M&As in columns 1 and 2 of Panel B.
Large firms are significantly more likely to become acquirers. This may indicate that large
firms have a better potential for realizing synergies. Furthermore, large firms often have – or can
more easily collect – the resources needed to acquire other companies.21
Remarkably, the variable
21
These conclusions also hold when using the log of total sales and the log of the number of employees as proxy for
size in stead of the log of total assets.

30
capturing the minimum efficient scale in the industry is significantly negatively related to the
probability of external growth. This may indicate that firms in industries with large players are not
growing anymore or – alternatively – they may be relying more on internal growth. Finally, firms
having the characteristics of acquirers could already be operating at their optimal scale in such
industries.
Industry concentration is significantly negatively related to the probability of M&A (in
columns 3 and 4) whereas the quadratic term in industry concentration is insignificant in all models.
In other words, the likelihood of engaging in M&As decreases with industry concentration. This
negative relation of industry concentration with external growth seems inconsistent with the market
power hypothesis. However, to really reject this conjecture, we need to examine the relation of
industry concentration in horizontal M&A decisions (see Section 4.3). Indeed, when firms are
generating large internal free cash flows in highly concentrated industries, they may engage in
diversifying M&As.
The relation between industry growth and M&A decisions is not significant in our sample,
which contradicts previous findings by Andrade and Stafford (2004) and Powell and Yawson
(2005). Consistent with the findings of Mitchell and Mulherin (1996) and Andrade et al. (2001),
the data show that industry deregulation is an important factor determining M&A activity. In
industries that experience a deregulation, M&As tend to occur more often, ceteris paribus.
However, this relation is only significant when we estimate the model without the ownership
concentration variable (column 4).
We do not find any evidence supporting the hubris and the under- or overvaluation
hypothesis. Given the high ownership concentration in our sample, the latter is not surprising.
Furthermore, we do not find a significant relation with real GDP growth nor with the term spread.22
22
These conclusions do not change when we replace stock market returns by the yield spread in our model. Hence, we
do not report the models with the yield spread in the paper, but the results can be obtained from the authors upon
request. Furthermore, the results are the same when using the total return on the Dow Jones Euro Stoxx Index instead
of the Belgian All Shares Index, when including nominal rather than real GDP growth, or when using the yield
difference on bonds with a modified duration of ten years instead of five years.

31
Overall, these results indicate that aggregate market conditions are not highly relevant in explaining
M&A activity in our sample.
The results further demonstrate that internal growth is insignificantly related to the
probability of M&A. This could indicate that internal and external growth are independent growth
strategies.23
<insert Table 8>
4.2. Low- versus high-growth industries
Table 9 provides the results of the logit regression analyses on two other subsamples. The first
subsample consists of the bidders and their corresponding matching firms from the industries with
the 25% lowest sales growth rate (Panel A). The second subsample consists of the firms from the
industries that are in the 25% highest growth percentile (Panel B).24, 25
The results in table 9 show
that the decision to grow through M&As may be driven by different factors depending on whether
the bidder operates in high- or low-growth industries.
Whereas leverage is significantly positively related to the probability of external growth in
the entire sample, the debt ratio is no longer significant in the subsample of low-growth industries
and becomes significantly negative in the subsample of high-growth industries (column 3). This
indicates that being financially constrained, due to high debt, reduces the probability of external
growth in high-growth industries. As companies in high-growth industries have many investment
opportunities, the access to financial resources may be especially important for these companies.
Further, the fact that profitability and cash reserves are insignificant in explaining M&As in the
low-growth subsample again confirms that agency problems of equity are not an important driver
underlying M&A in our sample as Jensen (1986) points out that agency problems of free cash flow
23
This also holds when we estimate the model for companies that made M&As in only one year during the sample
period. In this sample, the investment rate is not influenced by external growth. Furthermore, this conclusion is not
affected when we replace the investment rate by an interaction term between the investment rate and (1–debt ratio) and
a quotation dummy, respectively. 24
When we use the 33th
percentile instead of the 25th
percentile, we find the same results and conclusions. The results
from this robustness check are obtainable from the authors upon request. 25
The pairwise correlation between stock market returns and the yield spread also exceeds 0.7 in absolute value in these
subsamples. Hence, to avoid multicollinearity problems, we estimate the subsample models with stock market returns
and with the yield spread separately.

32
should be important especially for firms with limited growth prospects. In addition, the positive
coefficient on the pay-out dummy in the subsample of low-growth industries is also inconsistent
with the agency theory. Next, ownership concentration is only significant in low-growth industries,
indicating that shareholders of companies in high-growth industries may care less about preserving
control. The data further show that large firms with little bank debt but a lot of intangible capital
are more likely to be acquirers in both subsamples. These conclusions are consistent with the
findings for the entire sample.
Regarding the industry variables, there are also some important differences between low-
and high-growth industries. Industry concentration and the scale of industry incumbents are only
significant in explaining M&As in high-growth industries. Deregulation, on the other hand, seems
only to matter in low-growth industries. This result may not be too surprising, given that only four
out of the 28 companies in industries being deregulated are included in the high-growth subsample.
Finally, there is some evidence that GDP growth significantly negatively affect the M&A decision
of companies in low-growth industries (column 3). This finding is consistent with the bankruptcy
avoidance theory, suggesting that companies with limited growth opportunities may need to
combine in bad economic periods in order to survive.
<insert Table 9>
4.3. Related versus unrelated growth
Motives underlying external expansion in a related business could be very different from those
behind unrelated or diversifying mergers and acquisitions. Table 10 reports the results of a logit
regression analysis for the sample of firms that grow through a M&A (no matching is done here).
The dependent variable related equals one when the bidder engaged in an M&A where the target is
from the same four-digit SIC industry.26
If the bidder initiated various M&As in the same year, we
26
As a robustness check we have also used the two-digit SIC codes to classify the mergers and acquisitions but most
conclusions are identical.

33
set the dependent variable equal to one when at least one of the target firms is from the same
industry.27
The explanatory variables are the same as those in the above regression models.
The negative coefficient on the intangible assets variable suggests that the transfer of
knowledge and technology to a target firm is a more important motive underlying diversifying than
related mergers and acquisitions. This may result when firms in the same industry possess highly
comparable intangible assets, which makes it less worthwhile to engage in M&As in order to
transfer this capital to other firms. Conversely, complementary R&D efforts among firms from
various industries could pay off more, creating a huge potential for realizing synergies by
transferring knowledge to one another. The latter may result, for example, when unrelated M&As
are largely the result of vertical integration. Indeed, vertical integration is likely to be interesting
especially if the acquiring company has high technical requirements vis-à-vis its suppliers because
of its own high-tech production standards.
The results further show that EBITDA/ASSETS and the interaction term between
EBITDA/ASSETS and ownership concentration are not significant in explaining the relatedness of
M&As. This finding again indicates that agency problems of equity are not supported by our data,
as the existence of managerial incentive problems would imply that managers in firms with large
free cash flows and low ownership concentration would largely pursue diversifying M&As.
The data further show that highly levered, dividend-paying companies tend to engage in
related mergers and acquisitions. The positive coefficient on the debt ratio is inconsistent with the
financial synergy hypothesis, which conjecture that especially highly leveraged firms may seek to
reduce their systematic risk and realize a lower cost of capital by diversifying their operations.
Large firms are more likely to initiate diversifying M&As. This may indicate that larger
companies may have to look outside their own industry to fill their appetite for external growth,
given that we already documented that firm size is significantly positively related to the likelihood
27
Alternatively, we have set the dummy variable equal to one when all target firms are from the same four-digit SIC
industry in case the bidder was involved in multiple M&As in a particular year. The results are robust under this
alternative definition of related growth.

34
of M&A. Consistent with this size effect, we also find that diversifying M&As are significantly
more likely in industries where incumbents are already operating at a relatively high scale.
One of the most cited rationales behind horizontal mergers and acquisitions is the benefit of
realizing monopoly returns by increasing firm market power. Our results indicate that related
M&As indeed tend to occur in more highly concentrated industries. Yet, the quadratic term in
industry concentration is significantly negative, which indicates that from a certain level of
concentration (34.88% in the first regression model), further consolidation in the same industry is
more difficult to achieve. Industry growth, on the other hand, bears an U-shaped relation with the
likelihood of engaging in a related M&A, indicating that companies are less likely to grow through
related M&As when their industry growth is high, up till a certain level (12.52% in the first
regression model). This suggests that companies in low-growth industries are more likely to
consolidate in their own industries, which is consistent with the bankruptcy avoidance theory. This
is also supported by the negative coefficient on the Belgian All Shares Index, suggesting that related
M&As are more likely to take place in periods of low stock prices.
The above conclusions are robust when replacing stock market returns with the yield spread.
<insert Table 10>
5. Conclusions
This paper empirically investigates the determinants of growth through mergers and acquisitions.
For this purpose, we use data on 378 Belgian firms that grow through M&As during 1997–2005 and
match this sample with companies that did not pursue external growth.
Our results do not support the hypothesis that realizing operating synergies by means of
scale economies is an important determinant underlying external growth as the minimum efficient
scale in an industry is significantly negatively related to the decision to grow through M&A.
However, we do find support for the transfer of intangible capital as a principal motive behind
M&As. Furthermore, this motive is found to be important particularly in diversifying M&As,

35
where bidder and target could benefit from complementary knowledge and technologies, such as in
vertically integrating M&As. Next, we do not find any evidence supporting the financial synergy
hypothesis.
Our results also support the market power hypothesis because related mergers and
acquisitions are more likely to take place in more highly concentrated industries. However, from a
certain level of concentration, further consolidation in the same industry is more difficult to achieve.
Furthermore, the results are consistent with the bankruptcy avoidance theory as companies in low-
growth industries are more likely to consolidate in their own industries. Besides, we find that
industry deregulation significantly positively influences the M&A decision, consistent with the idea
that M&A can be used to realize industry restructuring after deregulation.
We do not find any support for agency problems or hubris underlying M&As in our sample
of typical Continental European companies, where ownership is highly concentrated even for
companies with limited growth opportunities.
Overall, our study contributes to the literature as it provides an empirical test of the most
widely cited motives in the theoretical M&A literature. We provide evidence on the motives that
are important for mergers and acquisitions in a Continental European setting. Furthermore, our
findings on the drivers of M&As may give some indications about potential sources of value
creation in &As. Our results show which firm characteristics, industry and market variables should
be further investigated when examining short- and long-term stock returns and operational
performance after mergers and acquisitions, especially in Continental European countries. Hence,
our findings may also explain why bidder announcement returns are found to be higher for
Continental European acquirers than for those in Anglo-Saxon countries.

36
References
Agrawal, A. and G.N. Mandelker (1990), Large shareholders and the monitoring of managers: The
case of antitakeover charter amendments, Journal of Financial and Quantitative Analysis 25, pp.
143-161.
Amihud, Y. and B. Lev (1981), Risk reduction as a managerial motive for conglomerate mergers,
Bell Journal of Economics 12, pp. 605-617.
Andrade, G. and E. Stafford (2004), Investigating the economic role of mergers, Journal of
Corporate Finance 10, pp. 1-36.
Andrade, G., Mitchell, M. and E. Stafford (2001), New evidence and perspectives on mergers,
Journal of Economic Perspectives 15, pp. 103-120.
Barnes, P. (1999), Predicting UK takeover targets: Some methodological issues and an empirical
study, Review of Quantitative Finance and Accounting 12, pp. 283-301.
Beckenstein, A.R. (1979), Merger activity and merger theories: An empirical investigation,
Antitrust Bulletin 24, pp. 105-128.
Becketti, S. (1986), Corporate mergers and the business cycle, Economic Review, Federal Reserve
Bank of Kansas City, pp. 13-26.
Berle, A. and G. Means (1932), The modern corporation and private property, Macmillan, New
York.
Berkovitch, E. and M.P. Narayanan (1993), Motives for takeovers: An empirical investigation,
Journal of Financial and Quantitative Analysis 28, pp. 347-362.
Blonigen, B. and C. Taylor (2000), R&D intensity and acquisitions in high-technology industries:
Evidence from the US electronic and electrical equipment industries, Journal of Industrial
Economics 48, pp. 47-70.
Bratton, W.W. and J.A. McCahery (2000), Comparative corporate governance and the theory of the
firm: The case against global cross reference, Columbia Journal of Transnational Law 38, pp.
213-289.

37
Bruner, R.F., Applied Mergers and Acquisitions, John Wiley & Sons, 2004.
Buysschaert, A., Deloof, M. and M. Jegers (2004), Equity sales in Belgian coporate goups:
expropriation of minority shareholders? A clinical study, Journal of Corporate Finance 10, pp. 81-
103.
Cabral, I. (2002), A herding approach to merger waves, working paper, European University
Institute.
Campa, J.M. and I. Hernando (2004), Shareholder Value Creation in European M&As, European
Financial Management 10, pp.47-81.
Carson, J.M. and R.E.Hoyt (2003), An empirical examination of sample selection methods in the
context of life insurer financial distress, Journal of Insurance issues 26, pp. 114-128.
Chang, S. (1998), Takeovers of privately held targets, methods of payment, and bidder returns,
Journal of Finance 53, pp. 773-784.
Conn, R.B, Cosh, A., Guest, P., and A. Hughes (2005), The impact on UK acquirers of domestic,
cross-border, public and private acquisitions, Journal of Business Finance and Accounting 32, pp.
815-870.
Danbolt, J. (2004), Target company cross-border effects in acquisitions into the UK, European
Financial Management 10, pp. 83-108.
Deloof, M. (1998), Internal capital markets, bank borrowing and financing constraints: evidence
from Belgian firms, Journal of Business Finance and Accounting 25, pp. 945-968.
Dewaelheyns, N. and C. Van Hulle (2006), Corporate failure prediction modeling: Distorted by
business groups internal capital markets, Journal of Business Finance and Accounting 33, pp.
909-931.
Diamond, D.W. (1984), Financial intermediation and delegated monitoring, Review of Economic
Studies 51, pp. 393-414.

38
Dickerson, A.P., Gibson, H.D. and E. Tsakalotos (1997), The impact of acquisitions on company
performance: Evidence from a large panel of UK firms, Oxford Economic Papers 49, pp. 344-
361.
Dickerson, A.P., Gibson H.D. and E. Tsakalotos (2003), Is attack the best form of defence? A
competing risks analysis of acquisition activity in the UK, Cambridge Journal of Economics 27,
pp. 337-557.
Dietrich, J. and Sorenson, E. (1984), An application of logit analysis to prediction of merger targets,
Journal of Business Research 12, pp. 393-402.
Dinç, I.S. (2005), Politicians and banks: political influences on government-owned banks in
emerging markets, Journal of Financial Economics 77, pp.453-479.
Duggal, R. and J.A. Millar (1999), Institutional ownership and firm performance: The case of
bidder returns, Journal of Corporate Finance 5, pp. 103-117.
Eckbo, B.E. (1983), Horizontal mergers, collusion and stockholder wealth, Journal of Financial
Economics 11, pp. 241-273.
Faccio, M. and L.H.P. Lang (2002), The ultimate ownership of Western European corporations,
Journal of Financial Economics 65, pp. 365-395.
Faccio, M. and R.W. Masulis (2005), The choice of payment method in European mergers and
acquisitions, Journal of Finance 60, pp. 1345-1388.
Fuller, K., Netter, J. and M. Stegemoller (2002), What do returns to acquiring firms tell us?
Evidence from firms that make many acquisitions, Journal of Finance 57, pp. 1763-1793.
Gaeremynck A, Steurs G, Veugelers R (1998), On the disclosure and capitalization of research and
development spending: some empirical observations for Flanders, DTEW Research Report 9822,
K.U.Leuven, 24 pp.
Gaughan, P.A., Mergers, acquisitions, and corporate restructurings, Third edition, John Wiley &
Sons, 2002.

39
Goergen, M. and L. Renneboog (2004), Shareholder wealth effects of European domestic and cross-
border takeover bids, European Financial Management 10, pp. 9-45.
Guerard, J.B. (1985), Mergers, stock prices, and industrial production: An empirical test of the
Nelson hypothesis. In O.D. Anderson, ed., Time Series Analysis: Theory and Practice, Elsevier,
pp. 239-247.
Guerard, J.B. (1989), Mergers, stock prices, and industrial production: Further evidence, Economics
Letters 30, pp. 161-164.
Golbe, D. and L. White (1988), Mergers and acquisitions in the US economy: An aggregate and
historical overview. In A. Auerbach, ed., Mergers and Acquisitions, University of Chicago Press,
pp. 25-47.
Gort, M. (1969), An economic disturbance theory of mergers, Quarterly Journal of Economics 83,
pp. 624-642.
Hall, B.H., Berndt, E. and R.C. Levin (1990), The impact of corporate restructuring on industrial
research and development, Brookings papers on Economic Activity 1, pp. 85-136.
Harford, J. (1999), Corporate cash reserves and acquisitions, Journal of Finance 54, pp. 1969-1997.
Hay, D.A. and G.S. Liu (1998), When do firms go in for growth by acquisitions?, Oxford Bulletin
of Economics and Statistics 60, pp. 143-164.
Heckman, J.J. (1979), Sample Selection Bias as a Specification Error, Econometrica 47, pp. 153-
161.
Huyghebaert, N. and L.M. Van de Gucht (2004), Incumbent strategic behavior in financial markets
and the exit of entrepreneurial start-ups, Strategic Management Journal 25, pp. 669-688.
Huyghebaert, N., Van de Gucht, L.M. and C. Van Hulle (2006), The choice between bank debt and
trade credit in business start-ups: Financing costs versus liquidation policy, Small Business
Economics, forthcoming.

40
Holmstrom, B. and S.N. Kaplan (2001), Corporate governance and merger activity in the United
States: Making sense of the 1980s and 1990s, Journal of Economic Perspectives 15(2), pp. 121-
144.
Ismail, A. (2005), M&A motives: Evidence from the European financial services industry,
Investment Management and Financial Innovations 4, pp. 137-150.
James, C. (1987), Some evidence on the uniqueness of bank loans, Journal of Financial Economics
19, pp. 217-235.
Jarrell, G.A., Brickley, J.A. and J.M. Netter (1988), The market for corporate control: The empirical
evidence since 1980, Journal of Economic Perspectives 2, pp. 49-68.
Jensen, M.C. (1986), Agency costs of free cash flow, corporate finance, and takeovers, American
Economic Review 76, pp. 323-329.
Jensen, M.C. and R.S. Ruback (1983), The market for corporate control, Journal of Financial
Economics 11, pp. 5-50.
La Porta, R., Lopez-de-Silanes, F., Shleifer, A. and R.W. Vishny (1998), Law and finance, Journal
of Political Economy 106, pp. 1113-1155.
La Porta, R., Lopez-de-Silanes, F., Shleifer, A. and R.W. Vishny (1999), Corporate ownership
around the world, Journal of Finance 54, pp. 471-528.
Lehto, E. and O. Lehtoranta (2004), Becoming an acquirer and becoming acquired, Technological
Forecasting and Social Change 71, pp. 635-650.
Lehto, E. and O. Lehtoranta (2006), How do innovations affect mergers and acquisitions? Evidence
from Finland, Journal of Industry, Competition and Trade 6, pp. 5-25.
Lewellen, W.G. (1970), A pure financial rationale for the conglomerate merger, Journal of Finance
26, pp. 521-537.
Lewellen, W., Loderer C. and A. Rosenfeld (1985), Merger decisions and executive stock
ownership in acquiring firms, Journal of Accounting and Economics 7, pp. 209-231.

41
Linn, S.C. and J.A. Switzer (2001), Are cash acquisitions associated with better post-combination
operating performance than stock acquisitions?, Journal of Banking & Finance 25, pp. 1113-1138.
Loughran, T. and A. Vijh (1997), Do long-term shareholders benefit from corporate acquisitions?
Journal of Finance 52, pp. 1765-1790.
Manski, C.F. and S.R. Lerman (1977), The estimation of choice probabilities from choice based
samples, Econometrica 45, pp. 1977-1988.
Maksimovic, V. and G. Phillips (2001), The market for corporate assets: Who engages in mergers
and asset sales and are there efficiency gains?, Journal of Finance 56, pp. 2019-2065.
Malmendier U. and G. Tate (2004), Who Makes Acquisitions? CEO Overconfidence and the
Market’s Reaction, NBER Working Paper 10813.
Martin, K.J. (1996), The method of payment in corporate acquisitions, investment opportunities and
management ownership, Journal of Finance 51, pp. 1227-1246.
Melicher, R.W., Ledolter, J. and L.J. D’Antonio (1983), A time series analysis of aggregate merger
activity, Review of Economics & Statistics 65, pp. 423-430.
Mitchell, M.L., and J.H. Mulherin (1996), The impact of industry shocks on takeover and
restructuring activity, Journal of Financial Economics 41, pp. 193-229.
Moeller, S.B., Schlingemann, F.P. and R.M. Stulz (2004), Firm size and the gains from
acquisitions, Journal of Financial Economics 73, pp. 201-228.
Morck, R., Shleifer, A. and R.W. Vishny (1990), Do managerial objectives drive bad acquisitions?,
Journal of Finance 45, pp. 31-48.
Mulherin, J.H. and A.L. Boone (2000), Comparing acquisitions and divestitures, Journal of
Corporate Finance 6, pp. 117-139.
Myers, S.C. (1977), Determinants of corporate borrowing, Journal of Financial Economics 5, pp.
147-175.
Myers, S.C. and N.S. Majluf (1984), Corporate financing and investment decisions when firms have
information that investors do not have, Journal of Financial Economics 13, pp. 187-221.

42
Nelson, R., Merger movements in American Industry 1895–1956, Princeton: Princeton University
Press, 1959.
Pagano, M., Panetta, F. and L. Zingales (1998), Why do companies go public? An empirical
analysis, Journal of Finance 53, pp. 27-64.
Palepu, K.G. (1986), Predicting takeover targets: A methodological and empirical analysis, Journal
of Accounting and Economics 8, pp. 3-35.
Powell, R. (2001), Takeover prediction and portfolio performance: A note, Journal of Business
Finance and Accounting 28, pp. 993-1011.
Powell, R. and A. Yawson (2005), Industry aspects of takeovers and divestitures: Evidence from the
UK, Journal of Banking & Finance 29, pp. 3015-3040.
Renneboog, L. (2000), Ownership, managerial control and the governance of companies listed on
the Brussels stock exchange, Journal of Banking & Finance 24, pp. 1959-1995.
Rhodes-Kropf, M. and S. Viswanathan (2004), Market valuation and merger waves, Journal of
Finance 59, pp. 2685-2718.
Scharfstein, D.S. and J.C. Stein (1990), Herding behavior and investment, American Economic
Review 80, pp. 465-479.
Servaes, H. (1991), Tobin’s q and the gains from takeovers, Journal of Finance 46, pp. 409-419.
Shleifer, A. and R.W. Vishny (2003), Stock market driven acquisitions, Journal of Financial
Economics 70, pp. 295-311.
Sudarsanam, S., Creating value from mergers and acquisitions: The Challenges, Financial
Times/Prentice Hall, 2003.
Sorenson, D.E. (2000), Characteristics of merging firms, Journal of Economics and Business 52,
pp. 423-433.
Steiner, P.O., Mergers: Motives, effects, policies, University of Michigan Press, Ann Arbor, 1975.
Trahan, E.A. (1993), Financial characteristics of acquiring firms and their relation to the wealth
effects of acquisition announcements, Journal of Economics and Finance 17, pp. 21-35.

43
Trautwein, F. (1990), Merger motives and merger prescriptions, Strategic Management Journal 11,
pp. 283-295.
Travlos, N. (1987), Corporate takeover bids, methods of payment, and bidding firms’ stock returns,
Journal of Finance 42, pp. 943-963.
Van Hulle, C., Vermaelen, T. and P. de Wouters, Regulation, taxes and the market for corporate
control in Belgium (1991), Journal of Banking and Finance 15, pp. 1143-1170.
Verbeek, M., A guide to modern econometrics, Second Edition, John Wiley & Sons, 2004.
Weston, J.F. and P.S. Jawien (1999), Perspectives on mergers and restructuring, Business
Economics 34, pp. 29-33.
Weston, J.F., Siu, A.S. and B.A. Johnson, Takeovers, restructuring and corporate governance, Third
edition, Prentice-Hall, 2001.
Wilner, B.S. (2000), The exploitation of relationships in financial distress: The case of trade credit,
Journal of Finance 55, pp. 153-178.
Zmijewski, M.E. (1984), Methodological issues related to the estimation of financial distress
prediction models, Journal of Accounting Research 22, pp.59-82.

44
Figure 1: M&A activity in Belgium and in the European Union
Source: The Zephyr database
0
200
400
600
800
1997 1998 1999 2000 2001 2002 2003 2004 2005
Nu
mb
er
of
M&
A in
Be
lgiu
m
0
5000
10000
15000
20000
25000
30000
Nu
mb
er
of
M&
A in
th
e
Eu
rop
ea
n U
nio
n
Belgium
European Union

45
Table 1: Deal status
Deal status Number of transactions
Completed 728 79.30%
Announced 155 16.88%
Withdrawn 9 0.98%
Pending 25 2.72%
Unconditional 1 0.11%
Total sample 918 100%
Table 2: Type of transaction
Type of transaction Number of transactions
New shareholder takes over control 785 85.51%
Acquisition increased from ≤ 20% to ≥ 50% 3 0.33%
Acquisition increased from > 20% and < 50% to ≥ 50% 16 1.74% Acquisition
Acquisition increased from ≥ 50% to > 50% 85 9.26%
Merger New shareholder 29 3.16%
Total sample 918 100%

46
Table 3: Industry distribution of the acquiring firms
This table provides an overview of the industry distribution of the 638 observations of acquiring firms at the two-digit
SIC level.
SIC code Industry Number of observations
02 Agricultural production crops 1
10 Metal mining 1
12 Coal mining 1
14 Nonmetallic minerals, except fuels 2
15 General building contractors 7
16 Heavy construction, ex. building 8
17 Special trade contractors 10
20 Food and kindred products 45
22 Textile mill products 11
24 Lumber and wood products 4
25 Furniture and fixtures 3
26 Paper and allied products 9
27 Printing and publishing 39
28 Chemicals and allied products 26
29 Petroleum and coal products 4
30 Rubber and misc. plastic products 11
32 Stone, clay and glass products 11
33 Primary metal industries 20
34 Fabricated metal products 9
35 Industrial machinery and equipment 14
36 Electronic &other electronic equipment 20
37 Transportation equipment 3
38 Instruments and related products 1
39 Miscellaneous manufacturing industries 8
40 Railroad transportation 2
41 Local and interurban passenger transit 3
42 Trucking and warehousing 15
44 Water transportation 7
45 Transportation by air 2
47 Transportation services 8
48 Communication 12
49 Electric, gas and sanitary services 1
50 Wholesale trade-durable goods 36
51 Wholesale trade-nondurable goods 36
52 Building materials & garden supplies 1
53 General merchandise stores 2
54 Food stores 8
56 Apparel and accessory stores 4
57 Furniture and homefurnishing stores 4
58 Eating and drinking places 4
59 Miscellaneous retail 10
72 Personal services 11
73 Business services 77
78 Motion pictures 6
79 Amusement & recreation services 2
80 Health services 5
81 Legal services 4
87 Engineering & management services 55
91 Executive, legislative, and general 1
96 Administration of economic programs 1
TOTAL 585

47
Table 4: An overview of the M&A transactions in our sample period
This table provides an overview of the distribution of M&A transactions during the sampling period and the method of
payment. The information on the method of payment is based on data of 134 transactions.
Year Number of
firms
Number of
transactions % Cash
% Cash
(public
bidders)
% Cash
(private
bidders)
1997 10 13 NA NA NA
1998 48 61 50,00% 100,00% 33,33%
1999 42 62 36,36% 16,67% 60,00%
2000 65 113 36,00% 27,27% 100,00%
2001 64 99 42,11% 38,46% 50,00%
2002 60 97 60,00% 53,33% 80,00%
2003 95 117 73,68% 55,56% 90,00%
2004 95 124 57,14% 50,00% 71,43%
2005 106 130 73,33% 87,50% 57,14%
Total 585 816 53.58% 53,60% 67,74%
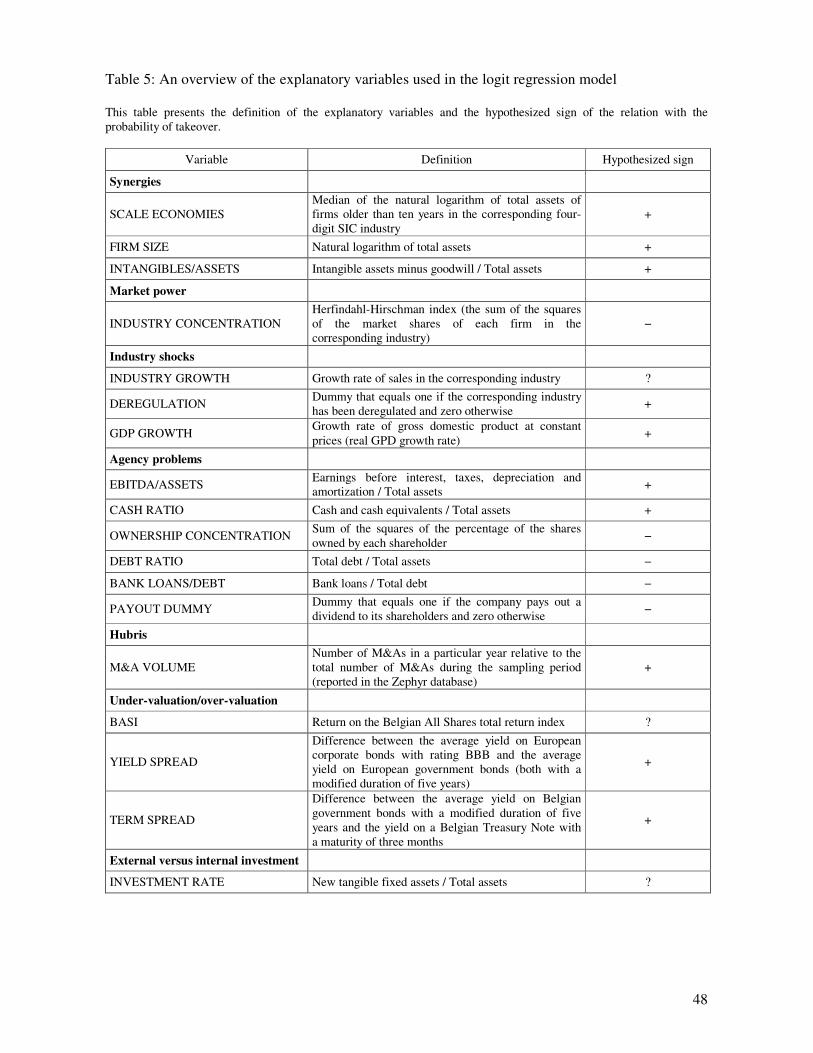
48
Table 5: An overview of the explanatory variables used in the logit regression model
This table presents the definition of the explanatory variables and the hypothesized sign of the relation with the
probability of takeover.
Variable Definition Hypothesized sign
Synergies
SCALE ECONOMIES
Median of the natural logarithm of total assets of
firms older than ten years in the corresponding four-
digit SIC industry
+
FIRM SIZE Natural logarithm of total assets +
INTANGIBLES/ASSETS Intangible assets minus goodwill / Total assets +
Market power
INDUSTRY CONCENTRATION
Herfindahl-Hirschman index (the sum of the squares
of the market shares of each firm in the
corresponding industry)
−
Industry shocks
INDUSTRY GROWTH Growth rate of sales in the corresponding industry ?
DEREGULATION Dummy that equals one if the corresponding industry
has been deregulated and zero otherwise +
GDP GROWTH Growth rate of gross domestic product at constant
prices (real GPD growth rate) +
Agency problems
EBITDA/ASSETS Earnings before interest, taxes, depreciation and
amortization / Total assets +
CASH RATIO Cash and cash equivalents / Total assets +
OWNERSHIP CONCENTRATION Sum of the squares of the percentage of the shares
owned by each shareholder −
DEBT RATIO Total debt / Total assets −
BANK LOANS/DEBT Bank loans / Total debt −
PAYOUT DUMMY Dummy that equals one if the company pays out a
dividend to its shareholders and zero otherwise −
Hubris
M&A VOLUME
Number of M&As in a particular year relative to the
total number of M&As during the sampling period
(reported in the Zephyr database)
+
Under-valuation/over-valuation
BASI Return on the Belgian All Shares total return index ?
YIELD SPREAD
Difference between the average yield on European
corporate bonds with rating BBB and the average
yield on European government bonds (both with a
modified duration of five years)
+
TERM SPREAD
Difference between the average yield on Belgian
government bonds with a modified duration of five
years and the yield on a Belgian Treasury Note with
a maturity of three months
+
External versus internal investment
INVESTMENT RATE New tangible fixed assets / Total assets ?

49
Table 6: Summary statistics
In this table, we report the mean, median and standard deviation of the firm characteristics, industry and aggregate
market variables for the M&A firms (Y=1) and their matching counterparts (Y=0). For each firm characteristic, we also
report the p-value of a parametric t-test and a non-parametric Wilcoxon signed-rank test that compares companies that
grow trough a merger or acquisition in a particular year with companies that did not grow through M&A.
Y=1 Y=0 t-test Wilcoxon
test
Firm characteristics Mean Median Std. Dev. Mean Median Std. Dev. p-value p-value
INTANGIBLES/ASSETS 0.0143 0.0015 0.0258 0.0064 0.0000 0.0204 0.0000 0.0000
EBITDA/ASSETS 0.1027 0.0967 0.1082 0.1164 0.1006 0.1361 0.0569 0.2006
CASH RATIO 0.1027 0.0531 0.1336 0.1731 0.0930 0.1932 0.0000 0.0000
OWNERSHIP
CONCENTRATION 0.4908 0.3741 0.3830 0.9554 1.0000 0.1819 0.0000 0.0000
DEBT RATIO 0.6020 0.6252 0.2575 0.6089 0.6424 0.3130 0.6784 0.4349
BANK LOANS/DEBT 0.4137 0.4127 0.2995 0.3039 0.2226 0.3083 0.0000 0.0000
PAYOUT DUMMY 0.4547 0.0000 0.4984 0.1128 0.0000 0.3166 0.0000 0.0000
FIRM SIZE 10.5361 10.8337 2.4045 5.8682 5.6276 1.8682 0.0000 0.0000
INVESTMENT RATE 0.0447 0.0249 0.0589 0.0588 0.0250 0.0785 0.0033 0.6094
Total sample
Industry variables Mean Median Std. Dev.
SCALE ECONOMIES 6.5472 6.3244 1.0598
INDUSTRY
CONCENTRATION 0.1632 0.0928 0.1737
INDUSTRY GROWTH 0.0526 0.0425 0.1688
DEREGULATION 0.0239 0.0000 0.1530
Market variables Mean Median Std. Dev.
M&A VOLUME 0.1263 0.1233 0.0413
BASI 0.1047 0.1601 0.2331
GDP GROWTH 0.0224 0.0168 0.0111
YIELD SPREAD 0.0109 0.0127 0.0056
TERM SPREAD 0.0121 0.0114 0.0049
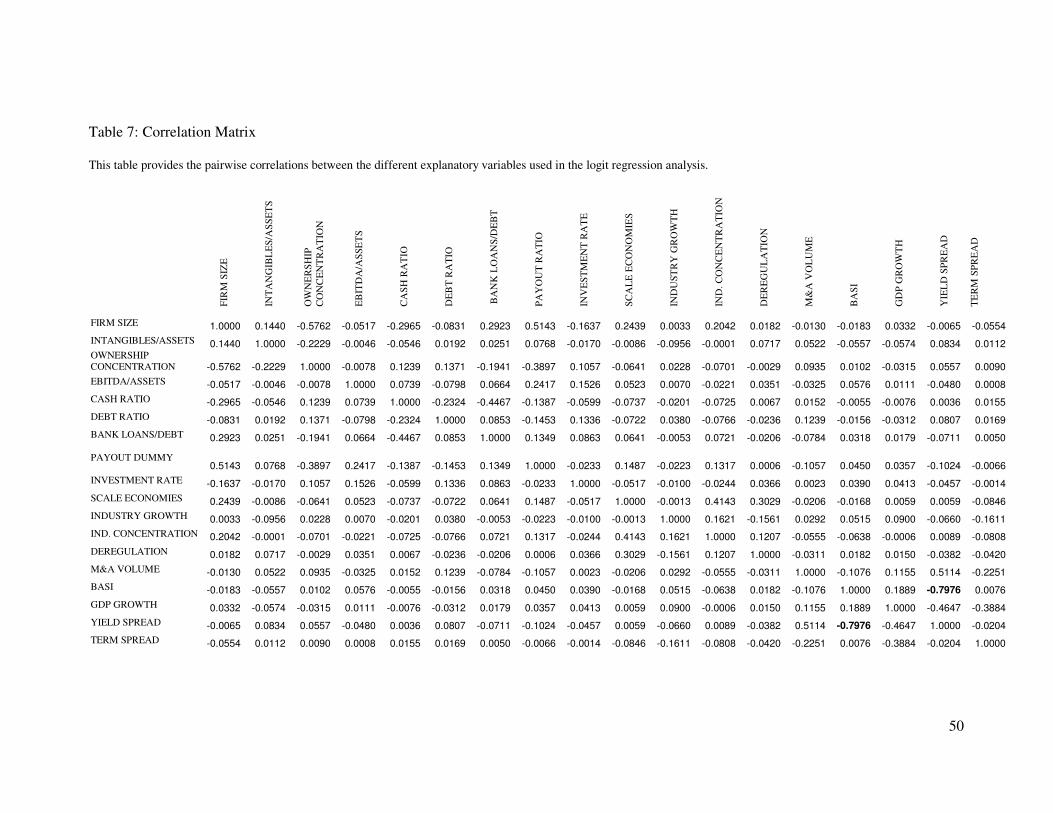
50
Table 7: Correlation Matrix
This table provides the pairwise correlations between the different explanatory variables used in the logit regression analysis.
FIR
M S
IZE
INT
AN
GIB
LE
S/A
SS
ET
S
OW
NE
RS
HIP
CO
NC
EN
TR
AT
ION
EB
ITD
A/A
SS
ET
S
CA
SH
RA
TIO
DE
BT
RA
TIO
BA
NK
LO
AN
S/D
EB
T
PA
YO
UT
RA
TIO
INV
ES
TM
EN
T R
AT
E
SC
AL
E E
CO
NO
MIE
S
IND
US
TR
Y G
RO
WT
H
IND
. C
ON
CE
NT
RA
TIO
N
DE
RE
GU
LA
TIO
N
M&
A V
OL
UM
E
BA
SI
GD
P G
RO
WT
H
YIE
LD
SP
RE
AD
TE
RM
SP
RE
AD
FIRM SIZE 1.0000 0.1440 -0.5762 -0.0517 -0.2965 -0.0831 0.2923 0.5143 -0.1637 0.2439 0.0033 0.2042 0.0182 -0.0130 -0.0183 0.0332 -0.0065 -0.0554
INTANGIBLES/ASSETS 0.1440 1.0000 -0.2229 -0.0046 -0.0546 0.0192 0.0251 0.0768 -0.0170 -0.0086 -0.0956 -0.0001 0.0717 0.0522 -0.0557 -0.0574 0.0834 0.0112 OWNERSHIP CONCENTRATION -0.5762 -0.2229 1.0000 -0.0078 0.1239 0.1371 -0.1941 -0.3897 0.1057 -0.0641 0.0228 -0.0701 -0.0029 0.0935 0.0102 -0.0315 0.0557 0.0090
EBITDA/ASSETS -0.0517 -0.0046 -0.0078 1.0000 0.0739 -0.0798 0.0664 0.2417 0.1526 0.0523 0.0070 -0.0221 0.0351 -0.0325 0.0576 0.0111 -0.0480 0.0008
CASH RATIO -0.2965 -0.0546 0.1239 0.0739 1.0000 -0.2324 -0.4467 -0.1387 -0.0599 -0.0737 -0.0201 -0.0725 0.0067 0.0152 -0.0055 -0.0076 0.0036 0.0155
DEBT RATIO -0.0831 0.0192 0.1371 -0.0798 -0.2324 1.0000 0.0853 -0.1453 0.1336 -0.0722 0.0380 -0.0766 -0.0236 0.1239 -0.0156 -0.0312 0.0807 0.0169
BANK LOANS/DEBT 0.2923 0.0251 -0.1941 0.0664 -0.4467 0.0853 1.0000 0.1349 0.0863 0.0641 -0.0053 0.0721 -0.0206 -0.0784 0.0318 0.0179 -0.0711 0.0050
PAYOUT DUMMY 0.5143 0.0768 -0.3897 0.2417 -0.1387 -0.1453 0.1349 1.0000 -0.0233 0.1487 -0.0223 0.1317 0.0006 -0.1057 0.0450 0.0357 -0.1024 -0.0066
INVESTMENT RATE -0.1637 -0.0170 0.1057 0.1526 -0.0599 0.1336 0.0863 -0.0233 1.0000 -0.0517 -0.0100 -0.0244 0.0366 0.0023 0.0390 0.0413 -0.0457 -0.0014
SCALE ECONOMIES 0.2439 -0.0086 -0.0641 0.0523 -0.0737 -0.0722 0.0641 0.1487 -0.0517 1.0000 -0.0013 0.4143 0.3029 -0.0206 -0.0168 0.0059 0.0059 -0.0846
INDUSTRY GROWTH 0.0033 -0.0956 0.0228 0.0070 -0.0201 0.0380 -0.0053 -0.0223 -0.0100 -0.0013 1.0000 0.1621 -0.1561 0.0292 0.0515 0.0900 -0.0660 -0.1611
IND. CONCENTRATION 0.2042 -0.0001 -0.0701 -0.0221 -0.0725 -0.0766 0.0721 0.1317 -0.0244 0.4143 0.1621 1.0000 0.1207 -0.0555 -0.0638 -0.0006 0.0089 -0.0808
DEREGULATION 0.0182 0.0717 -0.0029 0.0351 0.0067 -0.0236 -0.0206 0.0006 0.0366 0.3029 -0.1561 0.1207 1.0000 -0.0311 0.0182 0.0150 -0.0382 -0.0420
M&A VOLUME -0.0130 0.0522 0.0935 -0.0325 0.0152 0.1239 -0.0784 -0.1057 0.0023 -0.0206 0.0292 -0.0555 -0.0311 1.0000 -0.1076 0.1155 0.5114 -0.2251
BASI -0.0183 -0.0557 0.0102 0.0576 -0.0055 -0.0156 0.0318 0.0450 0.0390 -0.0168 0.0515 -0.0638 0.0182 -0.1076 1.0000 0.1889 -0.7976 0.0076
GDP GROWTH 0.0332 -0.0574 -0.0315 0.0111 -0.0076 -0.0312 0.0179 0.0357 0.0413 0.0059 0.0900 -0.0006 0.0150 0.1155 0.1889 1.0000 -0.4647 -0.3884
YIELD SPREAD -0.0065 0.0834 0.0557 -0.0480 0.0036 0.0807 -0.0711 -0.1024 -0.0457 0.0059 -0.0660 0.0089 -0.0382 0.5114 -0.7976 -0.4647 1.0000 -0.0204
TERM SPREAD -0.0554 0.0112 0.0090 0.0008 0.0155 0.0169 0.0050 -0.0066 -0.0014 -0.0846 -0.1611 -0.0808 -0.0420 -0.2251 0.0076 -0.3884 -0.0204 1.0000

51
Table 8 (Panel A): Logit Regression Results on the M&A Decision
The dependent variable equals one if the company grows through M&A in a particular year and zero otherwise. A company and its matching firm are included in the analyses
only for the year of M&A. A definition of the explanatory variables and the hypothesized sign of their relation with the probability of takeover is presented in Table 5.
(1) (2) (3) (4)
Variable Coefficient p-value Coefficient p-value Coefficient p-value Coefficient p-value
C -4.7999 0.0118 -5.2434 0.0066 -5.0297 0.0082 -4.2526 0.0016
INTANGIBLES/ASSETS 31.4686 0.0002 31.9543 0.0001 31.5603 0.0001 26.8061 0.0000
EBITDA/ASSETS 0.3706 0.8402 4.5835 0.2505 4.6947 0.2368 0.4155 0.7337
EBITDA/ASSETS * OWNERSHIP
CONCENTRATION -5.5238 0.2373 -5.6863 0.2211
CASH RATIO
CASH RATIO * OWNERSHIP
CONCENTRATION
OWNERSHIP CONCENTRATION -2.8428 0.0000 -2.2401 0.0012 -2.2000 0.0014
DEBT RATIO 1.2935 0.0881 1.2254 0.1029 1.2189 0.1008 0.5513 0.2837
BANK LOANS/DEBT -1.4101 0.0474 -1.3905 0.0521 -1.3697 0.0562 -0.7875 0.1017
PAYOUT DUMMY 0.7216 0.1195 0.7216 0.1239 0.6682 0.1491 0.2880 0.4111
FIRM SIZE 1.3332 0.0000 1.3405 0.0000 1.3414 0.0000 1.2504 0.0000
INVESTMENT RATE 0.5741 0.8251 0.5318 0.8393 0.3887 0.8815 1.3370 0.4622
SCALE ECONOMIES -0.7329 0.0018 -0.7373 0.0017 -0.7924 0.0003 -0.8663 0.0000
INDUSTRY CONCENTRATION -5.9048 0.1447 -5.7908 0.1558 -3.1307 0.0175 -5.5356 0.0585
INDUSTRY CONCENTRATION² 5.0526 0.4501 4.5742 0.4990 4.2748 0.3730
INDUSTRY GROWTH -0.9820 0.3776 -1.0320 0.3575 -0.9574 0.3728 -0.6737 0.4552
INDUSTRY GROWTH² 0.6046 0.8807 0.7659 0.8501 0.1864 0.9529
DEREGULATION 1.5589 0.2148 1.7484 0.1737 1.8449 0.1565 2.8016 0.0034
M&A VOLUME 3.6579 0.4214 3.9475 0.3903 3.8433 0.4027 1.0257 0.7491
BASI -0.1291 0.8697 -0.1407 0.8584 -0.1181 0.8805 -0.0697 0.9037
GDP GROWTH -3.8260 0.8367 -5.0867 0.7859 -5.0228 0.7882 -14.5102 0.2774
TERM SPREAD -10.8784 0.8027 -12.5252 0.7758 -13.0551 0.7588 18.0344 0.5703
McFadden R-squared 0.7728 0.7742 0.7737 0.6488

52
Table 8 (Panel B): Logit Regression Results on the M&A Decision
(1) (2) (3) (4)
Variable Coefficient p-value Coefficient p-value Coefficient p-value Coefficient p-value
C -4.2315 0.0298 -4.2525 0.0298 -3.9992 0.0371 -3.9909 0.0048
INTANGIBLES/ASSETS 31.6582 0.0002 31.5538 0.0002 31.2028 0.0002 26.7570 0.0000
EBITDA/ASSETS
EBITDA/ASSETS * OWNERSHIP
CONCENTRATION
CASH RATIO -1.6966 0.2965 -1.3352 0.7158 -1.4708 0.6848 -0.4232 0.6775
CASH RATIO * OWNERSHIP
CONCENTRATION -0.4821 0.9123 -0.3878 0.9289
OWNERSHIP CONCENTRATION -2.8121 0.0000 -2.7708 0.0000 -2.7566 0.0000
DEBT RATIO 1.0201 0.1984 1.0158 0.2010 0.9972 0.2047 0.4319 0.4328
BANK LOANS/DEBT -1.5431 0.0325 -1.5415 0.0326 -1.5285 0.0348 -0.8214 0.0981
PAYOUT DUMMY 0.7584 0.0892 0.7559 0.0907 0.7035 0.1105 0.3200 0.3383
FIRM SIZE 1.3129 0.0000 1.3114 0.0000 1.3111 0.0000 1.2393 0.0000
INVESTMENT RATE 0.5398 0.8315 0.5286 0.8349 0.3582 0.8869 1.4091 0.4339
SCALE ECONOMIES -0.7298 0.0017 -0.7276 0.0019 -0.7836 0.0003 -0.8639 0.0000
INDUSTRY CONCENTRATION -5.8877 0.1466 -5.8952 0.1461 -3.1781 0.0145 -5.5805 0.0568
INDUSTRY CONCENTRATION² 4.6473 0.4882 4.6644 0.4868 4.3224 0.3680
INDUSTRY GROWTH -1.0172 0.3582 -1.0232 0.3559 -0.9498 0.3706 -0.6734 0.4540
INDUSTRY GROWTH² 0.6815 0.8660 0.6907 0.8643 0.2350 0.9406
DEREGULATION 1.7623 0.1653 1.7171 0.1981 1.8277 0.1765 2.8234 0.0033
M&A VOLUME 3.8422 0.3952 3.8126 0.3994 3.7046 0.4122 1.0796 0.7355
BASI -0.0765 0.9224 -0.0719 0.9272 -0.0469 0.9522 -0.0725 0.9000
GDP GROWTH -5.1055 0.7832 -4.9631 0.7896 -4.9027 0.7917 -15.0343 0.2620
TERM SPREAD -11.9162 0.7850 -12.5131 0.7762 -12.5120 0.7686 17.4556 0.5849
McFadden R-squared 0.7739 0.7739 0.7734 0.6489

53
Table 9 (Panel A): Logit Regression Analysis on the M&A Decision for the Subsample of Low-growth Industries
The dependent variable equals one if the company grows through M&A in a particular year and zero otherwise. A company and its matching firm are included in the analyses
only for the year of M&A. A definition of the explanatory variables and the hypothesized sign of their relation with the probability of takeover is presented in Table 5. We
estimate the models for companies that are in the 25% lowest growth percentile (Panel A) and for companies that are in the 25% highest growth percentile (Panel B).
(1) (2) (3) (4)
Variable Coefficient p-value Coefficient p-value Coefficient p-value Coefficient p-value
C -3.0991 0.5812 -5.7391 0.0374 -1.5637 0.7970 -5.3009 0.0712
INTANGIBLES/ASSETS 29.0564 0.0719 20.7436 0.0352 32.9321 0.0607 20.5192 0.0379
EBITDA/ASSETS 6.8681 0.4339 1.7592 0.4326
EBITDA/ASSETS * OWNERSHIP
CONCENTRATION -10.4347 0.3760
CASH RATIO -3.4190 0.6974 -0.1678 0.9299
CASH RATIO * OWNERSHIP
CONCENTRATION 5.9235 0.5686
OWNERSHIP CONCENTRATION -5.1302 0.0132 -6.8818 0.0011
DEBT RATIO 2.9214 0.1866 0.8961 0.3957 2.9666 0.1792 0.7926 0.4736
BANK LOANS/DEBT -1.0950 0.5643 -2.0444 0.0505 -1.2538 0.4849 -1.8110 0.0813
PAYOUT DUMMY 2.2014 0.0837 -0.2649 0.7155 2.1141 0.0774 -0.0693 0.9174
FIRM SIZE 1.4785 0.0000 1.2889 0.0000 1.5280 0.0000 1.2502 0.0000
INVESTMENT RATE 5.2510 0.4628 -0.0368 0.9921 5.1426 0.4918 -0.1382 0.9709
SCALE ECONOMIES -0.8277 0.1427 -0.4354 0.1773 -0.8969 0.1232 -0.4590 0.1533
INDUSTRY CONCENTRATION -4.7477 0.6481 -4.2446 0.4860 -6.9960 0.4605 -3.5243 0.5525
INDUSTRY CONCENTRATION² 0.5638 0.9755 -1.9347 0.8512 5.5225 0.7278 -3.2749 0.7441
DEREGULATION 2.0697 0.4024 2.8947 0.0274 2.3603 0.4263 2.9933 0.0256
M&A VOLUME 20.8102 0.2553 -5.8342 0.4237 21.6446 0.2687 -5.5283 0.4490
BASI 0.3951 0.8598 -0.7095 0.5718 0.3758 0.8717 -0.5639 0.6501
GDP GROWTH -110.4794 0.1035 -8.2985 0.7890 -122.8790 0.0999 -11.6549 0.7059
YIELD SPREAD -193.6782 0.1508 5.1381 0.9417 -195.8214 0.1470 13.8116 0.8429
McFadden R-squared 0.8263 0.6476 0.8249 0.6455

54
Table 9 (Panel B): Logit Regression Analysis on the M&A Decision for the Subsample of High-growth Industries
(1) (2) (3) (4)
Variable Coefficient p-value Coefficient p-value Coefficient p-value Coefficient p-value
C -6.1766 0.1119 -5.6780 0.0432 -4.0242 0.2934 -5.4507 0.0660
INTANGIBLES/ASSETS 35.6816 0.1199 24.2584 0.1393 54.6110 0.0316 29.3681 0.0465
EBITDA/ASSETS 16.8658 0.2634 2.5207 0.4506
EBITDA/ASSETS * OWNERSHIP
CONCENTRATION -12.0277 0.4280
CASH RATIO 16.8619 0.2549 0.0718 0.9744
CASH RATIO * OWNERSHIP
CONCENTRATION -22.8568 0.1494
OWNERSHIP CONCENTRATION -1.9762 0.3039 -2.0706 0.1164
DEBT RATIO -1.0820 0.5549 -1.1812 0.3153 -3.3102 0.0912 -1.4940 0.2196
BANK LOANS/DEBT -2.4570 0.1814 -2.1799 0.0897 -3.7289 0.0878 -2.1307 0.1259
PAYOUT DUMMY -0.2517 0.8478 0.7471 0.3816 -0.2646 0.8451 0.9396 0.2492
FIRM SIZE 1.6114 0.0000 1.4012 0.0000 1.6266 0.0000 1.3668 0.0000
INVESTMENT RATE 1.6752 0.7749 2.3059 0.5881 5.6575 0.3817 3.0369 0.4637
SCALE ECONOMIES -0.8164 0.1652 -0.6934 0.0512 -0.7799 0.1747 -0.6612 0.0583
INDUSTRY CONCENTRATION -11.9954 0.3034 -12.5126 0.0986 -12.9129 0.2795 -12.4577 0.0976
INDUSTRY CONCENTRATION² 15.2466 0.3825 14.5896 0.1840 13.9498 0.4355 14.6296 0.1791
DEREGULATION -1.2887 0.7689 -1.3196 0.7213 -1.5670 0.7302 -1.5084 0.7077
M&A VOLUME 4.4498 0.6873 8.6219 0.2785 -1.0838 0.9222 8.8896 0.2635
BASI 0.1810 0.9237 -0.5292 0.6988 1.0796 0.5465 -0.3103 0.8160
GDP GROWTH -8.5315 0.8576 -34.5701 0.2738 17.9068 0.7063 -31.7866 0.3081
YIELD SPREAD 39.8848 0.6835 65.8872 0.3187 65.7172 0.4884 70.5287 0.2839
McFadden R-squared 0.7844 0.6715 0.7909 0.6694

55
Table 10: Related versus Unrelated Growth
The dependent variable equals one when the bidder engaged in an M&A with a target from the same four-digit industry. If the bidder initiated various M&A, we set the
dependent variable equal to one when at least one of the target firms is from the same industry. The explanatory variables are the same as in the above regression models.
(1) (2) (3) (4)
Variable Coefficient p-value Coefficient p-value Coefficient p-value Coefficient p-value
C -0.6272 0.6795 -0.8065 0.6020 -0.6168 0.6908 -0.5859 0.7070
INTANGIBLES/ASSETS -10.5203 0.0763 -10.4930 0.0757 -10.4239 0.0780 -10.4852 0.0773
EBITDA/ASSETS 0.3932 0.8060 1.6791 0.4891
EBITDA/ASSETS * OWNERSHIP
CONCENTRATION -2.5191 0.4806
CASH RATIO 0.1844 0.9070 -1.9501 0.3955
CASH RATIO * OWNERSHIP
CONCENTRATION 4.7617 0.1672
OWNERSHIP CONCENTRATION 0.0183 0.9642 0.2925 0.6049 0.0178 0.9652 -0.3536 0.4729
DEBT RATIO 2.1404 0.0025 2.0627 0.0041 2.1239 0.0026 2.1181 0.0028
BANK LOANS/DEBT 0.6744 0.2165 0.6880 0.2082 0.7265 0.2628 0.6746 0.3025
PAYOUT DUMMY 0.5548 0.1132 0.5443 0.1209 0.5793 0.0834 0.5772 0.0863
FIRM SIZE -0.1755 0.0557 -0.1759 0.0552 -0.1785 0.0506 -0.1652 0.0750
INVESTMENT RATE 1.1229 0.6627 1.3124 0.6126 1.2931 0.6021 1.4980 0.5460
SCALE ECONOMIES -0.2755 0.0727 -0.2674 0.0821 -0.2718 0.0781 -0.2658 0.0835
INDUSTRY CONCENTRATION 8.8726 0.0041 9.0156 0.0036 8.9259 0.0038 8.8420 0.0040
INDUSTRY CONCENTRATION² -12.7182 0.0104 -12.9876 0.0091 -12.8106 0.0097 -12.9177 0.0090
INDUSTRY GROWTH -1.5121 0.0936 -1.4949 0.0973 -1.4771 0.1024 -1.4310 0.1159
INDUSTRY GROWTH² 6.0410 0.0416 5.9782 0.0440 5.9401 0.0432 5.9511 0.0440
DEREGULATION -1.0312 0.4109 -1.1028 0.3769 -1.0476 0.4060 -1.0846 0.3889
M&A VOLUME 0.5311 0.8831 0.6515 0.8577 0.5133 0.8872 0.4627 0.8991
BASI -1.2815 0.0442 -1.2753 0.0457 -1.2843 0.0449 -1.3863 0.0329
GDP GROWTH 12.6219 0.3675 11.8943 0.3968 12.1809 0.3803 11.6346 0.4027
TERM SPREAD 25.5524 0.4175 26.0448 0.4091 25.6587 0.4154 27.9715 0.3775
McFadden R-squared 0.1135 0.1149 0.1134 0.1186