determinants 2: supply keywan riahi [email protected]
TRANSCRIPT
Energy Systems Analysis
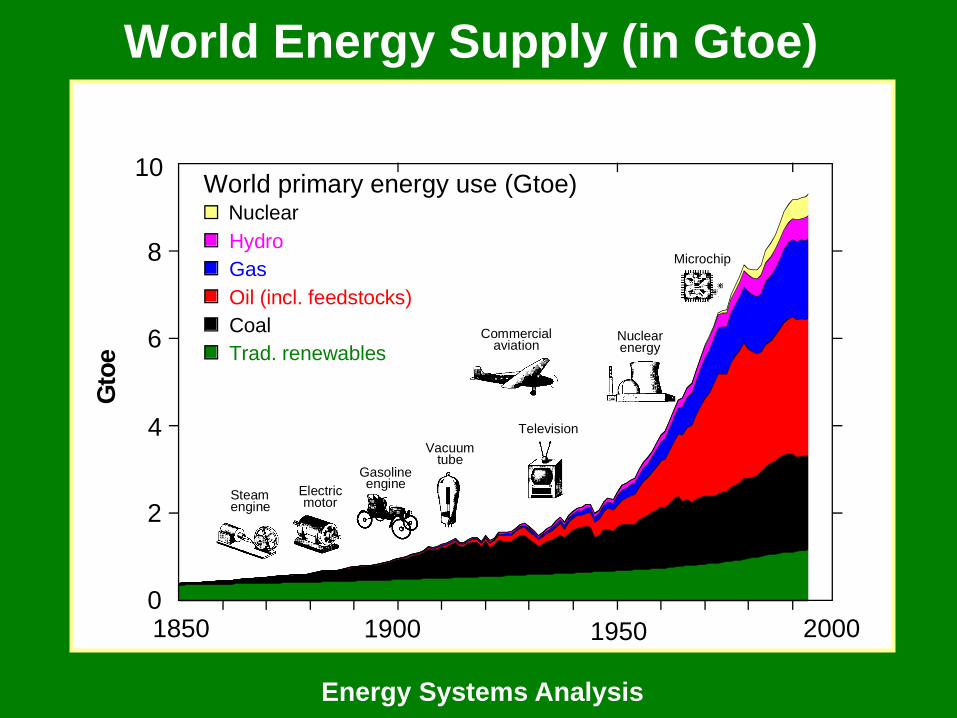
Microchip
Television
Steamengine
Electricmotor
Gasolineengine
Vacuumtube
Commercialaviation
Nuclearenergy
1850 1900 1950 2000
Nuclear
Hydro
Gas
Oil (incl. feedstocks)
Coal
Trad. renewables
Gto
e1.6 2.5 5.3
10
8
6
4
2
0
World primary energy use (Gtoe)
World population(billion)
World Energy Supply (in Gtoe)
Energy Systems Analysis
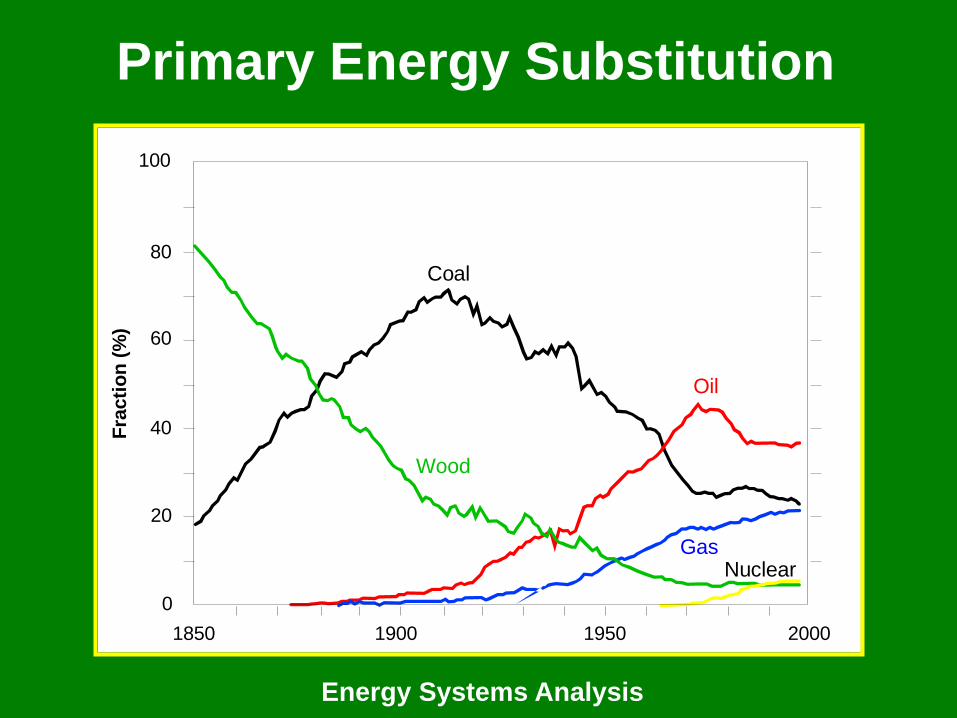
Primary Energy Substitution
100
60
40
20
0
1850 1900 1950 2000
Fra
cti
on
(%
)
Wood
Coal
Oil
GasNuclear
80
Energy Systems Analysis
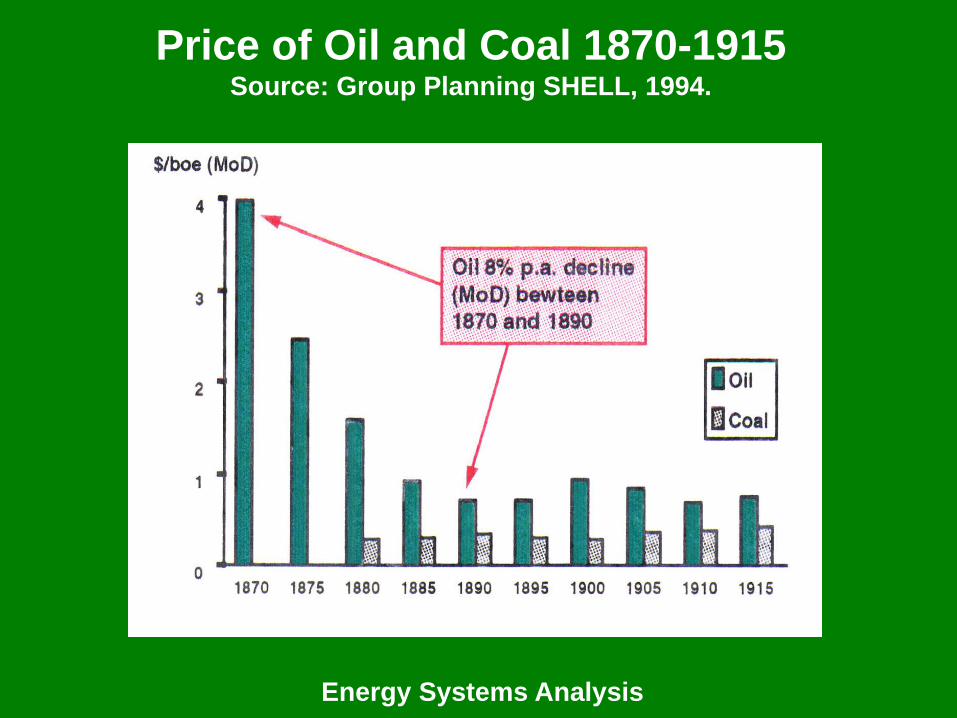
Price of Oil and Coal 1870-1915Source: Group Planning SHELL, 1994.
Energy Systems Analysis
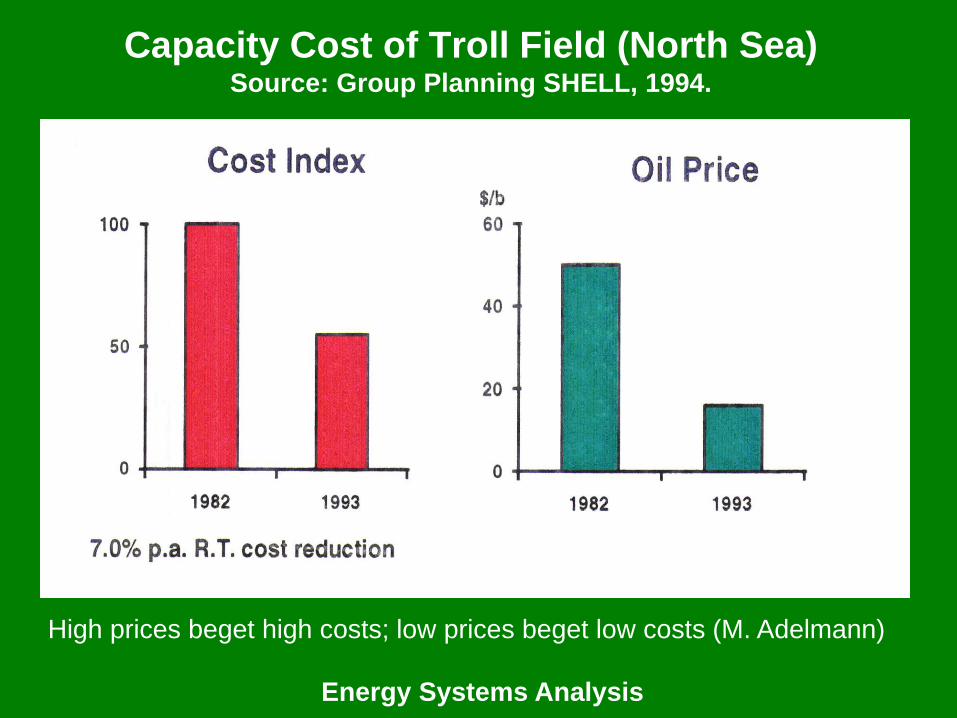
Capacity Cost of Troll Field (North Sea)Source: Group Planning SHELL, 1994.
High prices beget high costs; low prices beget low costs (M. Adelmann)
Energy Systems Analysis
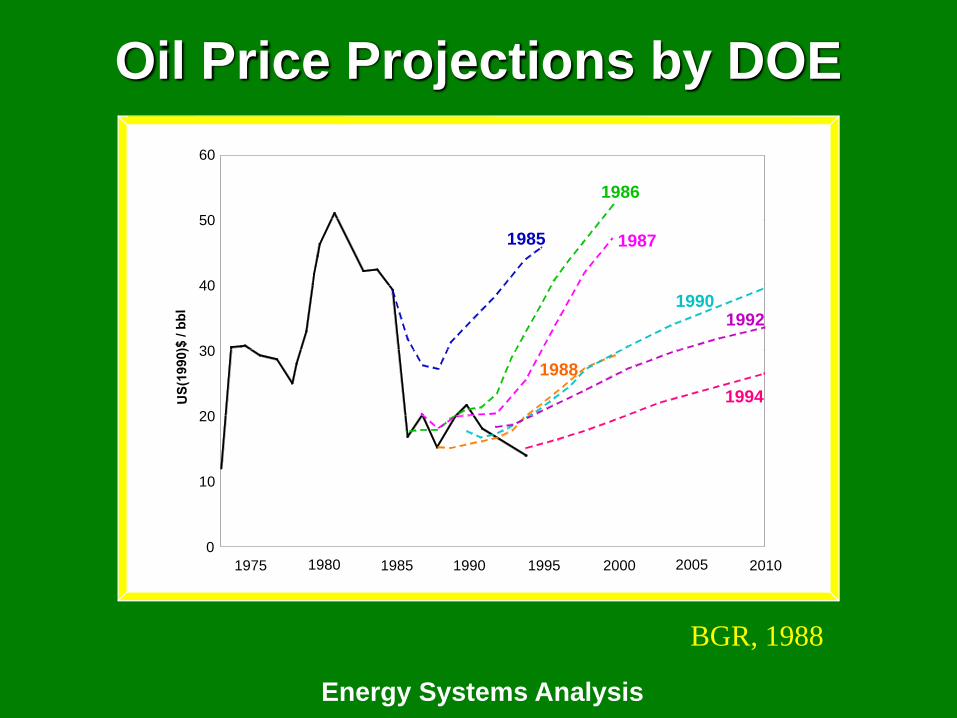
Oil Price Projections by DOE
60
50
40
30
20
10
0
1975 1980 1985 1990 1995 2000 2005 2010
1985
1986
1987
1988
19901992
1994
BGR, 1988
Energy Systems Analysis
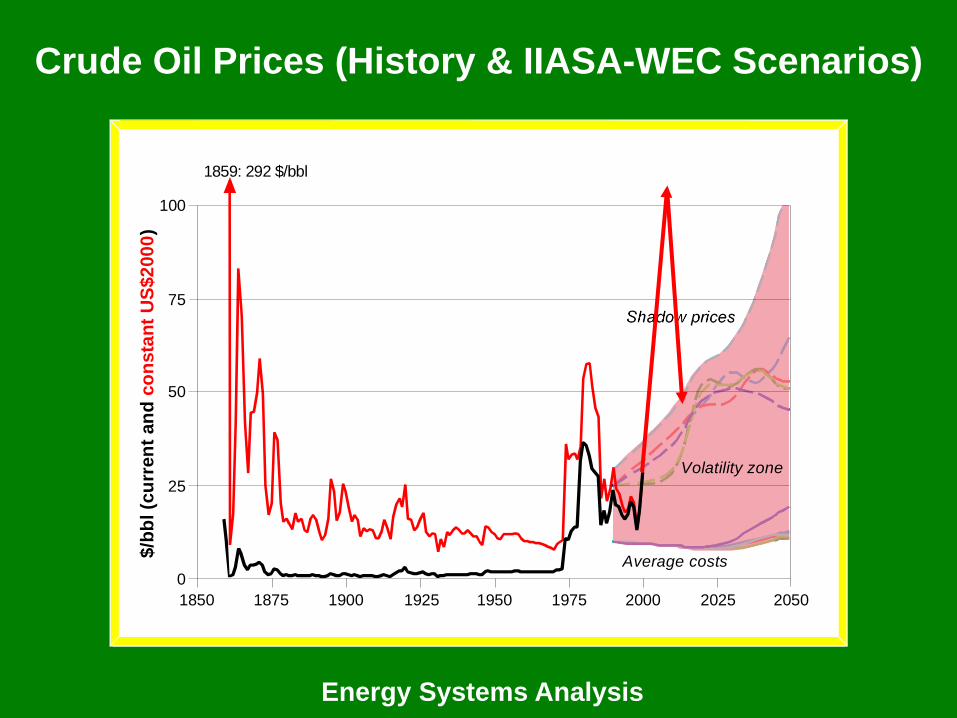
1859: 292 $/bbl
$/b
bl (c
urr
en
t an
d c
on
sta
nt
US
$2
00
0)
2000197519501925190018751850
75
50
25
0
100
2025 2050
Shadow prices
Average costs
Volatility zone
Crude Oil Prices (History & IIASA-WEC Scenarios)
Energy Systems Analysis
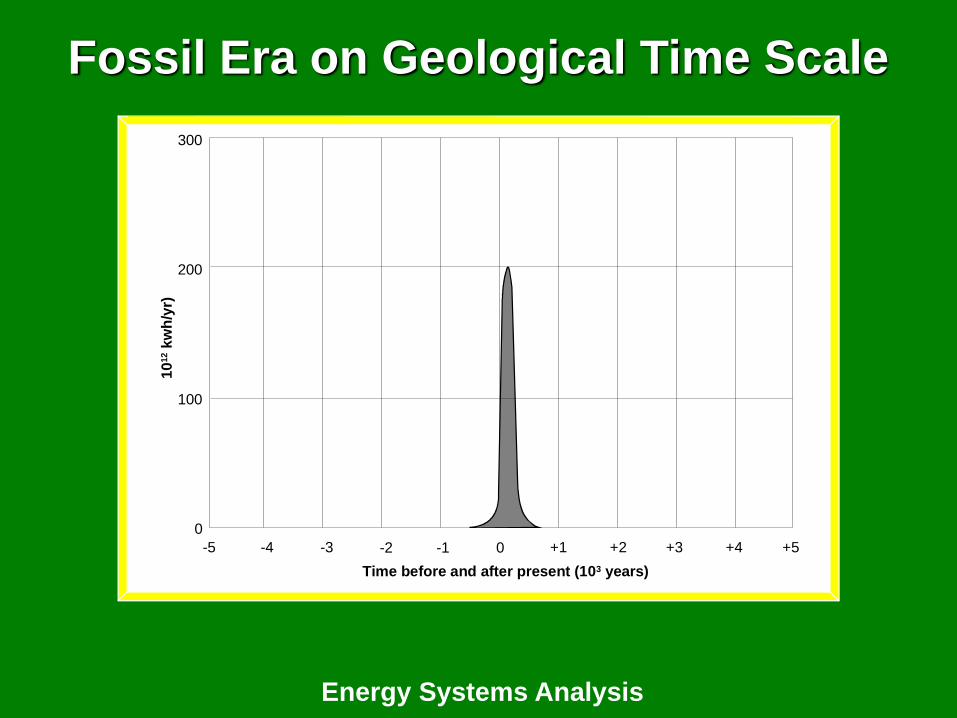
Fossil Era on Geological Time Scale
10
12 k
wh
/yr)
300
200
100
0
-5 -4 -3 -2 -1 0 +1 +2 +3 +4 +5
Time before and after present (103 years)
Energy Systems Analysis
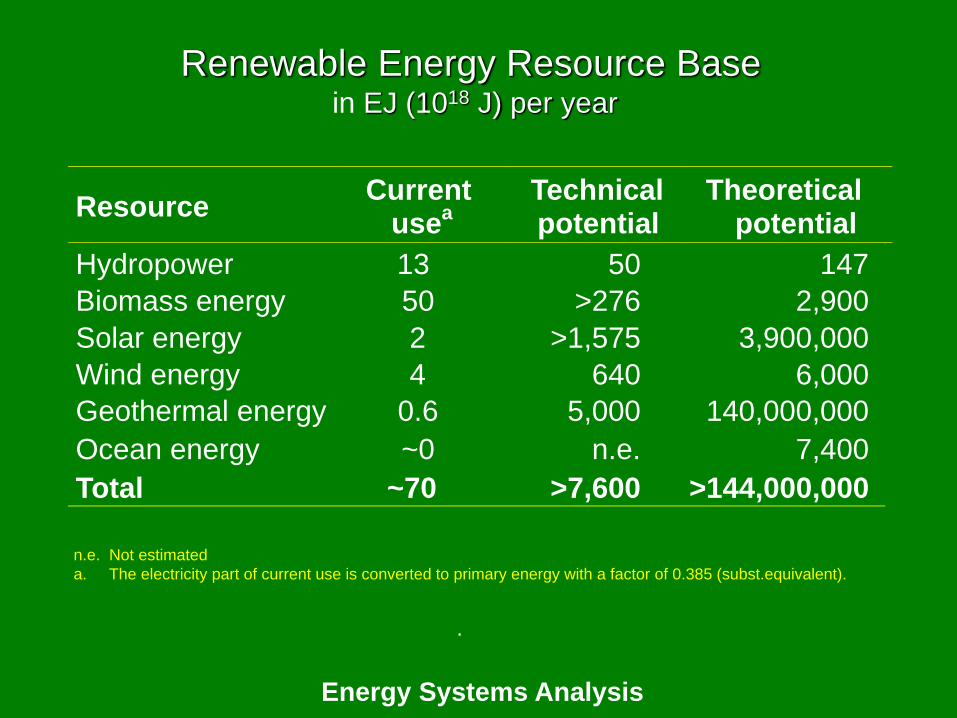
Renewable Energy Resource Basein EJ (1018 J) per year
n.e. Not estimated
a. The electricity part of current use is converted to primary energy with a factor of 0.385 (subst.equivalent).
.
ResourceCurrent
usea
Technicalpotential
Theoreticalpotential
Hydropower 13 50 147
Biomass energy 50 >276 2,900
Solar energy 2 >1,575 3,900,000
Wind energy 4 640 6,000
Geothermal energy 0.6 5,000 140,000,000
Ocean energy ~0 n.e. 7,400
Total ~70 >7,600 >144,000,000
© BP 2006
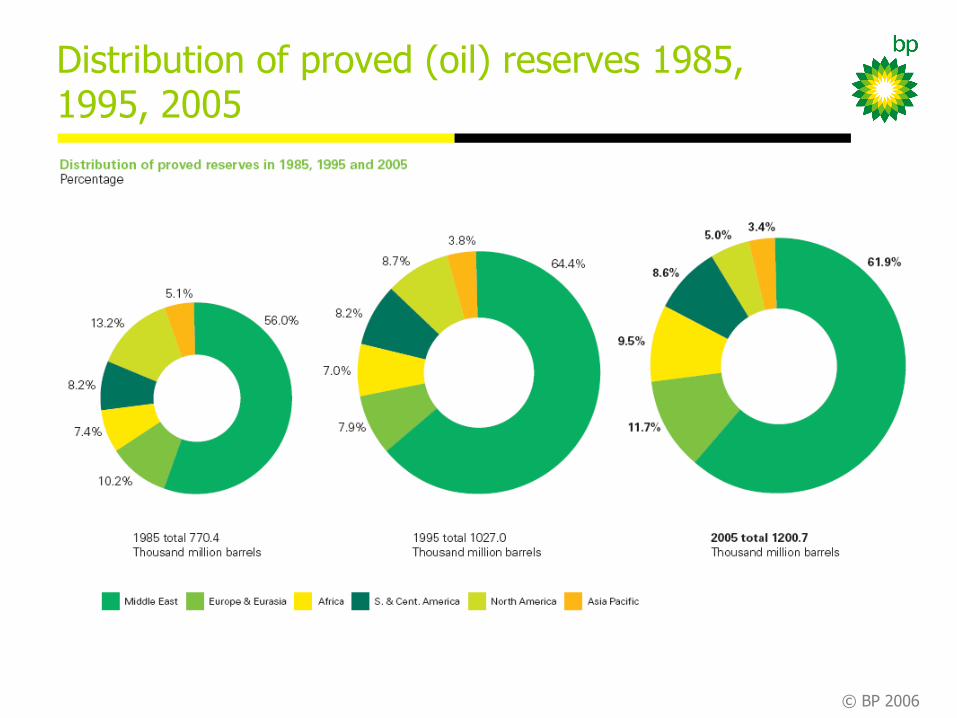
Distribution of proved (oil) reserves 1985, 1995, 2005
© BP 2006
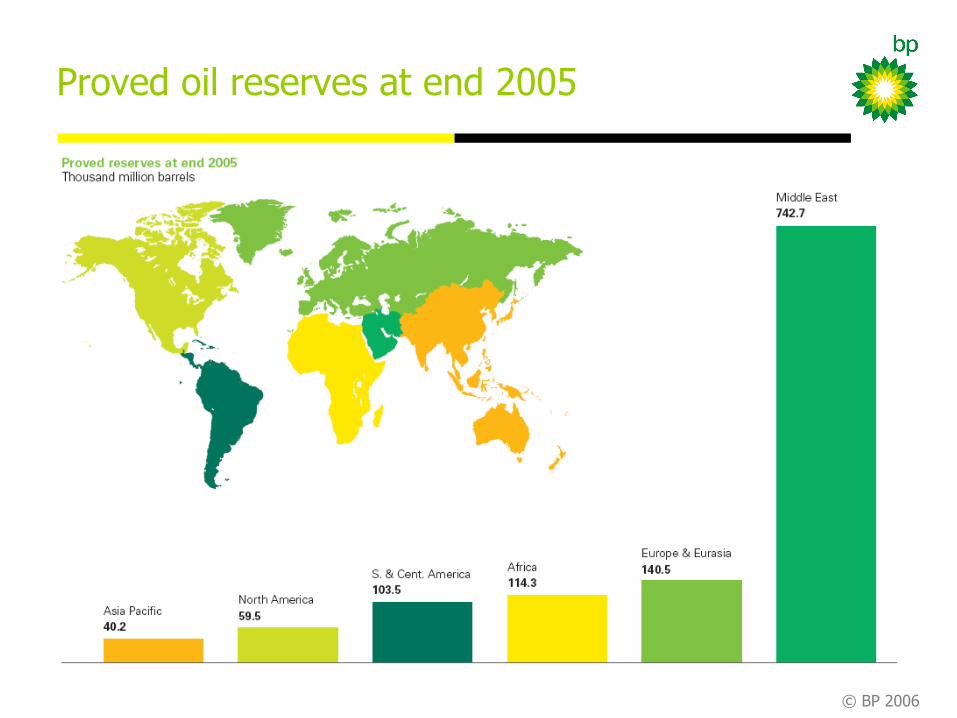
Proved oil reserves at end 2005
© BP 2006
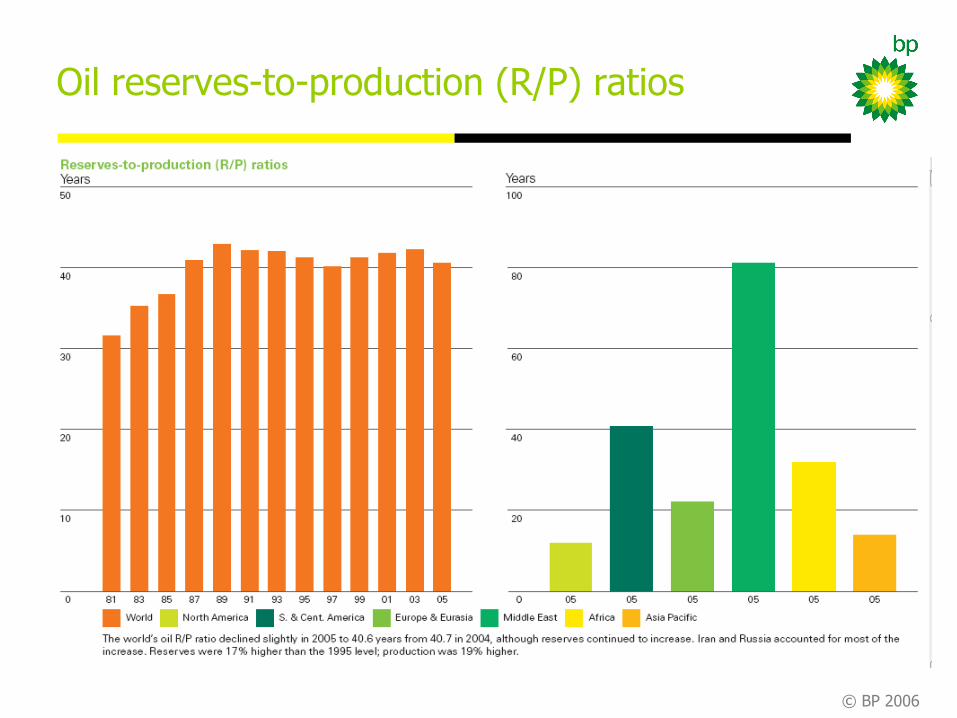
Oil reserves-to-production (R/P) ratios
© BP 2006
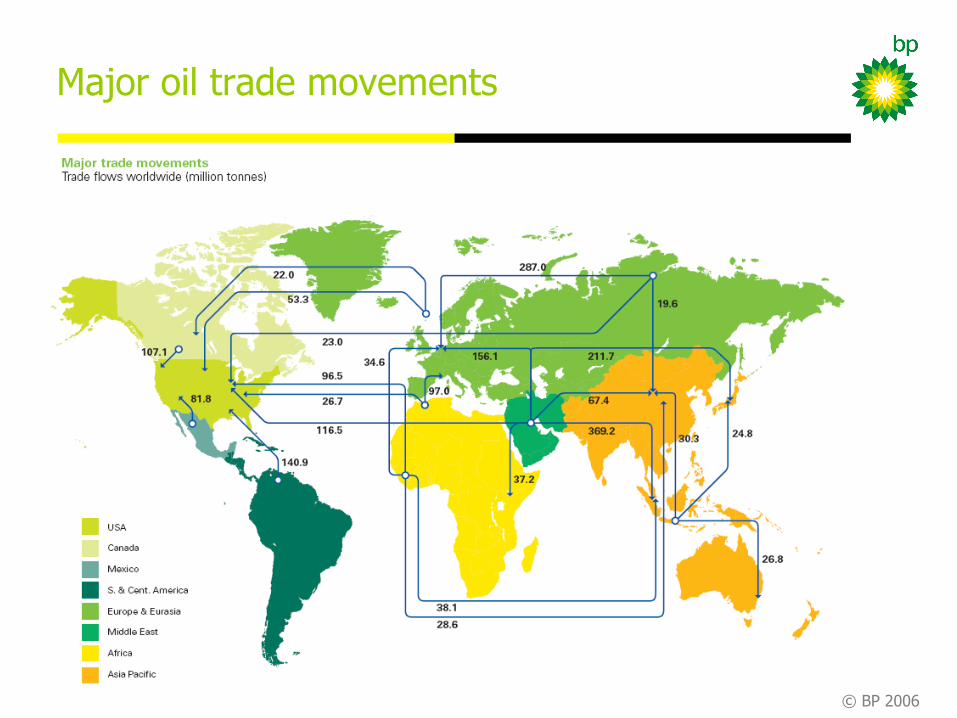
Major oil trade movements
Energy Systems Analysis
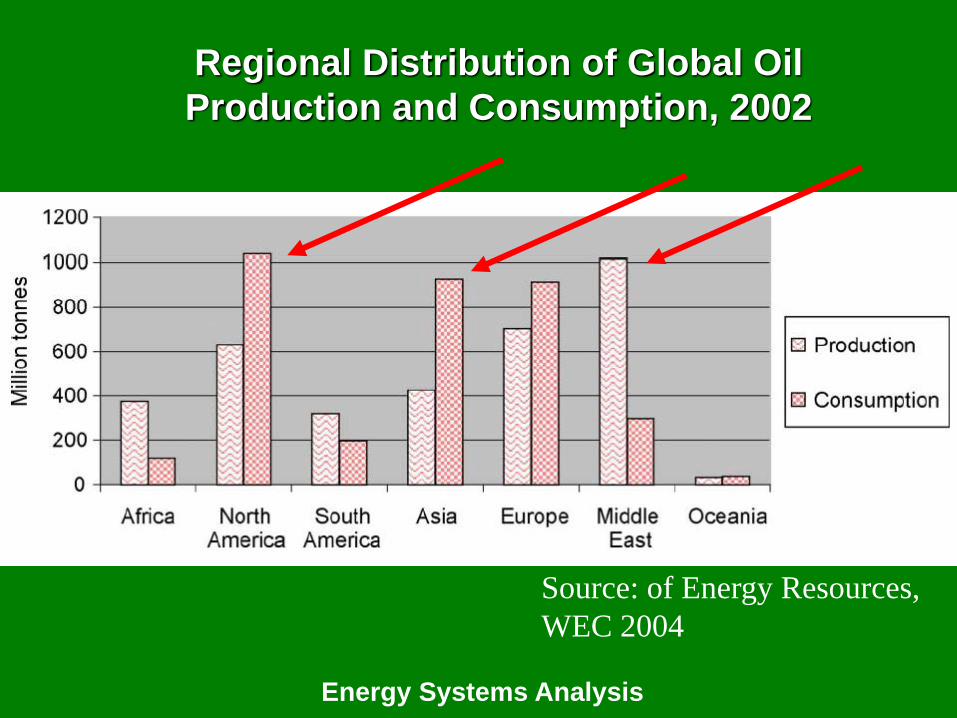
Regional Distribution of Global Oil
Production and Consumption, 2002
Source: of Energy Resources,
WEC 2004
Energy Systems Analysis
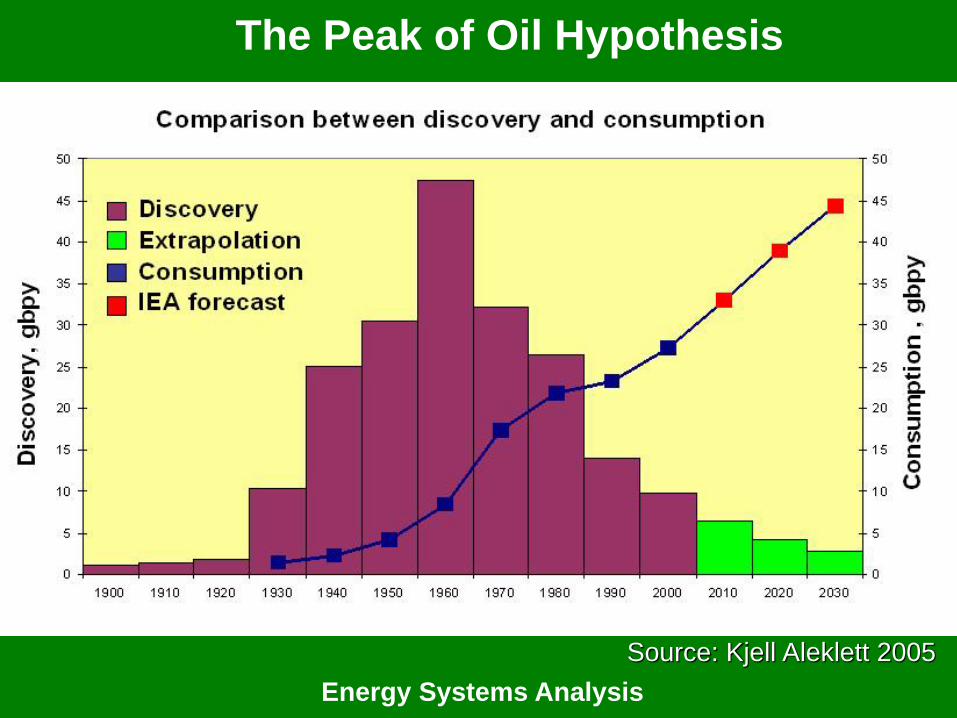
The Peak of Oil Hypothesis
Source: Kjell Aleklett 2005
Energy Systems Analysis
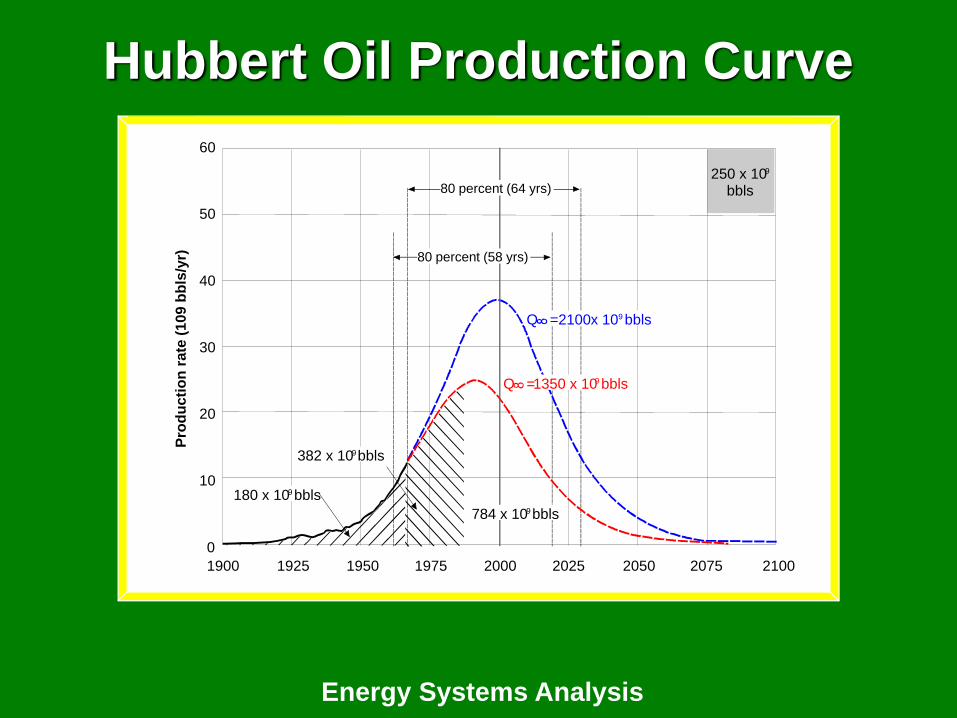
Hubbert Oil Production Curve
Pro
du
cti
on
rate
(10
9 b
bls
/yr)
60
50
40
30
20
10
0
1900 1925 1950 1975 2000 2025 2050 2075 2100
250 x 109
bbls
180 x 109 bbls
382 x 109bbls
Q =1350 x 109 bbls
Q =2100x 109 bbls
80 percent (64 yrs)
80 percent (58 yrs)
784 x 109 bbls
Energy Systems Analysis
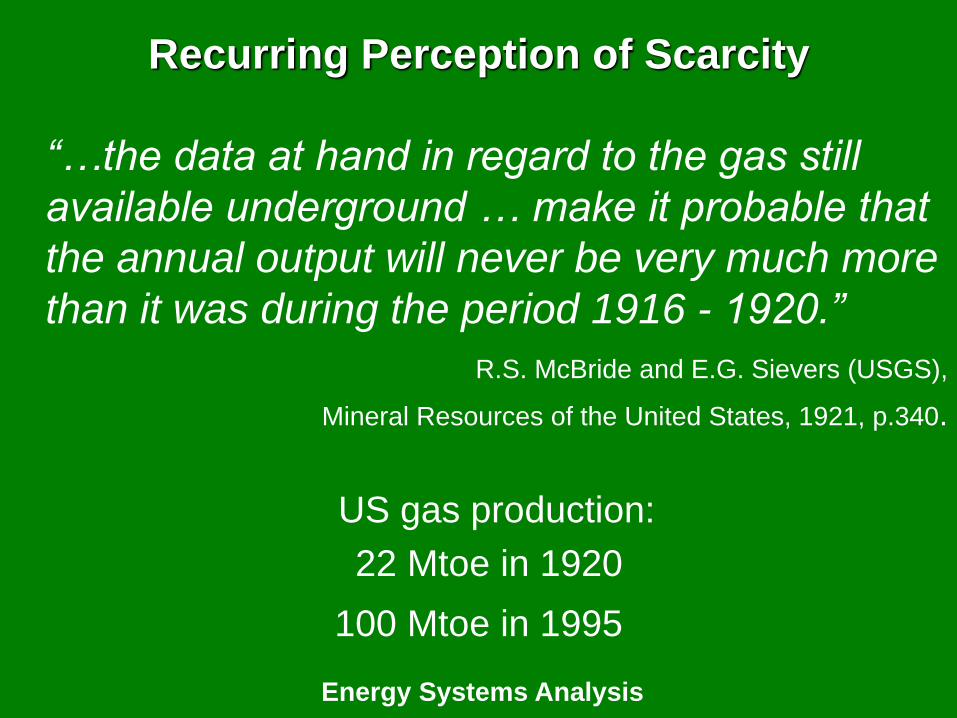
Recurring Perception of Scarcity
“…the data at hand in regard to the gas still
available underground … make it probable that
the annual output will never be very much more
than it was during the period 1916 - 1920.”
R.S. McBride and E.G. Sievers (USGS),
Mineral Resources of the United States, 1921, p.340.
US gas production:
22 Mtoe in 1920
100 Mtoe in 1995
Energy Systems AnalysisSCHOELLER-BLECKMANN OILFIELD EQUIPMENT AG
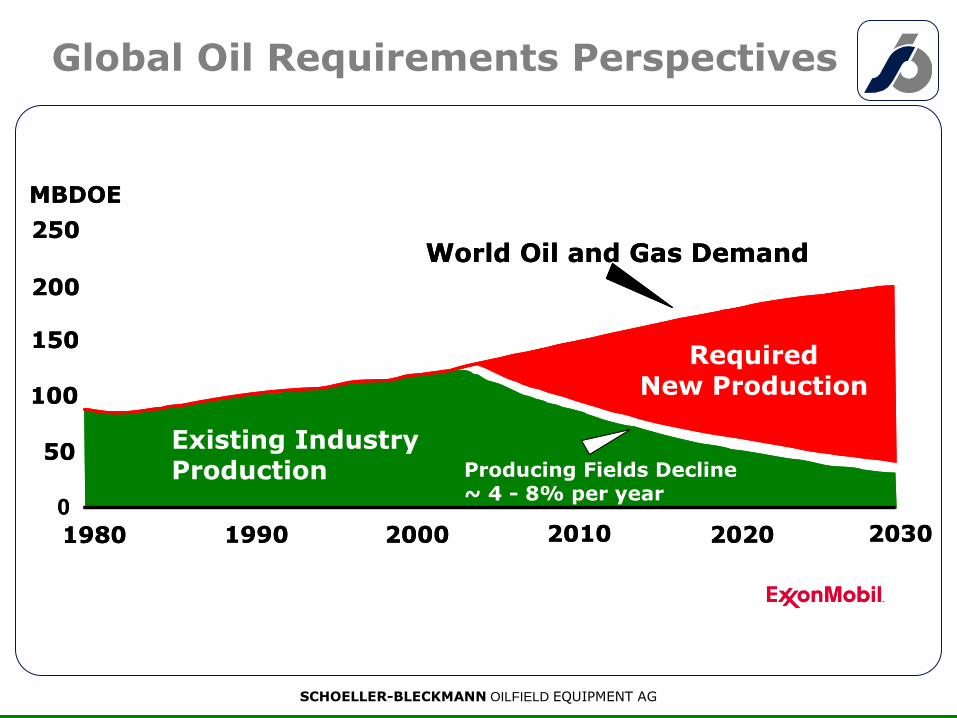
Global Oil Requirements Perspectives
Producing Fields Decline~ 4 - 8% per year
Existing IndustryProduction
RequiredNew Production
World Oil and Gas Demand
MBDOE
250
200
150
100
50
0
1980 1990 2000 2010 2020 2030
Producing Fields Decline~ 4 - 8% per year
Existing IndustryProduction
RequiredNew Production
World Oil and Gas Demand
MBDOE
250
200
150
100
50
0
1980 1990 2000 2010 2020 2030
Energy Systems AnalysisSCHOELLER-BLECKMANN OILFIELD EQUIPMENT AG
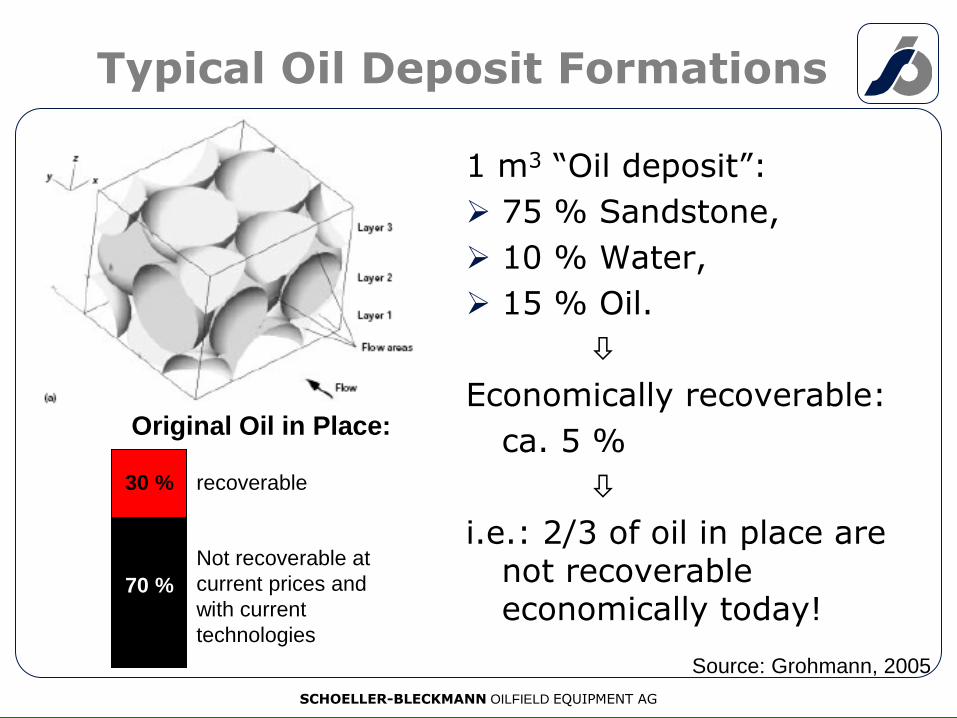
Typical Oil Deposit Formations
1 m3 “Oil deposit”:
➢ 75 % Sandstone,
➢ 10 % Water,
➢ 15 % Oil.
Economically recoverable:
ca. 5 %
i.e.: 2/3 of oil in place are not recoverable economically today!
recoverable
Not recoverable at
current prices and
with current
technologies
30 %
70 %
Original Oil in Place:
Source: Grohmann, 2005
Energy Systems Analysis
SCHOELLER-BLECKMANN OILFIELD EQUIPMENT AG
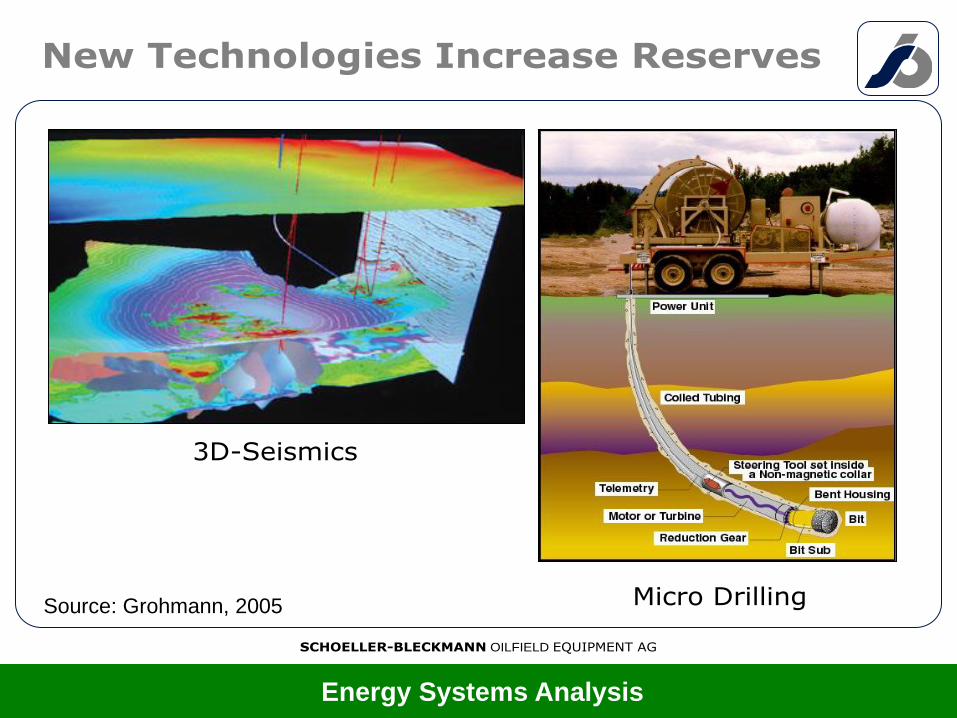
New Technologies Increase Reserves
3D-Seismics
Micro DrillingSource: Grohmann, 2005
© BP 2006
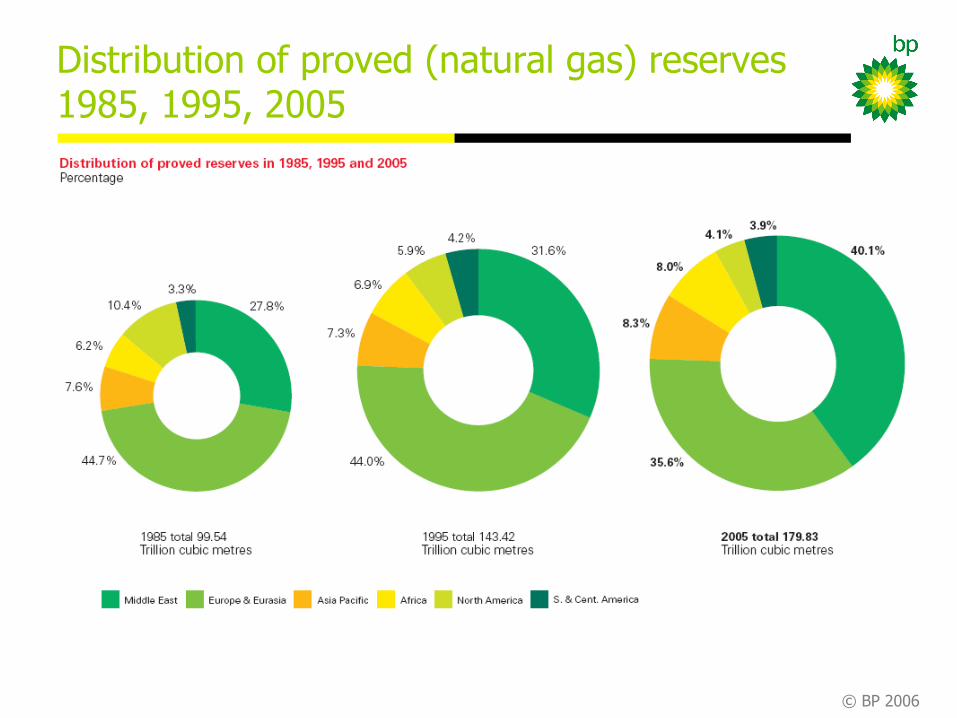
Distribution of proved (natural gas) reserves 1985, 1995, 2005
© BP 2006
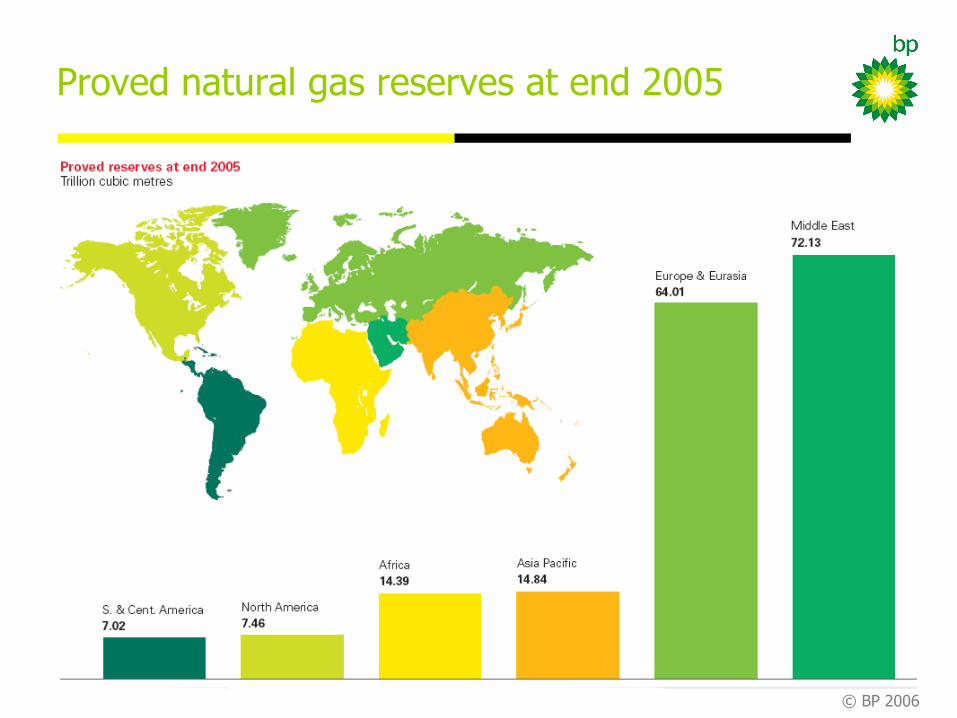
Proved natural gas reserves at end 2005
© BP 2006
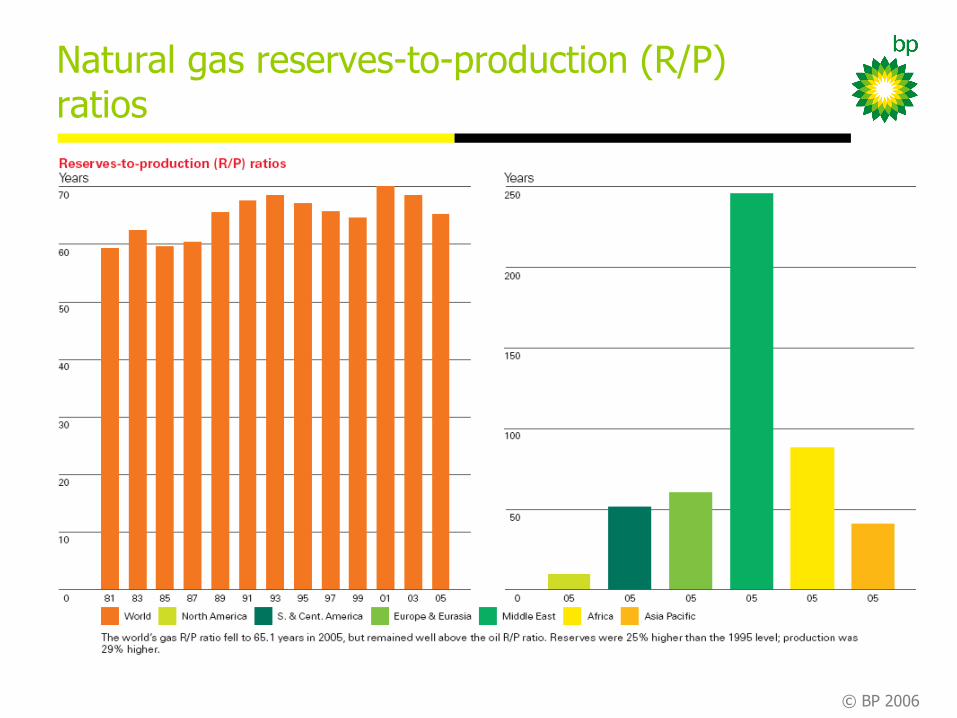
Natural gas reserves-to-production (R/P) ratios
Energy Systems Analysis
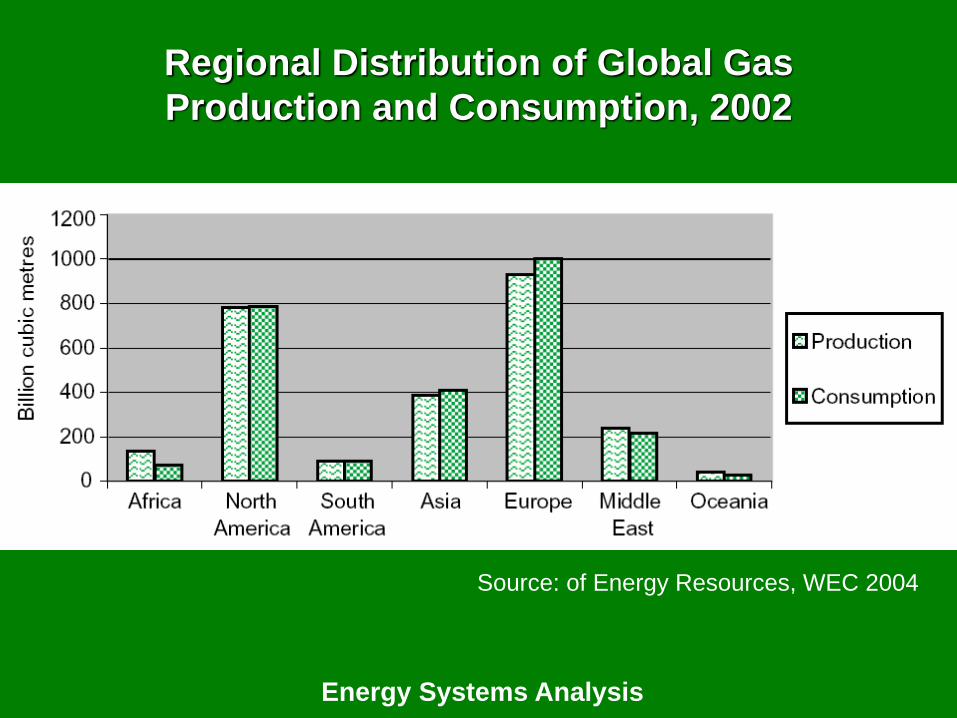
Regional Distribution of Global Gas
Production and Consumption, 2002
Source: of Energy Resources, WEC 2004
© BP 2006
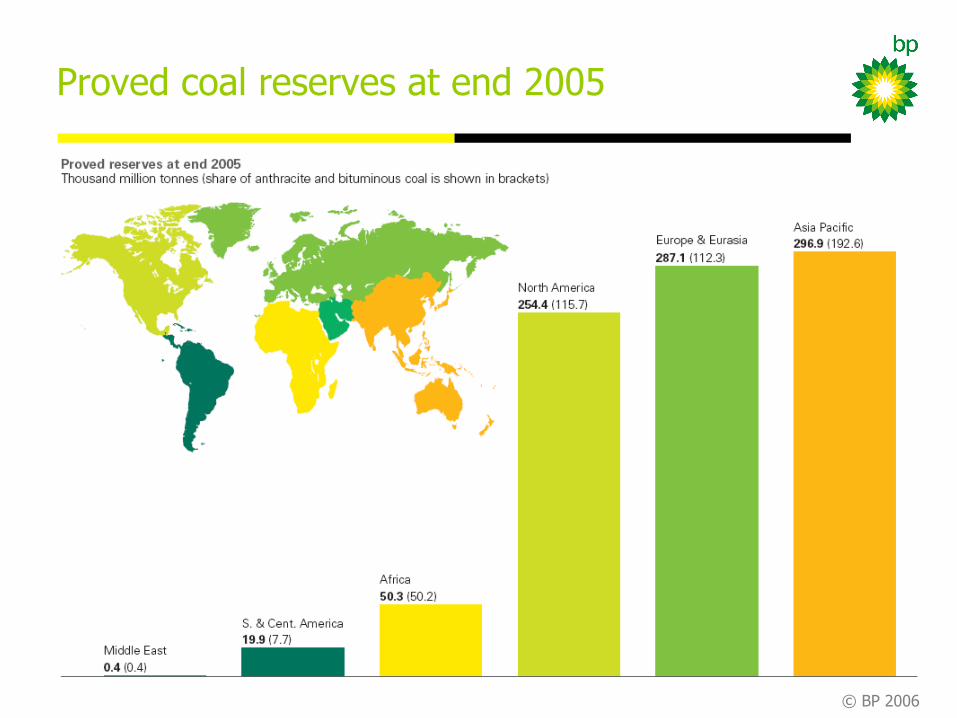
Proved coal reserves at end 2005
© BP 2006
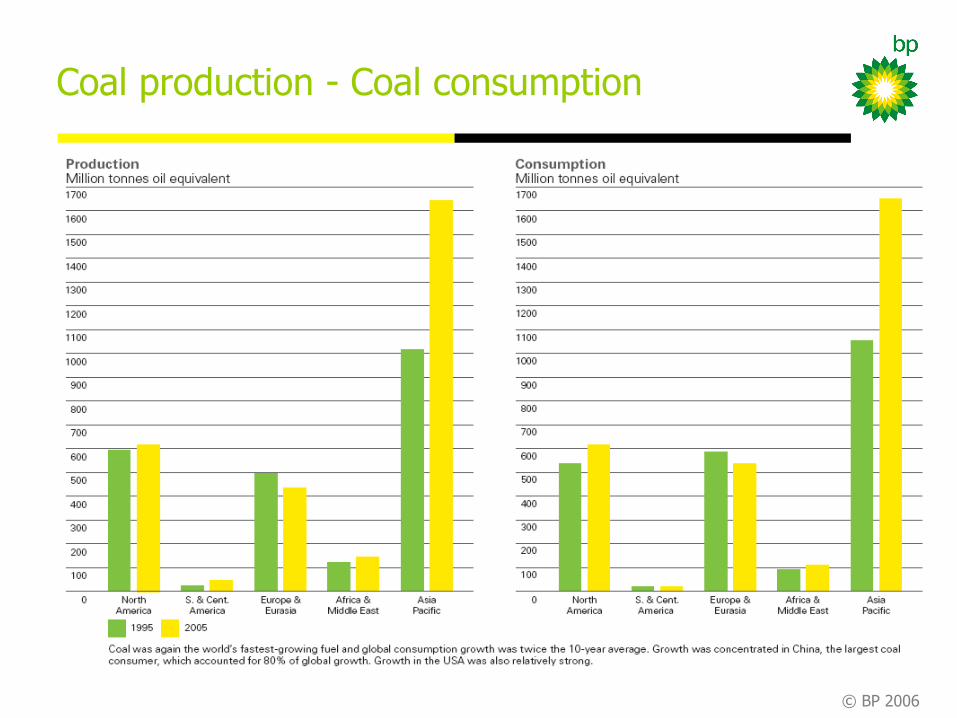
Coal production - Coal consumption
Energy Systems AnalysisPacific Northwest National Laboratory 2
The Joint Global ChangeThe Joint Global Change
Research Institute Research Institute
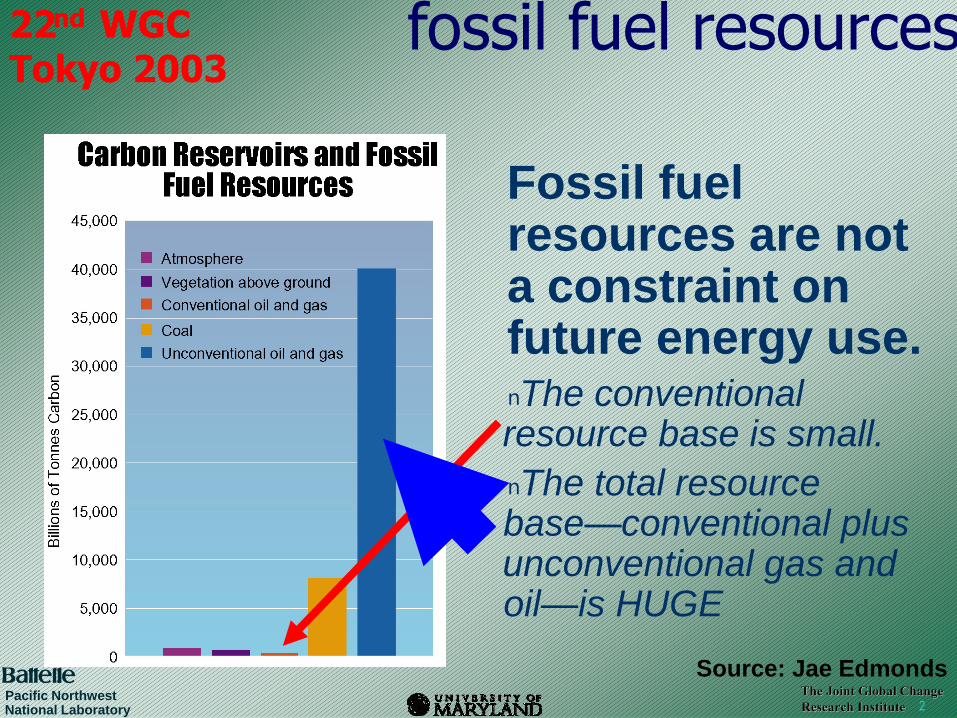
22nd WGCTokyo 2003
fossil fuel resources
Fossil fuel resources are not a constraint on future energy use.nThe conventional resource base is small.
nThe total resource base—conventional plus unconventional gas and oil—is HUGE
Source: Jae Edmonds
Energy Systems Analysis
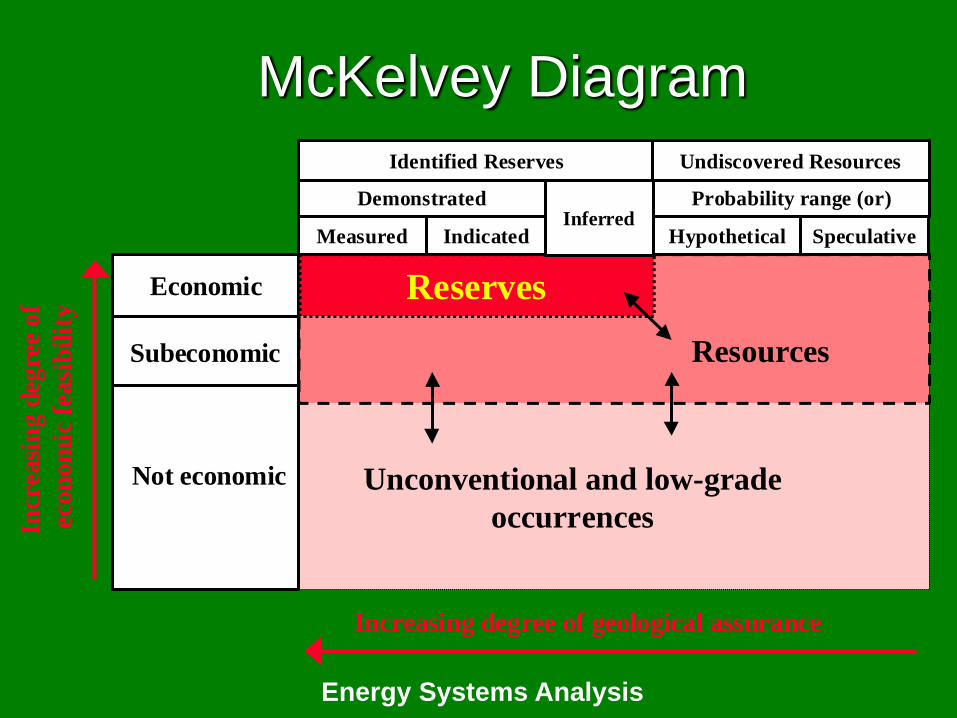
Increasing degree of geological assurance
Incr
easi
ng d
egre
e of
eco
nom
ic f
easi
bil
ity
Resource Classification: The McKelvey Box
Subeconomic
Economic
Not economic
Reserves
Resources
Unconventional and low-grade
occurrences
InferredMeasured Indicated
Demonstrated
Identified Reserves
Hypothetical Speculative
Probability range (or)
Undiscovered Resources
McKelvey Diagram
Energy Systems Analysis
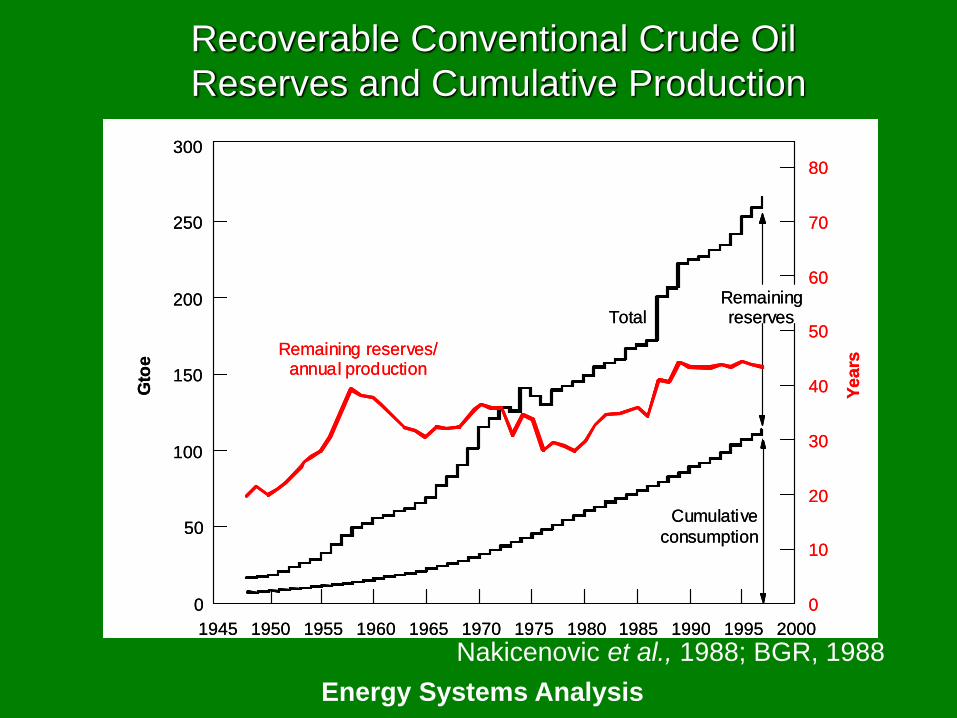
0
50
100
150
200
250
1945 1950 1955 1960 1965 1970 1975 1980 1985 1990 1995
Gto
e
0
10
20
30
40
50
60
70
Ye
ars
Total
Cumulative
consumption
Remaining reserves/annual production
300
80
2000
Remainingreserves
0
50
100
150
200
250
1945 1950 1955 1960 1965 1970 1975 1980 1985 1990 1995
Gto
e
0
10
20
30
40
50
60
70
Ye
ars
Total
Cumulative
consumption
Remaining reserves/annual production
300
80
2000
Remainingreserves
0
50
100
150
200
250
1945 1950 1955 1960 1965 1970 1975 1980 1985 1990 1995
Gto
e
0
10
20
30
40
50
60
70
Ye
ars
Total
Cumulative
consumption
Remaining reserves/annual production
300
80
2000
Remainingreserves
Remainingreserves
Recoverable Conventional Crude Oil
Reserves and Cumulative Production
Nakicenovic et al., 1988; BGR, 1988
Energy Systems Analysis
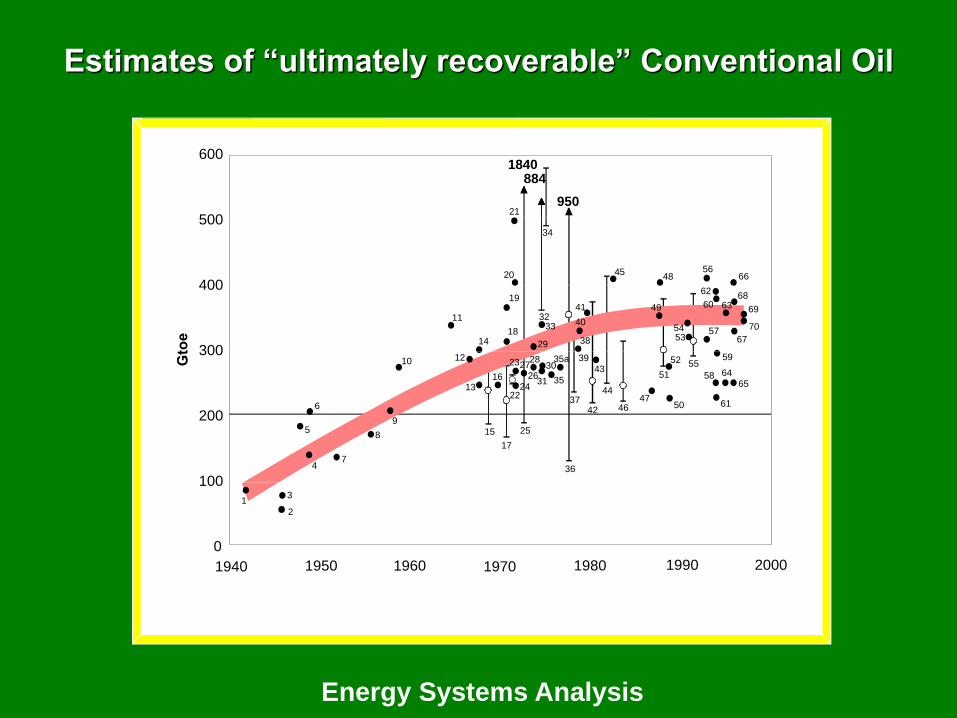
600
500
400
300
200
100
0
1940 1960 1970 1980 19901950 2000
1840884
950
1
2
3
4
5
6
7
8
9
10
11
12
13
15
16
1814
17
19
20
21
22
23
2627
28
29
30
31
3233
34
35
36
37
38
39
40
41
24
25
42
43
44
45
4647
48
49
50
51
52
5354
55
56
57
58
59
60
61
62
63
6465
66
67
68
69
70
35a
Source: BGR, 1998.
Estimates of “ultimately recoverable” Conventional Oil
Energy Systems Analysis
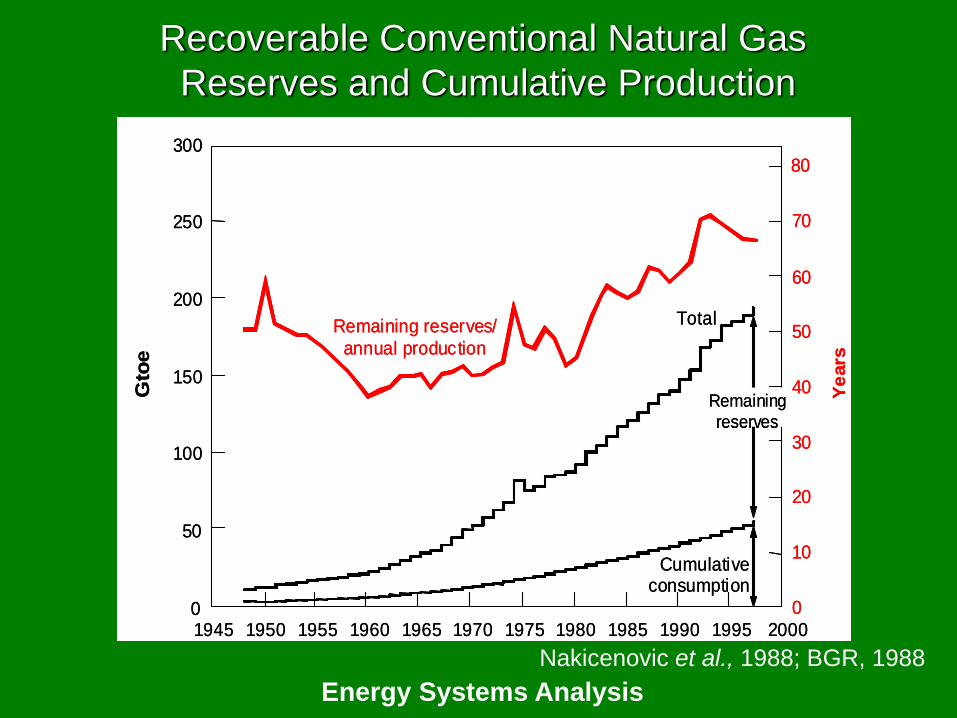
0
50
100
150
200
250
1945 1950 1955 1960 1965 1970 1975 1980 1985 1990 1995
Gto
e
0
10
20
40
50
60
80
Ye
ars
TotalRemaining reserves/
annual production
300
2000
30
Cumulativeconsumption
70
Remaining
reserves
0
50
100
150
200
250
1945 1950 1955 1960 1965 1970 1975 1980 1985 1990 1995
Gto
e
0
10
20
40
50
60
80
Ye
ars
TotalRemaining reserves/
annual production
300
2000
30
Cumulativeconsumption
70
Remaining
reserves
Remaining
reserves
Remaining
reserves
Recoverable Conventional Natural Gas
Reserves and Cumulative Production
Nakicenovic et al., 1988; BGR, 1988
Energy Systems Analysis
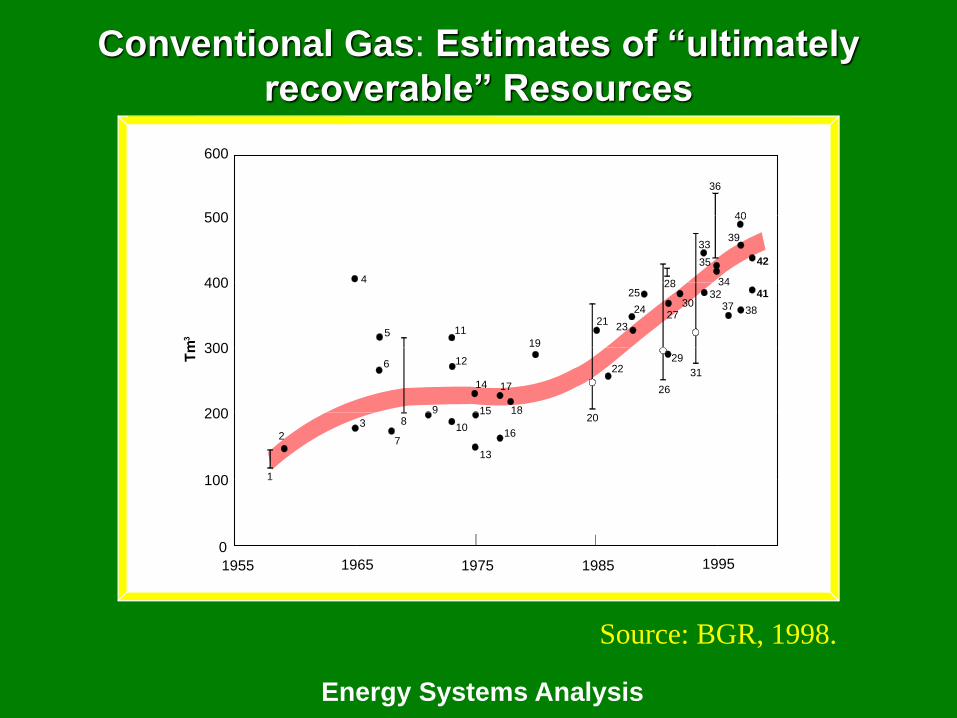
600
500
400
300
200
100
0
1955 1965 1975 1985 1995
1
2
3
4
5
6
7
89
10
11
12
13
15
16
18
14 17
19
20
21
22
23
24
25
26
27
28
29
30
31
32
33
34
35
36
37 38
39
40
41
42
Source: BGR, 1998.
Conventional Gas: Estimates of “ultimately
recoverable” Resources
Energy Systems Analysis
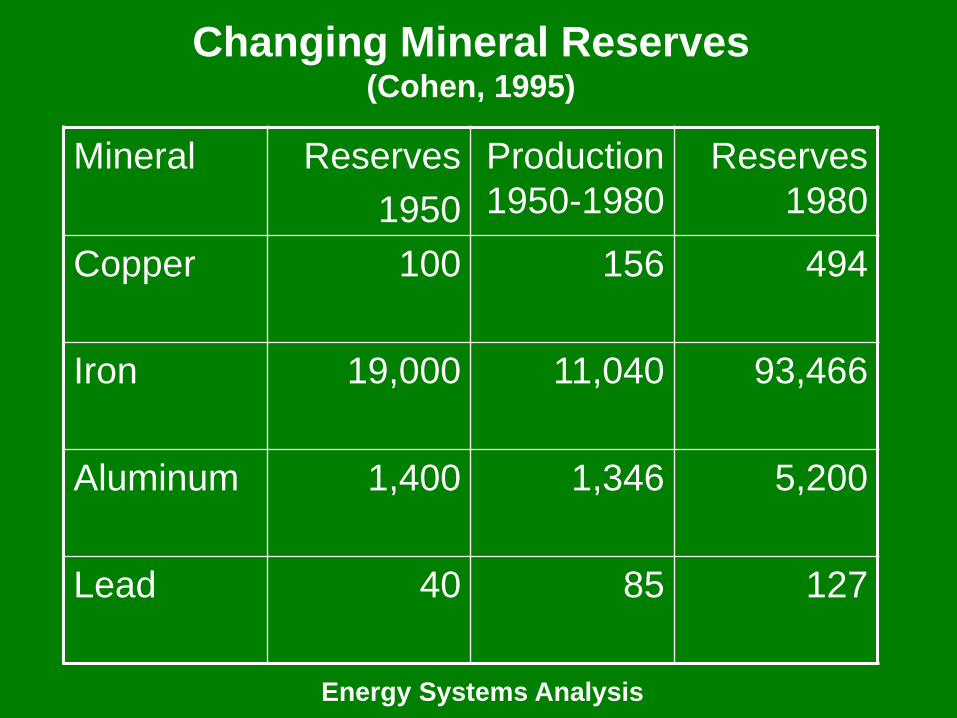
Changing Mineral Reserves (Cohen, 1995)
Mineral Reserves
1950
Production
1950-1980
Reserves
1980
Copper 100 156 494
Iron 19,000 11,040 93,466
Aluminum 1,400 1,346 5,200
Lead 40 85 127
Energy Systems Analysis
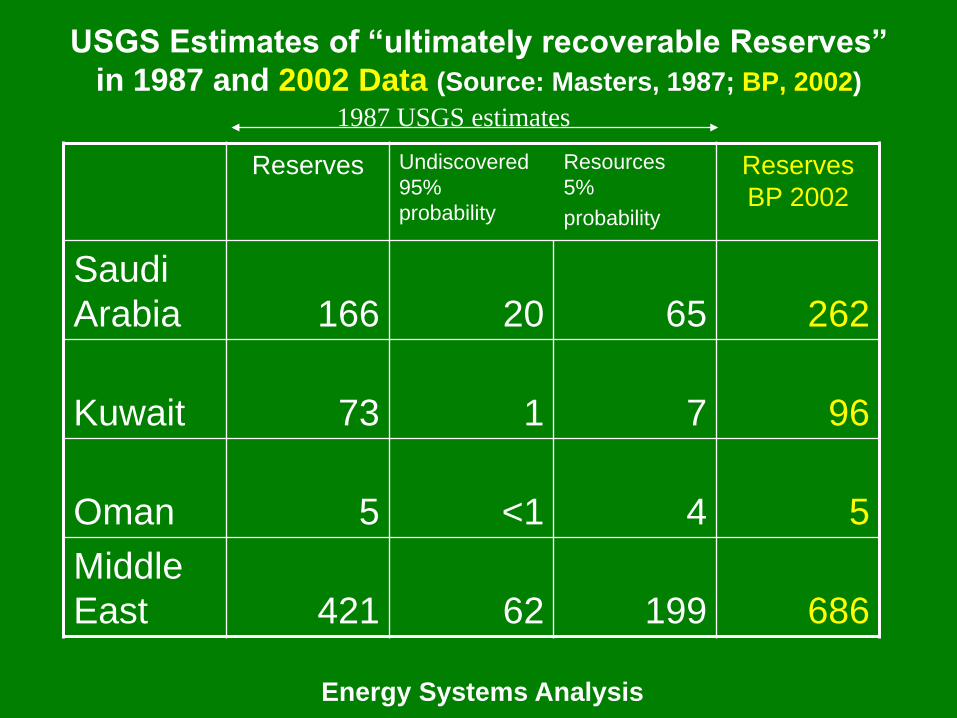
USGS Estimates of “ultimately recoverable Reserves”
in 1987 and 2002 Data (Source: Masters, 1987; BP, 2002)
Reserves Undiscovered
95%
probability
Resources
5%
probability
Reserves
BP 2002
Saudi
Arabia 166 20 65 262
Kuwait 73 1 7 96
Oman 5 <1 4 5
Middle
East 421 62 199 686
1987 USGS estimates
Energy Systems Analysis 14
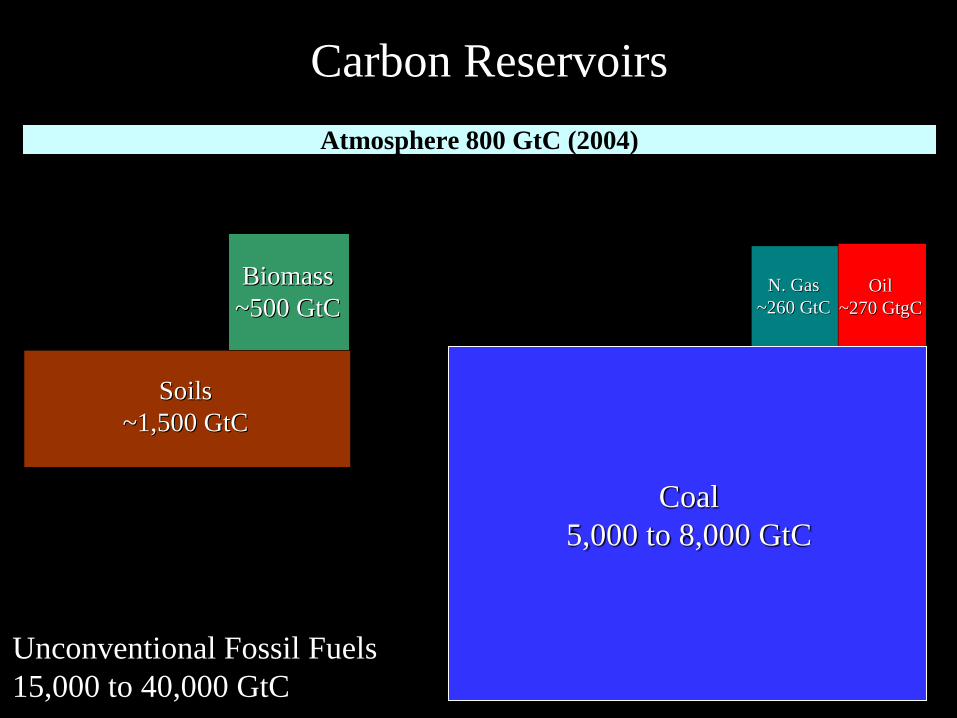
Carbon Reservoirs
BiomassBiomass
~500 ~500 GtCGtC
SoilsSoils
~1,500 ~1,500 GtCGtC
Atmosphere 800 GtC (2004)
OilOil
~270 ~270 GtgCGtgC
N. GasN. Gas
~260 ~260 GtCGtC
Unconventional Fossil Fuels
15,000 to 40,000 GtC
Coal
5,000 to 8,000 GtC
Energy Systems Analysis
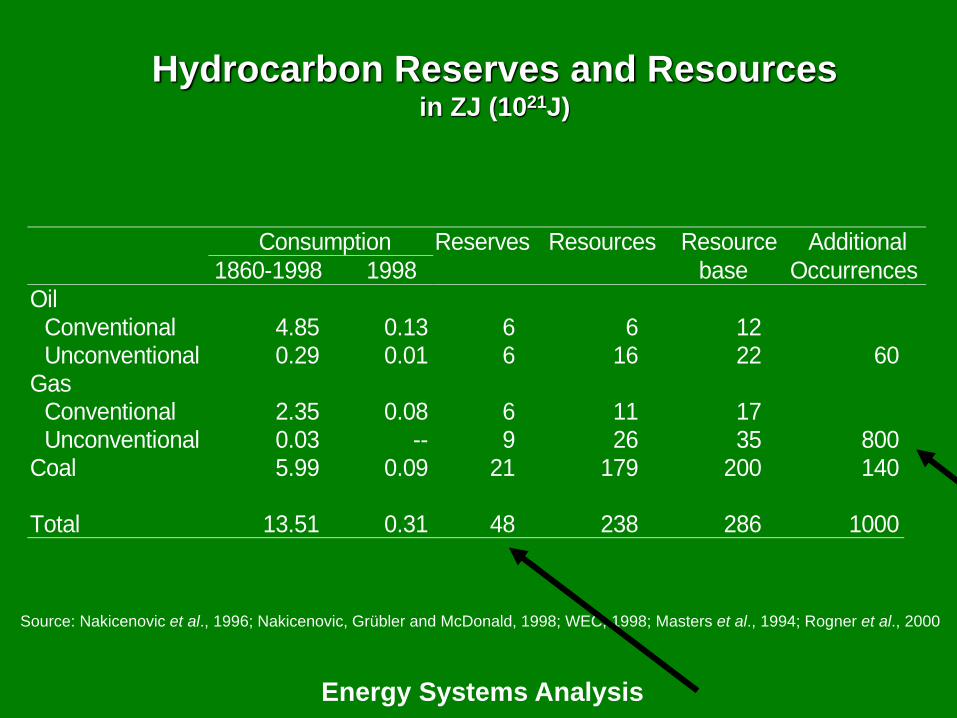
Hydrocarbon Reserves and Resourcesin ZJ (1021J)
Consumption Reserves Resources Resource Additional
1860-1998 1998 base Occurrences
Oil Conventional 4.85 0.13 6 6 12 Unconventional 0.29 0.01 6 16 22 60
Gas Conventional 2.35 0.08 6 11 17 Unconventional 0.03 -- 9 26 35 800
Coal 5.99 0.09 21 179 200 140
Total 13.51 0.31 48 238 286 1000
Source: Nakicenovic et al., 1996; Nakicenovic, Grübler and McDonald, 1998; WEC, 1998; Masters et al., 1994; Rogner et al., 2000
Energy Systems Analysis
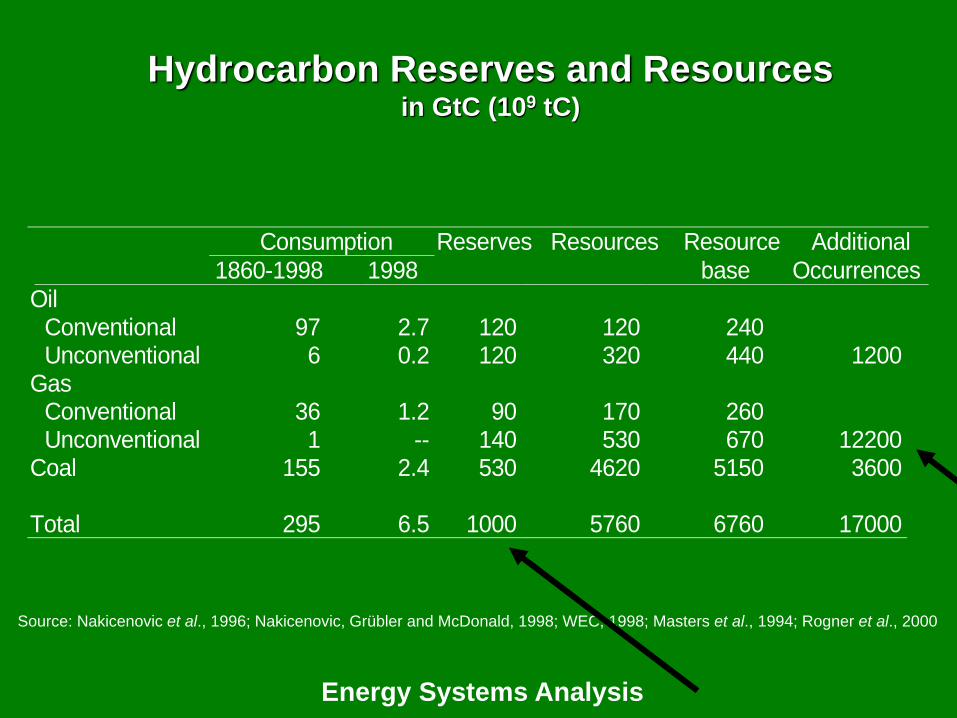
Hydrocarbon Reserves and Resourcesin GtC (109 tC)
Consumption Reserves Resources Resource Additional
1860-1998 1998 base Occurrences
Oil Conventional 97 2.7 120 120 240 Unconventional 6 0.2 120 320 440 1200
Gas Conventional 36 1.2 90 170 260 Unconventional 1 -- 140 530 670 12200
Coal 155 2.4 530 4620 5150 3600
Total 295 6.5 1000 5760 6760 17000
Source: Nakicenovic et al., 1996; Nakicenovic, Grübler and McDonald, 1998; WEC, 1998; Masters et al., 1994; Rogner et al., 2000
Energy Systems Analysis
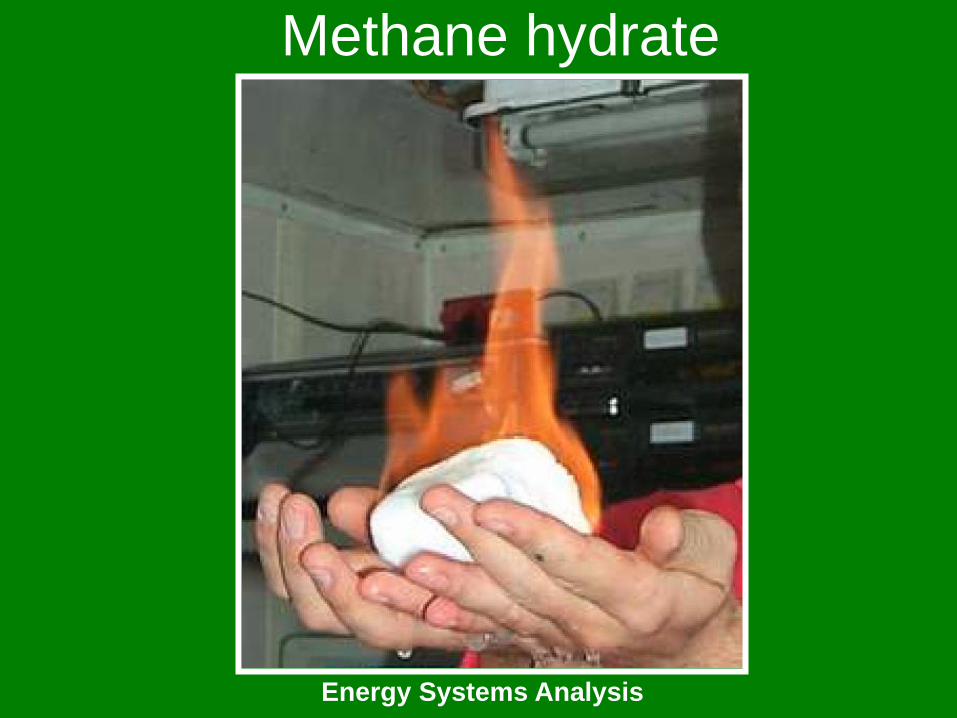
Methane hydrate
Energy Systems Analysis
SCHOELLER-BLECKMANN OILFIELD EQUIPMENT AG
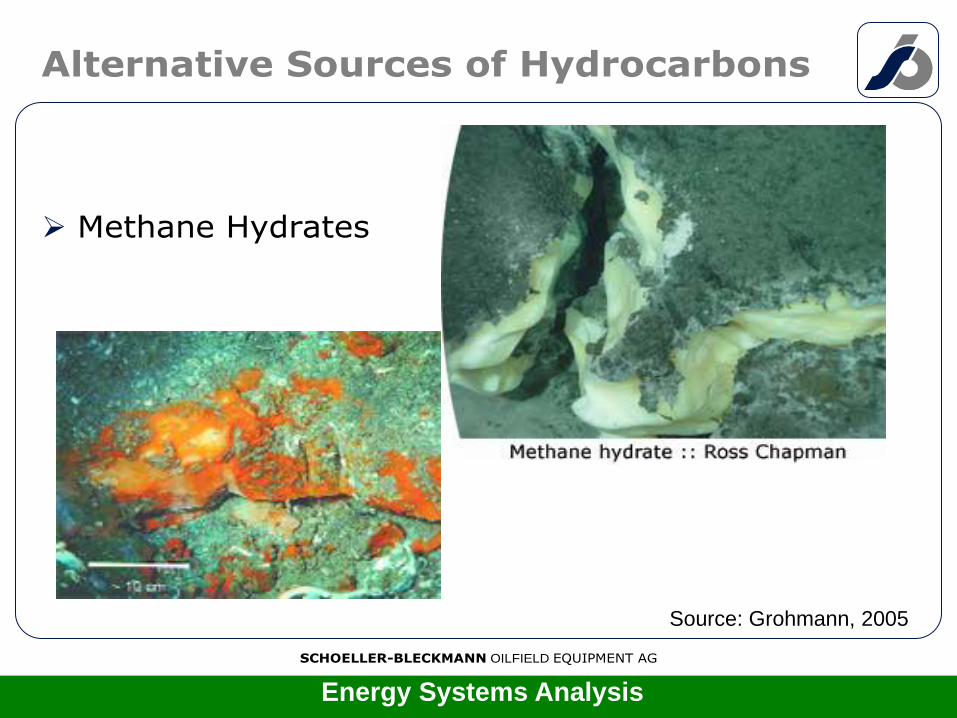
Alternative Sources of Hydrocarbons
➢ Methane Hydrates
Source: Grohmann, 2005
Energy Systems Analysis
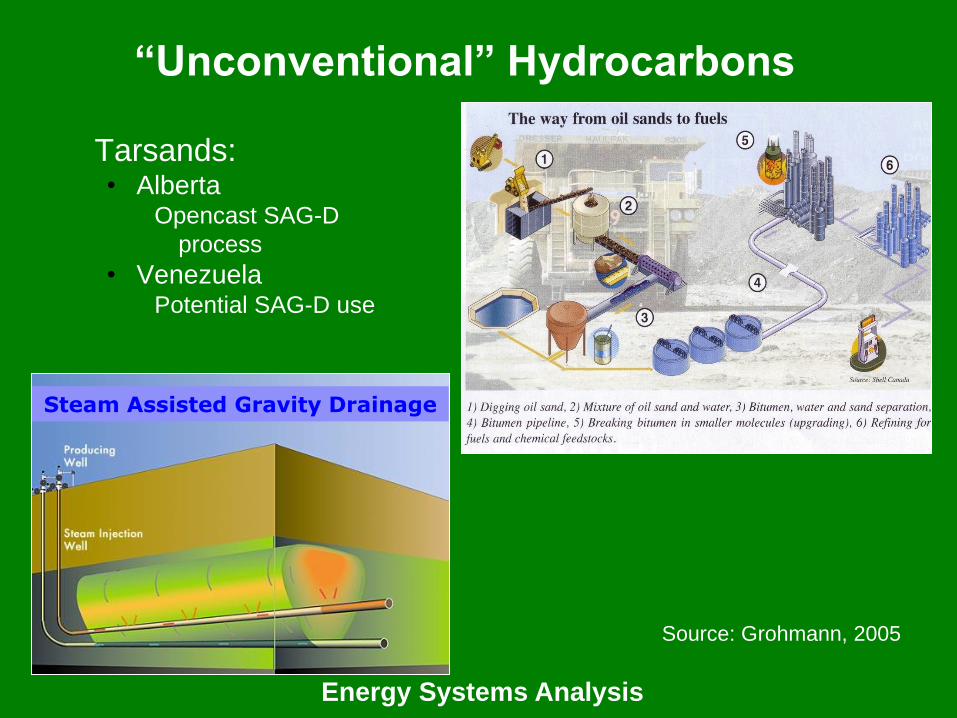
“Unconventional” Hydrocarbons
Tarsands:• Alberta
Opencast SAG-D
process
• VenezuelaPotential SAG-D use
Steam Assisted Gravity Drainage
Source: Grohmann, 2005
Energy Systems Analysis
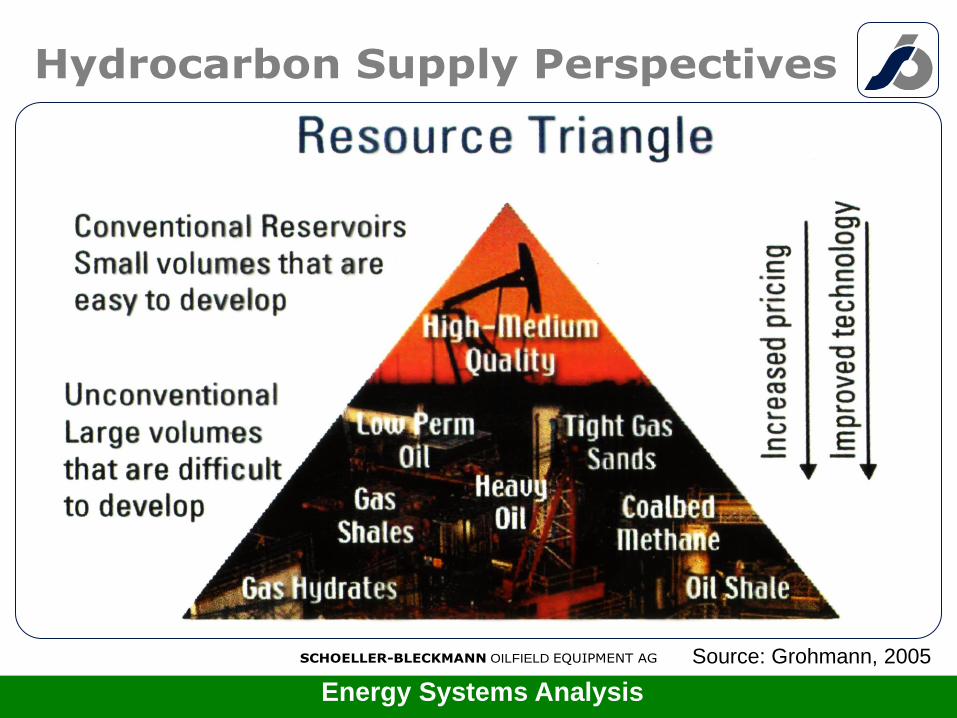
SCHOELLER-BLECKMANN OILFIELD EQUIPMENT AG
Hydrocarbon Supply Perspectives
Source: Grohmann, 2005
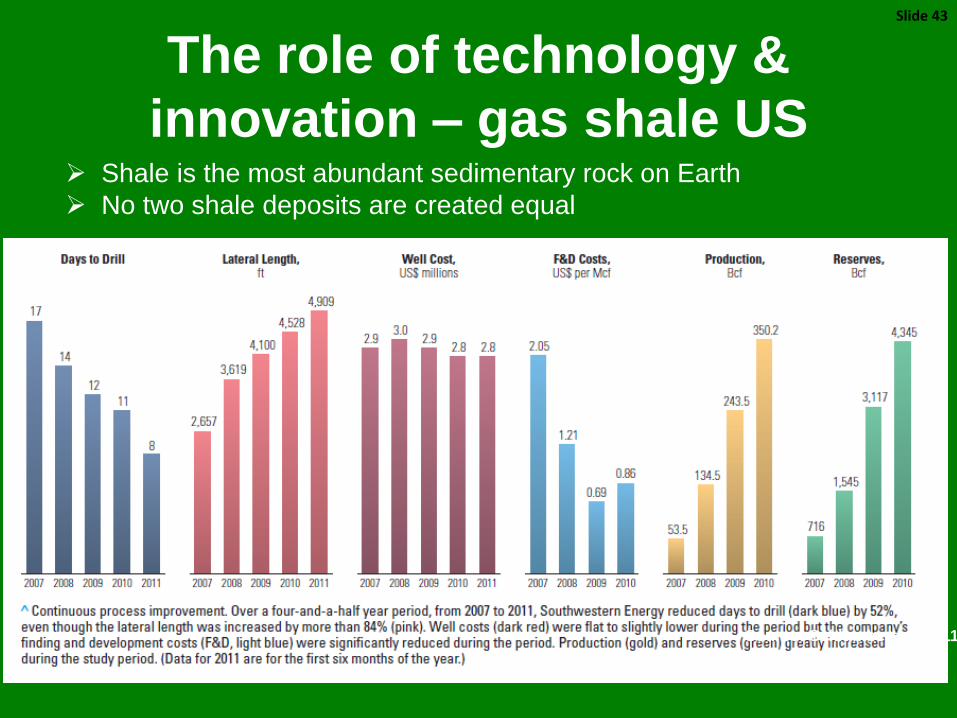
The role of technology &
innovation – gas shale US➢ Shale is the most abundant sedimentary rock on Earth
➢ No two shale deposits are created equal
Slide 43
Source: Schlumberger, 2011
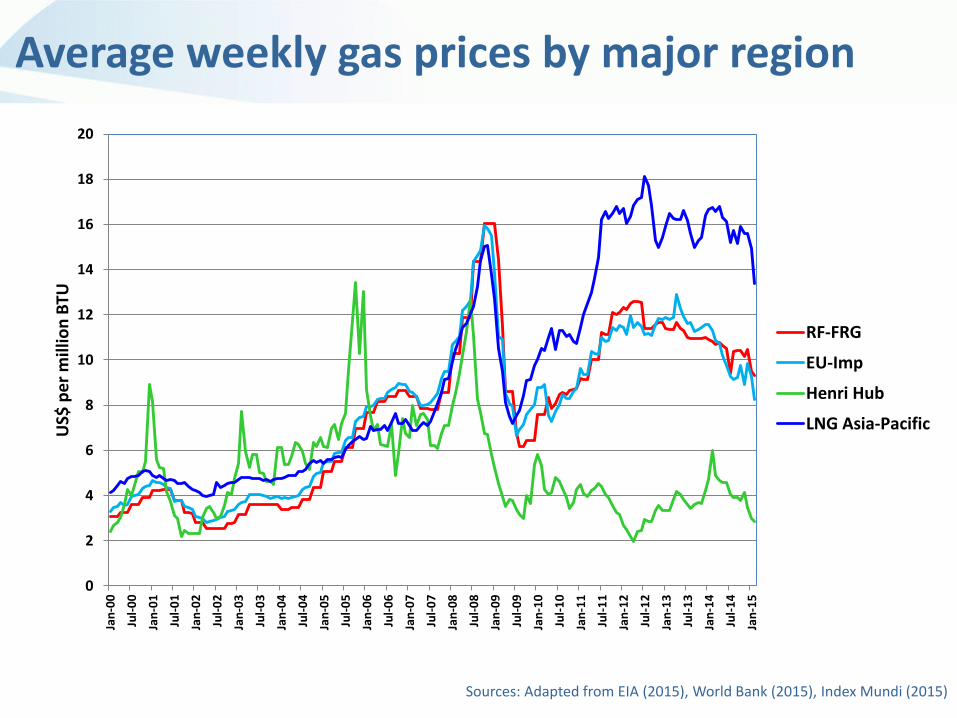
Average weekly gas prices by major region
0
2
4
6
8
10
12
14
16
18
20
Jan
-00
Jul-
00
Jan
-01
Jul-
01
Jan
-02
Jul-
02
Jan
-03
Jul-
03
Jan
-04
Jul-
04
Jan
-05
Jul-
05
Jan
-06
Jul-
06
Jan
-07
Jul-
07
Jan
-08
Jul-
08
Jan
-09
Jul-
09
Jan
-10
Jul-
10
Jan
-11
Jul-
11
Jan
-12
Jul-
12
Jan
-13
Jul-
13
Jan
-14
Jul-
14
Jan
-15
US$
pe
r m
illio
n B
TU
RF-FRG
EU-Imp
Henri Hub
LNG Asia-Pacific
Sources: Adapted from EIA (2015), World Bank (2015), Index Mundi (2015)
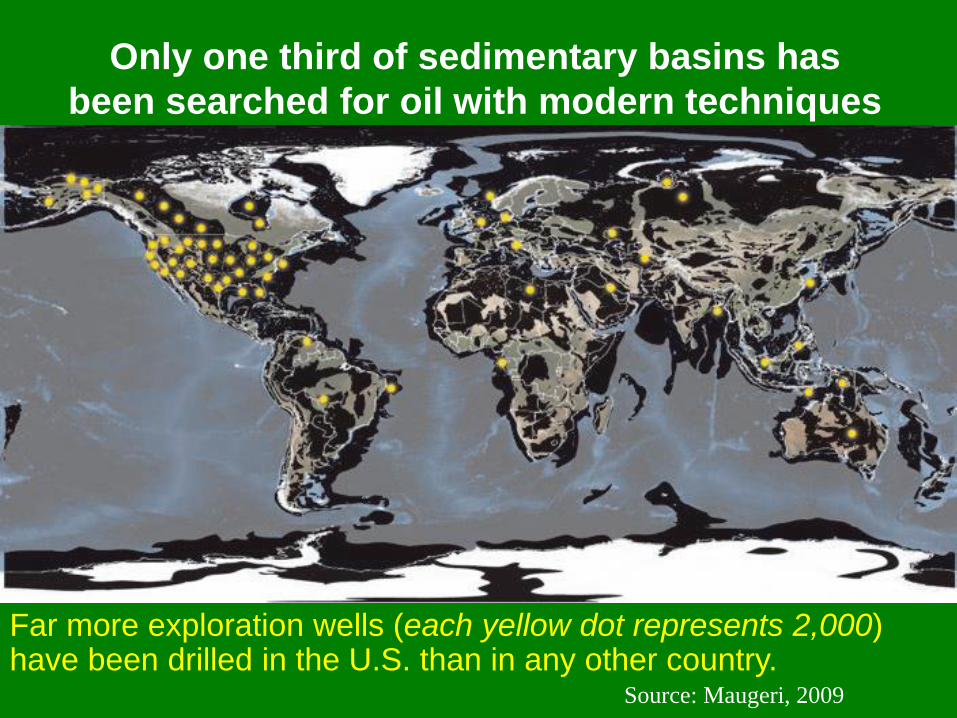
Only one third of sedimentary basins has
been searched for oil with modern techniques
Far more exploration wells (each yellow dot represents 2,000) have been drilled in the U.S. than in any other country.
Source: Maugeri, 2009

Energy Systems Analysis
Something Wrong with Theory?
• Historical success rate in US oil/gas drilling: Not better than with random drilling
• Depletion of fields postponed: Refill from below: Jean Whelan=“state of art”
• Deep gas hypothesis: Tommy Gold=highly controversial
• Gas tracers (C-14): Abiogenic gas=Yes, but minor curiosity?
• Gas hydrates: How to explain quantities and occurrence (e.g. in deep sea bottom)?
• Methane abundance in extraterrestrial environments: Relevance for planet Earth?
Energy Systems Analysis
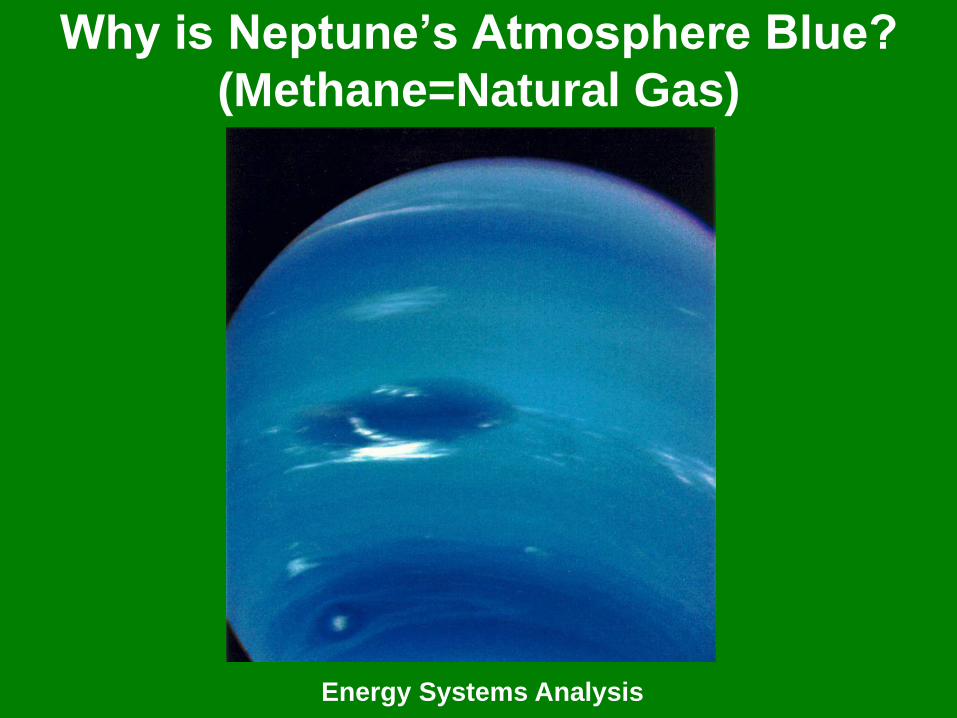
Why is Neptune’s Atmosphere Blue?
(Methane=Natural Gas)

Energy Systems Analysis
Renewable Energy Resource Basein EJ (1018 J) per year
n.e. Not estimated
a. The electricity part of current use is converted to primary energy with a factor of 0.385 (subst.equivalent).
.
ResourceCurrent
usea
Technicalpotential
Theoreticalpotential
Hydropower 13 50 147
Biomass energy 50 >276 2,900
Solar energy 2 >1,575 3,900,000
Wind energy 4 640 6,000
Geothermal energy 0.6 5,000 140,000,000
Ocean energy ~0 n.e. 7,400
Total ~70 >7,600 >144,000,000
Energy Systems Analysis
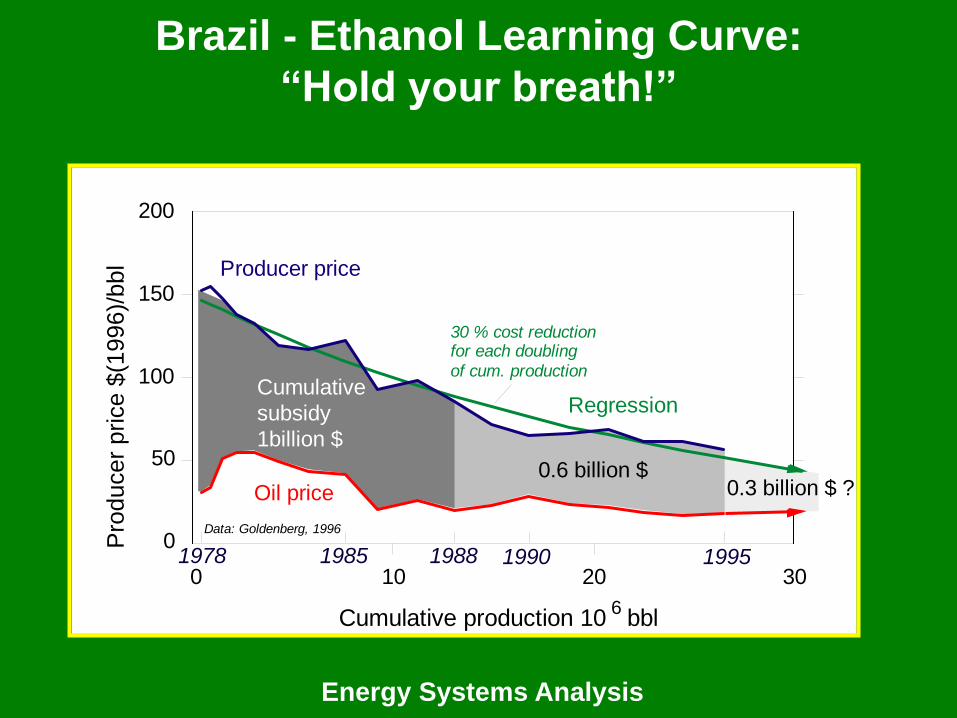
0
50
100
150
200
0 10 20 30
Cumulative production 10 6
bbl
Producer price
Regression
Oil price
1978 1985 1988 1990 1995
Data: Goldenberg, 1996
Cumulative
subsidy
1billion $
0.6 billion $0.3 billion $ ?
30 % cost reductionfor each doubling
of cum. production
Pro
ducer
price $
(199
6)/
bbl
Brazil - Ethanol Learning Curve:
“Hold your breath!”
Energy Systems Analysis