detection of micro emboli using signal energy...
TRANSCRIPT

DETECTION OF MICRO EMBOLI USING SIGNAL ENERGY AND DISCRETE FOURIER
TRANSFORM
BASIL MATHEW PANAMKUTTIYIL
RESEARCH REPORT SUBMITTED IN PARTIAL
FULFILMENT OF THE REQUIREMENT FOR MASTER OF ENGINEERING BIOMEDICAL
FACULTY OF ENGINEERING
UNIVERSITY MALAYA
2011

UNIVERSITI MALAYA
ORIGINAL LITERARY WORK
DECLARATION
Name of Candidate: BASIL MATHEW PANAMAKUTTIYIL
I.C/Passport No: G5459434 Registration/Metric No:
Name of Degree: Master of Engineering Biomedical
Title of Project Paper/Research Report/Dissertation/Thesis (“this Work”):
DETECTION OF MICRO EMBOLI USING SIGNAL ENERGY AND DISCRETE
FOURIER TRANSFORM
Field of Study: Bio-signal processing
I do solemnly and sincerely declare that:
(1) I am the sole author/writer of this Work;
(2) This Work is original;
(3) Any use of any work in which copyright exists was done by way of fair dealing and
for permitted purposes and any excerpt or extract from, or reference to or reproduction of any
copyright work has been disclosed expressly and sufficiently and the title of the Work and its
authorship have been acknowledged in this Work;
(4) I do not have any actual knowledge nor ought I reasonably to know that the making of
this work constitutes an infringement of any copyright work;
(5) I hereby assign all and every rights in the copyright to this Work to the University of
Malaya (“UM”), who henceforth shall be owner of the copyright in this Work and that any
reproduction or use in any form or by any means whatsoever is prohibited without the written
consent of UM having been first had and obtained;
(6) I am fully aware that if in the course of making this Work I have infringed any
copyright whether intentionally or otherwise, I may be subject to legal action or any other
action as may be determined by UM.
Candidate‟s Signature Date
Subscribed and solemnly declared before,
Witness‟s Signature Date
Name:
Designation:

ii
Abstract
A micro embolus is a plug of clot, fat, air or other material not normally found in
blood that moves with flowing blood between two points in the circulation. Micro emboli
have been detected with pathologies such as carotid artery disease, atrial fibrillation and also
in association with implanted vascular devices, such as prosthetic heart valves or left
ventricular assist devices. Conventional method for detecting the presence of emboli is done
manually which is a very tedious procedure. In this case examiner needs to spend long time
to detect emboli by visual or audio identification. This also can result in human errors in
finding exact numbers and location of emboli. The purpose of this research was to
automatically detect the presence of micro emboli signals and localize them from Trans-
cranial Doppler (TCD) signals by using signal energy and Discrete Fourier Transform.
Efficient detection of micro embolus helps in earlier diagnosis of stroke and for also
assigning corresponding therapy. TCD signal recorded in magnetic tape digital signal with a
sampling frequency of 44.1 KHz were used. Algorithms were formulated in both time and
frequency domain to get efficient and accurate results. In time domain the variations in signal
energy and on frequency domain difference in frequency due to presence of emboli is taken
into consideration. The number of occurrences and localization of micro embolus was done
based on its unique attributes framed by International Consensus on Micro Embolus
Detection. Conventional detection method is used and it is compared with the results
obtained using algorithm to check the accuracy. The designed algorithm was able to detect
presence of emboli with considerable accuracy. Automation eliminates the tedious
conventional method and also improves the accuracy by reducing human errors.

iii
Abstrak
Embolus Mikro merupakan kesesakan, lemak, udara atau benda asing yang tidak
sepatut dijumpai dalam darah yang bergerak melawan arah arus pengaliran darah. Emboli
Mikro telah dijumpai dalam penyakit seperti penyakit jantung, fibrilasi arteri, dan juga
dikaitkan dengan alat penyokong jantung seperti injap jantung buatan. Cara yang biasa
digunakan untuk mengenal pasti kewujudan emboli ialah secara manual dan ini adalah proses
yang membebankan. Masa yang panjang diperlukan untuk mengesan emboli secara
penglihatan atau pendengaran. Kesilapan manusia sering berlaku dalam proses mengenal
pasti bilangan dan lokasi emboli. Tujuan kajian ini ialah mengesan kewujudan emboli mikro
dan bilangannya secara automatik daripada isyarat Trans-cranial Doppler (TCD) dengan
menggunakan tenaga isyarat dan Discrete Fourier Transform. Keberkesanan cara mengenal
pasti embolus mikro akan membantu perawatan untuk penyakit strok dan terapi seterusnya.
Isyarat TCD direkodkan dengan menggunakan pita bermagnet pada frekuensi 44.1 kHz.
Formula telah dibina untuk kedua-dua domain dalam masa dan frekuensi. Ketidaksamaan
tenaga isyarat dalam domain masa dan beza dalam frekuensi adalah punca isyarat dimana
kewujudan emboli mikro, Bilangan emboli mirko dikesan dengan cara International
Consensus on Micro Embolus Detection. Cara ini telah dibanding dengan cara biasa untuk
mengenal pasti ketepatan cara yang dipersembahkan. Kajian ini telah menunjukan kebolehan
mengenal pasti kewujudan emboli dengan ketepatan yang memuaskan. Ia terbukti bahawa
cara ini lebih baik daripada cara biasa dengan mengurangkan kesilapan manusia.

iv
Acknowledgements
I bow my head before the God almighty for guiding me to successfully accomplish
this dissertation.
I would like to thank my supervisor, Dr. Ting Hua Nong, for his valuable guidance
and insights. This work would not be achieved without his kind support and advice. I would
also like to thank Dr. Tan of Medical College for his extended support, providing me the
TCD samples and guiding me for the successful completion of the project. Also I would like
to express my gratitude to Mr. Tan from Medical Physics department for giving me valuable
suggestions and advices.
I would like to express my appreciation to the entire laboratory staff for
providing a pleasant working environment which helped in conducting my work.
I would like to express my warmest gratitude to my family members, especially
my mother and father, for their support and encouragement. I also appreciate the opportunity
that they offered me to study in University Malaya.
I am really thankful to everyone who has supported, assisted, and encouraged me
during the time of the project.

v
Contents
CHAPTER 1: INTRODUCTION............................................................................. 1
1.1. Overview .................................................................................................. 1
1.2. Problem Statement .................................................................................... 4
1.3. Objective of the Research ......................................................................... 4
1.4. Significance of Study ................................................................................ 4
1.5. Scope of the Research ............................................................................... 4
1.6. Organization of the Dissertation ................................................................ 5
CHAPTER 2: LITERATURE REVIEW .................................................................. 6
2.1. Introduction .............................................................................................. 6
2.2. Micro Emboli............................................................................................ 7
2.3. Trans Cranial Doppler Ultrasound (TCD) ................................................. 8
2.4. Procedure for TCD Ultrasound ................................................................. 9
2.5. Significance of Detection ........................................................................ 11
2.5.1. Cerebral Micro Embolic Signals in cardiovascular disorders ................ 11
2.5.2. Cerebral micro embolic signals during acute stroke ............................. 15
2.5.3. Cerebral MES and cognitive impairment ............................................. 16
2.5.4. Micro Embolic signals during cerebral procedures ............................... 17
2.5.5. Micro embolic signals usage for assessing therapeutic efficiency ......... 18
2.6. Artifacts present during Emboli Detection............................................... 18
2.7. Current Emboli Isolation Techniques ...................................................... 19

vi
2.7.1. Embolus to blood power ratio (EBR) ................................................... 19
2.7.2. Discrete Wavelet Transform ................................................................ 20
2.7.3. Adaptive Neuro Fuzzy Inference System ............................................. 21
2.8. Comparison between current methods ..................................................... 22
CHAPTER 3: RESEARCH METHODOLOGY ................................................... 23
3.1. Introduction ............................................................................................ 23
3.2. Data Collection ....................................................................................... 24
3.3. Detection Algorithm ............................................................................... 25
3.3.1. Using Energy of Signal ........................................................................ 26
3.3.2. Using DFT ........................................................................................... 27
CHAPTER 4: RESULTS AND DISCUSSIONS .................................................... 28
4.1. Introduction ............................................................................................ 28
4.2. Time Domain Analysis Results ............................................................... 29
4.3. Frequency Domain Analysis Results ....................................................... 36
4.4. Comparison of results with conventional method .................................... 43
CHAPTER 5: CONCLUSION AND FUTURE WORKS ..................................... 45
5.1. Conclusion ............................................................................................. 45
5.2. Future Works ......................................................................................... 45
REFERENCES ........................................................................................................ 46
APPENDIX ............................................................................................................. 52
A.1. MATLAB code for detection in Time domain ......................................... 52

vii
A.2. MATLAB code for detection in Frequency domain ................................. 54
LIST OF FIGURES
Figure 2.1: Ultrasound – Insonation of an artery 9
Figure 3.1: Flow chart for the Research Methodology 23
Figure 4.1: Energy of the signal plotted against time showing one micro embolus peak 30
Figure 4.2: Energy of the signal plotted against time showing peak of two micro emboli 31
Figure 4.3: Energy of the signal plotted against time showing peak of three micro emboli 33
Figure 4.4: Energy of the signal plotted against time showing scattered peaks with no emboli
34
Figure 4.5: Energy of the signal plotted against time showing peaks of micro emboli and
artifacts 35
Figure 4.6: Plotting |X| against frequency showing the spectrum of frame containing the
micro embolus 37
Figure 4.7: Plotting |X| against frequency showing the spectrum of one of the frame from
two, containing the micro emboli signal. 38
Figure 4.8: Plotting |X| against frequency showing the spectrum of one of the frame from
three, containing the micro emboli signal. 40
Figure 4.9: Plotting |X| against frequency showing the spectrum of sample frame having no
embolus 41
Figure 4.10: Plotting |X| against frequency showing the spectrum of one of the frame that
contain artifact which mimic emboli 42
viii
LIST OF ABBREVATIONS
TCD Trans-cranial Doppler
EBR Embolus to Blood Ratio
PRF Pulse Repetition Frequency
CEA Carotid Endarterectomy
ACST Asymptomatic Carotid Surgery Trial
MCA Middle Cerebral Artery
MES Micro Embolic Signal
TIA Transient Ischemic Attack
TOE Transoesophageal echocardiography
CABG Coronary Artery Bypass Graft
DWT Discrete Wavelet Transform
ANFIS Adaptive Neuro Fuzzy Inference System
DFT Discrete Fourier Transform
RMS Root Mean Square
UMMC University Malaya Medical College
1
CHAPTER 1: INTRODUCTION
1.1. Overview
Cerebral micro emboli remain high part in all vascular accidents. A micro embolus is
a plug of clot, fat, air or other material not normally found in blood that moves with flowing
blood between two points in the circulation. Micro emboli have been detected with
pathologies such as carotid artery disease and atrial fibrillation. They have also been detected
in association with implanted vascular device, such as prosthetic heart valves or left
ventricular assist devices. Approximately 50% of patients with implanted prosthetic heart
valves demonstrate micro emboli in the cerebral circulation (Moehring, Merrill P, Donald L,
& Patrick Demljth, 1995).
Detection of micro embolus is of greater significance since it can be considered as
marker for stroke in some cases. It is also essential to detect the sizing and characterization
for correct diagnosis and employing suitable therapy. Embolus detection can be done using
many methods. But non invasive method using ultrasound technique is of more interest.
Trans-cranial Doppler Ultrasound (TCD) is a test that measures the velocity of blood flow
through the brain's blood vessels. It uses ultrasound to found the velocity profile of blood
through cerebral vessels. Signals from TCD are mainly used to detect the presence of micro
emboli.
Blood flow velocity is recorded by emitting a high-pitched sound wave from the
ultrasound probe, which then bounces off of various materials to be measured by the same
probe. A specific frequency is used (usually a multiple of 2 MHz), and the speed of the blood

2
in relation to the probe causes a phase shift, wherein the frequency is increased or decreased.
This frequency change directly correlates with the speed of the blood, which is then recorded
electronically for later analysis. Doppler velocity spectrum and sound waves can be obtained
which is used for further analysis (Moehring, Merrill P, Donald L, & Patrick Demljth, 1995).
Ultrasound signals might differ from each other‟s according to acoustic characteristics
of embolic materials. Hence it follows that the characteristics of embolic sound may vary
depending on its size and materials of which it is composed. Artificial noises occasionally
resemble the embolic signal. Artificial signals were produced by movement of probe during
monitoring of blood flow in the middle cerebral artery. It‟s very important to distinguish
artificial signals and also differentiate different embolus for the treatment and therapy of the
patient (Nagatsuka, Sakaguchi, Yoshimoto, & Sawada, 1996).
The major phase in the detection of micro embolus is obtaining high degree of
accuracy and specificity. The sound signals obtained from TCD varies in nature. The whole
signal is composed of back scattered energy from blood, embolus and other artificial noises.
Some of these artificial noises sometimes mimic the signals of embolic nature. There are
certain criteria‟s by which micro emboli can be differentiated from artificial ones. This
criterion is framed by international consensus conference held about cerebral micro emboli
detection. Major points discussed on that conference is about the various parameters and
constraints in emboli detection.

3
Various signal processing techniques are applied based on criterion given by
International Consensus in Micro Emboli Detection, for distinguishing the embolic signal
from its background. The study is going to propose an easier way to detect the presence of
micro emboli. The study will differentiate emboli signals from artificial signals. The study
will also determine the material which embolus is made of that helps in its treatment.
Embolus to blood power ratio (EBR) is used to differentiate the micro emboli.

4
1.2. Problem Statement
Conventional method for detecting the presence of emboli is done manually which is
a very tedious procedure. Examiner need to spend long time to detect emboli by visual or
audio identification. This also can result in human errors in finding exact numbers and
location of emboli. Therefore it requires a need for automating the process.
1.3. Objective of the Research
To main objective of the study is to automatically detect the presence of micro emboli
signals and localize them from Trans-cranial Doppler signals by using signal energy and
Discrete Fourier Transform.
1.4. Significance of Study
Micro emboli can result in cause of stroke and even death in some cases. The research
focuses on detecting the presence of micro emboli automatically and localizes each of them.
Efficient detection of micro embolus helps in earlier diagnosis of stroke and for also
assigning corresponding therapy and treatment.
1.5. Scope of the Research
The research looks at an easier way to detect the presence of micro emboli in blood
which may lead to cause stroke. It helps to avoid the conventional method of examining the
signals manually which is really tedious by automating it using the signal analysis methods.
In this research TCD signals are analyzed in both time and frequency domain for getting the
desired quick and reliable results.
5
1.6. Organization of the Dissertation
The research report contains five chapters. The first chapter mainly gives a brief
introduction about the research. Chapter two describes the literature review of this
project. This gives information about previous studies conducted in this field about micro
emboli, Trans-cranial Doppler signal, significance of the detection and finally the current
methods. The third chapter describes the methodology followed to achieve the results. It
explains the detection algorithm. Chapter four illustrates the results obtained from the
experiment. Detection algorithm is tested using different input signals the result of these
testing is formulated as graphs and tables. Chapter five simply concludes the basic results
of the thesis. It also mention about future changes that can be made in this field.

6
CHAPTER 2: LITERATURE REVIEW
2.1. Introduction
Micro embolus is a considered to be a plug of clot, fat, air or other material which is
not normally found in blood and moves with the flowing blood. Micro emboli can be
differentiated according to its make as solid emboli and gaseous emboli. Solid emboli are
formed as a result of „furring up‟ of the arteries and typically consist of thrombus, hard
calcified plaque, or soft fatty material atheroma. Gaseous emboli may also enter the
circulation during surgery or form from gases that are normally dissolved in the blood. The
word embolus is derived from word in Greek language „embolos‟ which means „stopper‟.
Any foreign body free-floating in the bloodstream in solid or gas form is called an embolus.
(Chung, 2006)
Stroke is considered as an interruption to blood supply to any part of the brain also
called as „brain attack‟. It can result in loss of brain function and even death in some cases.
One of the major causes of stroke is embolization of plaque and thrombus. „Plugging-up‟ of
the arteries by emboli causes poor oxygen supply to brain tissue called as cerebral ischemia,
which can lead to irreversible neuronal damage and cell death (infarction). Embolus detection
using trans-cranial Doppler (TCD) offers a unique, non-invasive glimpse of the dynamic
mechanisms and interactions underlying embolic stroke. Studies about embolization
suggested that stroke may be the visible tip of a much larger case. The ill effects caused by
the majority of micro emboli often go unnoticed. Most of them produce only minor injuries to
brain tissue with subtle transient symptoms.

7
Brain has ability to protect itself from ischemia by using collateral circulation. There
is a complex relationship between embolization and the brain‟s capability to regulate the
blood supply. Arteries provide us with numerous alternative routes even during the event of a
major embolic obstruction which allow blood to get to where it is needed. The topology of
the arteries and anatomy of the brain are also important; an equally severe stroke can arise
from obstruction of a small artery supplying a critical area as from a larger blockage. Finally,
properties of the blood can play an important role in governing the ability of the brain to clear
emboli, and the extent to which embolic blockages may cause damage to the artery walls.
Monitoring of subjects using TCD can provide warning signs of embolization and an
opportunity for clinicians to „steer‟ subjects out of danger (e.g. by surgically removing plaque
or providing medication). TCD monitoring permits detection and early treatment of subjects
at high risk. It also provides a valuable means of assessing technological advances and
pharmacological intervention for reducing embolization. (Chung, 2006)
2.2. Micro Emboli
A micro embolus is a particle which is not normally found in blood and moves with
blood circulation. It is composed of clot, fat, air or other material. Micro emboli have been
detected with pathologies such as carotid artery disease and atrial fibrillation. They have also
been detected in association with implanted vascular device, such as prosthetic heart valves
or left ventricular assist devices. Approximately 50% of subjects with implanted prosthetic
valves demonstrate micro emboli in the cerebral circulation. (Moehring, Merrill P, Donald L,
& Patrick Demljth, 1995)
8
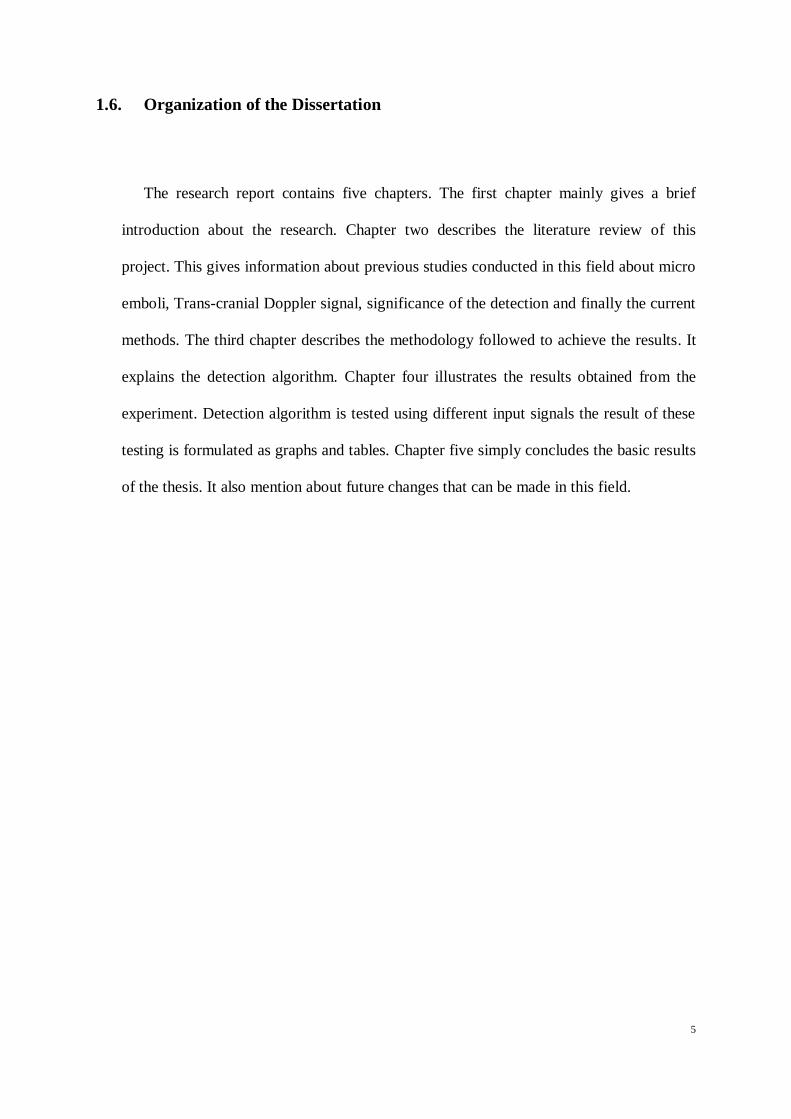
2.3. Trans Cranial Doppler Ultrasound (TCD)
Ultrasound is generated using a piezoelectric transducer, which changes thickness
when an oscillating voltage is applied. The amplitude and frequency of the electrical
oscillation is chosen to give the desired amplitude and frequency of ultrasound. When the
transducer expands and contracts it moves neighboring molecules forward and back, creating
multiple sound waves. These are focused by a concave outer surface, or an acoustic lens, to
form the ultrasound beam. The characteristics of the beam depend on the dimensions of the
crystal, the ultrasound frequency and the properties of the lens. (Chung, 2006) Figure 2.1
shows the insonation of an artery using ultrasound.
Figure 2.1: Ultrasound – Insonation of an artery
9
2.4. Procedure for TCD Ultrasound
To perform TCD monitoring, the transducer is used to create an ultrasound pulse of ~
10 μs duration and ft ~ 2 MHz Pulses are repeated at between 4 and 12 thousand times per
second. This is called the pulse repetition frequency (PRF). Following the transmission of a
pulse, the transducer starts to receive echoes, which are converted back into an electrical
signal called the „radio frequency‟, or RF signal. The RF signal contains frequencies which
differ slightly from those of the emitted pulse because of the Doppler Effect.
Ultrasound scattered from a chosen depth (sample volume) can be captured by only
accepting echoes that arrive at a certain time after transmission. This is done by allowing a
„gate‟ to briefly open (the „receive gate‟). While the gate is open, we „catch‟ and analyze the
returned echoes.
Ultrasonic detection of emboli is based on the Doppler Effect proposed by Christian
Andreas Doppler in 1842 Doppler thought that a wave would have a higher frequency if the
source was moving toward the observer and a lower frequency if moving away from the
observer. The difference between the transmitted (ft) and observed (fo) frequencies is called
the Doppler shift (fD),
Equation 1: fD = fo − ft
The Doppler Effect was proved for sound waves by Christophorus Henricus
Diedericus Buys Ballot in 1845, who asked a group of musicians to play a calibrated note
from a train on the Utrecht to Amsterdam train-line. Musicians on the station platform were
asked to listen for the change in pitch. Doppler‟s theory makes it possible to determine the
velocity (v) of an object by measuring its Doppler shift (fD). Since most objects don‟t emit

10
sound, the Doppler shift is usually measured by detecting changes in the frequency of
reflected sound waves. For sound reflected from a moving object, the Doppler shift is
doubled. The velocity of the object is given
Equation 2: v = f Dc/2ft cosθD
The measured velocity depends on the frequency of the transmitted sound (ft), the
local speed of sound (c), and the direction of motion in relation to the observer, as given by
the Doppler angle, θD. If the source is moving directly toward the observer (θD = 0°)
then the Doppler shift will be at a maximum. Perpendicular to the source (θD = 90°) there
is no Doppler shift at all. If the source is moving away from the observer (θD = 180°) the
Doppler shift will be negative.
The first of the post process is to separate the Doppler audio signal from the RF signal
by a process called demodulation. Demodulation involves „mixing‟ or multiplying together
the emitted and received signals. The low frequency (Doppler shift) component of the signal
is then extracted by „filtering out‟ the high frequency components. Thus we get the Doppler
shifted signals which needs to be analyzed for the detection of micro emboli. (Chung, 2006)

11
2.5. Significance of Detection
2.5.1. Cerebral Micro Embolic Signals in cardiovascular disorders
2.5.1.1. Carotid stenosis
Vascular disorders and Brain infarction which occurs recurrently can be significantly
predicted using indicative carotid stenosis. In Subjects who has internal carotid stenosis
recently CEA (Carotid endarterectomy) lowers the danger of ischaemic stroke. On the other
hand, based on the risk-modeling analysis, many of the subjects will not have advantage from
CEA. The ACST (Asymptomatic Carotid Surgery Trial) displayed that, in asymptomatic
subjects who was with percentage of carotid stenosis on ultrasound was 60% or more,
Carotid endarterectomy made half the 5-year stroke danger from an approximate value of
12% to 6%. With such a less absolute reduction of risk, even very few asymptomatic
subjects have advantages from CEA. Consequently, more sensitive techniques for finding
subjects at high danger of stroke could be helpful in bettering the ratio of risk: benefit.
(Azarpazhooh & Chambers, 2006)
The monitoring of MCA (middle cerebral artery) by using can detect the
asymptomatic micro embolic signals in subjects who have asymptomatic and symptomatic
carotid stenosis. For symptomatic carotid artery stenoses the MES rate has changed from
21% to 94% and for asymptomatic it changed from 0.6% to 23.3%. This can reveal the
differences in the populations of subjects who were considered for the study, treatment
regimens, machine settings, equipment and monitoring protocols which includes duration of
recording or interpretation about an embolic signal. Additionally, one cannot leave out the
chance of unintentional bias which favors the identification of MES when the viewer is aware
of the occurrence of a possible cause of embolism (Markus, 1995).
12
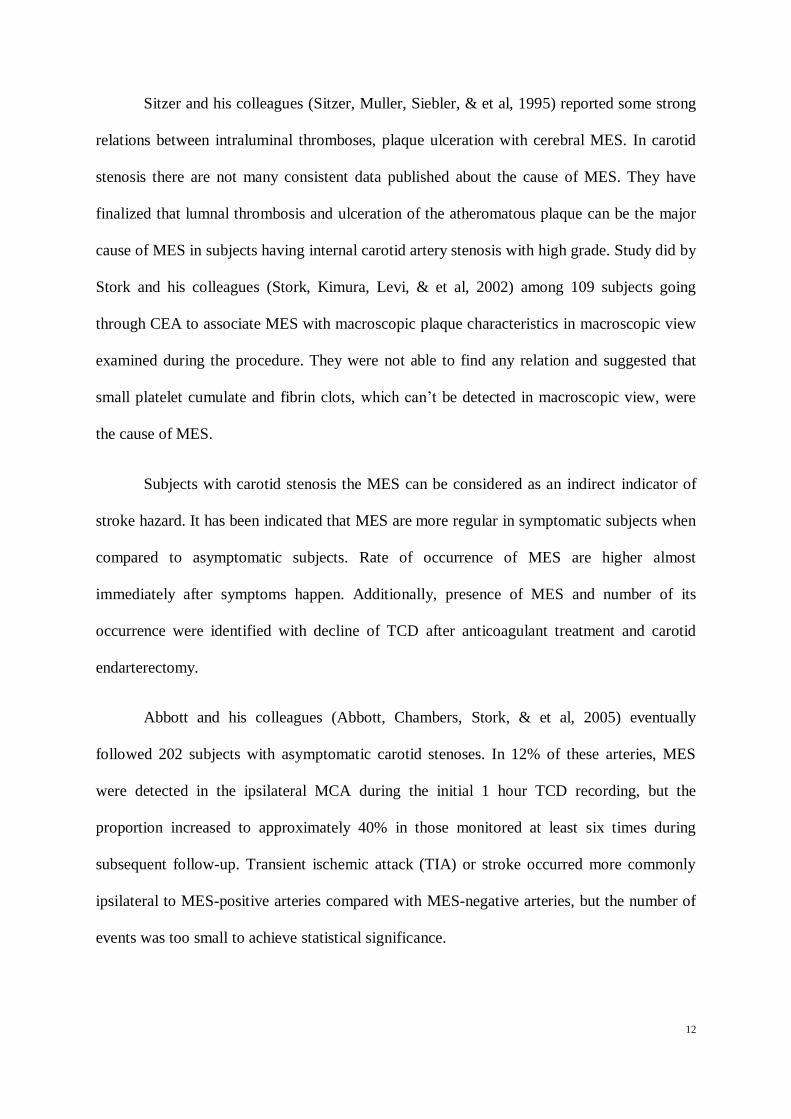
Sitzer and his colleagues (Sitzer, Muller, Siebler, & et al, 1995) reported some strong
relations between intraluminal thromboses, plaque ulceration with cerebral MES. In carotid
stenosis there are not many consistent data published about the cause of MES. They have
finalized that lumnal thrombosis and ulceration of the atheromatous plaque can be the major
cause of MES in subjects having internal carotid artery stenosis with high grade. Study did by
Stork and his colleagues (Stork, Kimura, Levi, & et al, 2002) among 109 subjects going
through CEA to associate MES with macroscopic plaque characteristics in macroscopic view
examined during the procedure. They were not able to find any relation and suggested that
small platelet cumulate and fibrin clots, which can‟t be detected in macroscopic view, were
the cause of MES.
Subjects with carotid stenosis the MES can be considered as an indirect indicator of
stroke hazard. It has been indicated that MES are more regular in symptomatic subjects when
compared to asymptomatic subjects. Rate of occurrence of MES are higher almost
immediately after symptoms happen. Additionally, presence of MES and number of its
occurrence were identified with decline of TCD after anticoagulant treatment and carotid
endarterectomy.
Abbott and his colleagues (Abbott, Chambers, Stork, & et al, 2005) eventually
followed 202 subjects with asymptomatic carotid stenoses. In 12% of these arteries, MES
were detected in the ipsilateral MCA during the initial 1 hour TCD recording, but the
proportion increased to approximately 40% in those monitored at least six times during
subsequent follow-up. Transient ischemic attack (TIA) or stroke occurred more commonly
ipsilateral to MES-positive arteries compared with MES-negative arteries, but the number of
events was too small to achieve statistical significance.
13
The MES from subjects having stroke because of carotid artery stenosis can increase
the danger of early recurrence of ischemic condition. The existence of MES is an independent
indicator of future stroke condition of subjects having asymptomatic and symptomatic carotid
stenosis. In the study by Markus and MacKinnon among 200 subjects who had recent
symptoms and ipsilateral carotid stenosis had MES during a single 1 hour recording. During
follow-up to 90 days, overall there were seven subjects suffering stroke and 24 subjects
suffering TIA. The presence of MES independently predicted stroke alone or stroke and TIA
with an odds ratio of 4.67 (Markus & MacKinnon, 2005).
MES can also be found in relate to carotid dissection & aortic arch atherosclerosis.
Srinivasan and his colleagues (Srinivasan, Newell, Sturzenegger, & et al, 1996) confirmed a
high occurrence of MES in the MCA which is distal to carotid dissections and a noteworthy
correlation between the existence of emboli and stroke. Aortic arch atheroma having plaque
width >4 mm or itinerant plaque is an important predictor of recurring brain infarction and
further vascular events. Monitoring of MES and TOE (Trans-esophageal echocardiography)
are used for assessment of the aortic arch. This can be useful in prophylactic treatment for the
choice of stroke subjects for it.
Complex aortic arch atheroma may be associated with greater stroke risk. Some
researches‟ have confirmed a positive connection among TCD-identified MES and the
rigorousness of atheroma in the rising aortic arch and aorta. Aortic arch atheroma is
connected with an elevated danger of post operative stroke in the cardiac operation setting.
There is an increased level of danger of clinically unwavering embolic events in subjects who
suffer cardiac angiography with noticeable thoracic aortic atheroma (Rundek, Tullio, Sciacca,
& et al, 1999).

14
2.5.1.2. Cardiac diseases
Embolism associated with cardiac basis contributes for approximately 25% of
ischemic strokes. Cardio embolism is often suspected on clinical grounds, but is difficult to
document. Trans-cranial Doppler monitoring for MES helps determine the risk of cerebral
ischemia in subjects with potential cardiac sources of embolism, including atrial fibrillation,
prosthetic heart valves, electrical cardioversion, myocardial infarction and bacterial
endocarditis. The prevalence of MES in these pathologies ranges from 15% to 94%. The
detection of MES is greater in subjects with a known high risk of embolization, such as
infective endocarditis and mechanical prosthetic heart valves, and is less in subjects with a
lower risk of embolization such as. atrial fibrillation (Nadareishvili, Choudary, C, & et al,
1999).
Microembolic signals occur frequently in subjects with mechanical heart valves.
However among fully anti coagulated subjects, most of these signals are a harmless
phenomenon and are thought to represent nitrogen gas bubbles induced by cavitation,
because they disappear when the patient breathes 100% oxygen. Braekken and his colleagues
found that subjects with cerebrovascular symptoms had a higher frequency of MES. These
subjects may have had a combination of particulate and gaseous MES (Braekken, Russell,
Brucher, & et al, 1995).
2.5.1.3. Intracranial atherosclerosis
One of the major causes of stroke in people from Asia, Black and Hispanic races is
intracranial atherosclerosis, but it is not seen very common in Caucasians. Transcranial
Doppler is an accurate and non-invasive method, particularly when combined with colour
flow duplex (TCCD), for the detection of intracranial stenosis and it associate well with
angiographic results (Segura, Serena, Castellanos, & et al, 2001).

15
Cerebral embolism which is distal to the stenosis can be a major mechanism for
ischemic actions in these subjects. The partial data on the MES frequency in subjects who are
having MCA stenosis are primarily applicable to stroke which is acute. The recurrent
happenstance of cardiac and carotid artery illness in subjects having intracranial stenosis can
pilot to difficulties in recognizing the origin of stroke in some subjects. Concurrent
observation for MES in different vessels can guide to recognize the active embolic cause.
Researchers have found out those micro emboli signals are regular in middle cerebral artery
stenosis in the phase of stroke which is acute, but have not been found in the chronic phase,
even in those subjects who had MES in the first days after stroke onset (Segura, Serena,
Castellanos, & al, 2001)
2.5.2. Cerebral micro embolic signals during acute stroke
2.5.2.1. Ischemic stroke
Micro embolic signals are regularly identified in TCD observation in selected subjects
who is having ischemic stroke which is acute in spite of anticoagulant or anti-platelet
treatment. The occurrence of MES in stroke which is acute fluctuates ranging 9.3% to 71%.
Subjects who is having acute ischemic stroke using TCD evaluated the presence of micro
embolic signals by Silwika and his colleagues. The prevalence of MES was higher in subjects
who are observed inside the first week after the commencement of stroke. Frequencies of the
micro embolic signals were more in completed stroke when compared to subjects with TIA,
in symptomatic when compared with asymptomatic hemispheres (Sliwka, Lingnau,
Stohlmann, & et al, 1997).

16
2.5.3. Cerebral MES and cognitive impairment
Micro embolic signals are generally not associated with immediate focal neurological
symptoms. However there are many evidences found out which shows that ongoing and
generalized occurrence of micro embolic signals can lead to declining of neuropsychological
dysfunction. The neuropsychological functions that are likely to be affected after cardiac
surgery include psychomotor speed, comprehension, concentration, attention, constructional
ability, memory and new learning abilities.
The mechanisms of the neuropsychological dysfunction after open-heart surgery are
uncertain and probably due to many factors. However, the most likely causes of cognitive
difficulties are MES occurring during surgery, altered cerebral perfusion and an inflammatory
response. There is substantial evidence that coronary artery bypass graft surgery can impair
cognitive function. It is possible that embolization is the primary cause of perioperative
neuropsychological deficits, with incidence related to the number of micro embolic signals.
Braekken and his colleagues found an association between intra-operative cerebral
MES and decline in postoperative neuropsychological performance in subjects undergoing
coronary artery bypass graft surgery and valve replacement. A high number of micro embolic
signal were detected during valve replacements in subjects with neuropsychological deficit.
Among CABG subjects, neuropsychological deficits occurred with lower MES counts. This
difference may be explained by relatively more gaseous emboli in VR subjects and more
solid emboli in CABG subjects (Braekken, Reinvang, Russell, & et al, 1998).
17
Deklunder and his colleagues (Deklunder, Roussel, & Lecroart, 1998) described that
declining of working memory occurred during the presence of cerebral micro embolic signals
in subjects having mechanical heart valves. Neuropsychological evaluation of subjects
undergoing carotid endarterectomy demonstrated both deterioration and improvement in
different subjects. Deterioration may be associated with global hypo perfusion or MES and
improvement with increased cerebral blood flow from removal of the stenosis (Heyer,
Adams, Solomon, & et al, 1998).
2.5.4. Micro Embolic signals during cerebral procedures
2.5.4.1. Cerebral angiography
Cerebral angiography is related with a diminutive (less than 1 percentage) however
important risk of disabling stroke or even death. Continuous TCD monitoring during
interventional neuro-radiology procedures, including cerebral angiography, may provide
important insights into the pathophysiology of periprocedural stroke and guide management
strategies to help avoid such devastating events.
Some studies have revealed numerous MES during carotid angiography. MES occur
frequently during all phases of uncomplicated cerebral angiography. They are more frequent
during catheter flushing and the injection of contrast material. The MES that occur during
angiography are usually clinically silent. However, frequent air embolism may result in
transient neurological symptoms. Allowing contrast media to stand prior to injection, and by
flushing catheters with saline injected slowly, reduces MES during angiography (Markus,
Loh, Israel, & et al, 1993).

18
2.5.5. Micro embolic signals usage for assessing therapeutic efficiency
Usage of MES as a surrogate end-point may allow the determination of efficacy in a
smaller patient sample. Several authors have investigated the clinical predictors and potential
therapeutic implications of MES in cerebro vascular disorders. The detection of MES can
potentially aid the selection of antithrombotic treatment in acute stroke, monitoring of oral
anticoagulant intensity and determine the efficacy of therapeutic strategies for the secondary
prevention of stroke. The detection of MES may also allow determination of the effectiveness
of novel treatments in reducing the risk of stroke after CEA. Such an approach may allow
new agents to be optimized before the confirmation of efficacy in large clinical trials
(Markus H. , 2000).
2.6. Artifacts present during Emboli Detection
The sonogram often contains strange signals which are not due to the motion of blood
or emboli. These artifacts typically arise from motion of the patient (such as coughing,
snoring, or talking), or from movement of the probe. If a signal is very intense, the circuitry
may become overloaded. This „saturates‟ the Doppler audio output and produces sharp spikes
in the sonogram across a broad range of frequencies.
Another artifact is „aliasing‟, which appears as a folding of high frequency parts of the
spectrum onto lower frequencies. Aliasing can be avoided by checking that the pulse
repetition frequency is over twice the maximum Doppler shift frequency from blood flow.
(Chung, 2006)

19
2.7. Current Emboli Isolation Techniques
2.7.1. Embolus to blood power ratio (EBR)
Doppler sample volume is made large enough to include the entire transverse section
of the vessel, then this "embolus-to-blood ratio" (EBR) is expressed as
Where
σE = backscatter cross-section of the embolus
σB = backscatter cross-section of the flowing blood within the Doppler sample
volume
V = volume of the flowing blood within the Doppler sample volume
α = volume backscatter coefficient of blood.
The Doppler output will be a measurement of σB + σE when an embolus is present,
and σB when no embolus is present. It is assumed that the embolus does not displace a blood
volume of more than several per cent of the vessel volume under observation, so as an
approximation; the loss of scattering from the displaced blood will not be included in this
expression. (Moehring & Klepper, 1994)

20
2.7.2. Discrete Wavelet Transform
A DWT yields a countable set of coefficients, which correspond to points on a two
dimensional grid of discrete points in the timescale domain. The DWT is defined with respect
to a mother wavelet and maps finite energy signals to a two dimensional grid of coefficients.
The process implemented at each stage can be simplified as low-pass filtering (averaging) of
the signal for the approximations and high-pass filtering (differencing) of the signal for the
details, and then decimating (down sampling) of the coefficients to reduce sampling rate by
half. The WT coefficients can be interpreted as the resemblance indexes between the signal
and the wavelet, so the WT of a signal is not unique and very much depends on the choice of
the wavelet. Under certain conditions, reconstructing a signal from its wavelet coefficients is
also possible. The process is called inverse discrete wavelet transform (IDWT) and involves
up sampling (interpolation) and filtering. Up sampling is the process of lengthening a signal
by inserting zeros between samples.
The following parameters were derived from the reconstructed wavelet coefficients;
Total power to threshold ratio for the embolic signal, Scale with maximum intensity (SMI)
duration (TP2TR), Peak intensity to threshold ratio (PI2TR), Forward to reverse intensity
ratio at the scale with maximum intensity (F2RRM), Forward to reverse intensity ratio at the
scale 8 (F2RR8), Rise rate of embolic signal power (RR) and Fall rate of embolic signal
power. (Aydin, Markus, & Marvasti, 2001)

21
2.7.3. Adaptive Neuro Fuzzy Inference System
Adaptive Neuro Fuzzy Inference System (ANFIS) is a fuzzy modeling procedure to
learn about a data set and its aim is in order to compute the membership function parameters
that best allow the corresponding fuzzy inference system to follow the given input - output
data. By using a given input - output data set, ANFIS constructs a fuzzy inference system
(FIS). Its membership function parameters are tuned using a back propagation algorithm.
This algorithm is single or with combination of least squares type of method. This allows
fuzzy systems to learn the data they are modeling.
Detection study involves the following steps. At first the signals from 35 subjects
having symptomatic carotid stenosis were recorded by using a transcranial Doppler
ultrasound system (Pioneer TC4040). These recorded quadrature audio Doppler signals
including ES were exported to a PC. Then, threshold values which are identified before were
applied to each of the fifteen parameters. At last; data mining methods are applied to classify
the signals as ES (Embolic Signals), AR (Artifacts), or DS (Doppler Speckle). (Aydin,
Karahoca, & Kucur, Data Mining Usage in Emboli Detection, 2007)

22
2.8. Comparison between current methods
In the following table 2.1 we can see the comparison between current methods for
emboli detection which are discussed above in the review
Table 2.1: Showing comparison between accuracy of current methods in detection of micro emboli
In the table the sensitivity and specificity of each method are described. The sampling
frequency corresponding to each method is given. The threshold value used in method is also
given with it. The discrete wavelet transform method gives 96 % specificity and also 95 %
sensitivity (Aydin, Markus, & Marvasti, 2001). EBR method gives 92 and 88 % respectively
(Moehring & Klepper, 1994), whereas ANFIS method gives 98 % for both sensitivity and
specificity (Aydin, Karahoca, & Kucur, Data Mining Usage in Emboli Detection, 2007).
.
Method Specificity Sensitivity Sampling Rate Threshold
Discrete Wavelet
Transform 96% 95% 7.15 kHz 3 dB
EBR 92% 88% 12 kHz 10 dB
Fuzzy
Logic(ANFIS) 98% 98% 8.06 kHz 6 dB

23
CHAPTER 3: RESEARCH METHODOLOGY
3.1. Introduction
This chapter describes the research methodology for the detection of micro emboli. It
describes the overall procedures and experimental set up for the research. A summary of
overall procedures is shown in Fig 3.1. From this we can understand the research can be
broken down into many steps which are done in sequence.
Figure 3.1: Flow chart for the Research Methodology
Data Collection
Detection Algorithm
Data Analysis

24
3.2. Data Collection
The signals used for this study were recorded using a commercially available Trans-
cranial Doppler system with a 2-MHz transducer. The signal recording is done at Neurology
department of University Malaya Medical College (UMMC). The sample signals recorded in
the magnetic tape were collected from the department for the research.
Digital Tape recorder from Sony TCD D8 is used for recording the signals. Recorder
provides a high quality digital recording. The recorder has choice for selecting 3 different
sampling frequencies 48/44.1/32 kHz. Recordings had been made onto digital audiotape and
the sampling frequency used here is 44.1 kHz.
The quadrature audio Doppler signals containing embolic signals (ES) were exported
to a personal computer for signal analysis. The sampling frequency was 44100 Hz. The
signals used for evaluating the detection methods are made from these recorded signals in the
audio tape. The audio tape is connected to the computer using an audio cable. The raw signal
is viewed using digital audio editing software GoldWave. The signals are saved to computer
in 16 bit mono wave file format. The raw signal was first examined using conventional
criteria and marked the presence of emboli and occurrences of it.

25
Embolic signals were identified subjectively by the experienced observers from the
audio signal using conventional criteria. Embolic signals are found out using the conventional
detection method by examining the signals and also noise signals are categorized. In order to
evaluate the detection system, different data sets are created by mixing the noise with the
recordings. The noise signals for these data sets are obtained during patient recordings by
tapping the probe or by speech or coughing or obtained from natural artifacts occurring
during patient movement, speech, or coughing during routine patient recordings. The data set
constitutes 1) ES signals, 2) ES signal with Noise 3) Noise.
3.3. Detection Algorithm
The project mainly aims to detect the presence of micro emboli in cerebral blood
vessel by analyzing the Trans-cranial Doppler signal. Detection is based on peculiar
characteristics micro emboli have which differs from the noise and background signals.
Signals are analyzed in both time and frequency domain for marking the presence of emboli.
The basis of time domain and frequency domain detection algorithm is mentioned below.

26
3.3.1. Using Energy of Signal
As mentioned earlier micro emboli possess certain characteristic which differentiates
it from background signal. The main difference by which we can isolate emboli from
background signals is that its high energy content. Micro emboli suddenly appear as a spike
in signal with high energy content. By marking the higher energy content area in the signal
we can isolate the micro emboli present. The area in which energy is greater than threshold
value is considered as an emboli signal. This threshold value is named as lower threshold
value since signals less than this value will be eliminated. Threshold value is determined
based on international consensus on micro emboli detection. It suggests that energy content
of micro emboli signals is 3db more than that of background signals. In the algorithm average
RMS value of energy is found out for each frame of data with length 400 data points. The
average energy of background signals is found out by approximating it equal to average value
of 100 initial frames of data. The frames which have energy content 3db more than this
average energy of background signal is suspected to be micro emboli. These frames are
marked by using the algorithm.
For eliminating the artifacts present in the signals we need to consider an upper
threshold value also. Some of the artifacts present in the signal can have very high energy.
The maximum value of energy of frame containing micro emboli is considered as upper
threshold value. The frames which have energy content higher than upper threshold value is
eliminated in the algorithm. The algorithm separate frames which have energy content which
is similar to that of energy content of micro emboli signal. By considering both duration and
threshold number of frames which contain micro emboli is found out. Then time of
occurrence is marked from frame number.

27
3.3.2. Using DFT
The presence of embolic signal is also evaluated in frequency domain for the
detection of micro emboli from the background noise. Micro emboli possess certain distinct
characteristics when it is viewed in frequency domain. Micro emboli signals have higher
frequency when compared with background signals. Discrete Fourier Transform technique
(DFT) is used for determining the presence of emboli in frequency domain.
The signal to be analyzed is divided into frames having 400 data points as mentioned
before. But in frequency domain overlapping of frames is done to obtain more accuracy.
Here in algorithm 50% overlapping is used according to n norms formulated by international
consensus on micro emboli detection. Discrete Fourier transform of each of the frame is
found out. In the algorithm 512 point DFT is used based on the norms.
DFT values of each frame are then compared using the algorithm. The absolute
values of the magnitudes of frame are found out. The frames which have magnitude greater
than threshold value which is suspected for the presence of emboli is taken into
consideration. Further the corresponding frequency value of those frames which are marked
is found out. The frames which are within the frequency range of micro emboli are isolated.
The frequency range is set based on standards given by international consensus. The signals
which are below this range and above this range are rejected as artifacts.

28
CHAPTER 4: RESULTS AND DISCUSSIONS
4.1. Introduction
This chapter describes the results which are obtained after the project. Also includes
discussions related to the results obtained. The main aim of the project was to determine the
presence of micro emboli from TCD signals and mark the presence of it. As part of the
project the TCD signals is analyzed in time domain and also frequency domain. These results
are also compared with the conventional method by visual observation. The results section
can be broadly divided into results obtained from Time domain analysis and Frequency
domain analysis and then its comparison with conventional technique.
Micro emboli detection has been done in time domain as part of the project. The TCD
signals obtained was analyzed using MATLAB software in time domain. As mentioned in
research methodology the algorithm for detection in time domain is tested using different
input signals. The signals used are 1) input signal with one embolus 2) input signal with 2
emboli 3) input signal with 3 micro emboli 4) input signal without any emboli and 5)signals
with artifact and emboli. These signals are prepared for testing by using visual observation.
Signals are mixed with artifacts for testing the accuracy. In the time domain micro emboli
prediction is based on average energy content of the signal and its duration. In frequency
domain the Discrete Fourier Transform of the input signal is found out and analyzed for
presence of micro emboli.

29
4.2. Time Domain Analysis Results
Input signal is subdivided into various blocks of distinct number of data points as
mentioned in research methodology. The size of the block is determined as per the norms of
international consensus for the identifying the presence of micro emboli. The average RMS
energy value of each block is found out and plotted. The results and graph that are obtained
after testing each input signal is mentioned below.
4.2.1. Input signal with one micro embolus
At first the algorithm was tested using input signal containing presence of one
embolus found out after the visual observation. The RMS value of average energy of each
block of input signal is plotted and those with higher energy value than threshold value is
found out. The following figure shows the plot. We can significantly isolate the presence of
emboli from the graph shown in Figure 4.1. From the graph we can find the peak
corresponding to the emboli. It is marked using the algorithm and the time of its occurrence
inside the signal is found out. The energy of emboli differs from the back ground signals
energy and it appears as a spike, a sudden burst in energy.

30
Figure 4.1: Energy of the signal plotted against time showing one micro embolus peak
The time of occurrence found out using algorithm is given in Table 4.1 below. Along
with it the value obtained by visual observation is mentioned. We can clearly see the
accuracy obtained by using algorithm
Table 4.1: Showing occurrence of one micro embolus in the signal using algorithm and conventional method
Time of occurrence Using Algorithm Visual Analysis
Time in seconds 0.1723 0.17

31
4.2.2. Input signal with two micro emboli
After the initial test algorithm was tested using input signal containing presence of
two micro emboli found out after the visual observation. The RMS value of average energy
of each block of input signal is plotted and those with higher energy value than threshold
value is found out. The following figure 4.2 shows the plot. We can significantly isolate the
presence of two emboli from the graph. From the graph we can find the peak corresponding
to the emboli. It is marked using the algorithm and the time of its occurrence inside the signal
is found out. The energy of emboli differs from the back ground signals energy and it
appears as a spike, a sudden burst in energy.
Figure 4.2: Energy of the signal plotted against time showing peak of two micro emboli
32
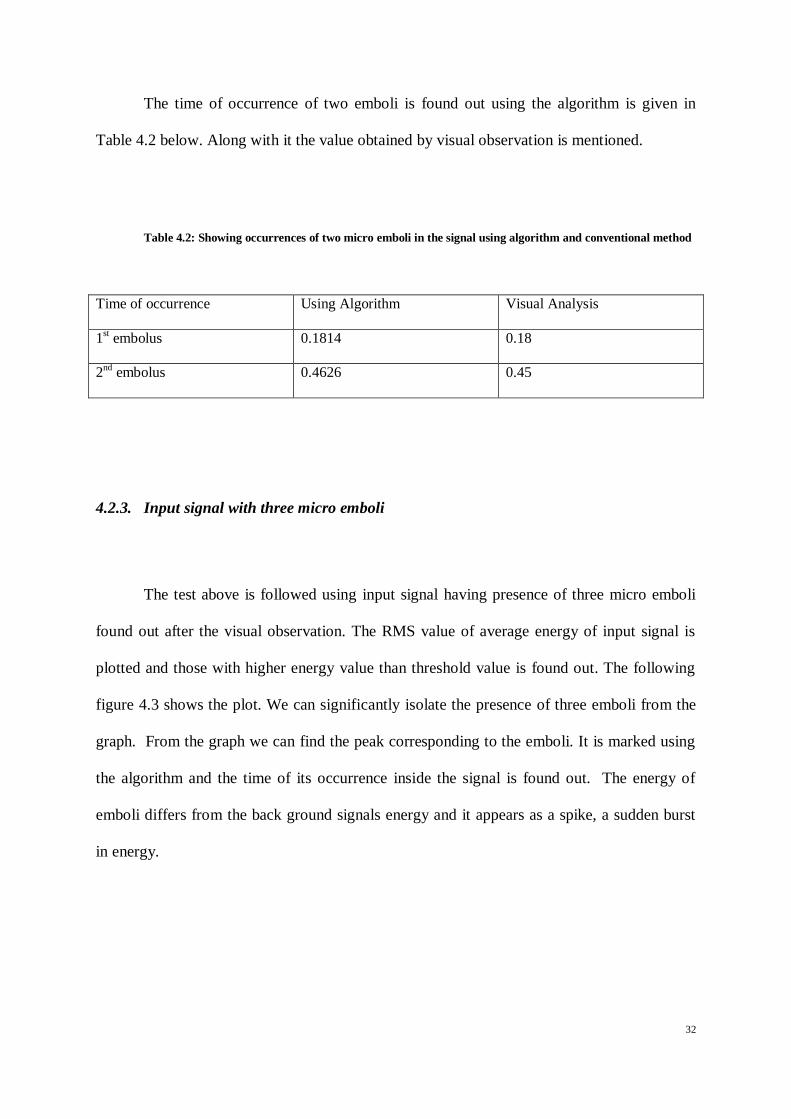
The time of occurrence of two emboli is found out using the algorithm is given in
Table 4.2 below. Along with it the value obtained by visual observation is mentioned.
Table 4.2: Showing occurrences of two micro emboli in the signal using algorithm and conventional method
Time of occurrence Using Algorithm Visual Analysis
1st embolus 0.1814 0.18
2nd
embolus 0.4626 0.45
4.2.3. Input signal with three micro emboli
The test above is followed using input signal having presence of three micro emboli
found out after the visual observation. The RMS value of average energy of input signal is
plotted and those with higher energy value than threshold value is found out. The following
figure 4.3 shows the plot. We can significantly isolate the presence of three emboli from the
graph. From the graph we can find the peak corresponding to the emboli. It is marked using
the algorithm and the time of its occurrence inside the signal is found out. The energy of
emboli differs from the back ground signals energy and it appears as a spike, a sudden burst
in energy.

33
Figure 4.3: Energy of the signal plotted against time showing peak of three micro emboli
The table 4.3 below shows the time of occurrence of three emboli using the algorithm
together with the value obtained by visual observation.
Table 4.3: Showing occurrences of three micro emboli in the signal using algorithm and conventional method
Time of occurrence Using Algorithm Visual Analysis
1st embolus 0.1814 0.18
2nd
embolus 0.4626 0.45
3rd
embolus 0.6893 0.67
34
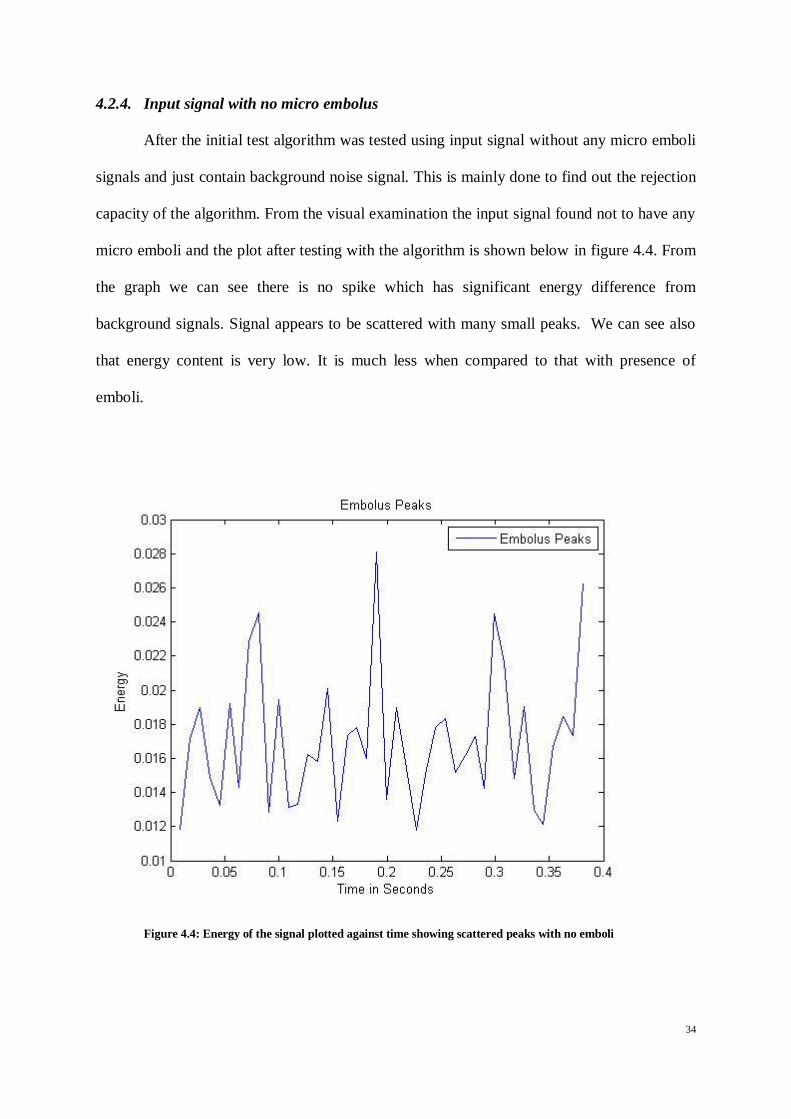
4.2.4. Input signal with no micro embolus
After the initial test algorithm was tested using input signal without any micro emboli
signals and just contain background noise signal. This is mainly done to find out the rejection
capacity of the algorithm. From the visual examination the input signal found not to have any
micro emboli and the plot after testing with the algorithm is shown below in figure 4.4. From
the graph we can see there is no spike which has significant energy difference from
background signals. Signal appears to be scattered with many small peaks. We can see also
that energy content is very low. It is much less when compared to that with presence of
emboli.
Figure 4.4: Energy of the signal plotted against time showing scattered peaks with no emboli

35
4.2.5. Input signal with micro emboli and artifacts
The algorithm is finally tested for its artifact rejection capability. Input signal is
created mixing emboli signals with various noise signals. The RMS value of average energy
of each block of input signal is plotted and those with higher energy value than threshold
value is found out. The following figure 4.5 shows the plot.
Figure 4.5: Energy of the signal plotted against time showing peaks of micro emboli and artifacts
From the figure we can see many peaks which are above the threshold value that
corresponds to noise which mimic the embolic signal. But using the algorithm the noise is
eliminated by using upper threshold value and also checking for the duration of signals
appearing above the threshold value. The table below gives the time of occurrence of micro
emboli signals.

36
Table 4.4: Showing occurrences of emboli in the signal. Time of occurrence given in milliseconds
1st emboli 2
nd emboli 3
rd emboli
0.3719 0.9161 2.0499
4.3. Frequency Domain Analysis Results
The signal is analyzed in frequency domain for detecting the presence of micro
emboli. Input signal is subdivided into various blocks of distinct number of data points as
mentioned in research methodology. The data frames are made with 50% overlapping. The
size of the block is determined as per the norms of international consensus for the identifying
the presence of micro emboli. The 512 points Discrete Fourier Transform is applied for each
frame. The algorithm for detection in frequency domain is tested with different input signals
with and without artifacts to check its accuracy. The results obtained are given below.
4.3.1. Input signal with one micro embolus
At first the algorithm was tested using input signal containing presence of one
embolus found out after the visual observation. The 512 point DFT of each frame of input
signal is obtained. The absolute value of magnitudes of each frame is found out and those
frames which has magnitude value greater than threshold value is isolated. Then these frames
are checked for its frequency and those contain frequency range corresponding to emboli is
found out and plotted. Frequency spectrum is plotted using absolute value of magnitudes of
each frame against frequency. The following figure 4.6 shows the plot. We can significantly
isolate the presence of emboli from the graph. From the graph we can find the peak
corresponding to the emboli and the corresponding frequency is identified. It is marked using
37
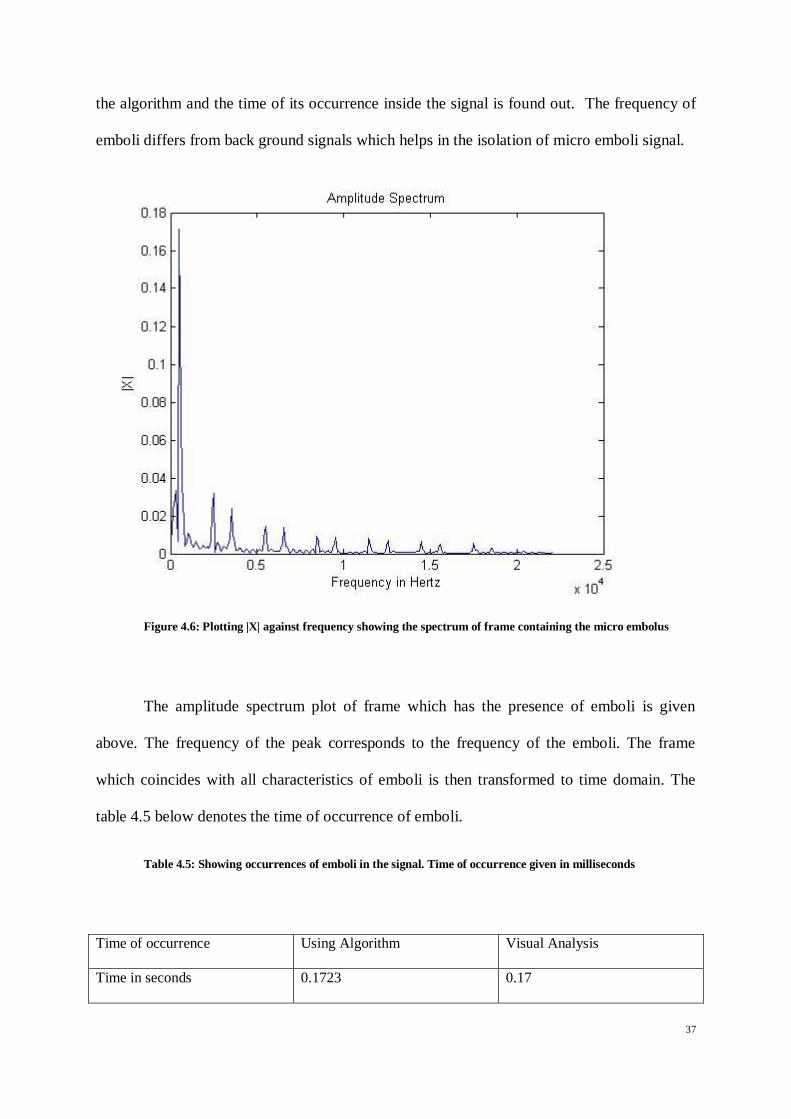
the algorithm and the time of its occurrence inside the signal is found out. The frequency of
emboli differs from back ground signals which helps in the isolation of micro emboli signal.
Figure 4.6: Plotting |X| against frequency showing the spectrum of frame containing the micro embolus
The amplitude spectrum plot of frame which has the presence of emboli is given
above. The frequency of the peak corresponds to the frequency of the emboli. The frame
which coincides with all characteristics of emboli is then transformed to time domain. The
table 4.5 below denotes the time of occurrence of emboli.
Table 4.5: Showing occurrences of emboli in the signal. Time of occurrence given in milliseconds
Time of occurrence Using Algorithm Visual Analysis
Time in seconds 0.1723 0.17

38
4.3.2. Input signal with two micro emboli
After the initial test algorithm was tested using input signal containing presence of
two micro emboli found out after the visual observation. Amplitude spectrum is plotted using
absolute value of magnitudes of each frame against frequency. The following figure 4.7
shows the plot of one of the micro emboli signal from the two frames which is identified for
presence of micro emboli. We can significantly isolate the presence of emboli from the graph.
From the graph we can find the peak corresponding to the emboli and the corresponding
frequency is identified. It is marked using the algorithm the two emboli signals and the time
of its occurrence inside the signal is found out. The frequency of emboli differs from back
ground signals which helps in the isolation of micro emboli signal.
Figure 4.7: Plotting |X| against frequency showing the spectrum of one of the frame from two, containing the micro emboli signal.
39
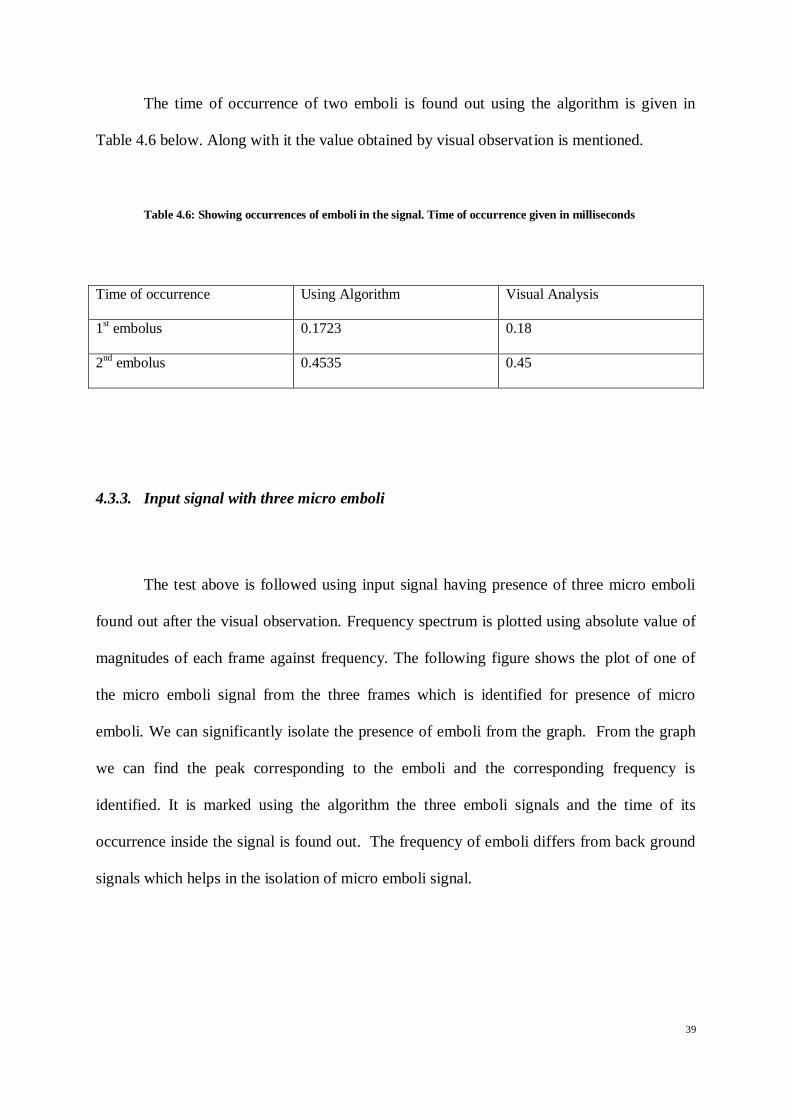
The time of occurrence of two emboli is found out using the algorithm is given in
Table 4.6 below. Along with it the value obtained by visual observation is mentioned.
Table 4.6: Showing occurrences of emboli in the signal. Time of occurrence given in milliseconds
Time of occurrence Using Algorithm Visual Analysis
1st embolus 0.1723 0.18
2nd
embolus 0.4535 0.45
4.3.3. Input signal with three micro emboli
The test above is followed using input signal having presence of three micro emboli
found out after the visual observation. Frequency spectrum is plotted using absolute value of
magnitudes of each frame against frequency. The following figure shows the plot of one of
the micro emboli signal from the three frames which is identified for presence of micro
emboli. We can significantly isolate the presence of emboli from the graph. From the graph
we can find the peak corresponding to the emboli and the corresponding frequency is
identified. It is marked using the algorithm the three emboli signals and the time of its
occurrence inside the signal is found out. The frequency of emboli differs from back ground
signals which helps in the isolation of micro emboli signal.

40
Figure 4.8: Plotting |X| against frequency showing the spectrum of one of the frame from three, containing the micro emboli signal.
The table 4.7 below shows the time of occurrence of three emboli using the algorithm
together with the value obtained by visual observation.
Table 4.7: Showing occurrences of emboli in the signal. Time of occurrence given in milliseconds
Time of occurrence Using Algorithm Visual Analysis
1st embolus 0.1723 0.18
2nd
embolus 0.4535 0.45
3rd
embolus 0.6848 0.67

41
4.3.4. Input signal with no micro embolus
After the initial test algorithm was tested using input signal without any micro emboli
signals and just contain background signal. This is mainly done to find out the rejection
capacity of the algorithm. From the visual examination the input signal found not to have any
micro emboli. The plot for one sample frame is given below in figure 4.9 to differentiate it
with that of one with emboli signal. From the graph we can see the absolute value of
magnitude is significantly less than that of frame with micro emboli signal. The frequency
corresponding to the peak in this signal is also not in micro emboli range. The frequency
value of peak is much less when compared to that with presence of emboli.
Figure 4.9: Plotting |X| against frequency showing the spectrum of sample frame having no embolus

42
4.3.5. Input signal with micro emboli and artifacts
The algorithm is finally tested for its artifact rejection capability. Input signal is
created mixing emboli signals with various noise signals. Frequency spectrum is plotted
using absolute value of magnitudes of each frame against frequency. The figure below shows
the plot of frame which contain noise signal.
Figure 4.10: Plotting |X| against frequency showing the spectrum of one of the frame that contain artifact which mimic emboli
In the figure we can see a spike which is similar to that of emboli signal above
threshold value. But further when we check the frequency content of the peak we can clearly
see that frequency corresponding to the noise signal is significantly lower than that of micro
emboli signal.

43
Table 4.8: Showing occurrences of emboli in the signal with artefact. Time of occurrence given in milliseconds
1st emboli 2
nd emboli 3
rd emboli
0.3764 0.9161 2.0544
4.4. Comparison of results with conventional method
The results obtained after the experiment is compared with conventional method. It
has given about 100 % sensitivity in detection of micro emboli signals. The specificity in
rejecting artifacts and back ground signals is also found to be about 100 %. The summarized
results of experiment is given in table
Table 4.9: Comparison of results of algorithm with results obtained from conventional method
Signal Specification Time Domain Result Frequency Domain
Result
Conventional Method
One emboli 0.1723 0.1723 0.17
Two emboli
0.1814 0.1723 0.18
0.4626 0.4535 0.45
Three emboli
0.1814 0.1723 0.18
0.4626 0.4535 0.45
0.6893 0.6848 0.67
No emboli No embolus No embolus No embolus

44
Emboli with artifact
3 micro emboli found 3 micro emboli found 3 micro emboli found
0.3719 0.3764
0.9161 0.9161
2.0499 2.0544
In the given table the time of occurrence of micro emboli is shown for different
signals using time domain analysis and also frequency domain analysis, which is then
compared with results obtained from conventional method by visual examination. The time
of occurrence is given in milliseconds. We can see that each of two method exhibits
considerable accuracy in finding out the number of occurrences of micro emboli in each
signal. For localization of each micro emboli signal the two methods provide values in
milliseconds until four digits. For the signals mixed with artifacts the method was able to
detect the presence of accurate number of micro emboli by rejecting all artifacts present
which shows its considerable specificity.

45
CHAPTER 5: CONCLUSION AND FUTURE WORKS
5.1. Conclusion
The purpose of the project was to determine the presence of micro emboli from TCD
signals. It also includes finding out the number of occurrences of micro emboli and also
localize it. Input signals are made in such a way to test the overall efficiency of the detection
algorithm. The main aim was given on accuracy and noise rejection. The project also gave an
easier and automatic way of detection.
The presence of micro emboli is detected from TCD signals in time domain and
frequency domain. The results are verified using conventional manual examination method
and accuracy and ease in process of automatic detection method is understood. The method
suggested can reduce the effect of human errors and difficulties in conventional method.
There are some difficulties involved in the project and suggestions for improvement
are mentioned in future works. The main difficulty that involved in the project is finalizing a
suitable threshold value which can eliminate all the noise signals without clipping any
legitimate emboli signals. While doing it in frequency domain using DFT, it is hard to
maintain time and frequency resolution simultaneously. In this project this error is optimized
using overlapping windows and suitable number of DFT points.
5.2. Future Works
There are many future improvements that can be done in the automatic detection of
micro emboli signals. Efficient method for determining the threshold according to input
signals can improve accuracy. Future improvements in resolution of detection can be made
by using wavelet transforms.
46
REFERENCES
Abbott, A., Chambers, B., Stork, J., & al, e. (2005). Embolic signals and prediction of
ipsilateral stroke or transient ischemic attack in asymptomatic carotid stenosis: a multicenter
prospective cohort study. Stroke , 1128-1133.
Aydin, N., & Arslan, T. (2003). Frequency and scale domain analysis of complex
quadrature embolic Doppler ultrasound signals. Proceedings of the 3rd International
Symposium on Image and Signal Processing and Analysis , 888-891.
Aydin, N., Karahoca, A., & Kucur, T. (2007). Data Mining Usage in Emboli
Detection. ECSIS Symposium on Bio-inspired, Learning, and Intelligent Systems for Security
(BLISS 2007) , 159-162.
Aydin, N., Markus, H., & Marvasti, F. (2001). Detection and estimation of embolic
Doppler signals using discrete wavelet transform. 2001 IEEE International Conference on
Acoustics, Speech, and Signal Processing Proceedings , 1049-1052.
Aydin, N., Marvasti, F., & Hugh S, M. (2004). Embolic Doppler ultrasound signal
detection using discrete wavelet transform. IEEE transactions on information technology in
Biomedicine , 182-190.
Azarpazhooh, M. R., & Chambers, B. R. (2006). Clinical application of transcranial
Doppler monitoring for embolic signals. Journal of clinical neuroscience : official journal of
the Neurosurgical Society of Australasia , 799-810.
Biard, M., Girault, J.-M., Kouame, D., & Patat, F. (2004). Emboli characterization in
Blood Mimicking Fluid circulation using parametric modeling. IEEE ultrasonics symposium ,
1449-1452.

47
Bouma, H., Sonnemans, J., Vilanova, A., & Gerritsen, F. (2009). Automatic detection
of pulmonary embolism in CTA images. IEEE transactions on medical imaging , 1223-1230.
Braekken, S., Reinvang, I., Russell, D., & al, e. (1998). Association between
intraoperative cerebral microembolic signals and postoperative neuropsychological deficit:
comparison between patients with cardiac diac valve replacement and patients with coronary
artery bypass grafting. Journal of Neurology, Neurosurgery & Psychiatry , 573-576.
Braekken, S., Russell, D., Brucher, R., & al, e. (1995). Incidence and frequency of
cerebral embolic signals in patients with a similar bileaflet mechanical heart valve. Stroke ,
1225-1230.
Chen, W., Zhang, X., & Wang, Y. (2003). Emboli detection using the Doppler
ultrasound technique. Technical Acoustics , 15-18.
Chung, E. (2006). Transcranial Doppler Embolus Detection: A Primer. Ultrasound ,
202-210.
Deklunder, G., Roussel, M., & Lecroart, J. (1998). Microemboli in cerebral
circulation and alteration of cognitive abilities in patients with mechanical prosthetic heart
valves. Stroke , 1821-1826.
Evans, D. (2004). Limitations of dual frequency measurements for embolus
classification. IEEE Ultrasonics Symposium , 457-460.
Evans, D. H. (2003). Ultrasonic Detection of Cerebral Emboli. IEEE Ultrasonics
Symposium , 316-326.
Fan, L., Boni, E., Tortoli, P., & Evans, D. H. (2004). Development of a Dual-Gate
Automatic Embolus Detection System. Ultrasonics , 2002-2005.

48
Fan, L., Boni, E., Tortoli, P., & Evans, D. H. (2006). Multigate Transcranial Doppler
UltrasoundSystem with Real-Time Embolic Signal Identification and Archival. IEEE
transactions on ultrasonics, ferroelectrics, and frequency control , 1853-1861.
Girault, J. M., Kouamé, D., Ouahabi, A., & Patat, F. (2000). Micro-emboli detection:
an ultrasound Doppler signal processing viewpoint. IEEE transactions on bio-medical
engineering , 1431-1439.
Girault, J. M., Kouamre, D., & Tranquart, F. (2007). Synchronous Detection of
Emboli by wavelet packet decomposition. 409-412.
Girault, J., Biard, M., Kouame, D., Bleuzen, A., & Tranquart, F. (2006). Spectral
Correlation of the embolic blood Doppler signal. IEEE International Conference on
Acoustics Speed and Signal Processing Proceedings , 1200-1203.
Guetbi, C., Kouame, D., Ouahabi, A., & Remenieras, J. P. (1997). New emboli
detection methods . Ultrasonics , 1119-1122.
Gutvik, C. R., & Brubakk, A. O. (2009). A dynamic two-phase model for vascular
bubble formation during decompression of divers. IEEE transactions on bio-medical
engineering , 884-889.
Heyer, E., Adams, D., Solomon, R., & al, e. (1998). Neuropsychometric changes in
patients after carotid endarterectomy. Stroke , 1110- 1115.
Innocent, P. R., John, R. I., Belton, I., & Finlay, D. (2001). Type 2 fuzzy
representations of lung scans to predict pulmonary emboli. Proceedings Joint 9th IFSA World
Congress and 20th NAFIPS International Conference , 1902-1907.

49
Jacobson, J. O., Haugen, D. P., & Hogman, M. N. (n.d.). Ultrasonic Detection of
Bloodstream Emboli. 141-148.
Kouam, D., & Girault, J. M. (1999). Reliability Evaluation of Emboli Detection using
a Statistical Approach. Ultrasonics , 1601-1604.
Krongold, B. S., Sayeed, A. M., Moehring, M. A., Ritcey, J. A., Spencer, M. P., &
Jones, D. L. (1999). Time-scale detection of microemboli in flowing blood with Doppler
ultrasound. IEEE transactions on biomedical engineering , 1081-1089.
Kwok, H. K., & Jones, D. L. (2000). Improved instantaneous frequency estimation
using an adaptive short-time Fourier transform. IEEE Transactions on Signal Processing ,
2964-2972.
Magari, P. J., Kline-Schoder, R. J., Stoedefalke, B. H., & Butler, B. D. (1997). A
Non-Invasive, In-Vivo, Bubble Sizing Instrument. Ultrasonics , 1205-1210.
Markus, H. (1995). Importance of time-window overlap in the detection and analysis
of embolic signals. Stroke , 2044-2047.
Markus, H., & MacKinnon, A. (2005). Asymptomatic embolization detected by
Doppler ultrasound predicts stroke risk in symptomatic carotid artery stenosis. Stroke , 971-
975.
Markus, H., Loh, A., Israel, D., & al, e. (1993). Microscopic air embolism during
cerebral angiography and strategies for its avoidance. Lancet , 784-787.
Moehring, M. A., & Klepper, J. R. (1994). Pulse Doppler ultrasound detection,
characterization and size estimation of emboli in flowing blood. IEEE transactions on bio-
medical engineering , 35-44.
50
Moehring, M. A., & Ritcey, J. A. (1996). Sizing emboli in blood using pulse Doppler
ultrasound-I: Verification of the EBR Model. IEEE transactions on bio-medical engineering ,
572-580.
Moehring, M. A., Merrill P, S., Donald L, D., & Patrick Demljth, R. (1995).
Exploration of the Embolus to Blood Power Ratio Model(EBR) for characterizing
microemboli detected in the middle cerebral artery. IEEE ultrasonics symposium , 1531-
1535.
Moehring, M. A., Ritcey, J. A., & Ishimaru, A. (1996). Sizing emboli in blood using
pulse Doppler ultrasound-II: Effects of beam refraction. IEEE transactions on bio-medical
engineering , 581-588.
Nadareishvili, Z., Choudary, Z., C, C. J., & al, e. (1999). Cerebral microembolism in
acute myocardial infarction. Stroke , 2679-2682.
Nagatsuka, K., Sakaguchi, M., Yoshimoto, H., & Sawada, T. (1996). Analysis of
embolic signals by transcranial Doppler for the characterization of emboli. IEEE , 530-535.
Palanchon, P. M. (2000). Emboli detection and discrimination using harmonics. IEEE
Ultrasonics Symposium , 1497-1500.
Palanchon, P., Benoudjit, N., & Bahaz, M. (2007). P1A-5 Analysis of Backscattered
Signals with a Neural Network Model for Microemboli Classification. Ultrasonics , 1259-
1261.
Palanchon, P., Bouakaz, A., Klein, J., & Jong, N. (2004). A new multifrequency
transducer for microemboli detection and classification. IEEE Ultrasonics Symposium , 490-
492.
51
Palanchon, P., Bouakaz, A., Klein, J., & Jong, N. (2005). Multifrequency transducer
for microemboli classification and sizing. IEEE transactions on bio-medical engineering ,
2087-2092.
Ringelstein, E. B., Droste, D. W., Babikian, V. L., Evans, D. H., Grosset, D. G., Kaps,
M., et al. (1998). International Consensus Group on Microembolus Detection, Consensus on
microembolus detection by TCD. Stroke; a journal of cerebral circulation , 725-729.
Rundek, T., Tullio, M. D., Sciacca, R., & al, e. (1999). Association between large
aortic arch atheromas and high-intensity transient signals in elderly stroke patients. Stroke ,
2683-2686.
Segura, T., Serena, J., Castellanos, M., & al, e. (2001). Embolism in acute middle
cerebral artery stenosis. Neurology , 497-501.
Sitzer, M., Muller, W., Siebler, M., & al, e. (1995). Plaque ulceration and lumen
thrombus are the main sources of cerebral microemboli in high-grade internal carotid artery
stenosis. Stroke , 1231-1233.
Sliwka, U., Lingnau, A., Stohlmann, W., & al, e. (1997). Prevalence and time course
of microembolic signals in patients with acute stroke. A prospective study. Stroke , 358-363.
Srinivasan, J., Newell, D., Sturzenegger, M., & al, e. (1996). Transcranial Doppler in
the evaluation of internal carotid artery dissection. Stroke , 1226-1230.
Stork, J., Kimura, K., Levi, C., & al, e. (2002). Source of microembolic signals in
patients with high-grade carotid stenosis. Stroke , 2014-2018.

52
APPENDIX
A.1. MATLAB code for detection in Time domain
[X,Fs,nBits] = wavread('embnoise.wav'); % calculate energy at each sample to create spectrum r=rem(length(X),400); for y=length(X)+1:length(X)+400-r X(y)=0; end j=1;m=1;energy(m)=0; for k = 1:length(X) energy(m) = X(k).^2+energy(m); j=j+1; if(j==400) energy(m)=sqrt(energy(m)/400); m=m+1; j=1; energy(m)=0; end end
k=1;energyplot(k)=0; for j=1:length(energy) energyplot(j)=(j*400)/44100; end plot(energyplot,energy); title('Embolus Peaks'); xlabel('Time in Seconds'); ylabel('Energy'); legend('Embolus Peaks'); energyR=energy;
sumen=0; if length(energy)>=100 for z=1:100 sumen=sumen+energy(z); end trslow=1.4*(sumen/100); else for z=1:length(energy) sumen=sumen+energy(z); end trslow=1.4*(sumen/length(energy)); end
if trslow>0.1 count=0; for i=1:length(energy) if energy(i)>trslow count=count+1; else count=0; end

53
if count>5 energy(i-5)=0;energy(i-4)=0; energy(i-3)=0;energy(i-2)=0; energy(i-1)=0;energy(i); end end end
trsup=0.3; j=1;embolus(j)=0; for k=1:length(energy) if(energy(k)<trsup)&&(energy(k)>trslow) embolus(j)=k; j=j+1; end end
i=1;j=1;final(j)=0;m=1;last=0; z=0;rr(1)=0; for i=1:length(embolus) if i==length(embolus) if(z>energy(embolus(i))) rr=horzcat(rr,z); else rr=horzcat(rr,embolus(i)); end else if (embolus(i)+1)==embolus(i+1) if(energy(embolus(i))>energy(embolus(i+1))) z=embolus(i); else z=embolus(i+1); end last=embolus(i+1); m=m+1; else last=embolus(i); first=last-m+1; final(j)=first; final(j+1)=last; rr=horzcat(rr,z); j=j+2; m=1; end end end first=last-m+1; final(j)=first; final(j+1)=last; for j=1:length(rr) final(j)=(rr(j)*400)/44100; end j=1;mm(j)=0; for j=1:length(rr) mm(j)=(rr(j)*400)/44100; end

54
A.2. MATLAB code for detection in Frequency domain
[X,Fs,nBits] = wavread('embwithart.wav'); % calculate DFT of each frame to create spectrum r=rem(length(X),400); for y=length(X)+1:length(X)+400-r X(y)=0; end j=1;transform(512,1)=0;temp(512,1)=0; for k = 1:length(X) if(j==400) Y = fft(X((k-399):k),512)/400; transform = horzcat(transform,Y); temp = horzcat(temp,abs(Y)); if k<=length(X)-200 Z = fft(X((k-199):(k+200)),512)/400; transform = horzcat(transform,Z); temp = horzcat(temp,abs(Z)); end j=0; end j=j+1; end f = Fs/2*linspace(0,1,257); rr(1)=0; cc(1)=0; m=0; z(512,1)=0; c_size = size(transform,2); for k = 1:c_size for j = 1:512 if temp(j,k)>0.15 && j==7 rr=horzcat(rr,k); cc=horzcat(cc,j); m=(length(rr)-1)/2; plot(f,abs(transform((1:257),k))); title('Amplitude Spectrum'); xlabel('Frequency in Hertz'); ylabel('|X|'); z= horzcat(z,temp(1:512,k)); end end end z=1;mm(z)=0; for z=2:length(rr) if rem(rr(z),2)==0 mm(z)=(((rr(z)/2)+0.5)*400)/44100; else mm(z)=((rr(z)+1)*200)/44100; end end