design of small hydropower schemes - fenixedumps/mod_hid/teoria/design of small hydropower... ·...
TRANSCRIPT

PORTELA, M. M., 2000, “Chapter 4 - Hydrology” in RAMOS, H. (ed.) Guidelines for the design of small hydropower plants, pp. 21 to 38, CEHIDRO/WREAN/DED, ISBN 972 96346 4 5, Irlanda.

Hydrology
- 21 -
4
HYDROLOGY Maria Manuela Portela 4.1- Introduction. Scope of the studies The main objectives of the hydrologic study of a small hydropower scheme are the characterisation of:
• the runoff at the water intake of the scheme in order to allow the determination of the design discharge, and, thus, the design of the water intake, of the diversion circuit and of the powerhouse, as well as the evaluation of the energy production;
• the floods or, more precisely, the peak floods, to consider in the design either of some of the diversion works, as the weir, or of the powerhouse.
Most of the time it is not easy to carry out the fulfillment of the previous objectives, as there is not the required basic hydrologic data in the watershed of the hydropower scheme. In this chapter some simple methodologies that can be applied to the hydrologic studies of small hydropower schemes when the available hydrologic data is scarce are briefly and systematically presented. The methodologies proposed partially overcome the non-existence of basic hydrologic information and with
Guidelines for design of SMALL HYDROPOWER PLANTS
- 22 -
some minor approximations allow the hydrologic and energetic characterisation of the schemes under consideration. More detailed analysis in the field either of the hydrologic studies or of theirs application to small hydropower schemes, can be find in books of hydrology (LISNLEY and al., 1985, CHOW and al., 1988, MAIDMENT, 1992) and in books specially dealing with the design of small hydropower schemes (ESHA, 1994, and JIANDONG and al., 1997) 4.2- Basic Data Required For The Hydrologic Study The basic hydrologic data required for the evaluation of the energy production in a small hydropower scheme is the mean daily flow series at the scheme water intake in a period that has to be long enough in order to represent, in average, the natural flow regime. By this way, it is reasonable to assume that the errors of the estimates that result from the variability of the natural flows are minimised. However, the small hydropower schemes, being frequently located in the upper zones of the streams, have small drainage areas for which recorded stream flow series are seldom available. For this reason, the inflows at the hydropower scheme are usually evaluated by indirect procedures. Some of these procedures utilise the transposition to the scheme water intake of the flow records in other watershed, namely in the watershed of a stream-gauging station1. For this last scenario, the required basic hydrologic data is next systematised. In the next items, the methodology that allows the evaluation of the energy production based on the previous data is presented. If the natural stream-flow series at the section of scheme water intake is known, some of the procedures presented in the next items become less important or, even, not applicable. It should be pointed out that the decision of installing a stream-gauging station in an ungauged watershed is mainly a long term decision that will only produce usable results after several years of measures and, thereby, it is not a suitable decision for design of any small hydropower scheme. In fact, only after a long period of measures it will be possible to achieve a series of flow records having statistics characteristics that can be considered to represent the variability of the 1 A gauging station where records of the discharges of a stream are obtained, LANGBEIN and ISERI, 1960, p. 19.
Hydrology
- 23 -
natural flow regime. Once the small hydropower scheme is built and started to operate it is advisable to measure the stream-flows in order to confirm the design assumptions. As mentioned, when the inflows to the hydropower scheme are not known, the evaluation of the energy production can be based on the transposition to the scheme water intake section of a mean daily flows series measured in another site, namely in a stream-gauging station having a natural flow regime similar to the one expected in the hydropower scheme. When selecting the previous station one should guarantee that the corresponding watershed and the one of the hydropower scheme have similar areas and are close enough or both located in regions with similar hydrological behaviour, in terms of similar mean annual values of precipitation and of runoff. The hydrological comparison between the drainage areas of the stream-gauging station and of the hydropower scheme can be based on maps of annual average values of precipitation and runoff, which are published in most countries by the appropriate water authorities. The climate and the geological constitution, as well as the vegetal cover and the human occupation and activity in the watersheds of the hydropower scheme and of the steam-gauging station should also be similar. The period with stream-flow records at the station has to be long enough, for saying, at least, twenty years. In this conditions, it is necessary the collect the following data: For the stream-gauging station:
− series of mean daily flows (in m3 s-1) in a period that will be denoted by nGS years;
− in each year with known mean daily flows, the annual precipitation in rain gages located inside and near the watershed of the station.
For the hydropower scheme: − series of annual precipitation in rain gages located inside or near the
watershed of the hydropower scheme. These records have to be collected for a period as long as possible and during which all the rain gages have simultaneous data. This period will be denoted by nHS.
Guidelines for design of SMALL HYDROPOWER PLANTS
- 24 -
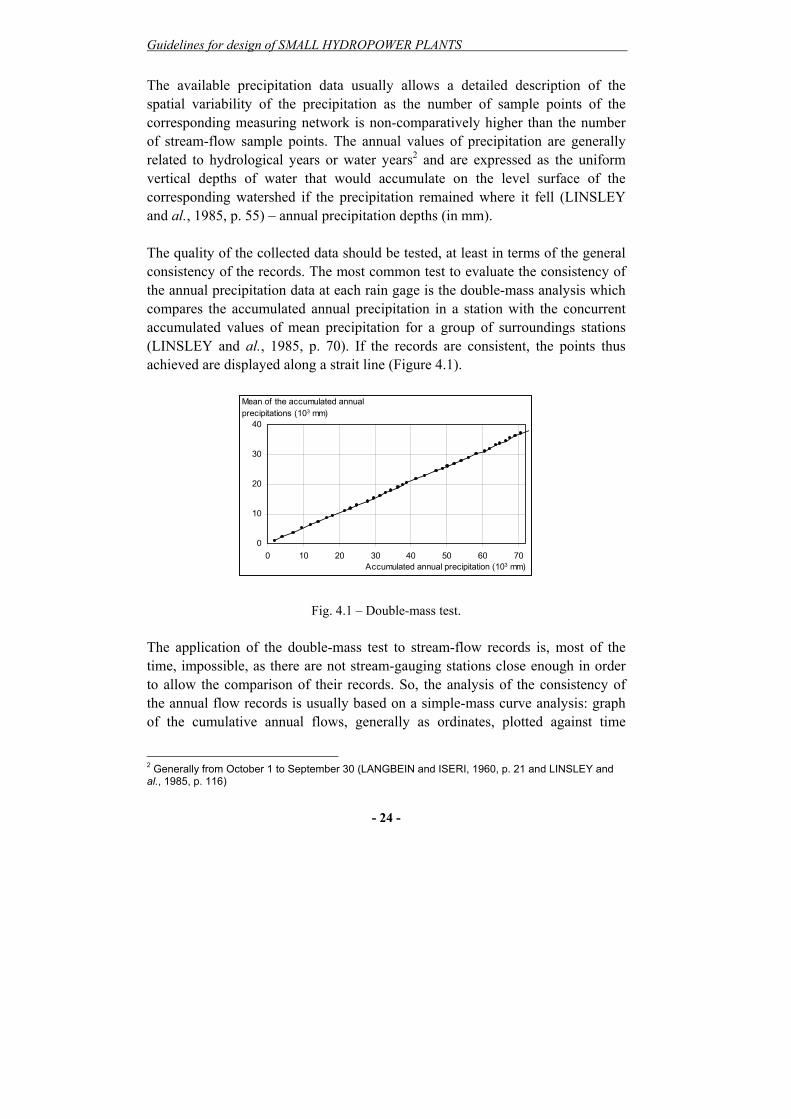
The available precipitation data usually allows a detailed description of the spatial variability of the precipitation as the number of sample points of the corresponding measuring network is non-comparatively higher than the number of stream-flow sample points. The annual values of precipitation are generally related to hydrological years or water years2 and are expressed as the uniform vertical depths of water that would accumulate on the level surface of the corresponding watershed if the precipitation remained where it fell (LINSLEY and al., 1985, p. 55) – annual precipitation depths (in mm). The quality of the collected data should be tested, at least in terms of the general consistency of the records. The most common test to evaluate the consistency of the annual precipitation data at each rain gage is the double-mass analysis which compares the accumulated annual precipitation in a station with the concurrent accumulated values of mean precipitation for a group of surroundings stations (LINSLEY and al., 1985, p. 70). If the records are consistent, the points thus achieved are displayed along a strait line (Figure 4.1).
0
10
20
30
40
0 10 20 30 40 50 60 70
Mean of the accumulated annual precipitations (103 mm)
Accumulated annual precipitation (103 mm)
Fig. 4.1 – Double-mass test.
The application of the double-mass test to stream-flow records is, most of the time, impossible, as there are not stream-gauging stations close enough in order to allow the comparison of their records. So, the analysis of the consistency of the annual flow records is usually based on a simple-mass curve analysis: graph of the cumulative annual flows, generally as ordinates, plotted against time
2 Generally from October 1 to September 30 (LANGBEIN and ISERI, 1960, p. 21 and LINSLEY and al., 1985, p. 116)
Hydrology
- 25 -
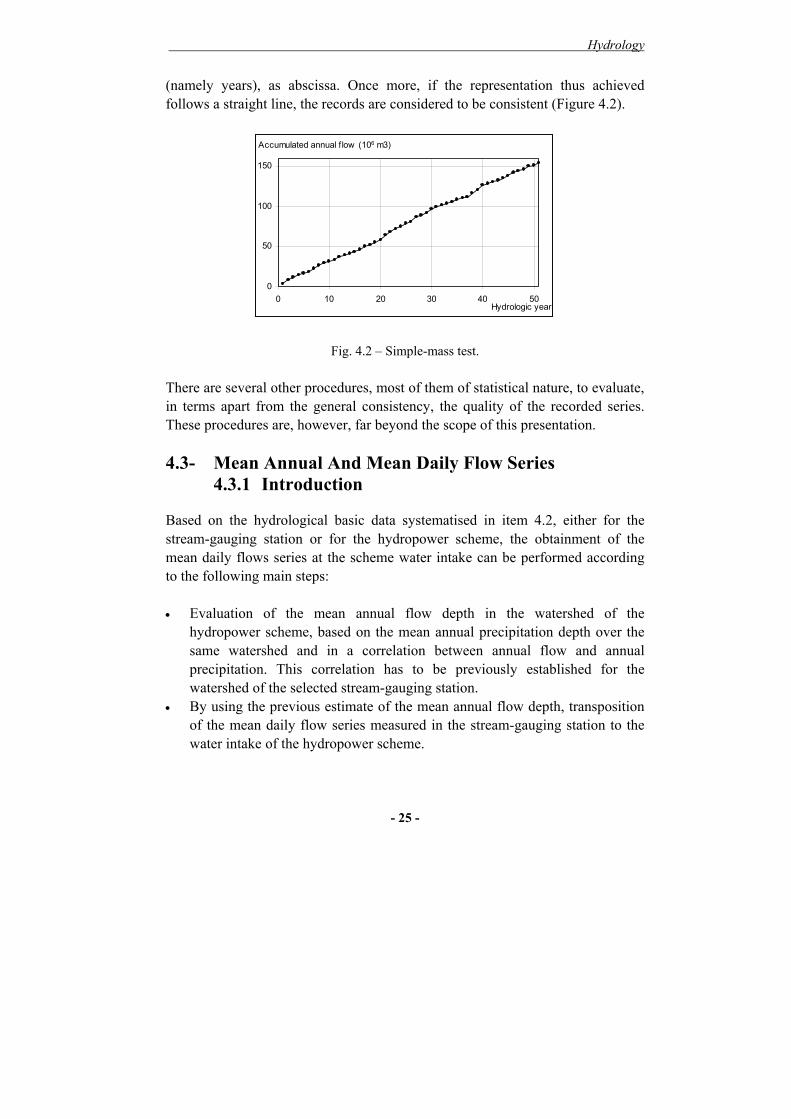
(namely years), as abscissa. Once more, if the representation thus achieved follows a straight line, the records are considered to be consistent (Figure 4.2).
0
50
100
150
0 10 20 30 40 50Hydrologic year
Accumulated annual f low (106 m3)
Fig. 4.2 – Simple-mass test.
There are several other procedures, most of them of statistical nature, to evaluate, in terms apart from the general consistency, the quality of the recorded series. These procedures are, however, far beyond the scope of this presentation. 4.3- Mean Annual And Mean Daily Flow Series
4.3.1 Introduction Based on the hydrological basic data systematised in item 4.2, either for the stream-gauging station or for the hydropower scheme, the obtainment of the mean daily flows series at the scheme water intake can be performed according to the following main steps: • Evaluation of the mean annual flow depth in the watershed of the
hydropower scheme, based on the mean annual precipitation depth over the same watershed and in a correlation between annual flow and annual precipitation. This correlation has to be previously established for the watershed of the selected stream-gauging station.
• By using the previous estimate of the mean annual flow depth, transposition of the mean daily flow series measured in the stream-gauging station to the water intake of the hydropower scheme.

Guidelines for design of SMALL HYDROPOWER PLANTS
- 26 -
4.3.2 Annual precipitation and annual flow. Mean daily flow series
Once the annual records of the rain gages located inside or near the watersheds of the stream-gaging station and of the small hydropower scheme are collected, the annual areal average depths of precipitation over the corresponding areas can be evaluated. For this purpose the Thiessen method can be applied (LINSLEY and al., 1985, p. 71, SMITH, 1992, p. 3.20). In this method the stations are plotted on a map, and connecting lines are drawn. Perpendicular bisectors of these connecting lines form polygons around each station. The sides of each polygon are the boundaries of the effective area assumed for the station. Over this area the precipitation is considered to be constant and equal to the one measured in the station. The area of each polygon within the basin boundary is determined by planimetry and is expressed as a percentage of the total area – Figure 4.3.
Fig. 4.3 – Areal averaging of precipitation by the Thiessen method. (From CHOW et al., 1988, p. 79).
Weighted average rainfall for the total area is computed by multiplying the precipitation at each station by its assigned percentage of area and totaling. Besides the Thiessen method, others methods, as the ishoyetal one, can be applied to evaluated the precipitation over each watershed. The presentation of
Hydrology
- 27 -
these methods and the discussion of their comparative advantages can be found in LINSLEY and al., 1985, p. 71, CHOW et al., 1988, p. 78-80, and SHAW, 1984, 209-216. If the digital elevation models of the watersheds are available, the previous work can be significantly simplified taking advantages of a GIS capabilities, where others area averaging methods, besides the Thiessen method, are implemented and easily manipulated. Once the series of annual precipitation depth over each watershed is known, the corresponding mean annual value is obtained: GSP (mm), for the stream-gaging station, and HPP (mm), for the hydropower scheme
GS
iGS
GS nPP = and
HP
iHP
HP nPP = (4.1)
where Pi (mm) denotes the precipitation depth in year i over the watershed identified by the sub index. According to the methodology presented herein, the evaluation of the mean annual flow depth in the watershed of the hydropower scheme requires the establishment of a relation between annual precipitation and annual flow for the watershed of the stream-gauging station. Let PGS
i (mm) denote the precipitation depth over the watershed of the stream-gauging station in year i (i=1, …, n) and HGS
i (mm) the corresponding annual flow depth obtained from the records of mean daily flows according to
4,86A
qH
GS
365
1k
ikGS
iGS ×
∑= = (4.2)
where AGS (km2) is the watershed area and i
kGSq (m3 s-1), the mean daily flow that was measured during day k of the year i. If the plotting of the annual precipitation, PGS
i, versus annual runoff, HGSi, for a
common period of n years (i = 1, …, n, n being as great as possible) display a
Guidelines for design of SMALL HYDROPOWER PLANTS
- 28 -
good correlation between those two variables it will be acceptable to establish a relation expressing, by means of statistics, the observed dependency (Figure 4.4).
Fig. 4.4 – Relation between annual precipitation and runoff . (From LINSLEY et al.,1985 , p. 255).
If a linear relation is assumed (which provides the simplest relation between annual precipitation and annual runoff) the following expression can be obtained by means of a regression analysis:
H = α P - β (4.3)
where α and β are positive parameters that can be estimate from the sample of annual values of precipitation and flow by the least square method (DRAPPER and SMITH, 1981). The parameter α should be less than one. The sub indexes of H (annual flow depth) and P (annual precipitation depth) have been omitted as (4.3) can be applied to a watershed different from the one to which the relation was established (although both watersheds should have the similarities previous pointed out). Other types of relation between P and H can be assumed, for instances a parabolic relation
H = α P2 - β (4.4)
where α and β should also be positive.
Hydrology
- 29 -
The choice of the most suitable relation between annual values of precipitation and flow should result from the graphical analysis of the behavior of those to variables (Figure 4.4) and from the hydrologic specific knowledge of the region where the small hydropower scheme is going to be built. Applying (4.3) or (4.4), or an equivalent expression, to the mean annual precipitation depth over the watershed of the hydropower scheme, HPP (mm), the corresponding mean annual flow depth, HPH (mm), is obtained. The mean annual flow depth over the watershed of the stream-gaging station,
GSH (mm), can be evaluated from the series either of the mean daily flows, ikGSq
(m3 s-1), or of the values of iGSH (mm) given by (4.2)
GS
n
1i
iGS
GSGS
n
1i
365
1k
ikGS
GS n
H
nA
q4,86H
GSGS
∑=
×
∑
∑×
= == = (4.5)
Let GS∀ (hm3) and HP∀ (hm3) denote the mean annual flow volumes at the stream-gaging station and at the water intake of the hydropower scheme, respectively
1000AH GSGS
GS×
=∀ (4.6)
1000AH HPHP
HP×
=∀ (4.7)
The transposition to the water intake of the hydropower scheme of the mean daily flow series measured at the stream-gaging station can be finally accomplished by applying the following relation:
GS
HPikGS
ikHP qq
∀∀
= (4.8)
where ikHPq (m3 s-1) is the estimate, for the water intake of the hydropower
scheme, of the mean daily flow during day k of year i.
Guidelines for design of SMALL HYDROPOWER PLANTS
- 30 -
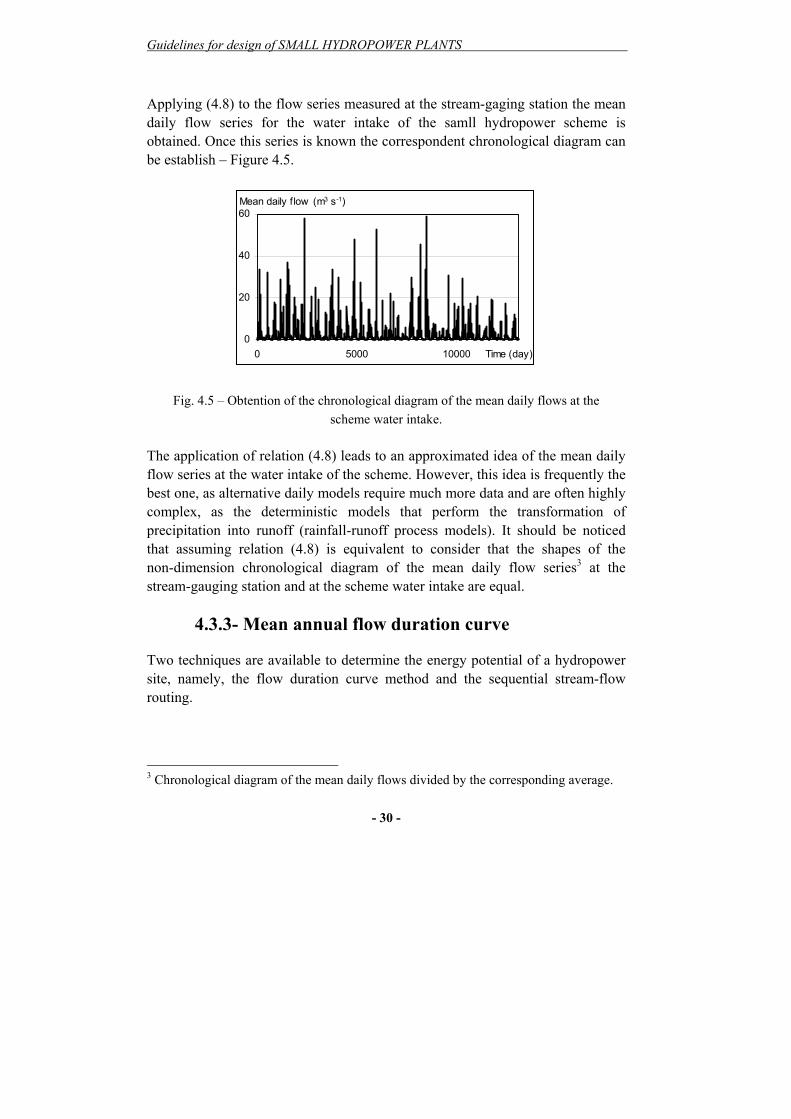
Applying (4.8) to the flow series measured at the stream-gaging station the mean daily flow series for the water intake of the samll hydropower scheme is obtained. Once this series is known the correspondent chronological diagram can be establish – Figure 4.5.
0
20
40
60
0 5000 10000 Time (day)
Mean daily f low (m3 s-1)
Fig. 4.5 – Obtention of the chronological diagram of the mean daily flows at the scheme water intake.
The application of relation (4.8) leads to an approximated idea of the mean daily flow series at the water intake of the scheme. However, this idea is frequently the best one, as alternative daily models require much more data and are often highly complex, as the deterministic models that perform the transformation of precipitation into runoff (rainfall-runoff process models). It should be noticed that assuming relation (4.8) is equivalent to consider that the shapes of the non-dimension chronological diagram of the mean daily flow series3 at the stream-gauging station and at the scheme water intake are equal.
4.3.3- Mean annual flow duration curve Two techniques are available to determine the energy potential of a hydropower site, namely, the flow duration curve method and the sequential stream-flow routing.
3 Chronological diagram of the mean daily flows divided by the corresponding average.
Hydrology
- 31 -
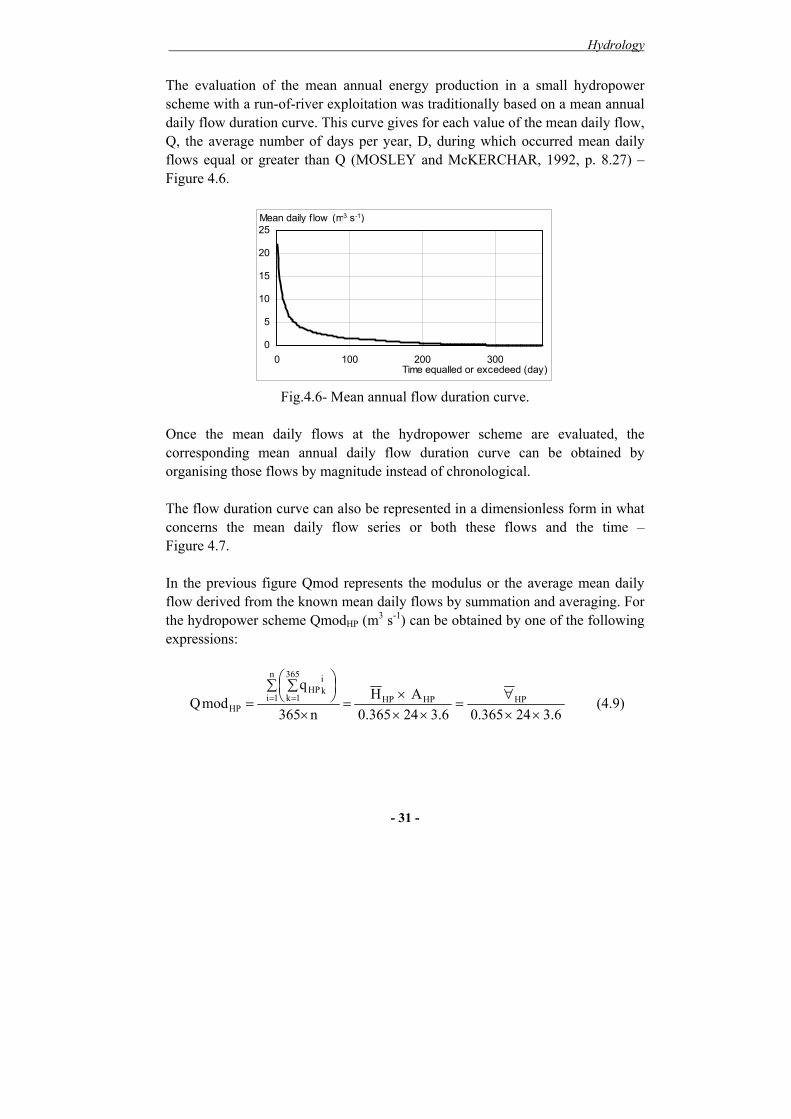
The evaluation of the mean annual energy production in a small hydropower scheme with a run-of-river exploitation was traditionally based on a mean annual daily flow duration curve. This curve gives for each value of the mean daily flow, Q, the average number of days per year, D, during which occurred mean daily flows equal or greater than Q (MOSLEY and McKERCHAR, 1992, p. 8.27) – Figure 4.6.
0
5
10
15
20
25
0 100 200 300Time equalled or excedeed (day)
Mean daily f low (m3 s-1)
Fig.4.6- Mean annual flow duration curve.
Once the mean daily flows at the hydropower scheme are evaluated, the corresponding mean annual daily flow duration curve can be obtained by organising those flows by magnitude instead of chronological. The flow duration curve can also be represented in a dimensionless form in what concerns the mean daily flow series or both these flows and the time – Figure 4.7. In the previous figure Qmod represents the modulus or the average mean daily flow derived from the known mean daily flows by summation and averaging. For the hydropower scheme QmodHP (m3 s-1) can be obtained by one of the following expressions:
6.324365.06.324365.0
AHn365
qmodQ HPHPHP
n
1i
365
1k
ikHP
HP ××∀
=××
×=
×
∑
∑
= = = (4.9)

Guidelines for design of SMALL HYDROPOWER PLANTS
- 32 -
where HPH (mm) is evaluated by applying (4.3) or (4.4) or an equivalent relation,
HP∀ (hm3) is given by (4.7) and the meaning and units of the other variables have already been presented.
0
5
10
15
0 100 200 300Time equalled or exceeded (day)
Q/Qmod (-)
0
5
10
15
0 25 50 75 100Time equalled or exceeded (%)
Q/Qmod (-)
Figure 4.7 – Dimensionless forms of the mean annual flow duration curve.
Taking into account the procedures that led to the mean daily flow series at the hydropower scheme water intake, i
kHPq (m3 s-1), it is easy to conclude that the dimensionless forms of the mean annual daily flow duration curves thus reached for the scheme and the one relative to the stream-gaging are equal. Once a dimensionless mean annual daily flow duration curve is put in a dimension form by multiplying its ordinates by a modulus, Qmod, the curve thus obtained will become exclusively representative of the watershed to which that modulus is referred. The obtainment of a mean annual daily flow duration curve at an ungauged site was traditionally based on the adoption of a standardised regional nom-dimension duration curve. The curve selected was next synthesised by

Hydrology
- 33 -
multiplying its ordinates by the hydropower scheme modulus, Qmod, in order to provide its particular flow duration curve with numerical discharges. However, the previous traditional methodology only leads to reasonable results with respect to the energy evaluation when no storage capacity is available in the hydropower scheme, that is to say, when the scheme has a pure run-of-river exploitation. At the same time and even for a run-of-river scheme, this methodology only gives the estimate of the mean annual energy production and it does not allow any simulation study in order to analyse the variability of the energy production due to the natural variability of the flows. Regional standardized flow duration curves are generally available in all European countries. The criteria that lead to the establishment of those curves depend, however, on each specific country. When selecting a standardized curve care should be taken in order to ensure that the watershed of the hydropower scheme and the one inherent to the regional curve are reasonable similar (in terms of hydrological behaviour, climate, area, occupation and geological constitution). The procedures proposed in this chapter, namely those that result from relation (4.8) are also regional transposition methodologies. The main advantages of these procedures comparatively to the traditional ones based on the adoption of a regional standardised mean annual flow duration curve can be systematised by:
• In what concerns the factors that determine the similarity of the flow regime at the stream-gaging station and at hydropower scheme, the methodologies presented herein allow a more rigorous selection of the daily data to be transposed.
• They provide not only a mean annual flow duration curve but also a mean daily flow series allowing the evaluation of the energy production either in a pure run-of-river scheme or in a scheme having some storage capacity, in this last case, by means of simulations algorithms.
• In a general sense, whenever mean daily flows exist it is possible to perform any simulation study. By this way, either the design of the small hydropower scheme, or the comparison of different solutions for the same become much easier.
Guidelines for design of SMALL HYDROPOWER PLANTS
- 34 -
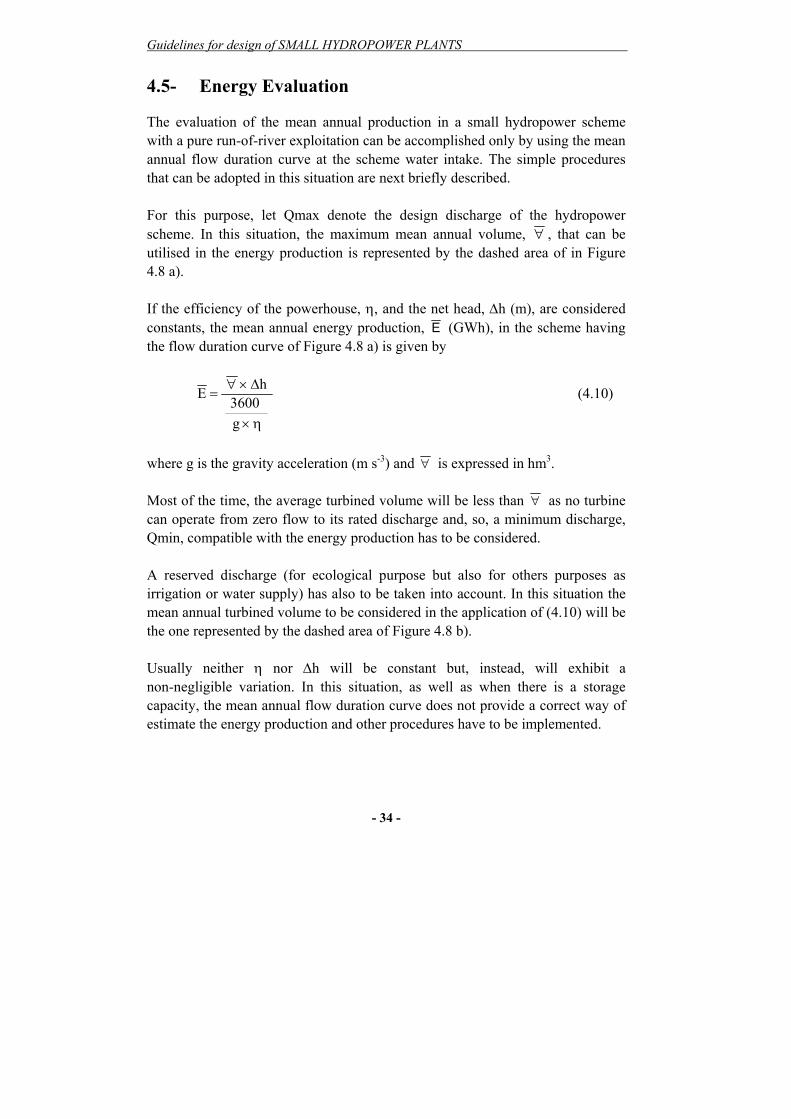
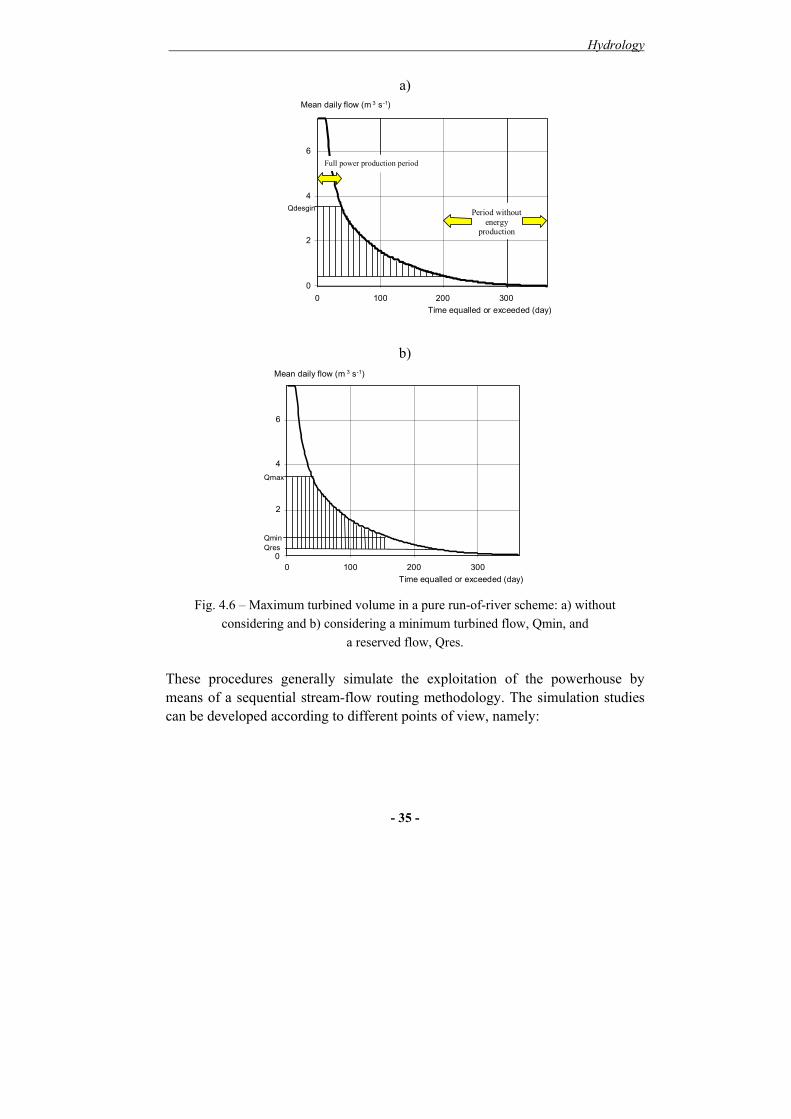
4.5- Energy Evaluation The evaluation of the mean annual production in a small hydropower scheme with a pure run-of-river exploitation can be accomplished only by using the mean annual flow duration curve at the scheme water intake. The simple procedures that can be adopted in this situation are next briefly described. For this purpose, let Qmax denote the design discharge of the hydropower scheme. In this situation, the maximum mean annual volume, ∀ , that can be utilised in the energy production is represented by the dashed area of in Figure 4.8 a). If the efficiency of the powerhouse, η, and the net head, ∆h (m), are considered constants, the mean annual energy production, E (GWh), in the scheme having the flow duration curve of Figure 4.8 a) is given by
η×
∆×∀=
g3600
hE (4.10)
where g is the gravity acceleration (m s-3) and ∀ is expressed in hm3. Most of the time, the average turbined volume will be less than ∀ as no turbine can operate from zero flow to its rated discharge and, so, a minimum discharge, Qmin, compatible with the energy production has to be considered. A reserved discharge (for ecological purpose but also for others purposes as irrigation or water supply) has also to be taken into account. In this situation the mean annual turbined volume to be considered in the application of (4.10) will be the one represented by the dashed area of Figure 4.8 b). Usually neither η nor ∆h will be constant but, instead, will exhibit a non-negligible variation. In this situation, as well as when there is a storage capacity, the mean annual flow duration curve does not provide a correct way of estimate the energy production and other procedures have to be implemented.
Hydrology
- 35 -
a)
0
2
4
6
0 100 200 300Time equalled or exceeded (day)
Mean daily flow (m 3 s-1)
Qdesgin
Full power production period
Period withoutenergy
production
b)
0
2
4
6
0 100 200 300Time equalled or exceeded (day)
Mean daily flow (m 3 s-1)
QminQres
Qmax
Fig. 4.6 – Maximum turbined volume in a pure run-of-river scheme: a) without
considering and b) considering a minimum turbined flow, Qmin, and a reserved flow, Qres.
These procedures generally simulate the exploitation of the powerhouse by means of a sequential stream-flow routing methodology. The simulation studies can be developed according to different points of view, namely:

Guidelines for design of SMALL HYDROPOWER PLANTS
- 36 -
• by adopting the mean daily flow series previously established for the scheme, that is to say, assuming that the future flows will be equal to the flows that occurred in the pass;
• by adopting a synthetic mean daily flow series obtained from the series previously establish for the scheme water intake by a model, generally a stochastic model (for instances, a disagregation model).
As this last option involves models far beyond the scope of this work, only the first option will be considered.
The simulation studies have to be performed by means of a computational program. The main data generally required for this program is the following one:
mean daily flow series at the water intake of the scheme; design discharge, Qmax (m3 s-1), and minimum discharge, Qmin (m3 s-
1), compatible with the operation of the powerhouse; ecological discharge and any other discharge required for the
consumption between the sections of the weir and the outlet if the powerhouse (reserved flow, Qres, in m3 s-1).
head losses in the diversion circuit as a function of the diverted flow; rating curve at outlet section of the powerhouse; efficiency curve of the equipment of the powerhouse.
If the weir of the scheme creates a lagoon providing a storage capacity and if the operation of the schemes foresees the use of this capacity in order to improved the conditions of the energy production, the following additional data is also required:
• the reservoir stage-capacity curve4; • the exploitation rules, that is to say, the rules that translate the way the
stored volume of water is going to be exploited, for instances, in order to concentrate the energy production during the periods where the sale tariffs are higher (or when the energy demands are higher).
4 A graph showing the relation between the surface elevation of the water in the reservoir, usually plotted as ordinates, against the volume of water stored below that elevation, plotted as abscissa.
Hydrology
- 37 -
The simulation algorithm is almost exclusively based on the application of the continuity equation: in each time step, ∆t (s), the volume utilised in the energy production, ∀∆ (hm3), is the one that results from the “net” inflow − inflow to the water intake, I (m3 s-1), minus the discharge over the spillway, O (m3 s-1), minus the reserved flow, Qres, (m3 s-1) − and from the variation of the volume of water stored in the reservoir, ∆S (hm3). ∀∆ = (I-Q-Qres) ∆t + ∆S (4.11) The variation of volume ∆S is also a consequence of the exploitation rules which, generally, results into the two following different actions:
• priority to the energy production. • priority to the storage.
The former of the previous rules is generally applicable to the peak hour period and the latter, to the low hour period. When the priority to the energy production prevails, the turbined flow should be as big as possible. For this purpose, the inflow to the scheme water intake is increased (if possible, until the limit of the design flow, Qmax), by emptying totally or partially the reservoir. If the priority to the storage prevails, as much water as possible should be stored. In this situation the powerhouse will work only if discharges over the spillway are foreseen. In each time step the computation of the energy production, ∆E (GWh), is accomplished by an expression equivalent to (4.10) but where ∀ is replaced by the volume turbined during the time step, ∀∆ (hm3). The variables ∆h and η are obtained from the database of the program for the specific conditions under which the production occurred during each time step. If the hydropower scheme has no storage capacity the term ∆S of equation (4.11) disappears and the energy production during each time step reflects only the particular conditions that occurred during the time interval (net inflow, net head and efficiency of the equipment).

Guidelines for design of SMALL HYDROPOWER PLANTS
- 38 -
NOTATION AGS area (km2) of the watershed of the stream-gauging station. AHP area (km2) of the watershed of the hydropower scheme. D average number of days per year during which mean daily flows are
equal or greater than a given flow, Q. E mean annual energy production (GWh). g gravity acceleration (m s-3). H annual flow depth (mm). HGS
i annual flow depth (mm) over the watershed of the stream-gauging station in year i.
HHPi annual flow depth (mm) over the watershed of the hydropower scheme
in year i. I inflow (m3 s-1) to the scheme water intake. n period with simultaneous annual records of precipitation depths and of
flows depths over the watershed of the stream-gauging station. nGS period (years) with records either of mean daily flows at the
stream-gauging station or of annual precipitation depths in rain gages located inside or near the station watershed.
nHS period (years) with records of annual precipitation depths in rain gages located inside or near the hydropower scheme watershed.
O discharge (m3 s-1)over the spillway. P annual precipitation depth (mm).
GSP mean annual precipitation depth (mm) in the watershed of the stream-gauging station.
HPP mean annual precipitation depth (mm) in the watershed of the hydropower scheme.
PGSi precipitation depth (mm) over the watershed of the stream-gauging
station in year i. PHP
i precipitation depth (mm) over the watershed of the hydropower scheme in year i.
ikGSq mean daily flow (m3 s-1) measured in the stream-gauging station during
day k of the year i. ikHPq estimate, for the water intake of the hydropower scheme, of the mean
daily flow (m3 s-1) during day k of year i. Q mean daily flow (m3 s-1).
Hydrology
- 39 -
Qmax design discharge (m3 s-1) of the hydropower scheme Qmin minimum discharge compatible with the turbines operation. Qmod modulus or average of the mean daily flows (m3 s-1). QmodHP modulus (m3 s-1) for the water intake of the hydropower scheme. Qres reserved discharge. ∆E energy production (GWh) during a time step of the simulation program. ∆h constant net head (m). ∆t time step (s) of the simulation program. ∆S variation of the volume of water (hm3) stored in the reservoir during a
time step of the simulation program. ∀∆ volume turbined (hm3) during a time step of the simulation program.
η constant efficiency (-) of the powerhouse. ∀ maximum mean annual volume (hm3) that can be utilised in the energy
production. GS∀ mean annual flow volumes (hm3) at the stream-gaging station.
HP∀ mean annual flow volumes (hm3) at the water intake of the hydropower scheme.
DRAPER, N. R. and SMITH, H. (1981), Applied regression analysis, John
Willey and sons. Inc., USA. SMITH, J. A. (1992), "Precipitation", in Handbook of hydrology. Ed. David
Maidment, McGraw-Hill, Inc., USA, p. 3.1-3.47. ESHA (1994), Layman's guidebook on how to develop a smll hydro site. Part I
and Part II, Directorate General for Energy (DG XVII), European Small Hydropower Association, Brussels.
MOSLEY, M. P. and McKERCHAR, A. I. (1992), "Streamflow", in Handbook of hydrology. Ed. David Maidment, McGraw-Hill, Inc., USA, p. 8.1-8.39.

Guidelines for design of SMALL HYDROPOWER PLANTS
- 40 -