theme 5: small-scale hydropowerd284f45nftegze.cloudfront.net/hideakioh/t57_small hydro.pdf · theme...
TRANSCRIPT

Theme 5:
Small-scale Hydropower
By: Dr Khamphone Nanthavong Faculty of Engineering, National University of Laos

•Fundamentals of Hydropower
•Why Small-scale Hydropower?
•Small-scale hydropower Potential
assessment
Hydrological Analysis
Site survey
E2M Introduction to RE 3
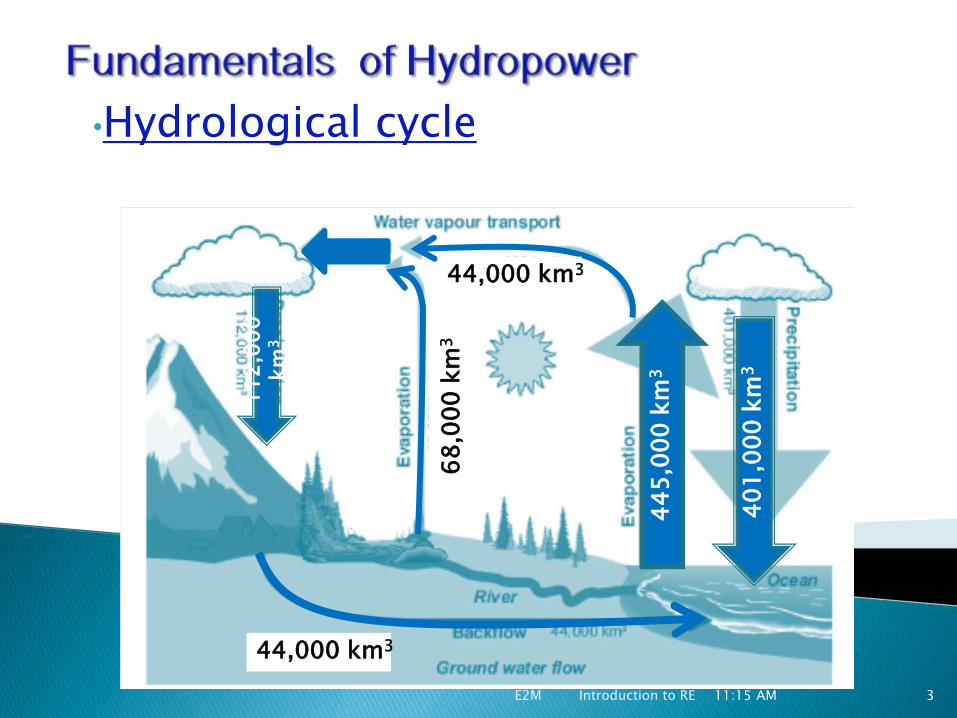
•Hydrological cycle
11:15 AM
44
5,0
00
km
3
40
1,0
00
km
3
44,000 km3
68
,00
0 k
m3
11
2,0
00
km
3
44,000 km3
E2M Introduction to RE 4
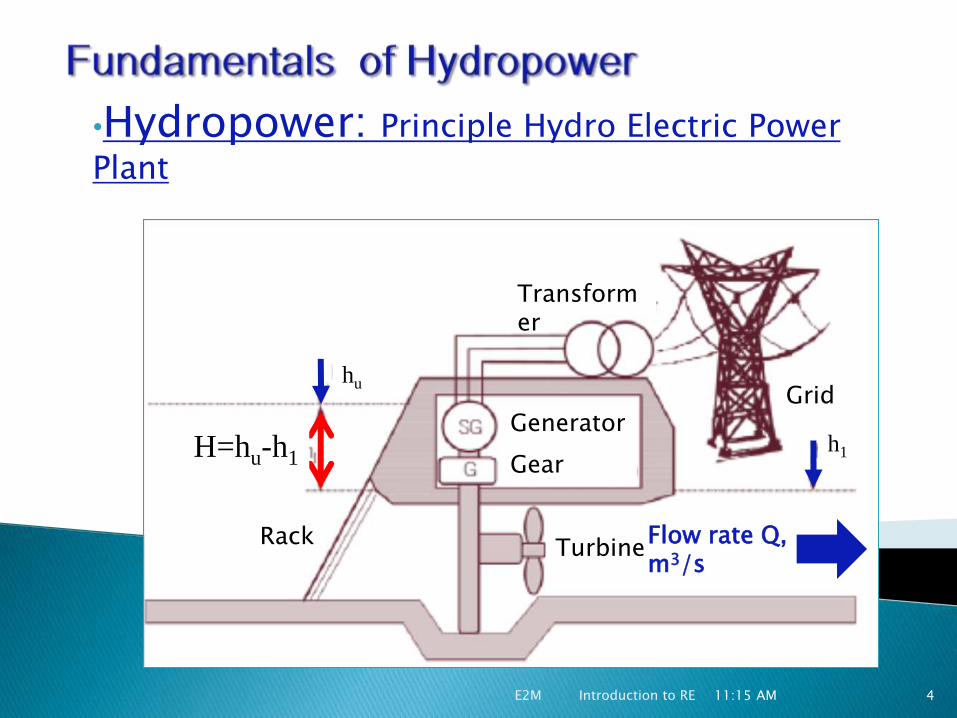
•Hydropower: Principle Hydro Electric Power
Plant
11:15 AM
H=hu-h1
hu
h1
Flow rate Q, m3/s
Turbine
Generator
Gear
Transformer
Grid
Rack
E2M Introduction to RE 5
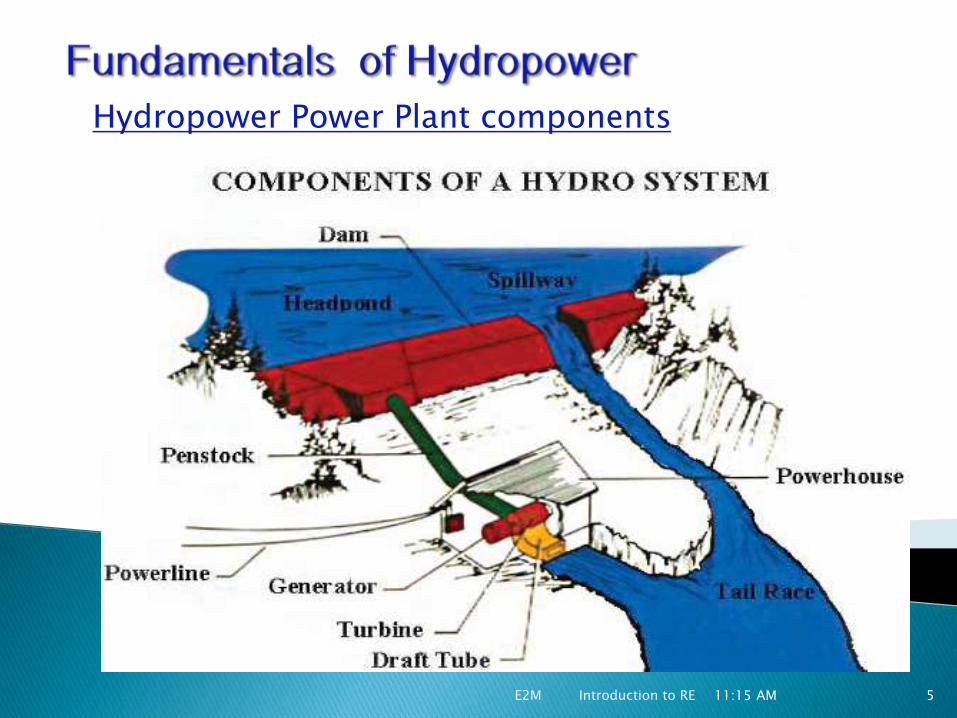
Hydropower Power Plant components
11:15 AM
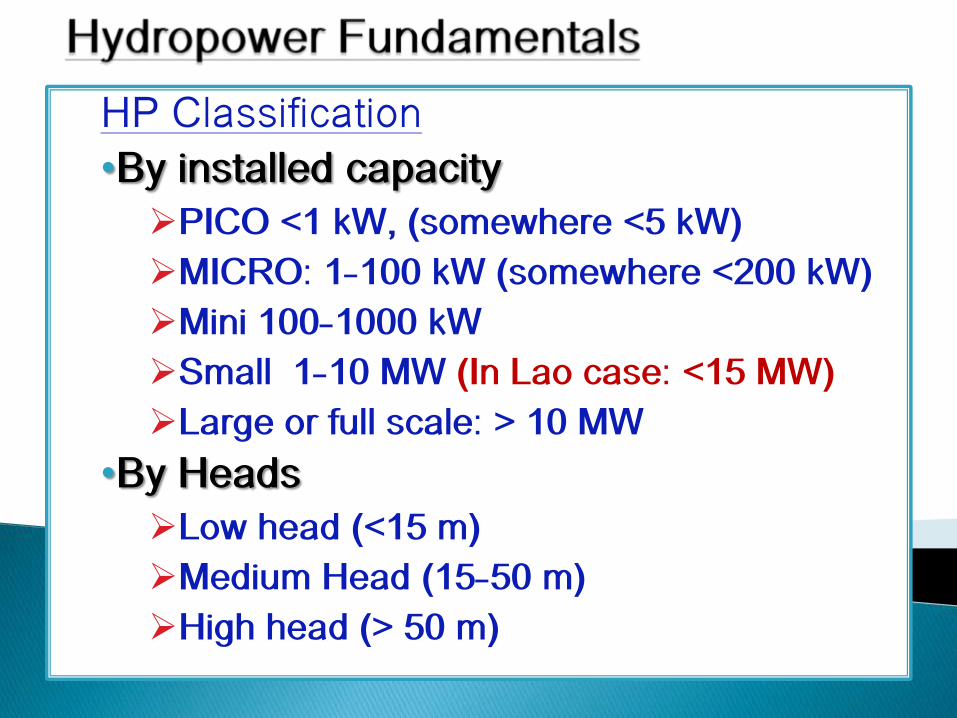
HP Classification
•By installed capacity
PICO <1 kW, (somewhere <5 kW)
MICRO: 1-100 kW (somewhere <200 kW)
Mini 100-1000 kW
Small 1-10 MW (In Lao case: <15 MW)
Large or full scale: > 10 MW
•By Heads
Low head (<15 m)
Medium Head (15-50 m)
High head (> 50 m)
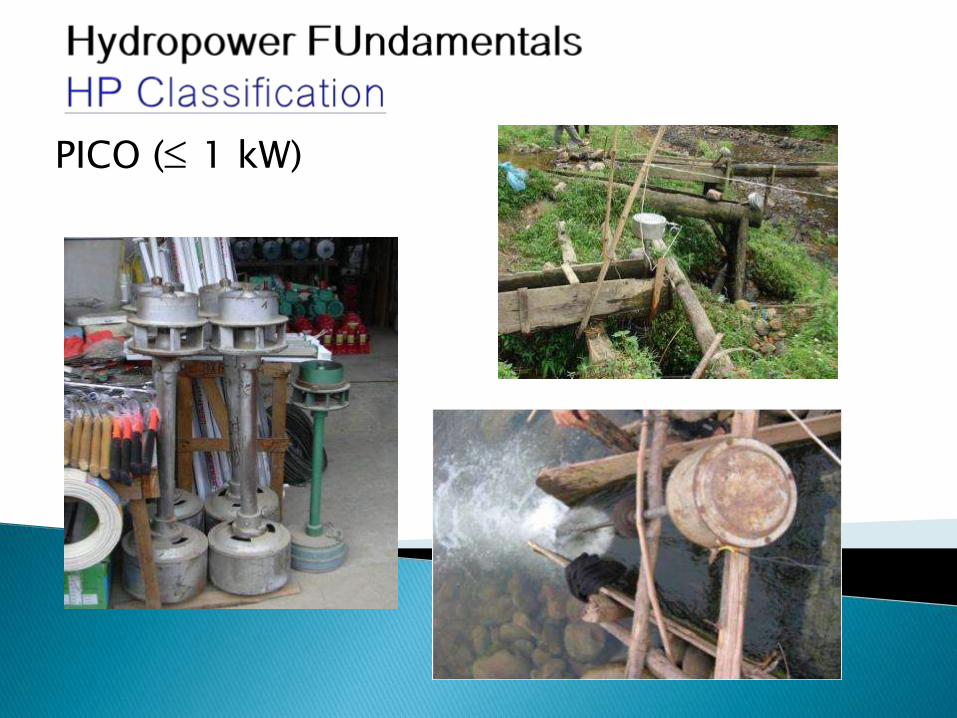
PICO ( 1 kW)
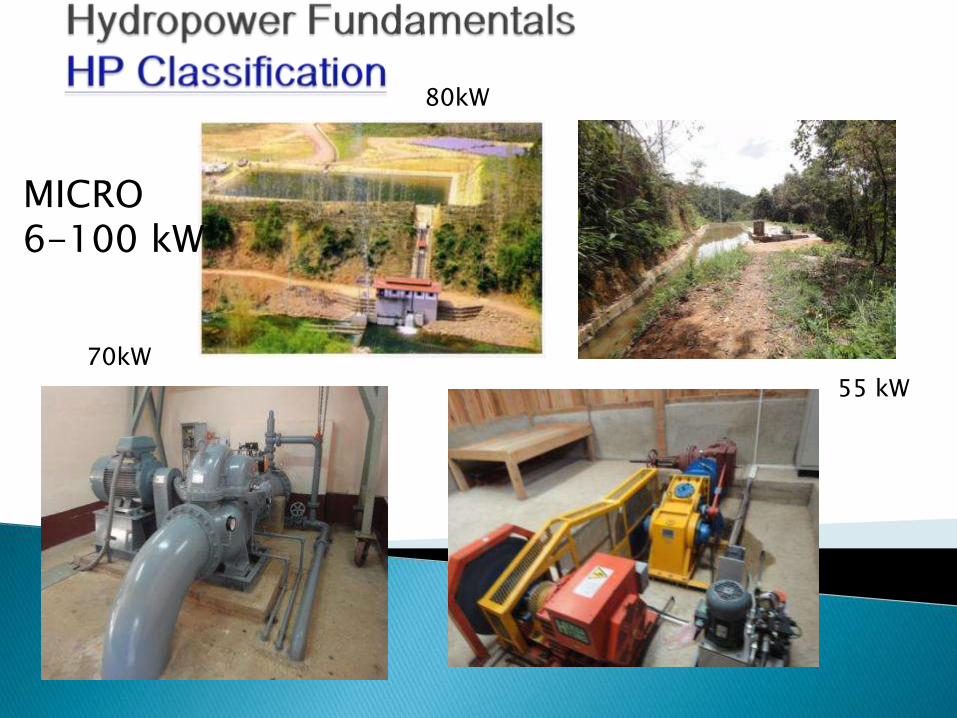
MICRO 6-100 kW
80kW
55 kW
70kW

MINI (101-1000 kW)
500 kW

Small (< 15MW)
2 MW
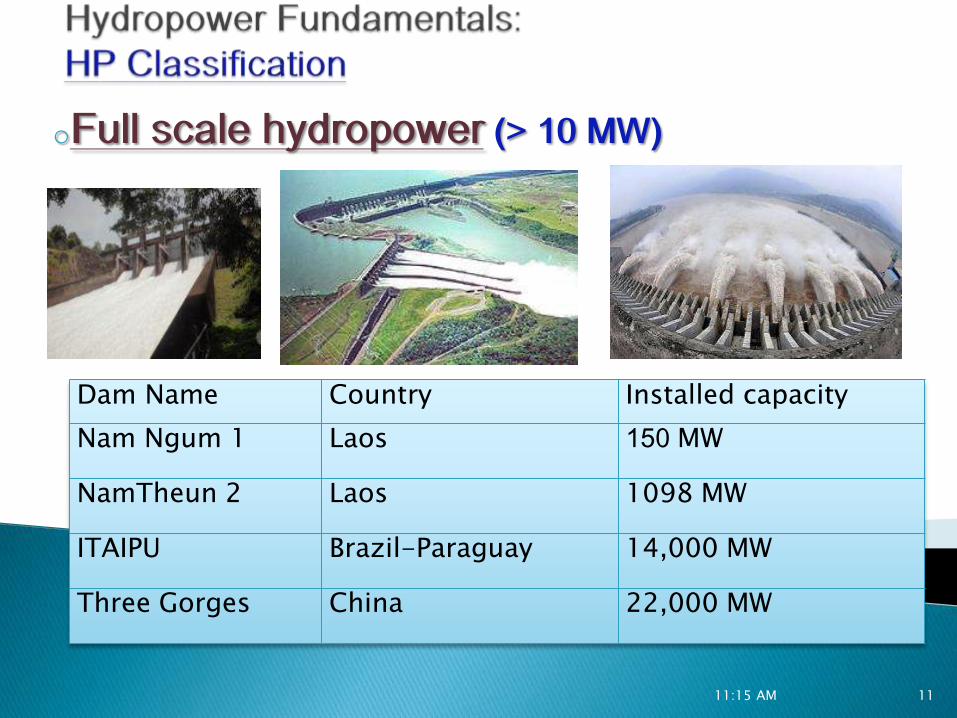
oFull scale hydropower (> 10 MW)
11:15 AM 11
Dam Name Country Installed capacity
Nam Ngum 1 Laos 150MW
NamTheun 2 Laos 1098 MW
ITAIPU Brazil-Paraguay 14,000 MW
Three Gorges China 22,000 MW
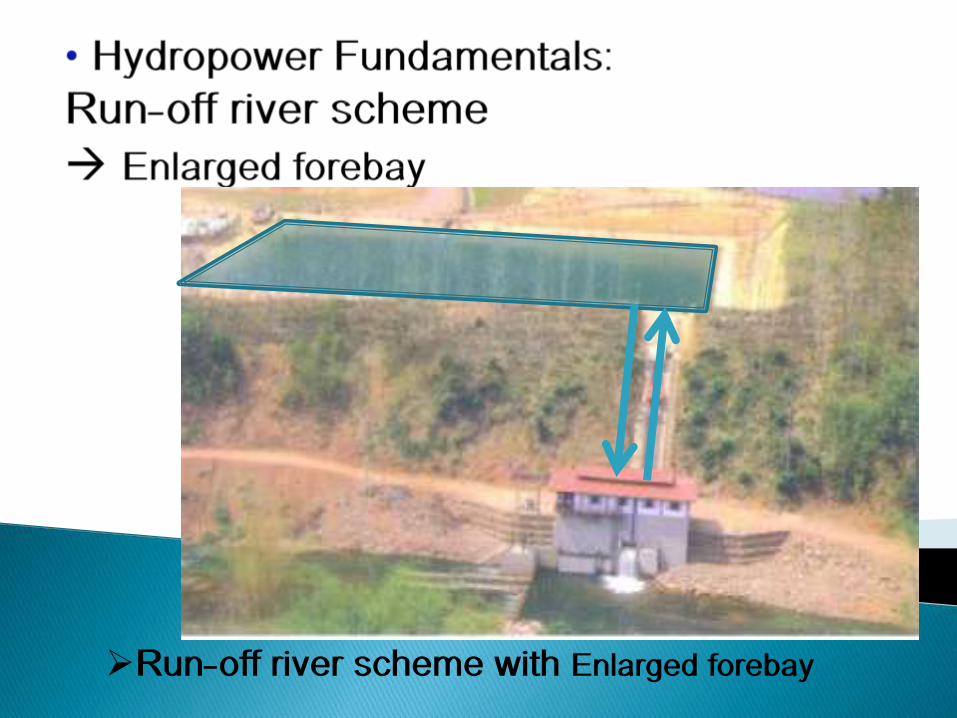
Run-off river scheme with Enlarged forebay

•Supply Destination
stand alone or captive
(with isolated mini grid)
grid-connected: to feed
power to grid network
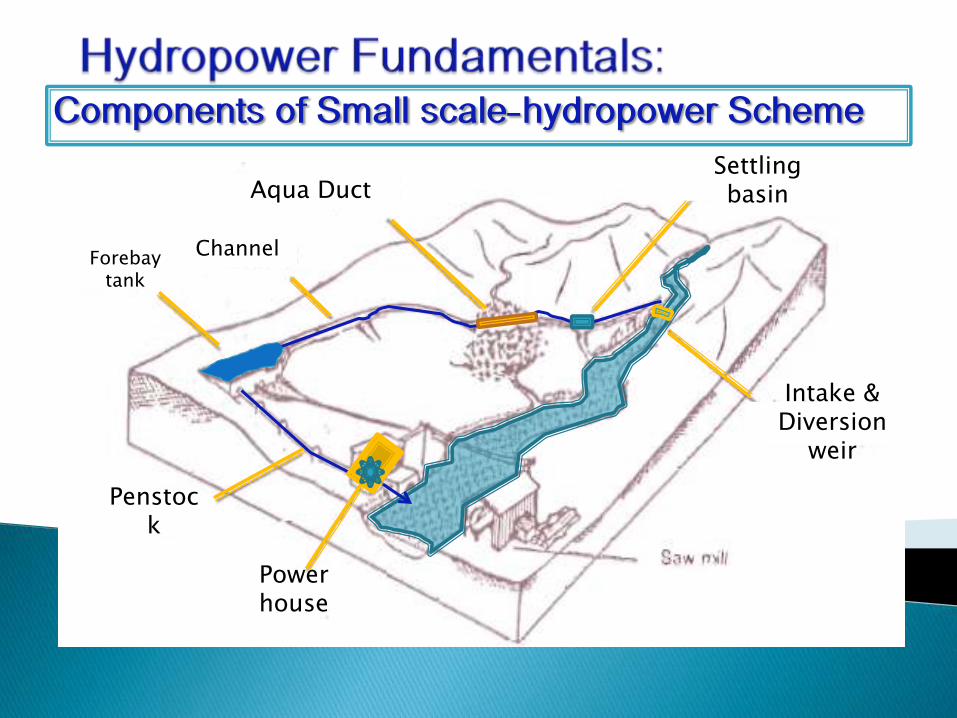
Components of Small scale-hydropower Scheme
Aqua Duct Settling basin
Intake & Diversion
weir
Channel Forebay tank
Penstock
Power house
•Advantages of Small-scale Hydropower
Uses Renewable energy resources
Relies on a non-polluting, indigenous
and locally available source of energy
Can replace petroleum-based generating systems
Uses a well-proven technology, well
beyond research and development
stage
environmental impacts can be kept at very low level
• Advantages to other “renewables”
High efficiency (70-90%)
High capacity factor - 50% (PV-10%,
Wind-30%) reliable for captive systems
High level of predictability, varying with
annual rainfalls
Slow rate of changes: gradually from day
to day Good correlation with demand
Proven, robust and long lasting
equipment
• Other Advantages:
Alternatively, SHP can be used as shaft power
(mechanical works): grain mill, water pumping
Due to small size allow involvement of local
villagers during the construction phase
Suitable locations are widely spread good
for decentralized electrification
Encouraged local production of parts/
equipment
wide range of design and construction
materials are available locally
•Disadvantages:
Associated with higher capital cost (usually >2000US$/kW)
Requires a considerable amount of specialist know-how
require a simple but continuous
effort for operation and maintenance:
o Lack of organizational capacities
o Lack of cash

•Power of Falling Water
gross
neto
P
P
m h
hgmE
Potential energy of body of mass m (kg and elevated on h (m):
grossgrossgrossgross hgQhgt
Vhg
t
m
t
EP
e= Overall efficiency of
energy conversion (%)
grossonet hQgP
Gross Power produced:
(Pnet- Net Output Power )
0
Falling Times (t)
(V- falling water volume; -water density)
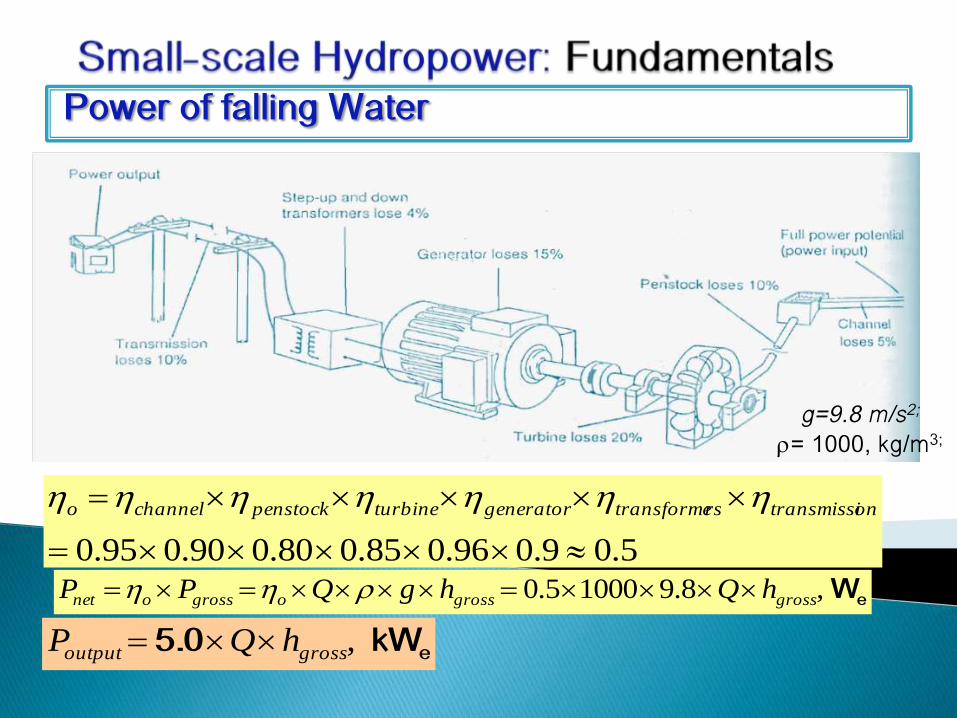
Power of falling Water
eW ,8.910005.0 grossgrossogrossonet hQhgQPP
5.09.096.085.080.090.095.0
ontransmissirstransformegeneratorturbinepenstockchannelo
ekW 5.0 ,grossoutput hQP
g=9.8 m/s2;
= 1000,kg/m3;

Stages of SHP Potential assessment :
1) Desk study (or hydrology study)
To study on geological, hydrological and
socio-economic conditions of the proposed
site
May identify appropriate site without site visit
May know that there is no any potential at
the proposed site, and hence no need to do site visit save money
Accuracy of project costs estimation at this stage is 30%
2) Reconnaissance visit:
a short site visit (usually 1 day visit) to
verify the desk study results:
Existing hydropower potential
Appropriate power demand
Site Accessibility
3) Pre-Feasibility Study
to determine which of several
proposed projects, sites or technical
options are most attractive for SSHP
development
Preliminary assessment are
reviewed and worked out with more
details Accuracy of cost estimates: 20-25%

4) Feasibility Study(FS):
Assessment whether the
implementation of the proposed
scheme is desirable or not
Project Developer will make final
decision and to locate funding on the
base of FS Accuracy of cost estimates:10-15%
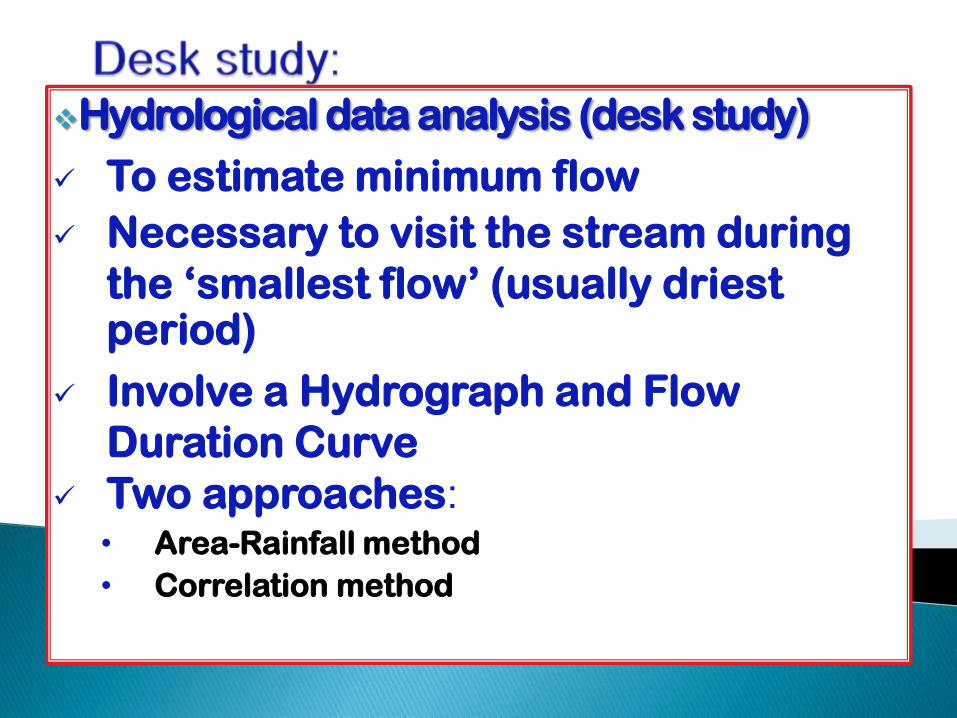
Hydrological data analysis (desk study)
To estimate minimum flow
Necessary to visit the stream during
the ‘smallest flow’ (usually driest period)
Involve a Hydrograph and Flow
Duration Curve
Two approaches:
• Area-Rainfall method
• Correlation method
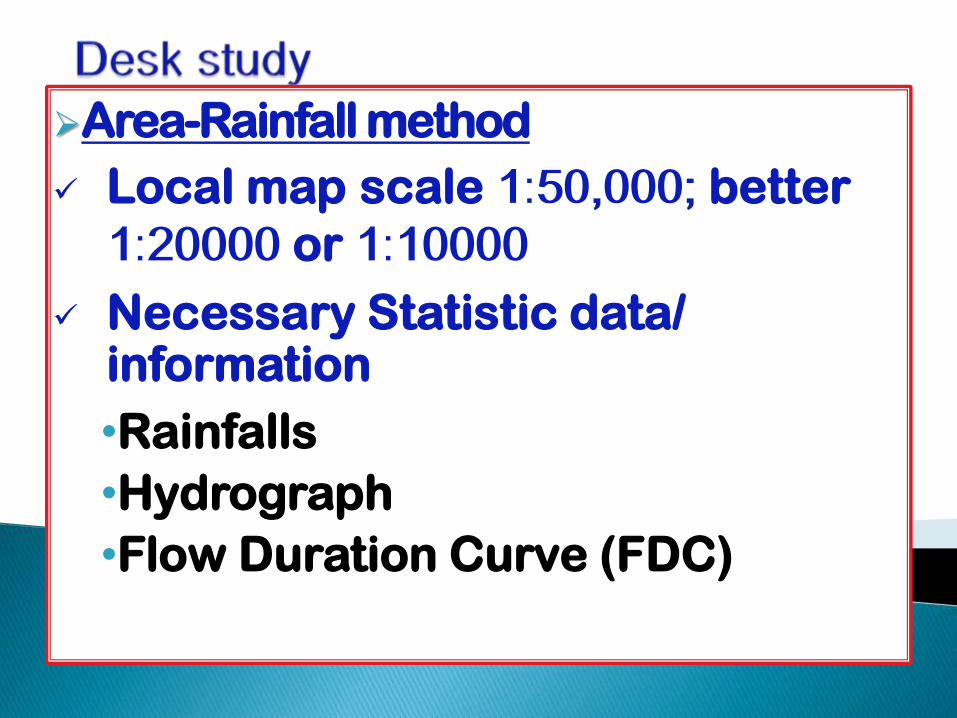
Area-Rainfall method
Local map scale 1:50,000; better
1:20000 or 1:10000
Necessary Statistic data/ information
•Rainfalls
•Hydrograph
•Flow Duration Curve (FDC)
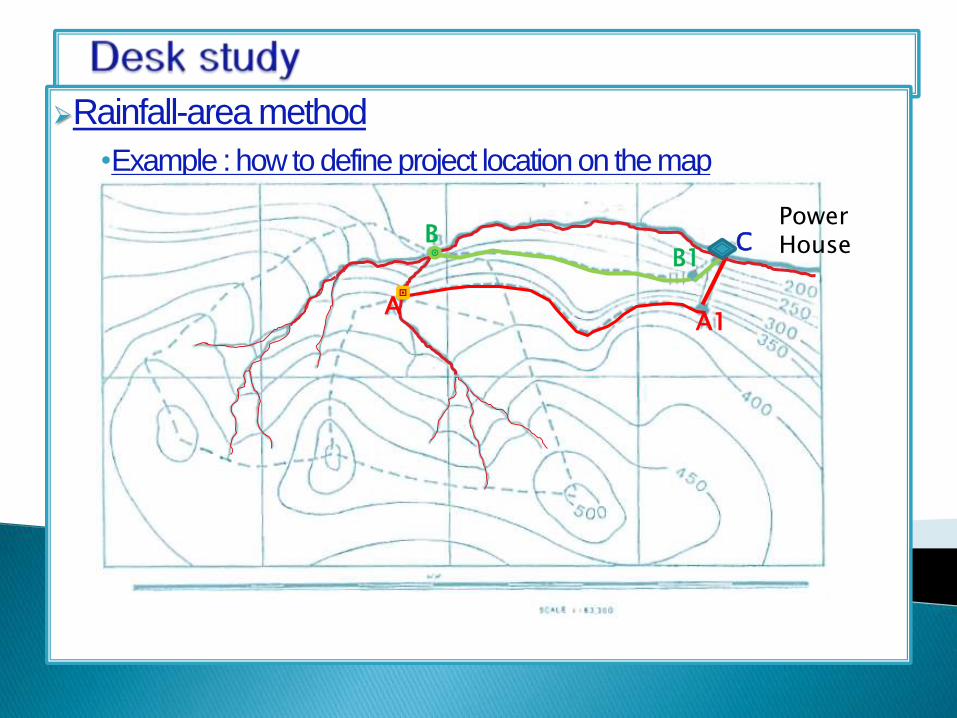
Rainfall-area method
•Example : how to define project location on the map
Power House B
A1
B1 C
A
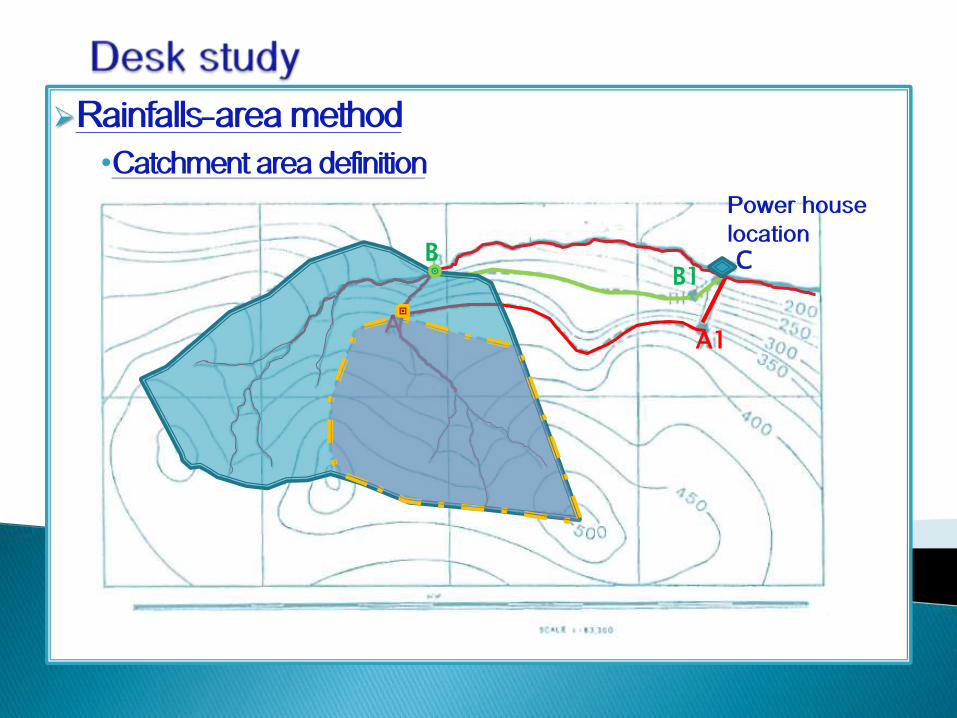
Rainfalls-area method
•Catchment area definition
Power house
location
B
A1
B1 C
A
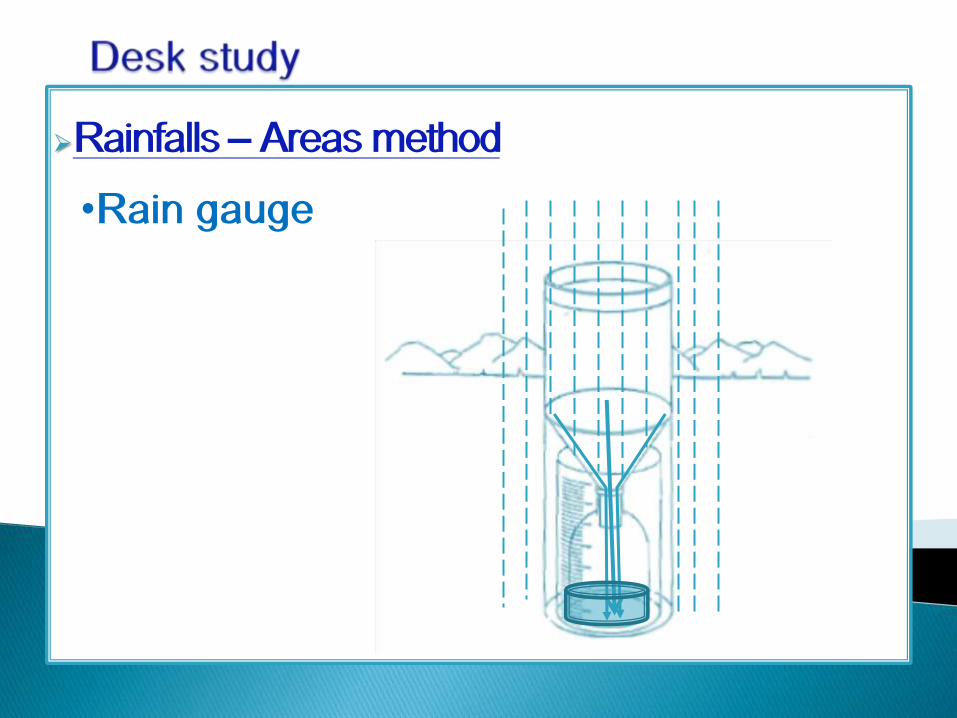
Rainfalls – Areas method
•Rain gauge

Area-Rainfalls method
•Calculation of rainfalls in catchment areas
Proposed Power House
B C
A
2
3
4
1
w=2000 mm/Year
Area W
Area Z
Area Y
z=3000 mm/Y
y=2700 mm/Y
Z
W
Y
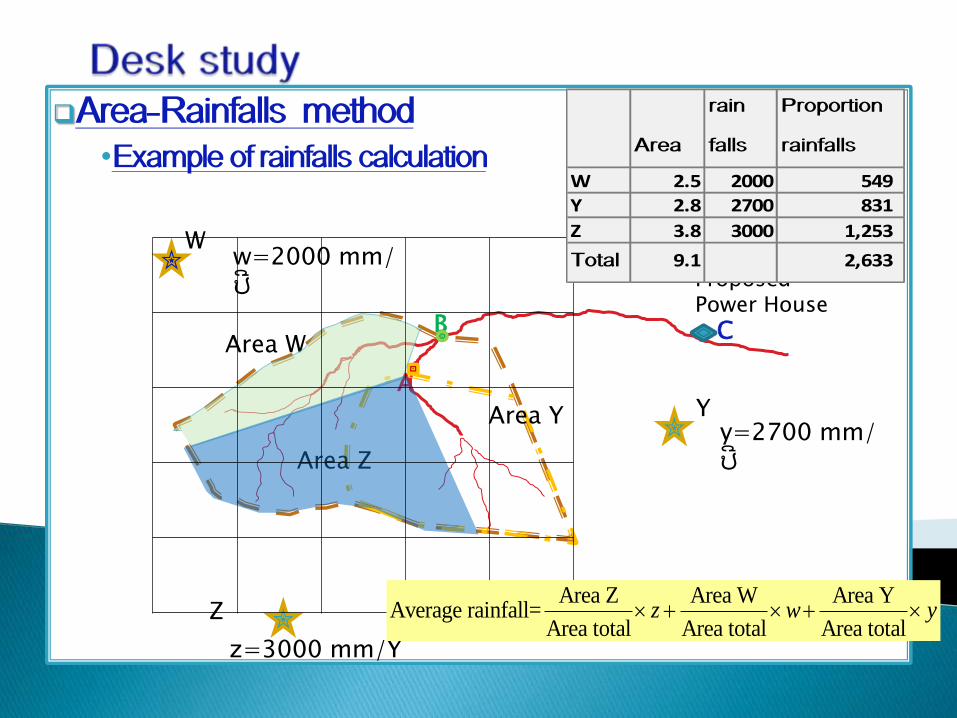
Area-Rainfalls method
•Example of rainfalls calculation
Proposed Power House
B C
A
w=2000 mm/ປີ
Area W
Area Z
Area Y
z=3000 mm/Y
y=2700 mm/ປີ
Z
W
Y
Area
rain
falls
Proportion
rainfalls
W 2.5 2000 549
Y 2.8 2700 831
Z 3.8 3000 1,253
Total 9.1 2,633
Area Z Area W Area YAverage rainfall=
Area total Area total Area totalz w y
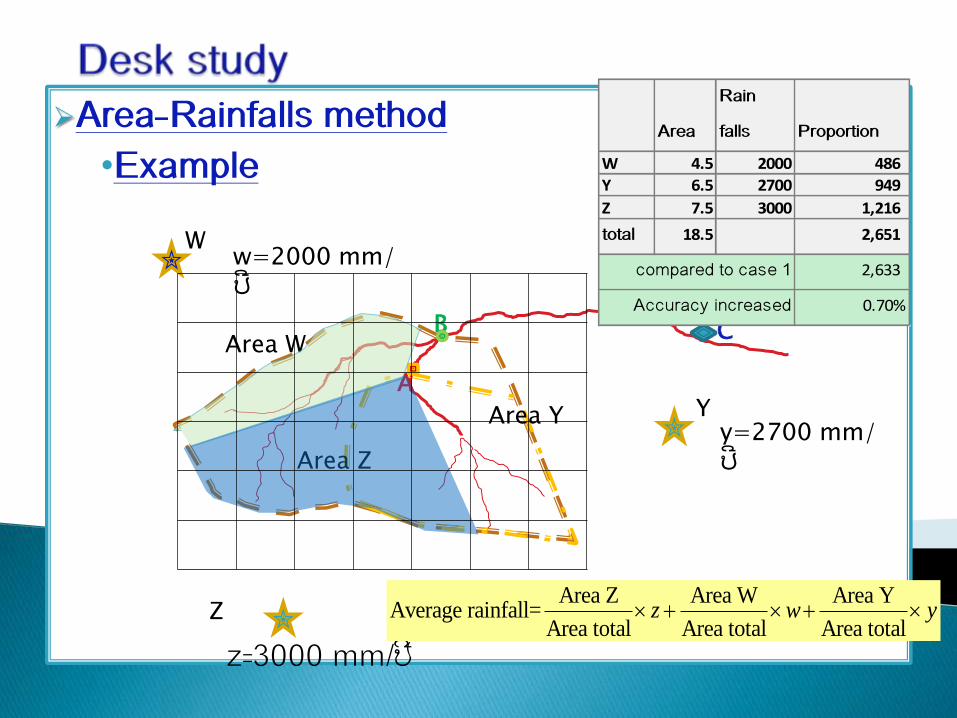
Area-Rainfalls method
•Example
Proposed Power House
B C
A
w=2000 mm/ປີ
Area W
Area Z
Area Y
z=3000 mm/ປີ
y=2700 mm/ປີ
Z
W
Y
Area
Rain
falls Proportion
W 4.5 2000 486
Y 6.5 2700 949
Z 7.5 3000 1,216
total 18.5 2,651
compared to case 1 2,633
Accuracy increased 0.70%
Area Z Area W Area YAverage rainfall=
Area total Area total Area totalz w y
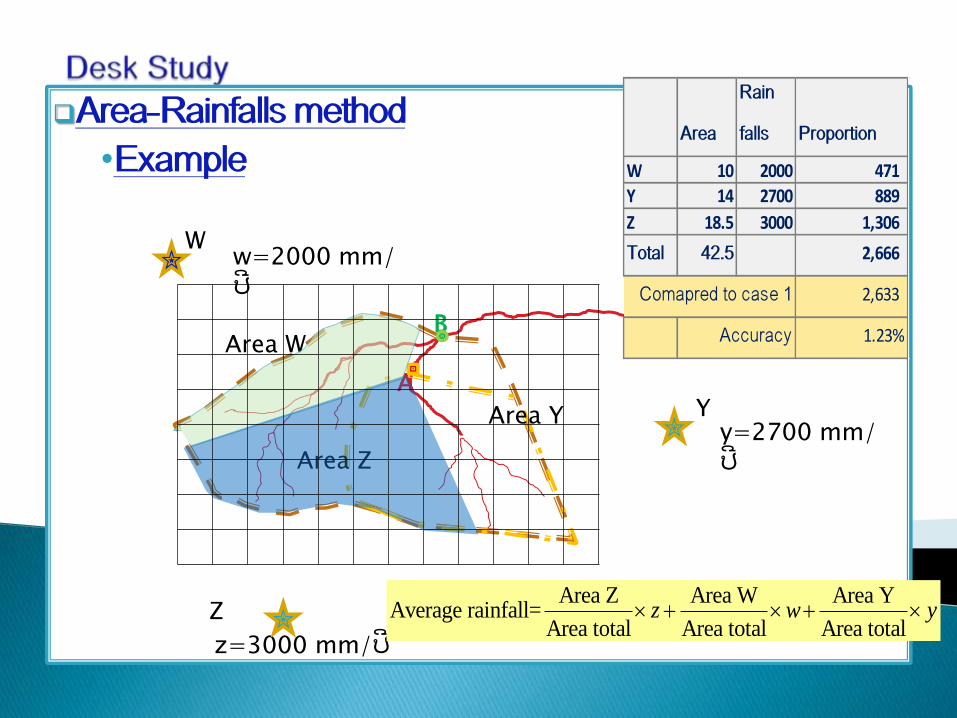
Area-Rainfalls method
•Example
Proposed Power House
B C
A
w=2000 mm/ປີ
Area W
Area Z
Area Y
z=3000 mm/ປີ
y=2700 mm/ປີ
Z
W
Y
Area
Rain
falls Proportion
W 10 2000 471
Y 14 2700 889
Z 18.5 3000 1,306
Total 42.5 2,666
Comapred to case 1 2,633
Accuracy 1.23%
Area Z Area W Area YAverage rainfall=
Area total Area total Area totalz w y

Area-Rainfalls method
•Catchment area of site A
Proposed Power House
B C
A
Map scale 1:63360 1:63360
Size of square
=(30x63.36)x(22x63.36)
=2.652x10⁶ m2
22 mm
30 mm
Actual Catchment
area
=area 1 square x
number of squares
=2.652x10⁶ m2

Area-Rainfalls method • Catchment area of site A
•Annual Discharge Flow Discharge (ADF)
Proposed Power House
B C
A
Map scale 1:63360 1:63360
Size of a square
=(4x63.36)x(4x63.36), m2
= 144,658 m2
4 mm x 4 mm
Number of squares(A)=21
Catchment area(A):
= 21x144,658
=3.04x10⁶ m2
Rainfalls = 2666 mm/year
=2.666m/year
Water volume =
Catchment area x Rainfalls
=3.04x106 x 2.666=
8.1x10⁶ m
3/year
ADFA=8.1x10⁶ m3/year
/(365x24x60x60 s/year)
= 0.26 m3/s
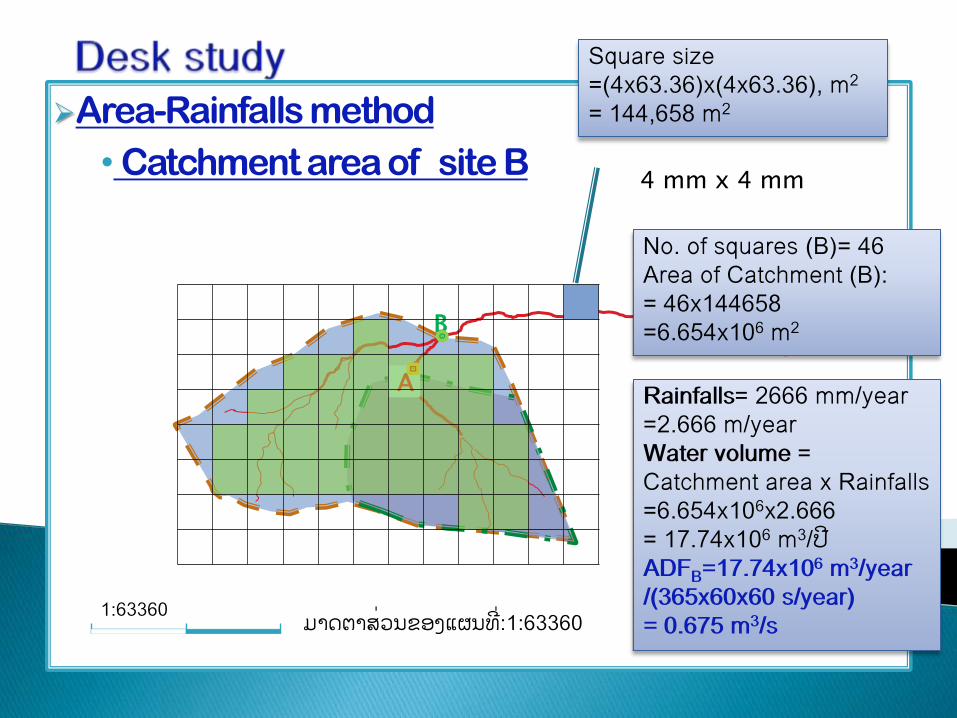
Area-Rainfalls method
• Catchment area of site B
Proposed Power House
B C
A
ມາດຕາສ່ວນຂອງແຜນທ ່:1:63360 1:63360
Square size
=(4x63.36)x(4x63.36), m2
= 144,658 m2
4 mm x 4 mm
No. of squares(B)=46
Area of Catchment(B):
= 46x144658
=6.654x10⁶ m
2
Rainfalls= 2666 mm/year
=2.666m/year
Water volume=
Catchment area x Rainfalls
=6.654x106x2.666
=17.74x10⁶ m3/ປ
ADFB=17.74x10⁶ m3/year
/(365x60x60 s/year)
= 0.675 m3/s
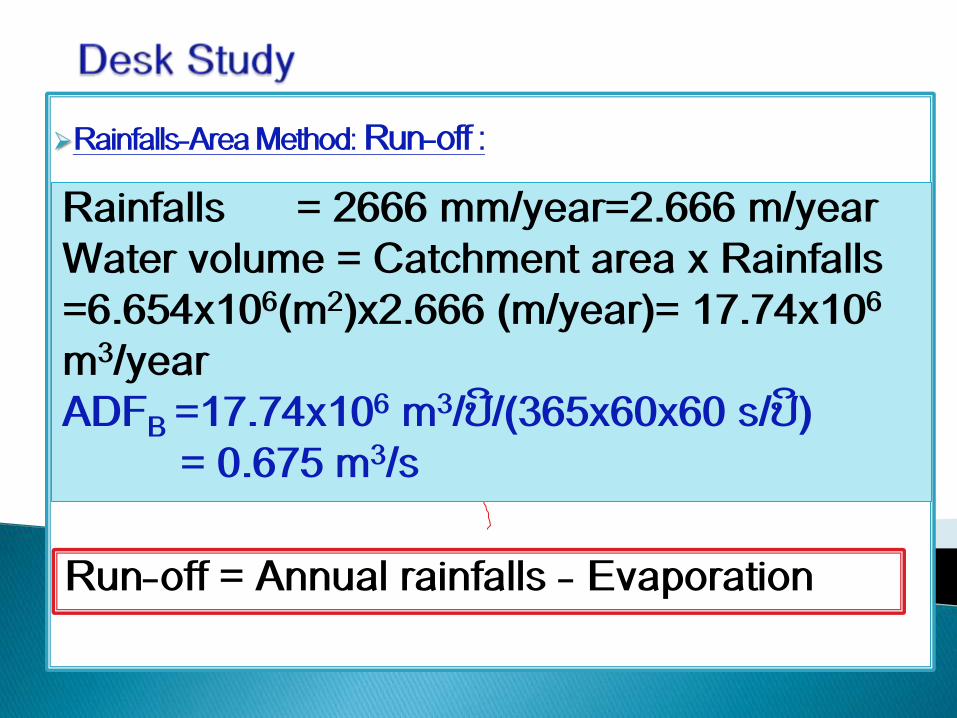
Rainfalls-Area Method: Run-off :
Proposed Power House
B C
A
Rainfalls = 2666 mm/year=2.666 m/year
Water volume = Catchment area x Rainfalls
=6.654x10⁶(m2)x2.666 (m/year)= 17.74x10⁶
m3/year
ADFB
=17.74x10⁶ m3/ປີ/(365x60x60 s/ປິ)
= 0.675 m3/s
Run-off = Annual rainfalls - Evaporation
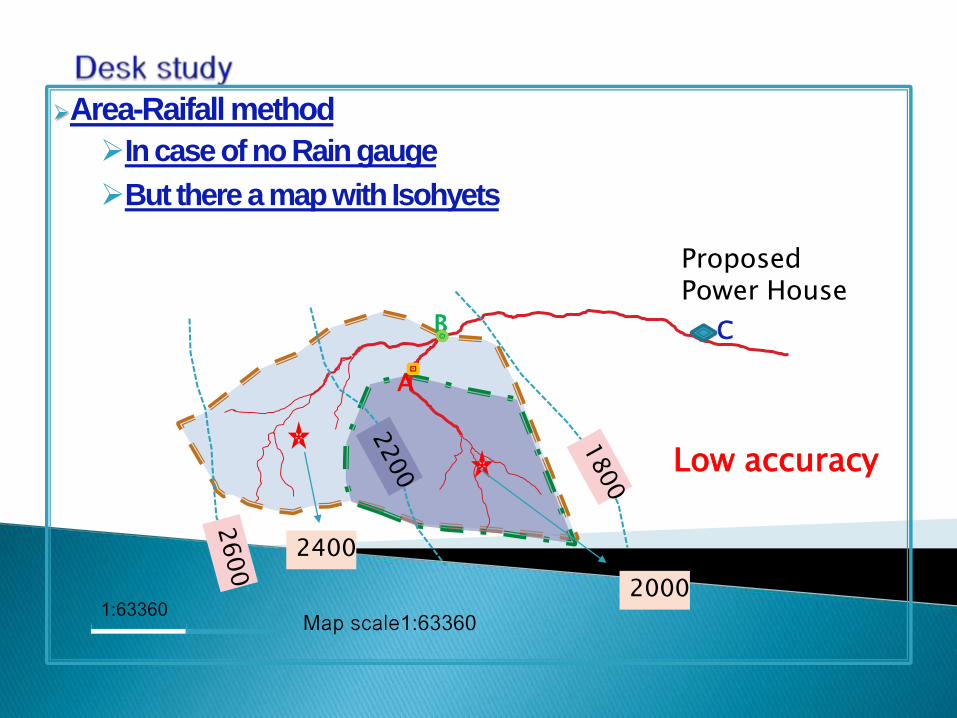
Area-Raifall method
In case of no Rain gauge
But there a map with Isohyets
Proposed Power House
B C
A
Map scale1:63360 1:63360
2000
2400
Low accuracy
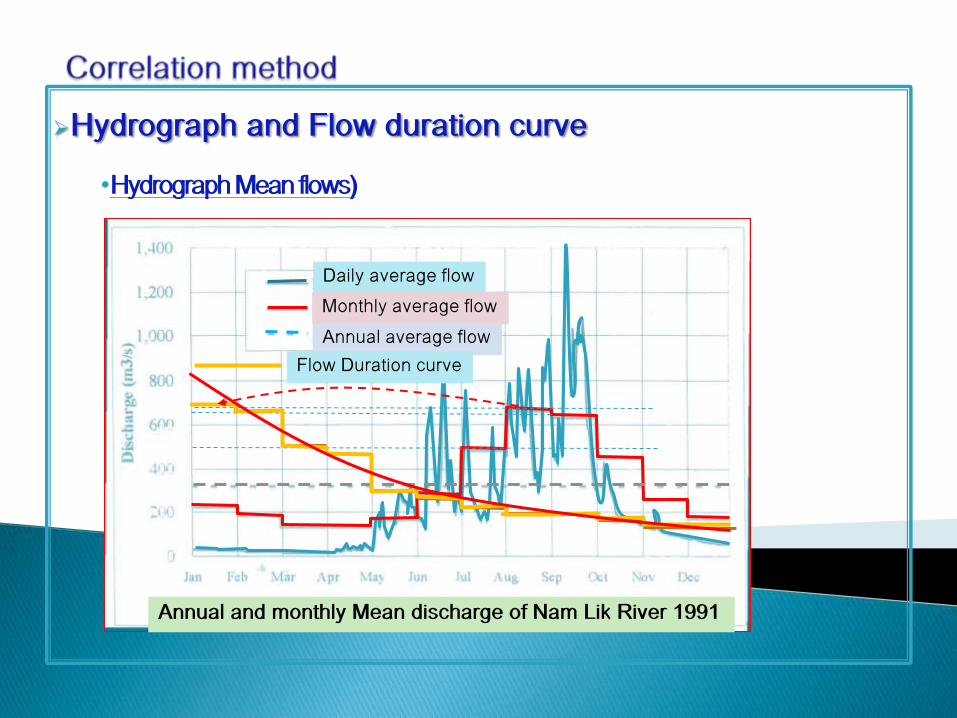
Hydrograph and Flow duration curve
•Hydrograph Mean flows)
Annual and monthly Mean discharge of Nam Lik River 1991
Daily average flow
Monthly average flow
Annual average flow
Flow Duration curve

Flow Duration Curve (FDC)
Percentage of discharge
Dis
charg
e,
Cub.
M p
er
second
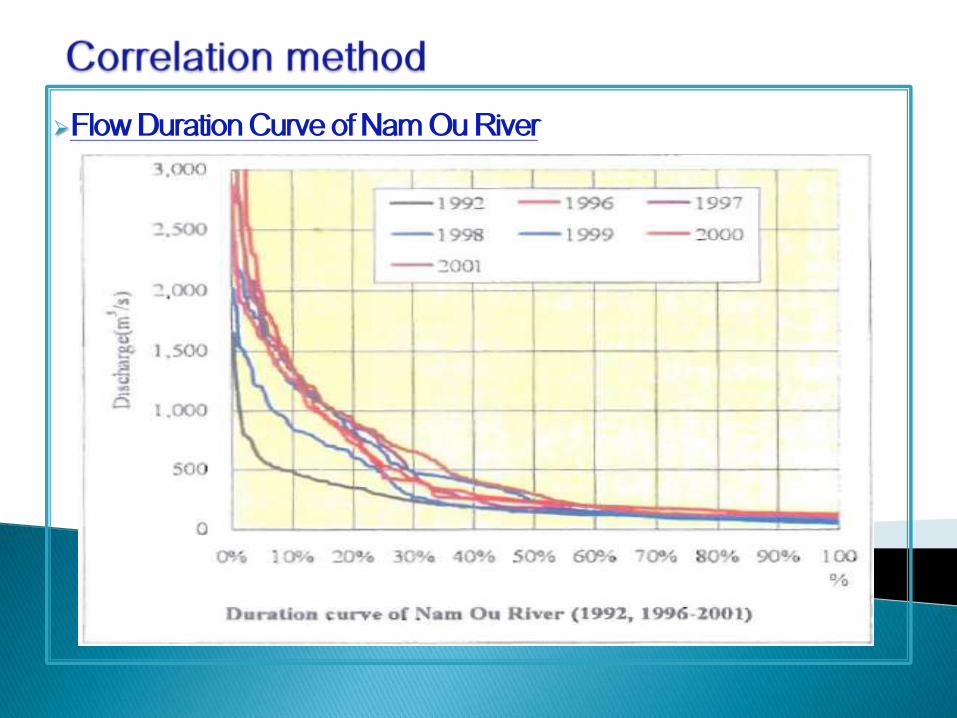
Flow Duration Curve of Nam Ou River

FDC of Nam Lik River
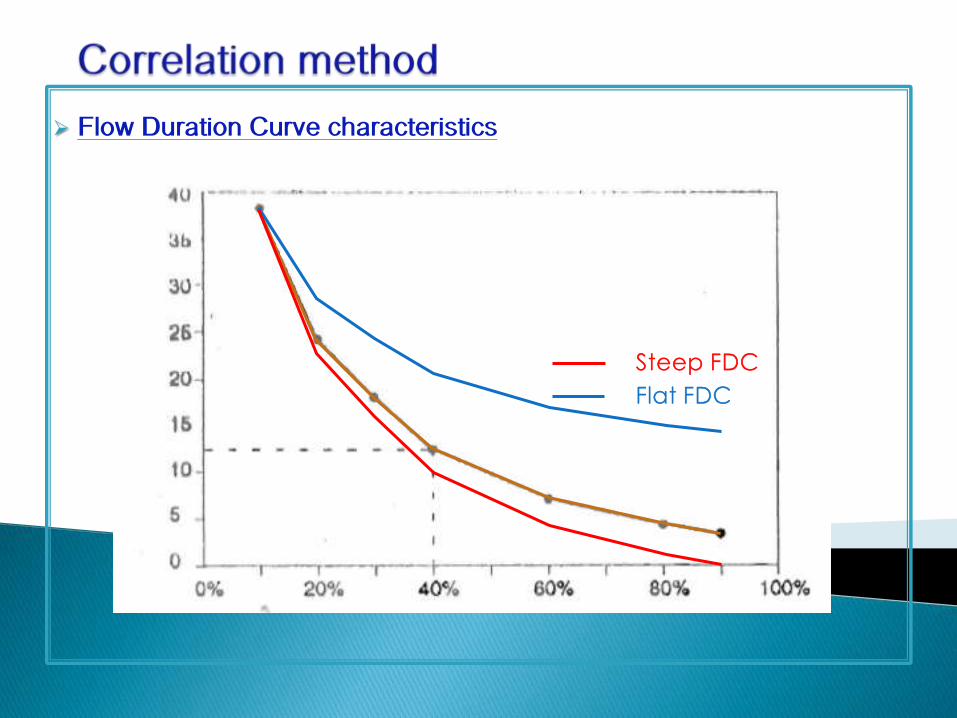
Flow Duration Curve characteristics
Steep FDC Flat FDC
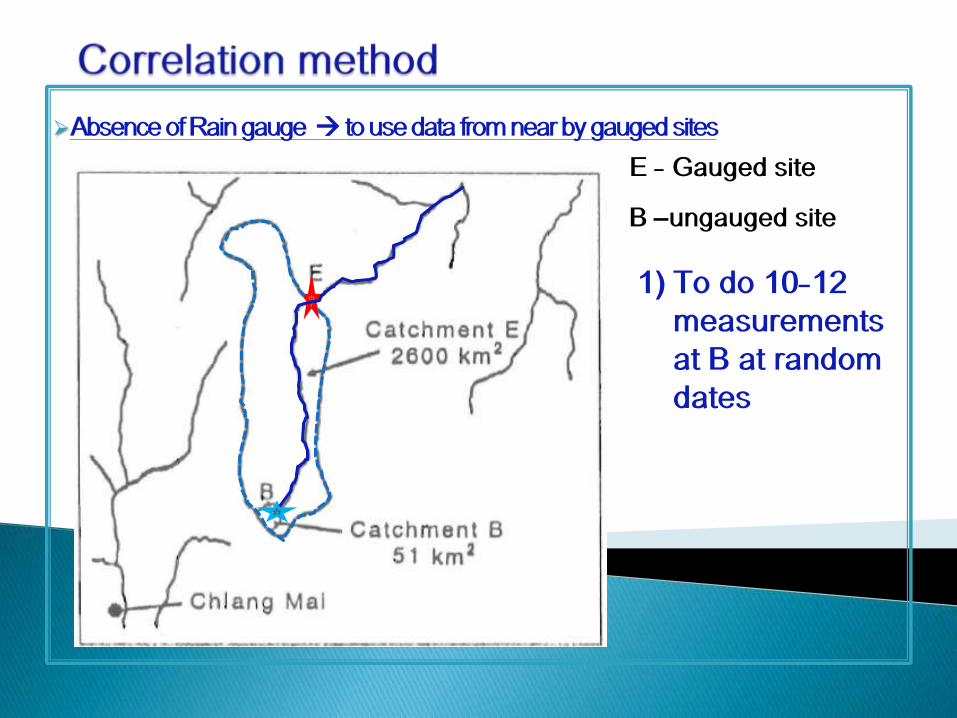
Absence of Rain gauge to use data from near by gauged sites
E - Gauged site
B –ungauged site
1) To do 10-12
measurements
at B at random
dates
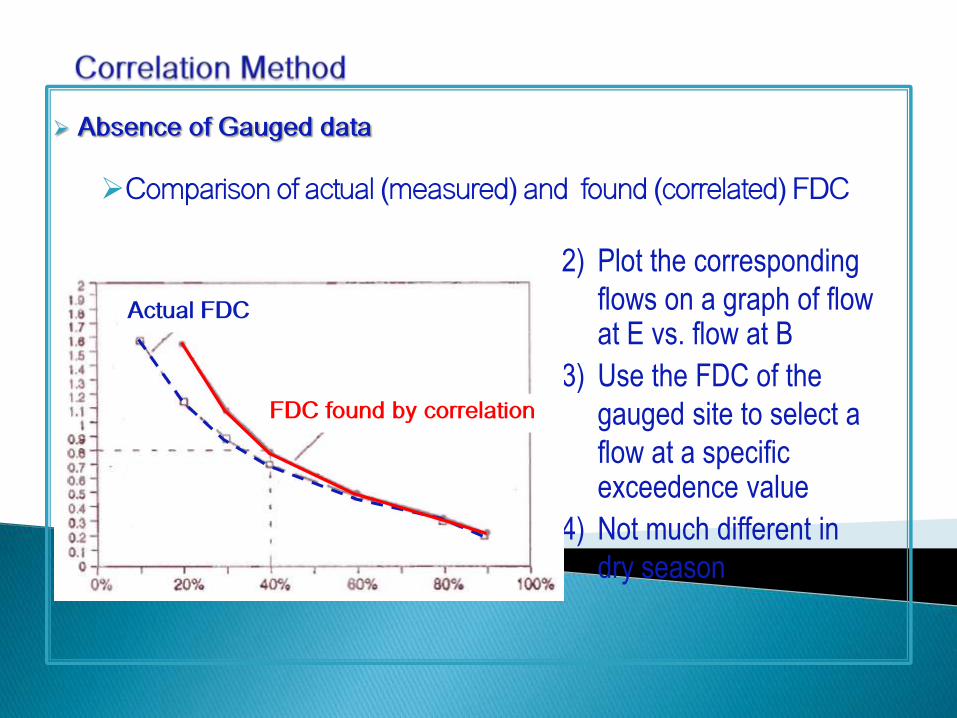
Absence of Gauged data
Comparison of actual (measured) and found (correlated) FDC
2) Plot the corresponding
flows on a graph of flow at E vs. flow at B
3) Use the FDC of the
gauged site to select a
flow at a specific exceedence value
4) Not much different in
dry season
FDC found by correlation
Actual FDC
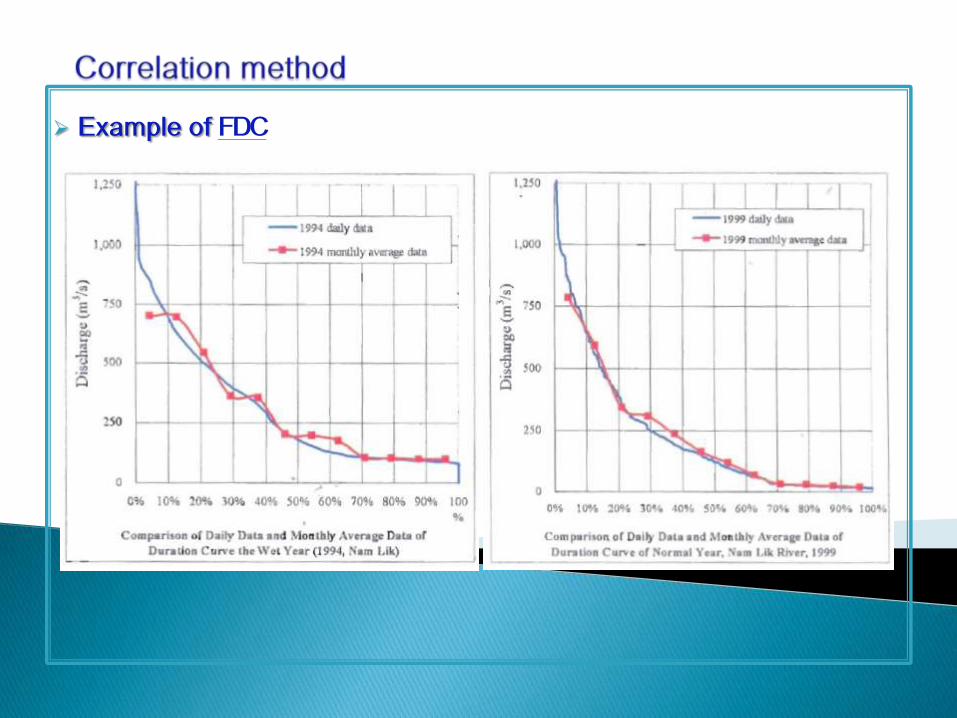
Example of FDC
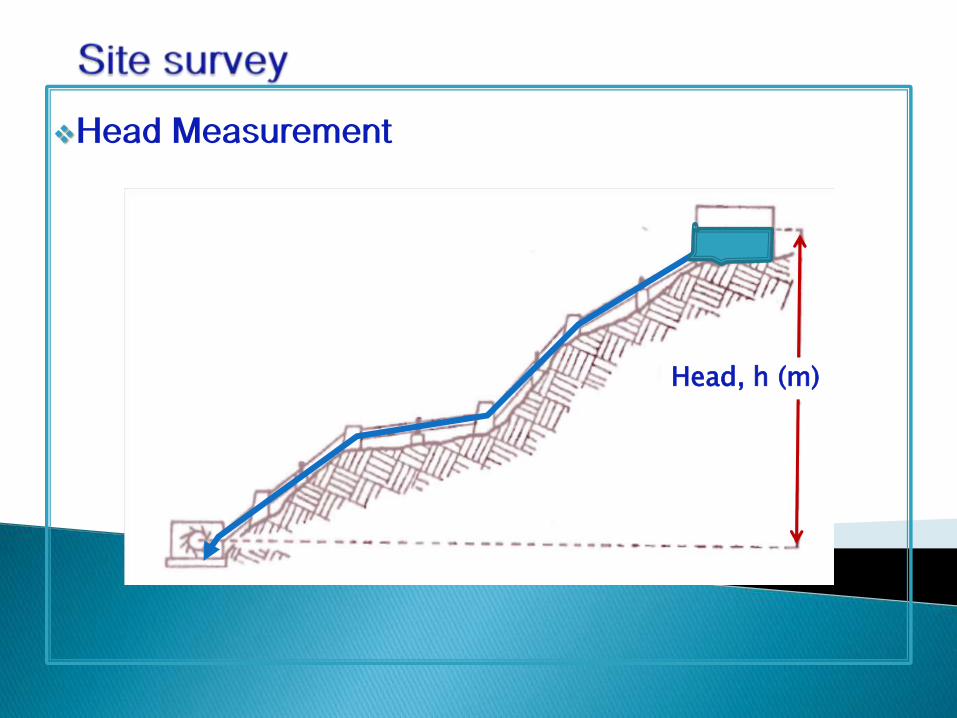
Head Measurement
Head,h (m)

•Head Measurement: water-filled clear tube and
person
Y
H(m) =Y1+Y2+Y3+Y4
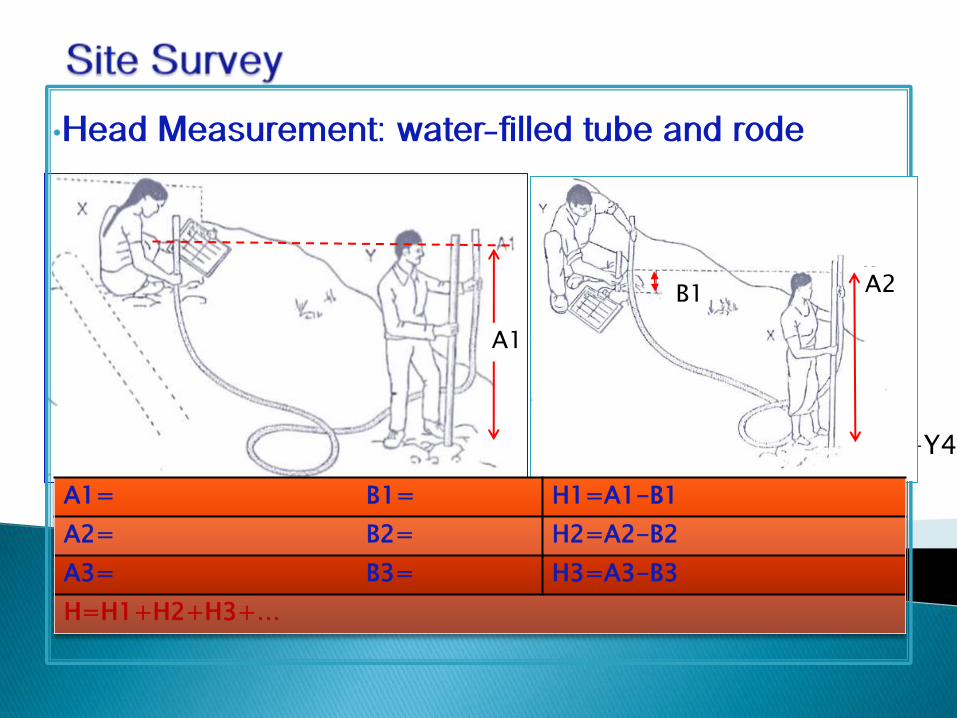
•Head Measurement: water-filled tube and rode
H(m) =Y1+Y2+Y3+Y4
A1= B1= H1=A1-B1
A2= B2= H2=A2-B2
A3= B3= H3=A3-B3
H=H1+H2+H3+…
A1
B1 A2
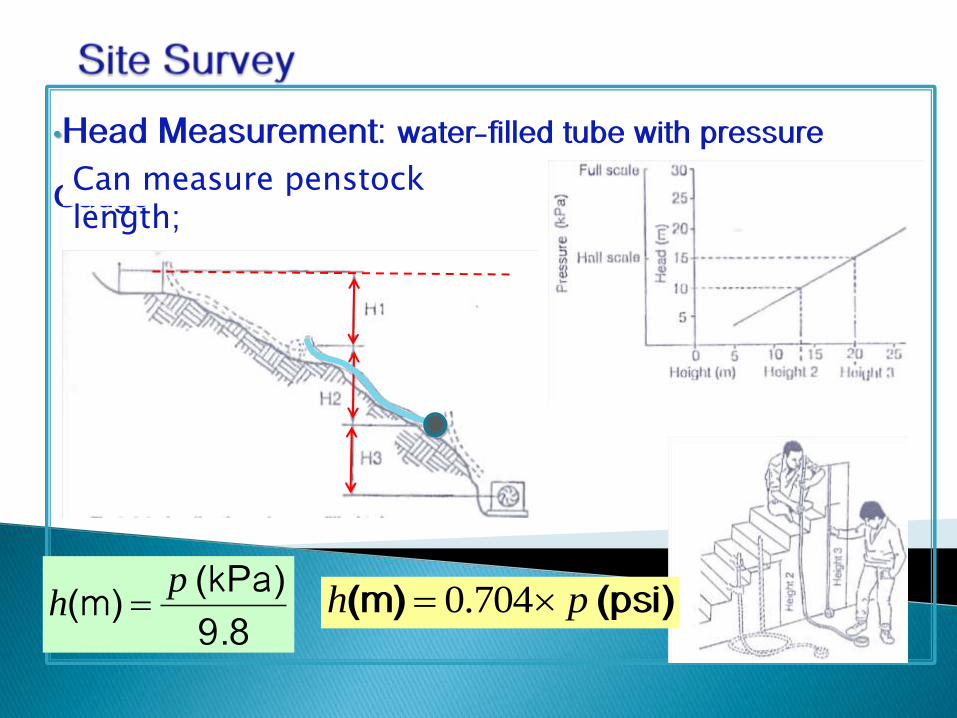
• Head Measurement: water-filled tube with pressure
Gauge
9.8
(kPa) (m)p
h (psi) (m) ph 704.0
Can measure penstock length;
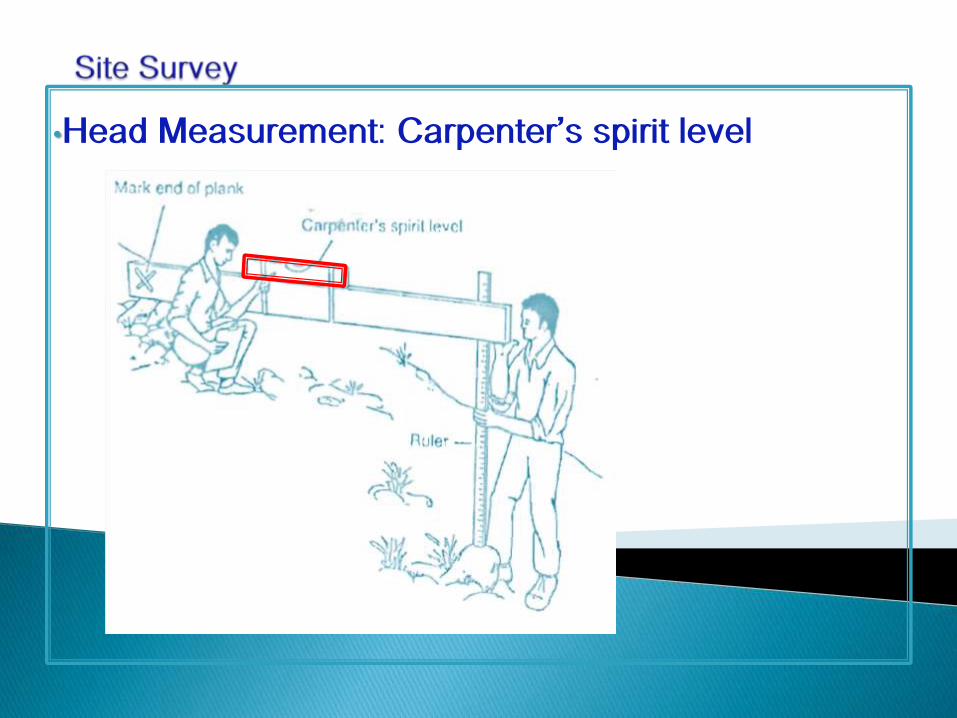
• Head Measurement: Carpenter’s spirit level
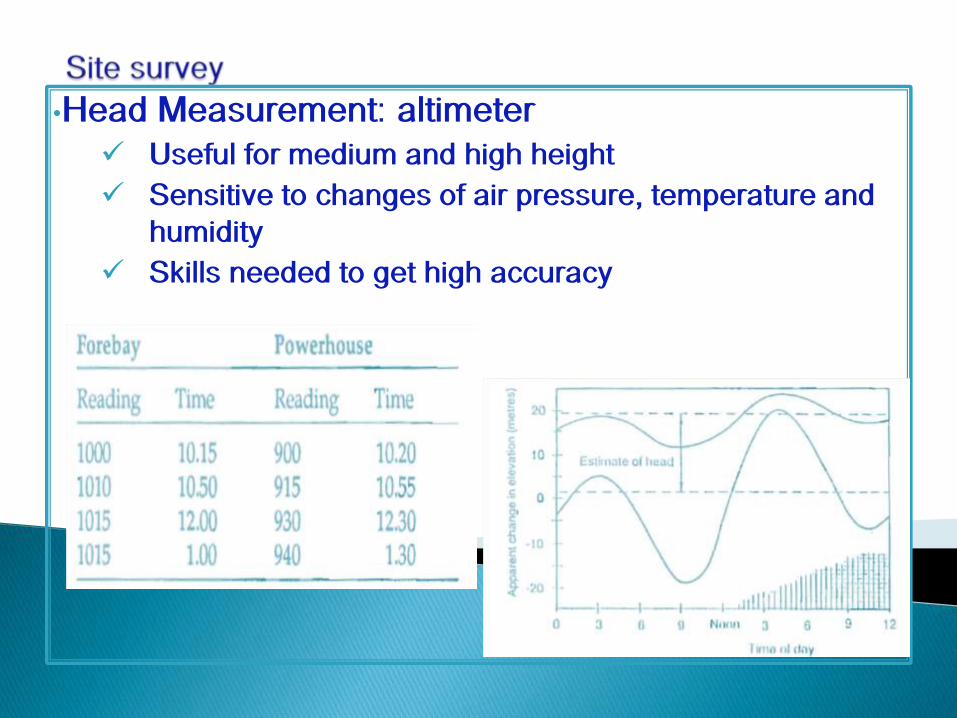
•Head Measurement: altimeter
Useful for medium and high height
Sensitive to changes of air pressure, temperature and
humidity
Skills needed to get high accuracy
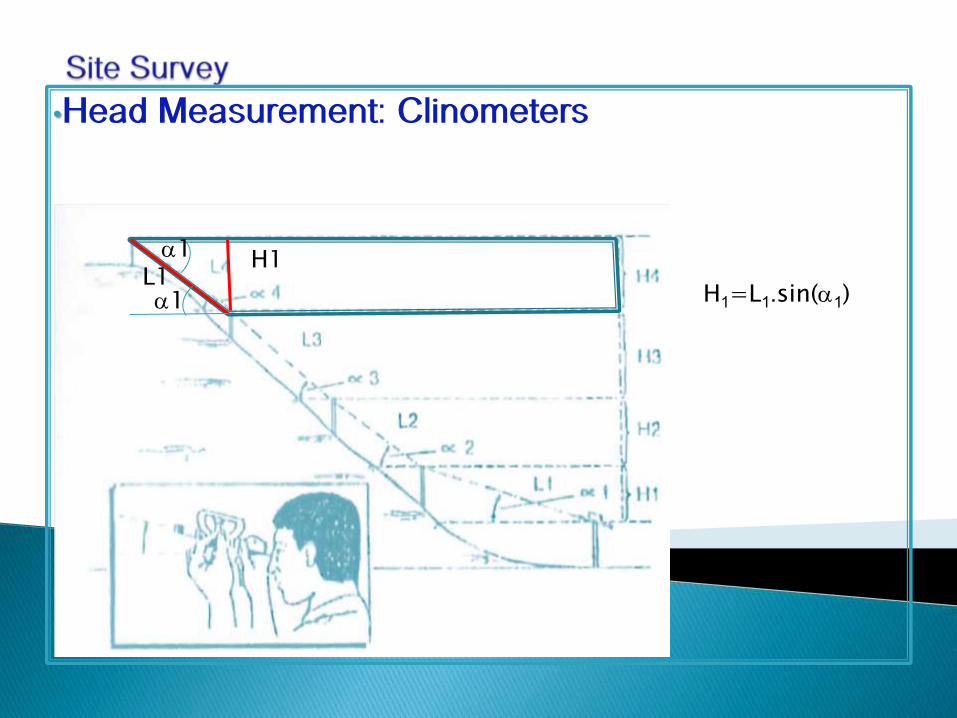
• Head Measurement: Clinometers
H1=L1.sin(1) L1
H1 1
1

• Head Measurement: Sighting and Theodolites

• Site Flow Measurement: Bucket/Oil drum method
t
VQ
water
waterwater
mV
mwater=m(bucket+water) - mbucket
Bucket: suitable for flow rate < 5 L/s
200L Oil drum: < 50 L/s
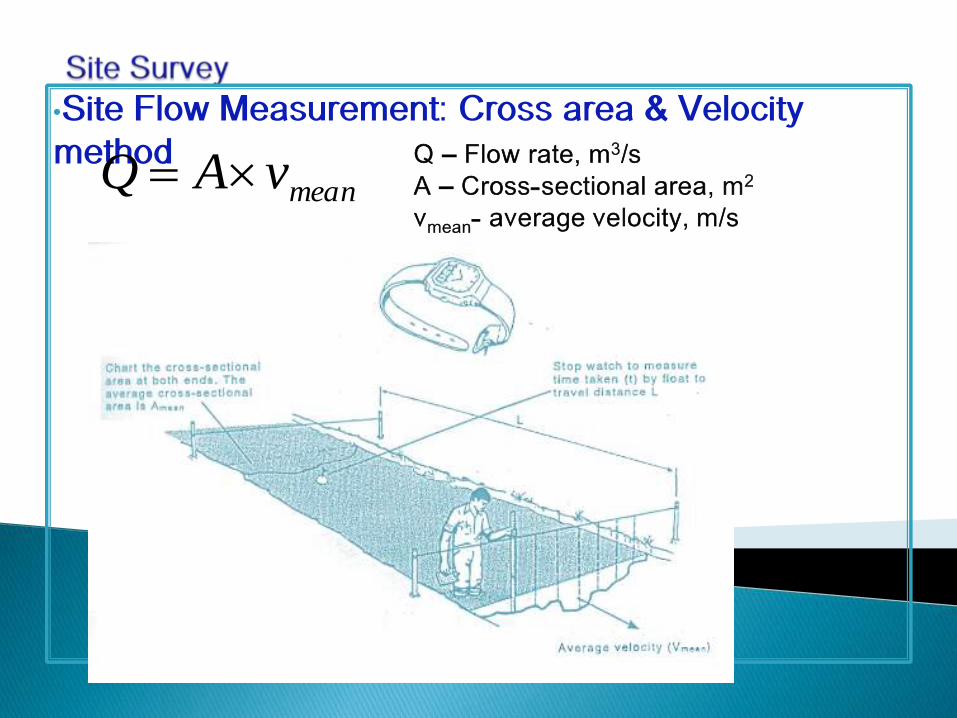
•Site Flow Measurement: Cross area & Velocity
method
meanvAQ Q – Flow rate, m3/s A – Cross-sectional area, m2
vmean- average velocity, m/s
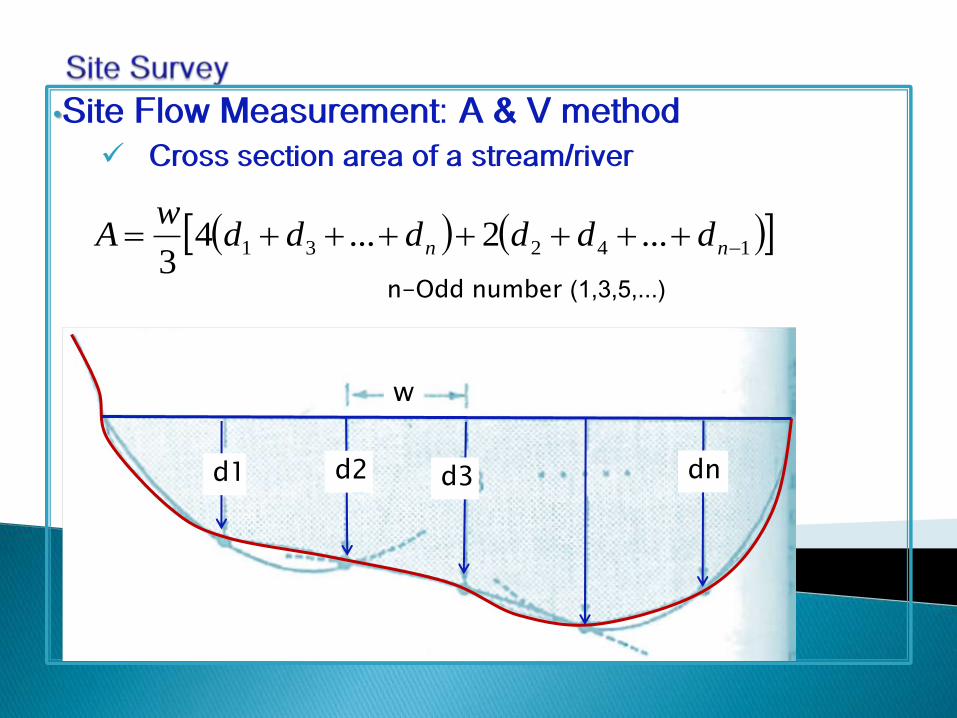
• Site Flow Measurement: A & V method
Cross section area of a stream/river
14231 ...2...43
nn ddddddw
A
d1 d2 d3 dn
w
n-Odd number (1,3,5,...)
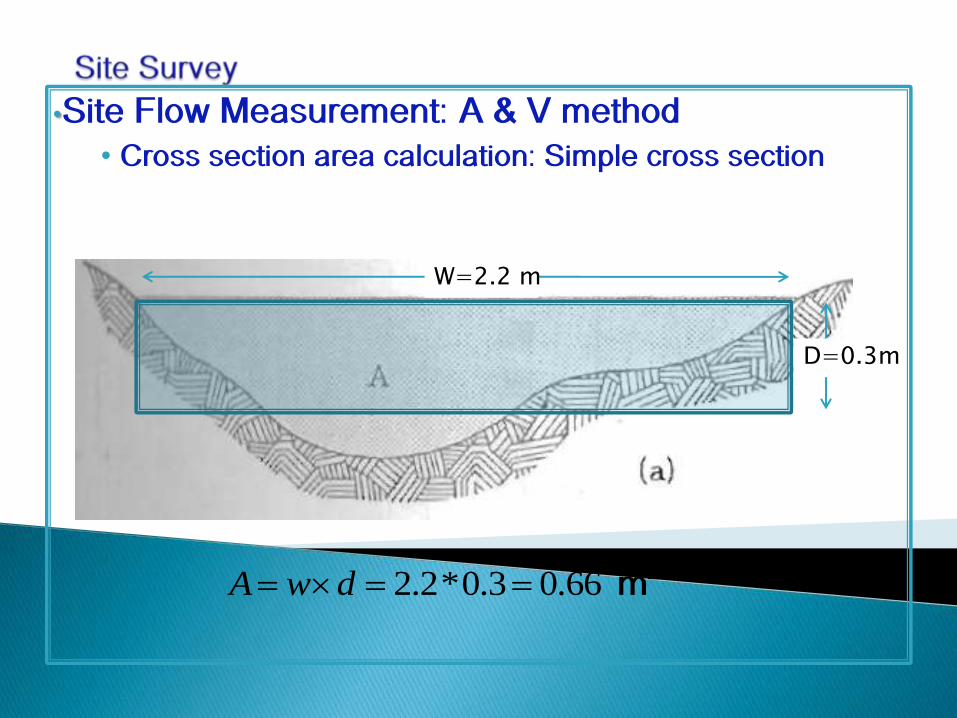
• Site Flow Measurement: A & V method
• Cross section area calculation: Simple cross section
2
m 66.03.0*2.2 dwA
W=2.2 m
D=0.3m
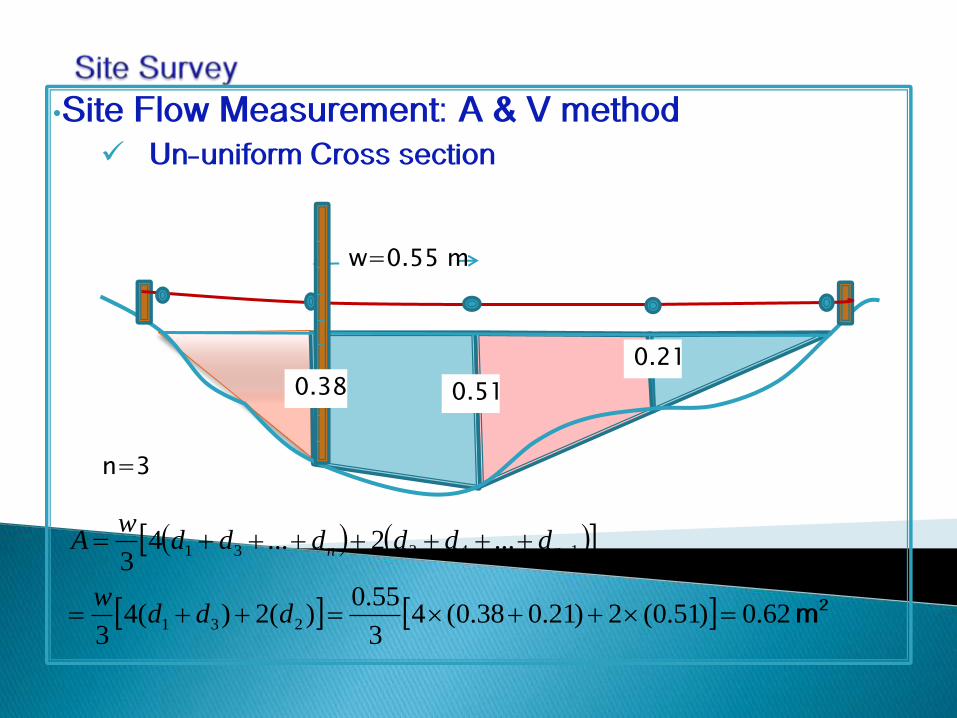
•Site Flow Measurement: A & V method
Un-uniform Cross section
w=0.55 m
0.51
0.21
2
m 62.0)51.0(2)21.038.0(43
55.0)(2)(4
3
...2...43
231
14231
dddw
ddddddw
A nn
n=3
0.38

• Site Flow Measurement: A & V method
Measuring average flow velocity
Average velocity, v orvmean
t
Ls v
L
sCV v
C=0.85- for smooth, rectangular concrete channels C=0.75- for large, slow, clear stream C=0.65- for small but regular stream with smooth stream bed C=0.45- for shallow (0.5 m) turbulent flow C=0.25- for very shallow and rocky stream
V

• Site Flow Measurement: A & V method
Average velocity in a partial area
sc vv
c=0.75-Shalow stream c=0.95-deep stream
area Partial a in Velocity sV
vs v
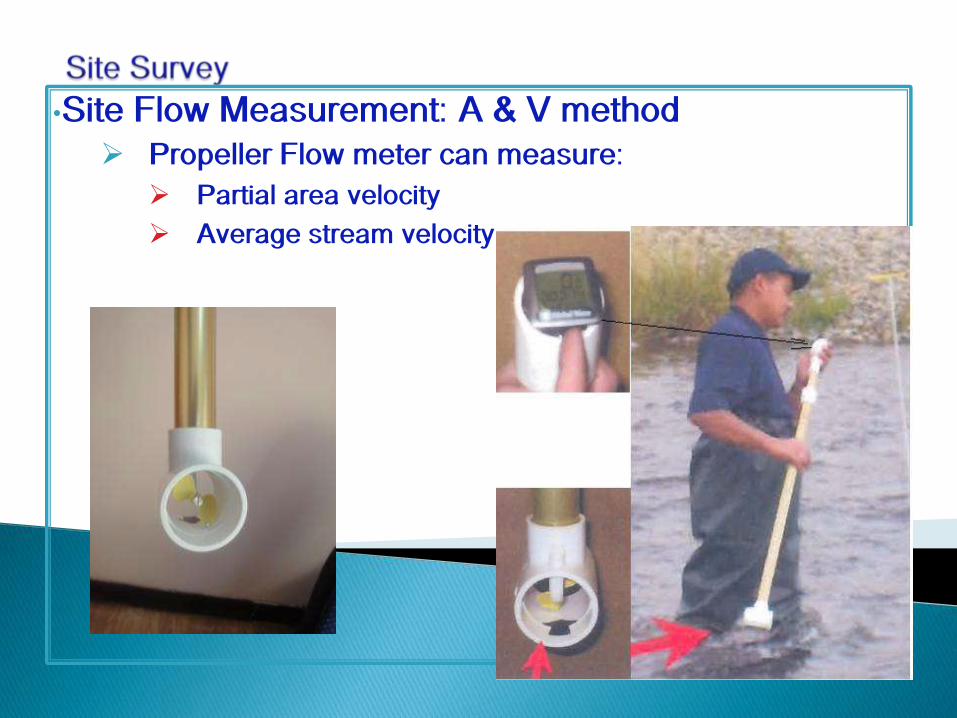
•Site Flow Measurement: A & V method
Propeller Flow meter can measure:
Partial area velocity
Average stream velocity
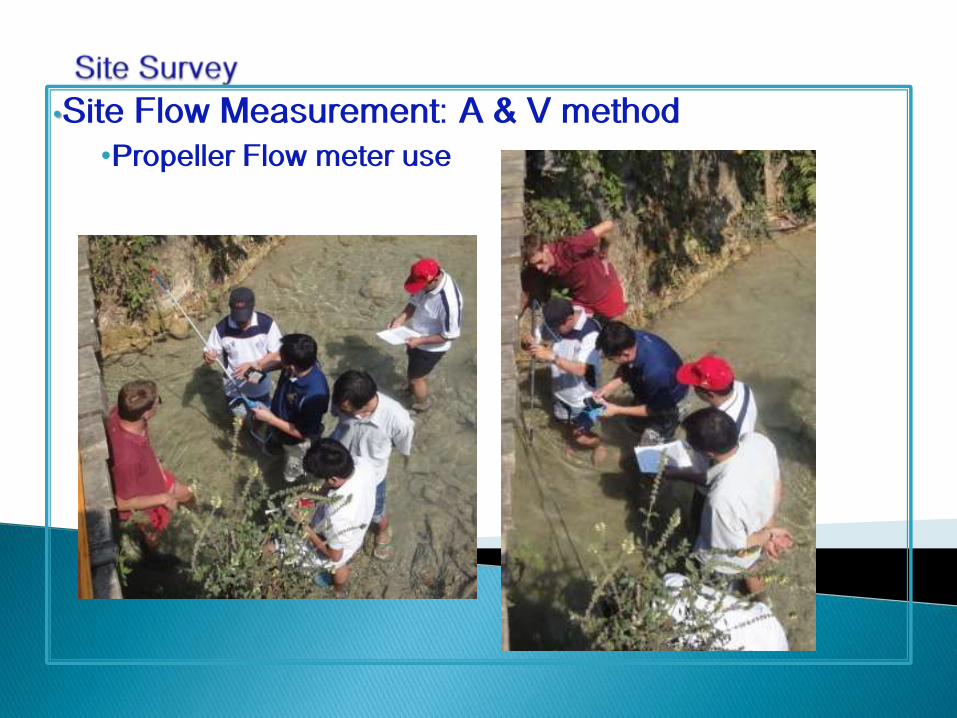
• Site Flow Measurement: A & V method
•Propeller Flow meter use
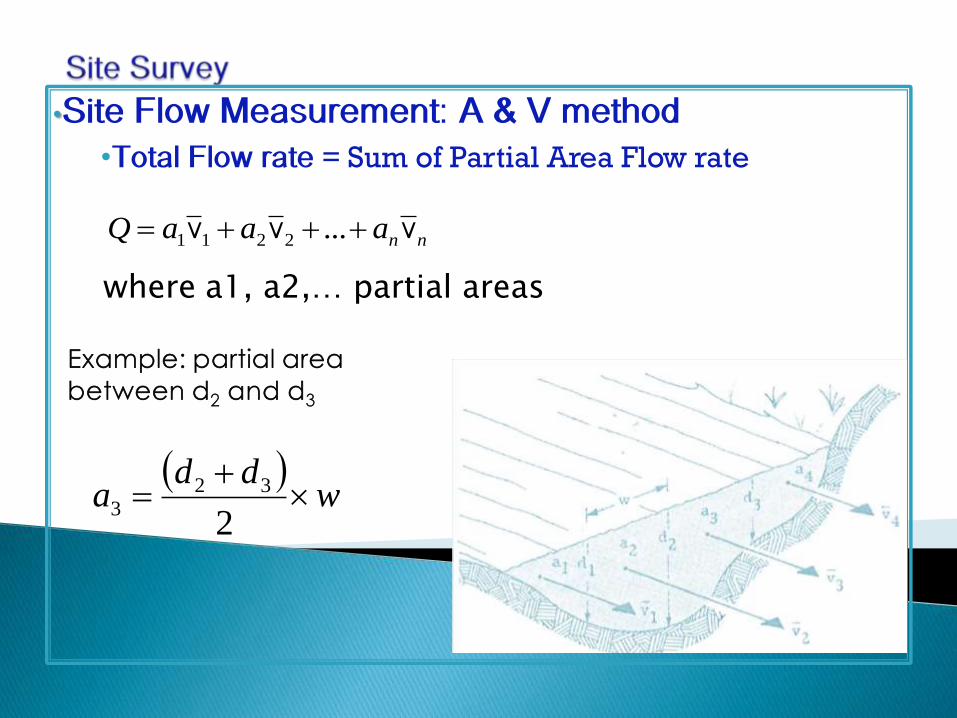
• Site Flow Measurement: A & V method
•Total Flow rate = Sum of Partial Area Flow rate
nnaaaQ vvv ...2211
w
dda
2
323
wherea1, a2,… partial areas
Example: partial area between d2 and d3
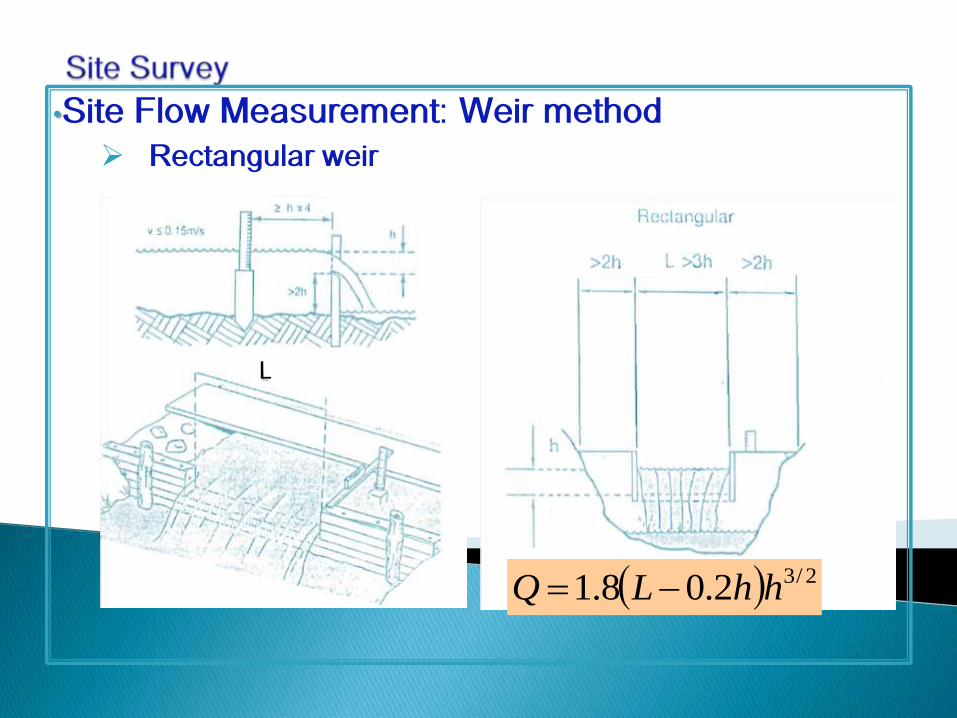
• Site Flow Measurement: Weir method
Rectangular weir
2/32.08.1 hhLQ
L

• ວັດແທກອດັຕາການໄຫຼຂອງແມ່ນ າ ້້(Site Flow
Measurement)
ວິທີສ າງຝາຍກັ ນນ າ ້້ແ້ລະປ້ະຕູປ້່ອຍນ້ າ ້້ຊະນິດອ ່ນໆ
ປະຕູສາມຫຼ່ຽມ້(ມຸມສາກ) ປະຕູເປັນຮູບຄາງໝ ູ
2/54.1 hQ 2/39.1 LhQ
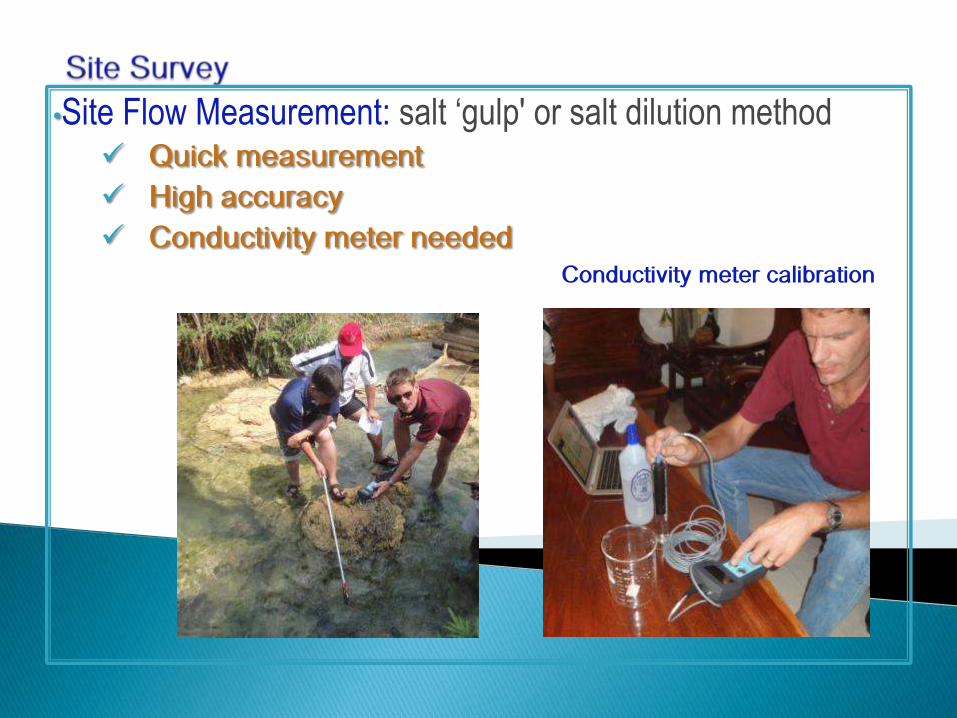
• Site Flow Measurement: salt ‘gulp' or salt dilution method Quick measurement
High accuracy
Conductivity meter needed
Conductivity meter calibration
Thank You !