design evolution gate vibratins
DESCRIPTION
vibTRANSCRIPT

SPE/IADC 163503
Design Evolution of Drilling Tools to Mitigate Vibrations J. R. Bailey, SPE, ExxonMobil Development Company, C. C. Elsborg, SPE, ExxonMobil E&P Norway AS, R. W. James, SPE, P. E. Pastusek, SPE, M. T. Prim, SPE, W. W. Watson, SPE, ExxonMobil Development Company
Copyright 2013, SPE/IADC Drilling Conference and Exhibition This paper was prepared for presentation at the SPE/IADC Drilling Conference and Exhibition held in Amsterdam, The Netherlands, 5–7 March 2013. This paper was selected for presentation by an SPE/IADC program committee following review of information contained in an abstract submitted by the author(s). Contents of the paper have not been reviewed by the Society of Petroleum Engineers or the International Association of Drilling Contractors and are subject to correction by the author(s). The material does not necessarily reflect any position of the Society of Petroleum Engineers or the International Association of Drilling Contractors, its officers, or members. Electronic reproduction, distribution, or storage of any part of this paper without the written consent of the Society of Petroleum Engineers or the International Association of Drilling Contractors is prohibited. Permission to reproduce in print is restricted to an abstract of not more than 300 words; illustrations may not be copied. The abstract must contain conspicuous acknowledgment of SPE/IADC copyright.
Abstract The development of methods to characterize the relative vibration tendency of alternative bottomhole assemblies (BHA) has enabled deliberate tool redesign to reduce vibrations. To achieve the greatest benefit, tool redesign is most effective if applied early in the tool design cycle where important configuration parameters are most easily adjusted. This paper outlines several design issues that need to be resolved so the future generations of tools have inherently lower vibration levels.
The use of multiple special-purpose tools (such as logging tools, rotary steerable assemblies, and ream-while-drilling tools) generates significant constraints on BHA configuration options. A redesign methodology to achieve lower vibration indices can be used to investigate modified components, dimensions, and configurations to select the best BHA configuration for specific drilling operating conditions.
Case studies are used to investigate BHA designs with flex stabilizers above rotary steerable tools. The flex stabilizer comprises a stabilizer with a smaller diameter connecting flex sub to facilitate rotary steerable directional objectives. It is typically wired for tool signals and is frequently run by vendors. In another case study, the spacing below a reamer is evaluated and drilling data is compared to other assemblies in the same formation. In this example, the spacer provides an increase in the distance between contact points to allow both the stabilizer and reamer to seek the centerline with less interference. The fourth case study evaluates changing contact locations in the BHA by swapping the order of logging tools resulting in different borehole contact positions. Finally, a theoretical study illustrates how changing BHA components and dimensions affect the model vibration indices.
The operator has field experience with BHA redesign that has directly led to significant improvement in drilling performance. The benefits include higher rate of penetration (ROP), longer time on bottom, less wear of drilling tool components, and reduced frequency of trips.
Introduction There are numerous combinations of drilling tools used in the industry because of innovations in the measurement while drilling (MWD), logging while drilling (LWD), rotary steerable system (RSS), and ream-while-drilling (RWD) technologies. These tools are configured to suit a variety of geological and drilling requirements. There is increasing need to configure these tools into bottomhole assembly systems that are truly designed as “systems” in the fullest sense of the word. It is desirable for these tools to have low dynamic vibration tendencies over the expected operating range to maximize drilling performance and increase the cost effectiveness of these services. There are examples where this has led to improved log data as the borehole quality and tool response have improved, wherein the borehole quality is determined by the absence of oversize, undulating, or spiral well profiles (i.e., where a cylindrical borehole has been achieved).
The operator has conducted hundreds of dynamic simulations and field trials of drilling assemblies and has reconfigured most of these designs to seek enhanced drilling performance. Certain tool characteristics impact performance predictions as determined by this model. These characteristics may be basic features of the tools or tool configurations that may not be associated with drilling performance limiters. Upon reconfiguration, most of these assemblies have been found to have improved drilling performance, as determined by MWD vibration sensors, wear patterns, tool life, and MSE. In certain cases, recognizing these effects early in the design process would reduce the need for remedial efforts to reconfigure the assembly designs. In other cases, desirable changes could not be accomplished because of a required tool order in the string for directional, geometric, connectivity, power, or LWD objective requirements.
The Appendix to this paper provides a brief description of the lateral dynamic model. There is also a discussion of the physical principles of the lateral dynamic bending modes that govern contact point selection. Each span between contact

2 SPE/IADC 163503
points has a series of natural frequencies and associated wavelengths that vary to first order with the basic property (OD/L2) and the appropriate boundary conditions of each span, where OD is the collar outer diameter and L is the length between contact points (see Appendix). Many common span properties and their operating conditions (primarily rotary speed) place these sections close to their natural frequencies. The boundary conditions are dynamic and complex because these spans are linked end-to-end and because there is an axial load in the BHA that is compressive while drilling to apply weight to the bit and tensile when reaming or rotating off bottom. Compression effects tend to reduce the span natural frequencies and tension increases the frequencies. The two static boundary conditions provided in the appendix are textbook cases that indicate a range of conditions that may be present in the absence of axial load. Since there are multiple modes of interacting spans of pipe placed end-to-end, with applied axial load, it is not surprising that a computer model can be very helpful. Nevertheless, several of the basic physical principles are easy to understand, although sometimes intuition may not be able to quantitatively weigh competing factors for which the model results are the ultimate arbiter.
In practice, it has been found that stabilizers and other points of contact (e.g., reamers and logging tool antennae) are typically located for static bending and steering considerations. Static bending loads are rarely the cause of BHA failures, and dynamic stability modeling is not typically used in the design phase. When a designer places a stabilizer or other contact point at a position along a BHA string, he or she is saying, “This location will be centralized and have zero lateral displacement.” Putting two of these back-to-back further states, “And these will both be centralized.” The location of the first point of contact above the bit is also an important consideration, and general machining theory would suggest that close spacing of the first support would provide lower vibration levels.
Each natural frequency has an associated wavelength of vibration. If the distance between neighboring contact points is much less than the wavelength of the dominant vibration mode, the lateral bending wave will not be disrupted and the wave will see one contact point. As the distance between contacts increases, the wave no longer sees a single contact and both are individually affected by the wave. The only way both points can remain centralized is for at least one, maybe both, to be forced to the centerline with a high dynamic side force. Since this dynamic side force acts with the radius of the wellbore and with an appropriate coefficient of friction, the dynamic side force generates a dynamic reactive torque. This reactive torque generates stick-slip vibrations within the BHA proper in addition to any stick-slip provided at the bit. As conditions worsen, the dynamics become less adequately represented by a linear model and the nonlinear effects grow in amplitude. These nonlinearities tend to generate a lot of vibration. As the span length continues to increase, for example above the top stabilizer, the natural frequency decreases and the interference between the nodes decline.
Friction is an important nonlinearity. Field results often show the presence of extreme friction wear on downhole components. Stick-slip is commonly seen in drilling today and the contribution of the BHA design to this problem is not fully appreciated, despite the number of stabilizers and other contacting components that are pulled from the wellbore with obvious friction wear on the exterior surfaces.
The objective of proper BHA lateral vibration mitigation at the design phase is to place the contacts at non-interfering locations. Furthermore, sweet spots in the BHA response may be obtained at specific, targeted rotary speed ranges via redesign of the contact spacings.
This work has been part of the operator’s drilling performance program that is well represented in the literature (Dupriest et al. 2005a; Dupriest et al. 2005b; Remmert et al. 2007). There are several references on drilling vibrations (Dareing 1984; Mitchell and Allen 1987; Spanos and Payne 1992; Payne 1992; Chen and Wu 2007). The methods described in this paper have been previously published although these did not include the case studies and specific concepts discussed in this paper (Bailey et al. 2008a; Bailey et al. 2008b; Bailey et al. 2010a; Bailey et al. 2010b).
Case Study No. 1: Rotary Steerable System Redesign In the first case study, the drilling results for two 17.5-inch BHA runs are compared. The two assemblies shown in Fig. 1 are identical except the first BHA-1A has a flex stabilizer above the RSS approximately 15 ft from the bit. The second assembly, BHA-1B, has a standard stabilizer with no flex sub. The bits for these runs were identical designs and both were new. Note that certain aspects of this case study were discussed in a prior SPE paper (James et al. 2012). However, that paper did not address BHA redesign to achieve a specific dynamic performance, which is the topic of this paper.
Fig. 1—BHA-1A has a flex sub above the RSS, BHA-1B does not have a flex sub.

SPE/IADC 163503 3
Fig. 2 shows a set of model results for the two designs. BHA-1A has a sweet spot at about 110 RPM in the Flex 1X mode results. BHA-1B has a broader, lower sweet spot centered about 160 RPM, and the characteristic rises more slowly for higher and lower RPM. Lower vibration indices are preferred and BHA-1B would be preferred to BHA-1A for operations above 120 RPM based on the vibration model results.
Fig. 2—Flex (left) and Twirl (right) model results for the two BHA designs. These assemblies were run in close offset wells in similar formations at similar depths, and the acquired drilling data
included lateral vibrations in gravity units “g.” Fig. 3 shows the lateral vibration data distribution by RPM and vibration level bins, and it is apparent that BHA-1A saw significantly higher lateral vibrations. In fact, the average lateral vibration level was 1.8 g for BHA-1A and 0.6 g for BHA-1B, a ratio of 3 to 1. Incidentally, the Flex 1X vibration index value in Fig. 2 at 160 RPM is about three times higher for BHA-1A, nearly the same ratio.
Fig. 3—Lateral vibration distribution as a function of RPM for the two runs.
Fig. 4 provides additional details. Here, the vibration level is shaded from blue at zero g, to red at 2 g. These scatterplots
of data versus RPM (x-axis) and weight on bit (WOB) (y-axis) suggest that for BHA-1A, The data indicates a sweet spot in the 110-140 RPM range for WOB less than about 28 klb. No sweet spot zones of less than 1.0 g lateral vibration exist above 30 klb WOB.
Whereas for BHA-1B, The data shows a broad sweet spot about 160 RPM, up to 50 klb WOB. Higher lateral vibrations are seen at high WOB below 140 RPM and for all WOB above 180 RPM.
These observations indicate a loss of lateral stability in BHA-1A relative to BHA-1B.

4 SPE/IADC 163503
Fig. 4 —Lateral vibration data for BHA-1A and BHA-1B shows sweet spots and higher vibes for BHA-1A (James et al. 2012).
There were two changes that led to the increased lateral vibrations in BHA-1A and were exacerbated at higher WOB:
(1) the flex sub increased the span length between the RSS stabilizer and the string stabilizer above the MWD, and (2) the flex sub increased the span flexibility as a result of the OD reduction (that is, after all, why it is called a “flex sub”).
The model may be used to identify compensating design changes that could be used in those cases for which flex subs are found to be necessary to achieve directional objectives. In this particular application, the operator likes to drill at about 140 to 180 RPM. The curves in Fig. 2 show that BHA-1A does not have a sweet spot at this rotary speed range. The model result is confirmed by the data in Fig. 4.
An alternative configuration (BHA-1C) can therefore be devised by adjusting the distance to the stabilizer above the MWD until the sweet spot is at the desired rotary speed. This stabilizer needs to be repositioned closer to where it is on BHA-1B, which was properly tuned for the desired operating range.
In Fig. 5, BHA-1C has a stabilizer placed at a position on the MWD tool that is similar to the stabilizer of BHA-1B. To offset the increased flexibility (reduced stiffness) from the flex sub, the midpoint of the blade is actually modeled to be 1 ft closer to the bit. The effective OD for the beam including the flex sub has been reduced and this is compensated by a slight shortening of the span length.
Fig. 5—Three BHA designs, BHA-1C has modified stabilizer position to adjust the sweet spot to the desired operating range. Model results for the three BHA configurations are provided in Fig. 6. Note the sweet spot for BHA-1C can be centered
at 160 RPM just like BHA-1B; however, the level is slightly higher. Therefore, BHA-1C should have a sweet spot at 160 RPM but would be expected to run at slightly higher vibration levels. Dynamically, the desired sweet spot rotary speed is obtained with a slightly less stiff BHA. Note BHA-1C will have an effective stiffness between that of BHA-1A and BHA-1B for steering purposes. The axial load lateral stability limit is lower than BHA-1B because of the reduction in stiffness, but it would be greater than BHA-1A because of the shorter span length. Further analysis or empirical results would be required to quantify the lateral stability of the modified design and to determine the effect on steering response of the modified stabilizer position.

SPE/IADC 163503 5
Fig. 6—Flex and Twirl model results for three BHA designs.
This example highlights one approach to tune bottomhole assemblies. Place tool components without stabilization elements according to their functions in the BHA and then determine the optimum stabilization contact locations using an appropriate vibrations model. Those tools with fixed contact points should be spaced at appropriate locations determined by the model. Then adjustable stabilizer spacing requirements might be accomplished with suitable relocatable stabilizers that can be positioned to deliver the BHA with the lowest possible vibration indices at the preferred drilling conditions.
This observation suggests that development and qualification of such relocatable stabilizers could be a high priority activity to enable tuning of BHA designs in the field to meet desired dynamic performance objectives. Additionally and alternatively, wired pup subs could be available in the field to insert where needed to modify the dynamic response of the BHA design. Such spacers have been requested on occasion. There are associated risk/benefit tradeoffs to consider in each approach.
Case Study No. 2: Another Flex Sub Lateral Stability Example It is frequently said the first three contacts determine the directional behavior of a BHA. A supporting argument may be the analogy that two points determine a line and three points set an arc. Given the beam equation is a fourth-order differential equation, one might be tempted to say the first four contacts determine the lateral stability of a BHA. These first two case studies support that hypothesis.
In this case study, the first three contacts were also the same for two BHA designs used to drill a certain hole section. The fourth contact point was also different in this case, and different dynamic results were also observed. The BHA designs used rotary steerable and MWD tools to drill a 17-1/2-in. hole section. Both drilling BHA designs used a flex stabilizer above the RSS. The two differences between the BHA designs (BHA-2A and BHA-2B) are: (1) the use of a long or short extension sub placed between the MWD and the flex stabilizer above the RSS tool, and (2) the presence or absence of an undergauge stabilizer above the MWD tools.
The principles are similar to those seen in Case Study No. 1. Although the team tried to obtain a standard wired stabilizer without a flex sub, it could not be provided to the rig in time for the run. However, the vibrations model can be used to investigate these alternative configurations.
Modeling of Independent Component Changes
The two BHA designs used to drill are shown in Fig. 7. BHA-2A had a long extension (LE) and an undergauge stabilizer (UGS). The second field configuration BHA-2B had a short extension and no undergauge stabilizer. To examine the effects of the UGS alone, BHA-2A-1 has the LE but no UGS. Design BHA-2A-2 has a short extension (SE) and the UGS to evaluate the change of just the extension length.
Fig. 7—Family of BHA designs with short or long extensions and with or without undergauge stabilizers.

6 SPE/IADC 163503
Corresponding model results are provided in Fig. 8 for WOB of 15 klb (value taken from the drilling results) in a slightly different format than seen in previous figures. The upper left quadrant shows the BHA Strain Energy index root mean square (RMS) average for the Flex 1X, 2X, and 3X modes. The upper right quadrant shows the BHA Strain Energy Flex 1X mode by itself. The fundamental mode of the lateral flexural bending is thought to be an important criterion. The lower right quadrant illustrates the Transmitted Strain Amplitude Flex 1X mode, which is a measure of the excitation passing into the lower HWDP. The lower left quadrant provides the BHA Strain Energy Twirl mode results showing the sensitivity of the assembly to unbalanced mass centrifugal effects.
Fig. 8—Model results are provided for the four designs of Fig. 7. The target operating range is 140 to 150 RPM. One may approach an analysis of these results using a low-point ranking system. First, the target operating range is
identified as 140 to 150 RPM. Each model result is evaluated in turn and summarized in Table 1. BHA-2B and BHA-2A-1 are tied for first place, and BHA-2A and BHA-2A-2 are tied for last place. BHA-2B has a good BHA Strain Energy Flex mode RMS result, and reasonably good Flex 1X result, and it has the lowest Twirl index values. Using the learnings in Case Study No. 1, wherein the increase in span length reduced the lateral stability limit of the assembly, BHA-2B might be the best option of the group for a first run selection.
Table 1 Ranking of Results for the 140 to 150 RPM Range
Drilling Results for Case No. 2 The model results show that BHA-2B would be expected to perform better than BHA-2A. BHA-2A was used to drill the
first 5340 ft of hole section, and BHA-2B completed the remaining 2850 ft of the interval. Fig. 9 presents the WOB, RPM, mechanical specific energy (MSE, kpsi), and maximum lateral vibrations for the two intervals as population histograms plotted as a function of depth. A few key observations are:
The WOB was lower for BHA-2A and more variable. The RPM values were relatively even in the two runs, with slightly higher RPM for BHA-2B. The MSE trend increased as a function of depth, representing increasing drilling torque in this high angle well or
harder rock as depth increased, or both. The MSE was relatively more scattered for BHA-2A, whereas the MSE increased in specific zones for BHA-2B that likely represented hard formation streaks.
The lateral vibrations were noticeably higher, by almost 1 g, for the BHA-2A run than for the BHA-2B run – even though the MSE was lower. The higher Twirl and mixed Flex mode results put BHA-2A at a disadvantage. It may also have had a lateral stability problem similar to BHA-1A in the first case study.
BHA‐2A BHA‐2A‐1 BHA‐2A‐2 BHA‐2B
Extension Length Long Long Short Short
Under‐Gauge Stab Yes No Yes No
Flex RMS Rank 4 2 3 1
Flex 1X Rank 2 1 4 3
Flex Trans 1X Rank 3 1 4 2
Twirl Rank 4 3 2 1____ ____ ____ ____
Total Points 13 7 13 7

SPE/IADC 163503 7
Fig. 9—Population histograms of WOB, RPM, and MSE for BHA-2A and BHA-2B runs.

8 SPE/IADC 163503
Model Evaluation of Flex Stabilizer Replacement The team attempted to use a standard wired stabilizer as a replacement for the flex stabilizer, but this was not logistically
possible for this run. The vibrations model can be used to evaluate what possible benefits there may be to such a substitution. Fig. 10 illustrates the BHA designs and the alternatives that have a standard wired stabilizer replacing the flex stabilizers.
BHA-2AX is the non-flex design corresponding to BHA-2A, and BHA-2BX is similarly related to BHA-2B. The Flex 1X mode and Twirl results for these four designs are shown in Fig. 11. These results show that:
BHA-2BX has the lowest Flex and Twirl results for the 140-170 RPM operating range. It is clearly the dominant winner of this design competition as it is first in all categories.
BHA-2AX is an improvement over BHA-2A in that both Flex and Twirl indices are lower.
Fig. 10—Schematics for BHA-2A and BHA-2B and their non-flex stabilizer counterparts. The model results are encouraging. When a flex stabilizer component above a RSS tool can be replaced with a non-flex
standard stabilizer, the model results show lower vibration indices and drilling performance is expected to improve. This was also seen in Case Study No. 1. However, it may not always be possible to remove the flex sub due to directional constraints, but there should be components on hand to make a ready switch in the event that a BHA is pulled and it is determined that additional directional work is likely to be only small corrections with low doglegs.
Fig. 11 —Vibration model results for BHA-2A and BHA-2B and their non-flex designs.

SPE/IADC 163503 9
Case Study No. 3: Stabilization of a Ream-While-Drilling BHA An increasingly common BHA design problem is choosing stabilization components above and below RWD tools. It is
common practice to place a stabilizer immediately below the reamer. Many vendors suggest this configuration, although current RWD tools tend to be internally self-stabilizing and are advertised as such. Another BHA design issue concerns spacing between the RWD and the main body of the BHA. Some vendors require several joints of HWDP between the top of the BHA and the reamer to ensure isolation of the tools in the BHA from vibrations generated by the reamer, but some vendors do not have such a requirement.
In this case study, back-to-back BHA runs in a salt formation provided the opportunity to compare the performance of three different assemblies with nearly identical formation properties. The use of optimized drilling assemblies before and after the reamer provides a comparison basis to assess the RWD assembly performance.
First, after drilling a hard formation, a 16-1/2-in. bit and BHA drilled 1870 ft of salt using a bit that was graded a “4-4.” It is most likely the bit damage occurred prior to the top of the salt formation; this is BHA-3A. Pipe was set and drilled out with a simple 12-1/4-in. bit (not discussed herein). Then, a 14-3/4 x 12-1/4-in. RWD assembly with MWD and two LWD tools was used to drill 2150 ft. This is BHA-3B, which is modeled with two configurations BHA-3B1 and BHA-3B2 as described further below. The bit for this run was graded “1-1.” After setting pipe, a 10-5/8-in. bit and BHA with MWD/LWD tools was used to drill through the base of the salt and beyond; this is BHA-3C. This bit was graded “2-1” after drilling 2466 ft. These assemblies are illustrated in Fig. 12.
Fig. 12—BHA-3 design configurations for modeling.
In the lateral vibrations modeling, there is both art and science to representing undergauge contacts. There is not
necessarily a “right” answer, but the different cases can often be addressed in a sensitivity analysis. An undergauge component may not make contact in a tangent hole section, depending on the contact conditions of its neighbors, but in a curved borehole interval, it may make hard contact. Thus, the contact conditions may be modeled both ways and the differences evaluated using both assumptions. If a BHA redesign results in lower vibration indices for both cases, then the model can be used advantageously regardless of the contact assumption for the undergauge component.
Stabilizers above a reamer are typically undergauge unless expandable components are used. The black dots along the x-axes in Fig. 12 indicate nodal points in the model. Note the only difference between BHA-3B1 and BHA-3B2 is the latter model does not have a black dot around 150 ft from the bit. Thus, in BHA-3B2, the nodal point of the intermediate undergauge contact is turned off, therefore, this stabilizer is not modeled as having a zero lateral displacement constraint at this location. In BHA-3B1, this nodal point constraint is turned on. In both models, the top undergauge stabilizer is considered to be a node. A static model analysis shows that this node is in contact but the intermediate stabilizer may not be.
Fig. 13 provides the model results for all four configurations. The Flex and Twirl vibration indices for BHA-3B1 and BHA-3B2 are higher than those for BHA-3A and BHA-3C by a significant margin. Except for a limited RPM range, the Flex indices for BHA-3B are more than double the others, no matter which nodal point assumption is made for the first undergauge contact. The Twirl indices show wider deviations in the model results, and the comparative Twirl values for BHA-3A are very low while those for BHA-3C are practically zero. Based on the model results, there should be a marked difference in drilling performance.

10 SPE/IADC 163503
Fig. 13—Model results for the BHA-3 design configurations.
Drilling data for this 4500-ft interval are provided in Table 2 and in Figs. 14 and 15. The data shows that BHA-3B had more difficulty drilling through this interval bounded by intervals with larger and smaller hole sections above and below. The WOB and RPM operating parameters were roughly equivalent, yet BHA-3B experienced the slowest ROP, the highest MSE, the highest shocks, and the highest stick-slip amplitude.
These drilling results are aligned with the model results. The next interesting question is therefore related to redesign of the BHA for RWD tools. How can these results be improved? The BHA vibrations model can be used to evaluate design alternatives that may have lower vibration characteristics.
Table 2
Run Data for Case Study No. 3
(*) The damage to this bit occurred prior to entering the salt formation. (+) This bit drilled an additional 2120 ft after drilling out of the base of salt.
Fig. 14—Drilling data for the BHA-3A, BHA-3B, and BHA-3C runs.
BHA Hole Size Interval (ft) ROP (ft/hr) Avg. MSE (ksi) Dull GradeBHA‐3A 16.5‐inch 1,870 48.6 76 4-4-BT-A-X-2-CT-TD (*)
BHA‐3B 14.75 x 12.25‐inch 2,150 29.8 129 1-1-NO-A-1-0-NO-TD
BHA‐3C 10.625‐inch 350 62.1 95 2-1-CT-G-X-0-NO-TD (+)

SPE/IADC 163503 11
Fig. 15—Drilling data for three different bit and BHA runs in a 4500-ft salt formation. The first BHA had been used to drill a tough formation and had an impaired bit at the top of the salt. Improved RWD Assembly Design
The vibrations model can be used to evaluate alternative BHA designs for RWD tools. In Fig. 16, the BHA-3B2 assembly is illustrated, where the “2” indicates that the second model is used that does not have a nodal point at the first undergauge stabilizer. Why was this model chosen and not BHA-3B1? Looking at Fig. 13, the differences between the model results for BHA-3B1 and those for the other two assemblies would indicate even greater difference in performance results than what was observed. Therefore, using empirical reasoning, it is likely for this vertical hole interval, the BHA-3B2 model most accurately represents the observed results. In addition, field results for a similar BHA in another well, not discussed in this paper, suggested the same conclusion in a similar situation.
12 SPE/IADC 163503
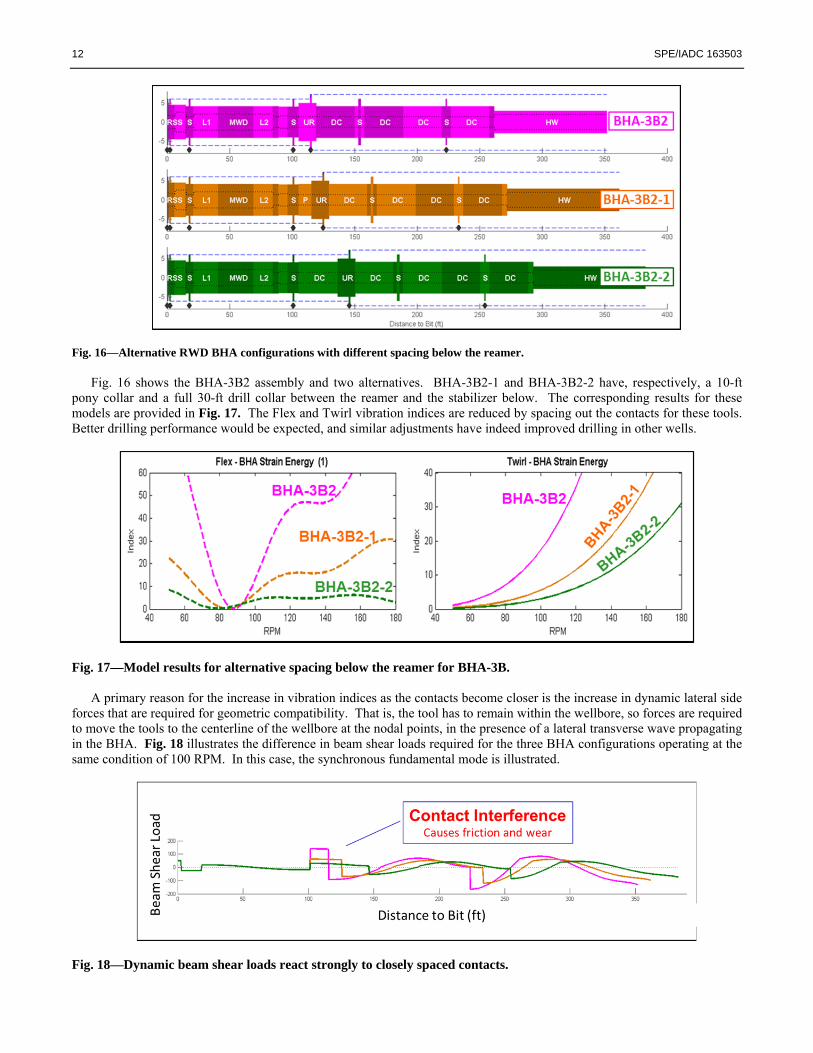
Fig. 16—Alternative RWD BHA configurations with different spacing below the reamer. Fig. 16 shows the BHA-3B2 assembly and two alternatives. BHA-3B2-1 and BHA-3B2-2 have, respectively, a 10-ft
pony collar and a full 30-ft drill collar between the reamer and the stabilizer below. The corresponding results for these models are provided in Fig. 17. The Flex and Twirl vibration indices are reduced by spacing out the contacts for these tools. Better drilling performance would be expected, and similar adjustments have indeed improved drilling in other wells.
Fig. 17—Model results for alternative spacing below the reamer for BHA-3B.
A primary reason for the increase in vibration indices as the contacts become closer is the increase in dynamic lateral side forces that are required for geometric compatibility. That is, the tool has to remain within the wellbore, so forces are required to move the tools to the centerline of the wellbore at the nodal points, in the presence of a lateral transverse wave propagating in the BHA. Fig. 18 illustrates the difference in beam shear loads required for the three BHA configurations operating at the same condition of 100 RPM. In this case, the synchronous fundamental mode is illustrated.
Fig. 18—Dynamic beam shear loads react strongly to closely spaced contacts.

SPE/IADC 163503 13
These dynamic contact loads become dynamic torques through the rolling radius and the effect of friction. This is one reason why roller reamers are beneficial (Sowers et al. 2009) – they provide restoring forces while generating much less torque. Note that once the system is aggravated by a high contact location, the disturbance continues along the remainder of the BHA. Another factor that is not included in the model is the presence of nonlinear effects. As these high loads interact and cause reactions within the BHA, nonlinear effects are generated. The further the system departs from linearity, the worse things get. Case Study No. 4: LWD Tool Configuration Redesign In two other wells, five bit and BHA runs were required to drill two long 12-1/4-in. intervals. In the first well, two BHA styles were used because the final run did not require one of the formation evaluation (FE) tools. In the second well, a different BHA configuration was obtained by swapping the order of two MWD/LWD tools in the BHA from the first well. Two bit designs were used in each well providing for an interesting comparison set as seen in Table 3.
Table 3
Run Data for Case Study No. 4
Predrill BHA Redesign
Prior to drilling, a significant effort was made to identify and optimize redesign candidates. From an Initial design, a “Target” redesign configuration was identified that had the lowest possible vibration indices. This was determined by evaluating model results in comparison with a record offset well interval that had the minimum MWD-LWD tool suite. In Figs. 19 and 20, this BHA is identified as the “Best Case” configuration. Therefore, the goal was to drive the redesign Target to the Best Case, which was nearly achieved.
Fig. 19—Initial, Target, and Best Case BHA designs for Case Study No. 4.
BHA Design BHA Detail Bit Design Interval (ft) ROP (ft/hr) Dull GradeWell 1 Configuration A BHA‐4A1 Bit 1 6921 162 2-2-CT-A-X-0-BT-DTF
Configuration A BHA‐4A2 Bit 2 6313 99 2-2-WT-A-X-0-CT-DTF
Configuration B BHA‐4B Bit 1 987 84 1-1-CT-A-X-0-NO-TD
Well 2 Configuration C BHA‐4C1 Bit 2 6560 189 2-1-CT-C-X-0-ER-DTF
Configuration C BHA‐4C2 Bit 1 7656 91 2-2-WT-A-X-0-CT-TD

14 SPE/IADC 163503
Fig. 20—Vibration model results show considerable improvement from the Initial BHA design. Based on the values of the vibration indices, as may be seen by comparing the numbers for the Flex indices of Fig. 20
(y-axis scale runs to a value of 150) with similar prior charts, there seems to be significant improvement possible by seeking the Target BHA design. The scales of the graphs vary by one to two orders of magnitude.
BHA Configurations Selected for Case Study No. 4
The first BHA design selected for drilling (BHA-4A) was a compromise design that achieved improvement in the model results. It included two spacers to reposition the contact locations and was similar in certain respects to other BHA designs that had been run locally. It was a comfortable choice at the time. The second design (BHA-4B) was similar to the Best BHA configuration because the final interval in Well 1 did not require the LWD2 tool. The placement of this tool tended to increase the vibration indices in most of the configurations that were modeled. In the second well, the BHA-4C configuration was selected for both runs to seek a design closer to the Target model results.
Fig. 21 provides the BHA configurations for each run. It may be noted that often the BHA is not modeled up to the jars, but in this case, there was a single joint of HWDP below the jars so the jars were included in these models. However, the trends in the results and the conclusions generally do not change whether or not the jars are modeled.
Fig. 21—Drilling design configurations for BHA-4 cases. Fig. 22 shows the vibration model results for the five drilling assemblies. The BHA-4A configuration results in Fig. 22
show significant improvement over the Initial BHA design results provided in Fig. 20. One may note that small differences in the model results in Fig. 22 for the BHA-4A and BHA-4C design variations may be attributed to small differences in component dimensions, crossovers, placement of jars, filter subs, saver subs, etc. In fact, some BHA designs are quite resistant to small changes in geometry, whereas others are more sensitive to length changes on the order of a few feet. It has also been found that some BHA designs have vibration indices that are almost insensitive to WOB changes, whereas others may be very sensitive to WOB. These are interesting observations that provide opportunity for further BHA tuning.

SPE/IADC 163503 15
Fig. 22. Model results for the BHA-4 configurations used to drill Wells 1 and 2.
Drilling Results The results of drilling the five intervals shown in Table 3 are displayed in Fig. 23, suggesting the following observations
and conclusions: The BHA-4C runs in Well 2 were operated at slightly lower WOB and RPM than the corresponding runs in Well 1. This
was a conscious decision by the drill team. The surface MSE tends to increase deeper in the well as BHA-4A2 and BHA-4C2 both have higher MSE values than the
corresponding BHA-4A1 and BHA-4C1 runs. However, the MSE for BHA-4B is lower than the preceding interval BHA-4A2, suggesting that the BHA configuration generates lower MSE values. The MSE values for BHA-4C1 and BHA-4C2 are both lower than their corresponding intervals in Well 1, further supporting that statement. Lower MSE values are correlated to lower vibration indices (see Fig. 22).
The lateral vibrations for BHA-4A1 and BHA-4A2 in Well 1 are higher than their counterparts in Well 2 (in agreement with the trends in vibration indices). BHA-4B would be expected to have lower lateral vibrations than the BHA-4C runs, but there may have been other differences in these wells that could have affected this result.
Stick-slip amplitude appears to decrease deeper in the well. Configurations BHA-4B and BHA-4C appear to have lower potential for stick-slip than the BHA-4A designs.
Fig. 23—Run data illustrate improved drilling performance for BHA-4B and BHA-4C relative to BHA-4A. Population histograms of the lateral vibration data as a function of RPM are provided in Fig. 24 for these five runs. There
is a significant reduction in vibrations apparent in BHA-4B relative to the BHA-4A runs. It is also clearly seen that the BHA-4C data shows a significant reduction in vibrations, to 0.25 g or less on average. Few data points in the charts for the BHA-4C configurations are in excess of 1.0 g.
In summary, this case study showed excellent correlation between vibration model results, MSE, and measured lateral vibrations. Drilling trends among five runs were in good agreement with predictions.

16 SPE/IADC 163503
Fig. 24—Lateral vibration data for the five runs show lower vibrations present in the BHA-4B and BHA-4C runs. Case Study No. 5: RSS/MWD/LWD Assembly Redesign
The final case study uses the vibration model to investigate alternative configurations of logging tools to reduce or eliminate the interference between multiple tools on the same tool string, and subsequently to examine the effects of moving the position of first contact above the bit. This is a theoretical study that looks at some typical design configurations and alternatives to evaluate their vibration indices.
In Fig. 25, three variations of a rotary steerable with an MWD and two LWD tools are shown. In the first case, BHA-5A is configured such that there is sufficient standoff of LWD2 from the wall so that, given the proximity of the LWD1 below and Stabilizer above, one may comfortably neglect the possible wall contact of LWD2.
Consider a scenario in which, on a next-generation LWD tool design project, the lead engineer for LWD2 concludes the signals for his borehole measurements will be superior if the gap with the wall is closed to about 1/16 of an inch. Consequently, the tool diameter grows appreciably, on the order of 3/4 of an inch. The vibrations modeler can no longer ignore this as a potential nodal point and in BHA-5B the blade of the LWD2 tool is considered to be a node. In a horizontal wellbore, deflection of 1/16 of an inch over a span of 10 to 15 ft is almost certain in the best case. In the worst case, borehole patterns develop and interference is guaranteed by the irregular cylinder being cut by the tools.

SPE/IADC 163503 17
Fig. 25—Variations of LWD tool contacts. In an attempt to mitigate this configuration change, the vibrations modeler inserts a flex sub between LWD1 and LWD2,
arriving at BHA-5C. This adjustment is agreeable to all parties. Fig. 26 provides the vibration model results for these three cases. From a vibrations perspective, the best case is BHA-5A where there were simply two contact points at the beginning. The change in the LWD2 tool diameter has created a problem for the BHA dynamic modeler and he or she would like to have the old tool back. However, there is no turning back, and the operator uses the BHA-5C design.
Fig. 26—Vibration model results show effect of change in LWD contacts and partial mitigation. Through various technical meetings and teleconferences, there was a long dialog about dynamic models and the tool
geometries. The BHA modeler continues to seek improved tool configurations but is hampered by the available configurations. However, eventually on the successive generation, the LWD engineer concludes that, in fact, it is possible for the measurements of the two tools to be combined into a single tool that has one point of contact. Furthermore, working with mechanical engineers, the blades are so constructed that they can bear the normal load of a stabilizer and do not require a stabilizer above the LWD tool. These are considerable technical advances for the LWD engineer.
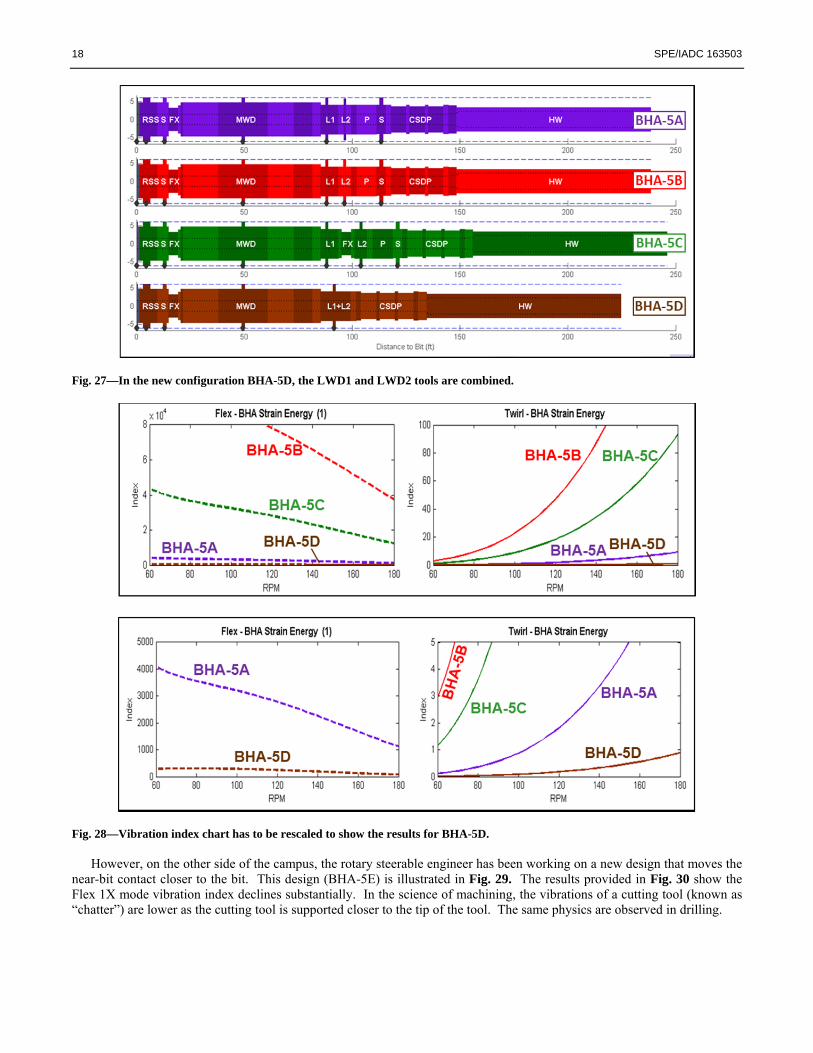
The vibrations modeler then plugs the new geometry into the model, and voila! The BHA-5D model provides an indication of how this BHA would be expected to perform. In Fig. 27, the new configuration has the LWD1 and LWD2 tools combined with a single load-bearing contact.
Certainly, artful engineering is required to combine these measurements into the same tool, and if it is feasible, then the results in Fig. 28 illustrate a considerable incentive for such a project. BHA-5D has significantly lower vibration indices than even the original BHA-5A configuration.
18 SPE/IADC 163503
Fig. 27—In the new configuration BHA-5D, the LWD1 and LWD2 tools are combined.
Fig. 28—Vibration index chart has to be rescaled to show the results for BHA-5D.
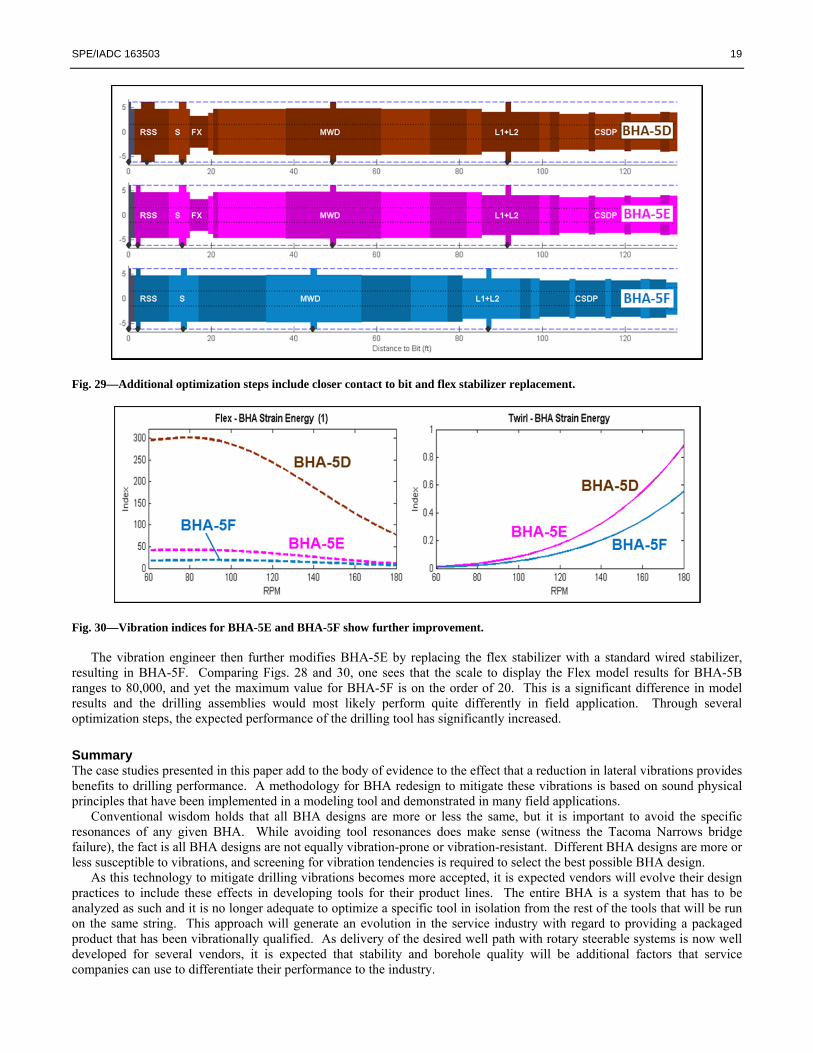
However, on the other side of the campus, the rotary steerable engineer has been working on a new design that moves the near-bit contact closer to the bit. This design (BHA-5E) is illustrated in Fig. 29. The results provided in Fig. 30 show the Flex 1X mode vibration index declines substantially. In the science of machining, the vibrations of a cutting tool (known as “chatter”) are lower as the cutting tool is supported closer to the tip of the tool. The same physics are observed in drilling.
SPE/IADC 163503 19
Fig. 29—Additional optimization steps include closer contact to bit and flex stabilizer replacement.
Fig. 30—Vibration indices for BHA-5E and BHA-5F show further improvement. The vibration engineer then further modifies BHA-5E by replacing the flex stabilizer with a standard wired stabilizer,
resulting in BHA-5F. Comparing Figs. 28 and 30, one sees that the scale to display the Flex model results for BHA-5B ranges to 80,000, and yet the maximum value for BHA-5F is on the order of 20. This is a significant difference in model results and the drilling assemblies would most likely perform quite differently in field application. Through several optimization steps, the expected performance of the drilling tool has significantly increased.
Summary The case studies presented in this paper add to the body of evidence to the effect that a reduction in lateral vibrations provides benefits to drilling performance. A methodology for BHA redesign to mitigate these vibrations is based on sound physical principles that have been implemented in a modeling tool and demonstrated in many field applications.
Conventional wisdom holds that all BHA designs are more or less the same, but it is important to avoid the specific resonances of any given BHA. While avoiding tool resonances does make sense (witness the Tacoma Narrows bridge failure), the fact is all BHA designs are not equally vibration-prone or vibration-resistant. Different BHA designs are more or less susceptible to vibrations, and screening for vibration tendencies is required to select the best possible BHA design.
As this technology to mitigate drilling vibrations becomes more accepted, it is expected vendors will evolve their design practices to include these effects in developing tools for their product lines. The entire BHA is a system that has to be analyzed as such and it is no longer adequate to optimize a specific tool in isolation from the rest of the tools that will be run on the same string. This approach will generate an evolution in the service industry with regard to providing a packaged product that has been vibrationally qualified. As delivery of the desired well path with rotary steerable systems is now well developed for several vendors, it is expected that stability and borehole quality will be additional factors that service companies can use to differentiate their performance to the industry.

20 SPE/IADC 163503
These practices will promote more efficient drilling, better borehole quality, reduction in NPT, greater tool reliability, and lower drilling costs. Some of these benefits have already been realized in operations, but service providers are encouraged to integrate these preferred practices into their initial design proposals to reduce the amount of BHA configuration redesign that is required.
It is also likely the tools will evolve in response to this knowledge. Logging tools will more efficiently use their wellbore contact, and different sensors may share the same wellbore contact point instead of being placed in adjacent positions with independent contacts, which raises the vibrations risk factor. Furthermore, this contact will be constructed as a load-bearing surface so nearby stabilizers will not be required.
As in several other areas of the oil and gas industry, progress will prevail and engineering based on sound physical principles will be applied. Does the cellist question that finger position along the strings of the instrument affects the resulting tones, and that combination of finger positions on multiple strings contributes to the totality of the sound generated by the instrument? Absolutely not! It has been drilled into him or her through years of practice. The musician has subliminally reduced the acoustics of the instrument down to the science of linear superposition. Now it is our turn.
Acknowledgements The authors are grateful for the support of ExxonMobil and its affiliates for permission to publish this paper. A note of special thanks is extended to Lei Wang for the graphics in Fig. 4 (James et al. 2012). All figures in this paper are original figures created by ExxonMobil.
References Bailey, J. R., E. A. O. Biediger, V. Gupta, D. Ertas, W. C. Elks, Jr. and F. E. Dupriest. 2008a. Drilling Vibrations Modeling and Field
Validation. Paper IADC/SPE 112650 presented at the IADC/SPE Drilling Conference, Orlando FL, 4-6 March. Bailey, J. R., E. A. O. Biediger, S. Sundararaman, A. D. Carson, W. C. Elks, Jr. and F. E. Dupriest. 2008b. Development and Application
of a BHA Vibrations Model. Paper IPTC 12737 presented at the International Petroleum Technology Conference, Kuala Lumpur, Malaysia, 3-5 December.
Bailey, J. R., L. Wang, M. J. Tenny, N. Armstrong, J. R. Zook, and W. C. Elks, Jr. 2010a. Design Tools and Workflows to Mitigate Drilling Vibrations. Paper SPE 135439 presented at the SPE Annual Technical Conference, Florence, 19-22 September.
Bailey, J. R. and S. M. Remmert. 2010b. Managing Drilling Vibrations Through BHA Design Optimization. SPE Drilling & Completion Journal. SPE 139426-MS.
Chen, D.C.K. and M. Wu. 2007. Maximizing Drilling Performance with State-of-the-Art BHA Program. Paper SPE/IADC 104502 presented at the SPE/IADC Drilling Conference, Amsterdam, 20-22 February.
Dareing, D. 1984. Drill Collar Length is a Major Factor in Vibration Control. Paper SPE 11228 presented at the SPE Annual Technical Conference, New Orleans, 26-29 September and published in the Journal of Petroleum Technology, April 1984.
Dupriest, F. E., J. W. Witt, S. M. Remmert, and D. R. Aberdeen. 2005a. Maximizing Rate of Penetration with Real Time Analysis of Digital Data. Paper IPTC 10706 presented at the International Petroleum Technology Conference, Doha, Qatar, 21-23 November.
Dupriest, F. E. and W. L. Koederitz. 2005b. Maximizing Drill Rates with Real-Time Surveillance of Mechanical Specific Energy. Paper SPE/IADC 92194 presented at the SPE/IADC Drilling Conference, Amsterdam, 23-25 February.
James, R.W., P. E. Pastusek, G. R. Kuhn, A. Andreev, J. R. Bailey, and L. Wang. 2012. Sucessful Optimization Strategies Combine to Deliver Significant Performance Boost at the Edge of the ERD Envelope, Sakhalin Island, Russia. Paper IADC/SPE150959 presented at the IADC/SPE Drilling Conference, San Diego, 6-8 March.
Mitchell, R. F. and M.B. Allen. 1987. Case Studies of BHA Vibration Failure. Paper SPE 16675 presented at the SPE Annual Technical Conference, Dallas, 27-30 September.
Payne, M. L. 1992. Drilling Bottom-Hole Assembly Dynamics. Ph.D. Thesis, Rice University. Remmert, S. M., J. W. Witt, and F. E. Dupriest. 2007. Implementation of ROP Management Process in Qatar North Field. Paper
IADC/SPE 105521 presented at the IADC /SPE Drilling Conference, Amsterdam, 20-22 February. Sowers, S. F., F. E. Dupriest, J. R. Bailey, and L. Wang. 2009. Roller Reamers Improve Drilling Performance in Wells Limited by Bit and
Bottomhole Assembly Vibrations. Paper IADC/SPE 119375 presented at the IADC/SPE Drilling Conference, Amsterdam, 17-19 March.
Spanos, P.D. and M.L. Payne. 1992. Advances in Dynamic Bottomhole Assembly Modeling and Dynamic Response Determination. Paper IADC/SPE 23905 presented at the IADC/SPE Drilling Conference, New Orleans, 18-21 February.
Glossary of Terms BHA – Bottomhole Assembly includes bit and tools up to the heavyweight pipe BHA Strain Energy – the length-averaged amount of bending strain energy due to deflections in the BHA up to the transition point above
which the Transmitted Strain Energy is calculated Flex Stabilizer – Comprises a stabilizer with a flex sub attached, sometimes as an integral unit, typically with a wire pass-through to enable
communication through the tool Flex Sub – Interconnecting link similar to a small pony collar that has full-size tool joints but includes a smaller OD section in the middle
to facilitate flexure, typically with wire pass-through for communication Flex Mode – Refers to the lateral in-plane bending excitation in the vibration model Flex 1X Excitation – Lateral in-plane flexural bending that is excited at 1X (one times) the rotary speed LE, SE – “Long Extension” and “Short Extension” subs represent tools that make drilling measurements but also serve as long or short
spacers, placed just above the rotary steerable tool in Case Study No. 2 LWD – Logging While Drilling refers to tools that make formation evaluation measurements while drilling

SPE/IADC 163503 21
MWD – Measurement While Drilling refers to tools that take survey measurements or other data while drilling, sometimes includes LWD as a broader term in which FE measurements are included
MSE – Mechanical Specific Energy is a measure of the amount of energy expended to remove a unit volume of formation RPM – Revolutions per Minute is a measure of the speed of rotation of the bit or BHA RSS – Rotary Steerable System provides for a steering head that can make directional changes to the well path while in rotating mode RWD – Ream While Drilling tools comprise a standard drilling system plus a reaming element to open the hole to larger OD Twirl Mode – Refers to the rotary centrifugal excitation in the vibration model UGS – Undergauge Stabilizer is a stabilizer with a blade that is smaller diameter than the corresponding hole size Vibrations Index – The vibration model output is determined over a given span of the BHA (lower or upper) and converted to an index to
provide a measure of the system response to the applied excitation WOB – Weight on Bit is the applied axial load acting on the bit Appendix A—General Description of the Lateral Dynamic Model
The lateral dynamic model of the BHA is an engineering tool that supports BHA redesign, configuration, and selection with an objective to mitigate lateral dynamic vibrations and BHA-induced stick-slip. Importantly, the tool enables the development of best practices for BHA design and thus can be used as an instructional device.
To facilitate this approach, the software is capable of simultaneous display and comparison of multiple BHA designs to identify the most vibrationally stable design for the anticipated operating parameters and well configuration. The method is a direct forced-response frequency-domain perturbation model. This is a fundamentally different design-based method that supports the redesign of performance limiters identified in the operator’s ROP management process (Dupriest et al. 2005; Remmert et al. 2007; Dupriest and Koederitz 2005). Model Development
Starting with a component description for a BHA, the model calculations proceed by subdividing the system into elements comprised of short sections of pipe, about ½ to 1 ft long each to build a lumped parameter model. The element mass is assigned to each node of the model and the nodes are connected with massless beam spring elements. A beam may be represented by a fourth-order differential equation, and therefore, this 2D model employs a state vector at each mass node comprising the lateral displacement in a plane, tilt angle relative to the centerline, bending moment, and beam shear load. An auxiliary state is used to apply external loads.
State transition matrices are calculated to represent each mass and beam element and by cascading these matrices, the state vector at one location can be related to the state vector at another location in the BHA. The calculations are initiated with certain boundary conditions at the bit and proceed up hole honoring contact constraints at stabilizers. Typically, a model may have several hundred mass elements and a corresponding large number of degrees of freedom.
The dynamic response is considered to be a perturbation from the static solution. Two vibration modes are characterized by the model, the first is bending in a plane in response to a lateral force applied at the bit (“Flex”), and the second is a rotational motion excited by centrifugal forces (“Twirl”). These two vibrational modes are illustrated in Fig. A1.
All BHA models are subject to the same input amplitude allowing the response of different BHA designs to be compared and ranked. In the lateral bending Flex mode, the dynamic side force at the bit is applied at integral multiples of the rotary speed. In the rotary Twirl mode, the mass elements are offset from the centerline by identical amounts for each BHA to investigate the stability of the BHA to eccentric mass and centrifugal forces. Often a considerable emphasis is placed on the fundamental 1X mode for the lateral bending Flex mode. The Twirl mode is only calculated for the synchronous 1X excitation. Simulation results are plotted for multiple BHA designs simultaneously in 2D or 3D displays of state vectors. Each model is run for several different end-lengths to investigate the effects of the uncertainty in the location of the node at the top.

22 SPE/IADC 163503
System Excitation The literature on drilling vibrations has long cited excitation at multiples of the rotary speed as relevant input parameters
(Mitchell and Allen, 1987). Analogies with machining practice support this approach. For the lateral vibrations model, the first three multiples (i.e., 1X, 2X, and 3X RPM) are typically used. Although higher multiples could be used, it is now believed that higher multiples do not propagate far and have diminished amplitudes. Vibration Indices to Capture Model Results
The state vector formulation is an efficient solution method, but it is cumbersome to present state vector results for a wide range of operating parameters that includes a sensitivity analysis of several end-lengths and excitation multiples. A single operating condition may be represented by dozens of state vectors, each of which may be a few hundred elements in length. These state vectors must be condensed to scalar values to efficiently represent each operating point. Consequently, vibration indices have been constructed to summarize the model dynamic performance.
Different vibration indices are constructed to represent the dynamics within the BHA proper and the vibration imparted up hole away from the BHA into the lower portion of the drillstring. The vibration indices include bending strain energy states for both the BHA and the transmitted pipe section, or upper BHA. The upper BHA in the model usually includes a couple of joints of heavyweight drillpipe, but in longer BHAs, the model may include only a few drill collars above the top stabilizer. Another vibration index considers the summation of dynamic side force values at the stabilizer contacts. Finally, the curvature of the pipe at the top of the BHA model may be used as a measure of how much vibration has been transmitted all the way from the bit to the top of the model.
For efficiency, both the average value (RMS) and the maximum value are calculated for each operating state. The maximum value represents a type of “worst case” scenario and the RMS value is more indicative of an expected normal behavior. These indices represent the assimilation of multiple conditions in one pair of numbers. Vibration indices for the individual excitation modes are often used, especially the Flex 1X fundamental mode.
BHA Redesign Process to Mitigate Vibrations
In this relativistic, comparative BHA redesign methodology, the preferred design configuration has the least amount of vibration for the same reference excitation levels (i.e., the lowest vibration index values), calculated over a range of representative operating conditions. The redesign process comprises the following steps:
1. Construct a model description of the vendor-proposed BHA 2. Consider the appropriate parametric conditions for simulation, including rotary speed range (RPM), WOB range,
excitation multiples of the rotary speed, fluid density, hole angle, and element length 3. Conduct design simulations in which the model is executed for a range of parameters 4. Identify a vibration-related limiter in the initial design 5. Modify the design to address the limiter, then rerun the model 6. Compare the vibration indices, iterate the design parameters, and select a preferred configuration 7. Run this BHA in the field 8. Simulate model results for the applied conditions (WOB and RPM) and compare measured and model values 9. Compare with previous BHA runs, assess differences, reconfigure the BHA, and repeat
In this way, the BHA design modeling process is well-suited to the operator’s “relentless redesign” workflow that has provided documented value to drilling operations.
Beam Natural Frequency Varies Approximately as (OD/L2)
The dynamic bending modes of a beam are determined by a fourth-order differential equation and the corresponding boundary conditions. For a drill collar beam that is laterally unconstrained between points of stabilization, the relevant parameters include the OD, ID, density , Young’s modulus E, span length L, and the state of the beam at the two ends. The natural frequency is obtained as:
∙ /
/∙ (1)
In an approximation where the ID is small and is neglected to reveal the primary factors influencing natural frequency, and for cases in which the material properties ρ and E are constant,
~ ∙ ~ ∙ (2)
where “c” is a value determined by solving the beam differential equation for the boundary conditions. The simplification with the (OD/L2) term is strictly true only for ID=0, and it is approximate otherwise. In either case, the term remains an indicator of relative effects contributing to the natural frequency.

SPE/IADC 163503 23
For these two simple cases (see Fig. A2), there are textbook solutions to solve for the natural frequencies. For a beam with pinned end conditions, c = (nπ)2, and for a cantilevered beam with one end built-in and the other end free, c = 1.875 for the first natural frequency.
Fig. A3 provides these natural frequencies for four typical collar sizes: 4.75 x 2.25-in., 6.5 x 2.813-in., 8.0 x 3.0-in., and 9.5 x 3.0-in., using the full equation (1). The natural frequency is expressed in RPM on the y-axis of Fig. A3 for convenience. The span length between contacts is on the x-axis. For these simple boundary conditions, it may be observed that the vibration modes intersect the “Prime Drilling Space” that comprises common span lengths and rotary speeds used in many drilling applications (i.e., rotary speeds between 60 and 200 RPM and span lengths of 10 to 80 ft).
This analysis suggests that typical BHA systems are configured and operated at conditions close to their fundamental resonance – for simple boundary conditions. With the complexity of dynamic boundary conditions and applied axial loads, the picture gets more interesting and complex, and challenging.
Fig. A2—Two simple boundary conditions for beams.
Fig. A3—Vibration frequencies for a beam with pinned and cantilever (fixed/free) boundary conditions, no axial load.