department-operated facilities - florida's turnpike operations annual... · fy 2015 annual...
TRANSCRIPT
93FY 2015 Annual Report Garcon Point Bridge
ENTERPRISE TOLL OPERATIONS
Florida Department of Transportation
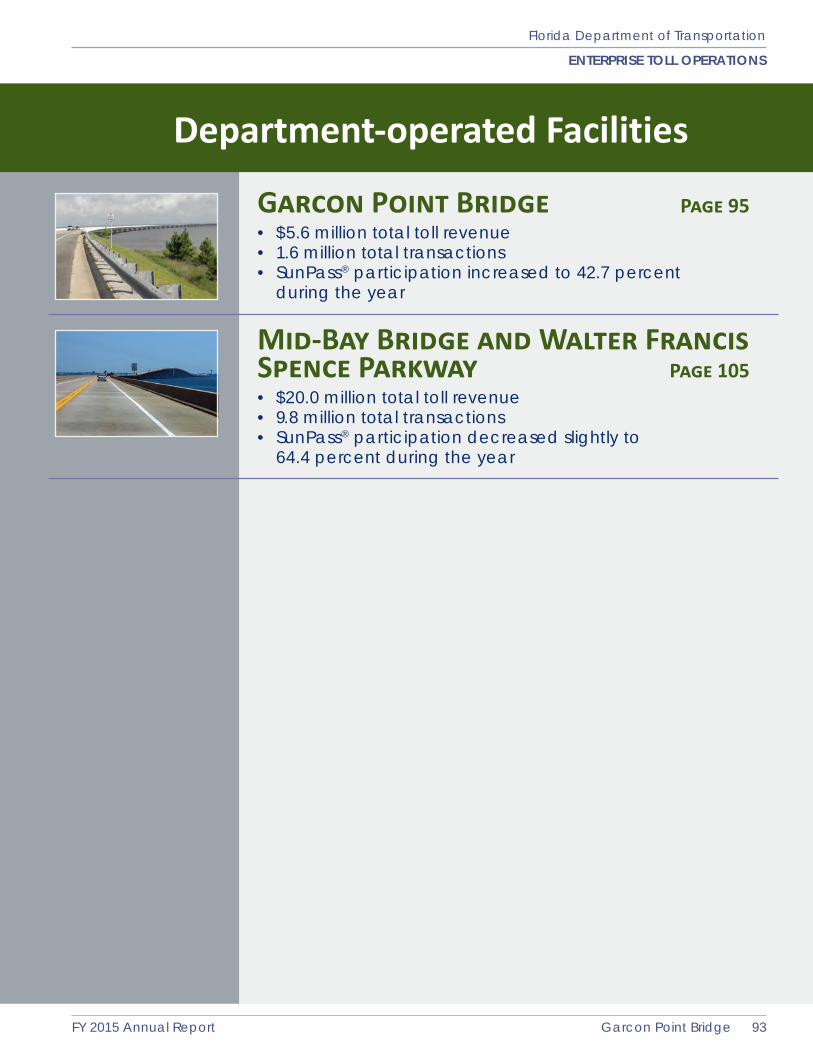
Department-operated Facilities
Garcon Point Bridge Page 95• $5.6 million total toll revenue• 1.6 million total transactions• SunPass® participation increased to 42.7 percent
during the year
Mid-Bay Bridge and Walter Francis Spence Parkway Page 105• $20.0 million total toll revenue• 9.8 million total transactions• SunPass® participation decreased slightly to
64.4 percent during the year

94 FY 2015 Annual ReportGarcon Point Bridge
ENTERPRISE TOLL OPERATIONS
Florida Department of Transportation
THIS PAGE INTENTIONALLY LEFT BLANK

95FY 2015 Annual Report Garcon Point Bridge
ENTERPRISE TOLL OPERATIONS
Florida Department of Transportation
Garcon Point Bridge
7.1 BACKGROUNDThe Garcon Point Bridge is a 3.5-mile bridge that spans Pensacola/East Bay between Garcon Point (south of Milton) and Redfish Point (between Gulf Breeze and Navarre) in southwest Santa Rosa County. The bridge and roadway segments that comprise this facility are designated as SR 281 and provide access to the Gulf Breeze peninsula from areas north and east of Pensacola Bay. On the south side of the bay, the road continues as a one-mile, two-lane highway that connects to US 98. On the north side of the bay, SR 281 connects to I-10 approximately 7.5 miles north of the toll plaza. Overall, the distance between US 98 and I-10 is 12 miles.
Figure 7.1 shows a map of Garcon Point Bridge and the surrounding area. The toll plaza is located at the southern end of Garcon Point, and tolls are collected in both directions. Beyond the Gulf Breeze peninsula, south of Santa Rosa Sound, the Sikes Bridge (SR 399) and Navarre Bridge provide access to the resort communities on Santa Rosa Island.
The Santa Rosa Bay Bridge Authority, established in 1984, oversaw the financing and construction of the Garcon Point Bridge. Construction of this two-lane
facility was financed by the Series 1996 Revenue Bonds. The two-lane bridge opened to traffic on May 14, 1999.
The Authority entered into a lease-purchase agreement with the Department, whereby the Department maintains and operates the bridge and remits all tolls collected to the Authority as lease payments. The term of the lease runs concurrently with the bonds, and matures in 2028. At that time the Department will own the bridge, assuming the bonds are fully paid. Should the bonds, or any additional issuance of bonds, be outstanding in 2028, the lease term will be extended through the payoff date of the outstanding bonds.
As a result of the debt service reserve fund being depleted, it was determined that the Santa Rosa Bay Bridge Authority would not have enough funds for the July 1, 2011 debt service payment. Consequently, on April 27, 2011, The Bank of New York Mellon sent an initial notice of default to the Authority. A second notice of default was sent to the Authority on June 29, 2012 from the Bank of New York Mellon stating that there would not be enough funds to pay the debt service owing as of July 1, 2012 and thus no payment would be made. On January 1, 2013 another notice of default was sent to the Authority which included a notice of acceleration stating that the principal of all the bonds outstanding were immediately due and payable. On February 1, 2013 the trustee sent a notice of payment to the bondholders stating the amount net of reserves that was available for distribution to holders of bonds as of January 1, 2013 (the “Special Record Date”). The notice of payment does not waive the default status. On June 10, 2015 the trustee sent another notice of

96 FY 2015 Annual ReportGarcon Point Bridge
ENTERPRISE TOLL OPERATIONS
Florida Department of Transportation
Figu
re 7
.1
Gar
con
Poin
tB
ridg
e(S
R 2
81)
Pens
acol
a
Gar
con
Poin
tBr
idge
SOU
RC
E:Fl
orid
a D
epar
tmen
tof
Tra
nspo
rtatio
n 20
15;
NAV
TEQ
201
5
01
2 Mile
s
MIL
TON
Escambia
Sant
a R
osa
Okaloosa
Alab
ama
SAN
TA R
OSA
Ensl
eyEg
lin A
ir F
orce
Bas
e
GU
LF O
F M
EXIC
O
Sant
a Ro
sa S
ound
10
10 98
Ft.
Wal
ton
Bea
ch
ESC
AM
BIA
PEN
SAC
OL
A
GU
LF
BR
EE
ZE
Aval
onBe
ach
Bagd
ad
Sant
a Ro
sa Is
land
Nava
rre
Nava
rre
Beac
h
Gul
fB
reez
e
Fort
Wal
ton
Bea
ch
Esca
mbi
aBa
y
Blackwater
Bay
East
Bay
Pens
acol
aBa
y
Perd
ido
Bay
Bob
Silk
es B
ridg
e
Pens
acol
aR
egio
nal
Airp
ort
Hol
ley
Land
ing
Fiel
d
Gul
f Isl
ands
Nat
iona
l Sea
shor
eG
ulf I
slan
dsN
atio
nal S
eash
ore
Gul
f Isl
ands
Nat
iona
l Sea
shor
ePe
nsac
ola
Nav
alA
ir St
atio
n
110
29 95
87
399
87
87
87
89
191
191
8990
10
281
191
281
Gar
con
Poin
t
Redf
ish
Poin
t
399
399
98
292
98
298
173
292
296
9010
A
9010
A29
1
1090A
LT
298
399
Perd
ido
Key
East
Bay
Rive
rN
aval
Tec
hnic
alTr
aini
ng C
ente
r
OLF
Spe
ncer
US
Nav
y
184
Five F
orks
Road
TWO
-WAY
TO
LLS
$3.7
5
2 -
Axl
es, 5
0% R
ebat
e fo
r Sun
Pass
afte
r 30
trans
actio
ns$3
.75
E
ach
Add
ition
al A
xle
L:\M
aps\
Tolls
TEA
R R
epor
t\Map
s\201
5\Fi
gure
_7_1
_Gar
con_
Poin
t_Br
idge
.mxd
Inte
rsta
te H
ighw
ayPr
inci
pal A
rteria
lM
inor
Arte
rial
Cou
nty
Bou
ndar
yO
ther
Rou
te
Gar
con
Poin
t Brid
geTo
ll Pl
aza
LEG
EN
D
Oth
er T
oll B
ridge
®

97FY 2015 Annual Report Garcon Point Bridge
ENTERPRISE TOLL OPERATIONS
Florida Department of Transportation
payment to the bondholders stating the amount net of reserves that was available for distribution to holders of bonds as of June 20, 2015 (the “Special Record Date”). The notice of payment does not waive the default status.
As a result of the first debt service payment default, a majority of the board members resigned and a new board was formed to look into possible restructuring of the Authority’s debt. The bond documents clearly advised investors that neither the State of Florida nor Santa Rosa County would have any responsibility for payment of the bond debt. The Department continues to operate and maintain the Garcon Point Bridge. Further details can be found in Section 7.7 - Revenue Sufficiency.
When the Garcon Point Bridge opened to traffic in May 1999, the toll for passenger cars and other two-axle vehicles was set at $2.00. Based on the toll rate increase schedule discussed later in Section 7.5, the toll rate was increased to $2.50 for two-axle vehicles in FY 2002. On July 1, 2004 (FY 2005) the two-axle toll rate increased to $3.00, reflecting the second
scheduled toll rate increase. The third scheduled toll rate increase went into effect on July 1, 2007 (FY 2008), which increased the two-axle rate to $3.50. On January 5, 2011 (FY 2011) the two-axle rate increased to $3.75, reflecting the fourth scheduled toll rate increase. This rate is still in effect today. SunPass® users of two-axle vehicles receive a 50 percent rebate after they reach a threshold of 30 toll transactions per month on the Garcon Point Bridge toll facility. Tolls for vehicles with three or more axles are calculated using the “N minus 1” method and increase at the rate of $3.75 per axle above that of the two-axle toll.
The bond year for the Garcon Point Bridge as reported herein runs from July 1 to June 30, corresponding to the Department’s fiscal year and the Authority’s bond year for debt service payments.
Table 7.1 shows historical transactions and revenue growth on the Garcon Point Bridge. The substantial traffic and revenue increase (11.6 percent and 8.5 percent, respectively) in FY 2006 is due to increased truck traffic brought about by post-hurricane
Table 7.1 Garcon Point Bridge
Historical Transactions and Revenue Growth FY 2005 through FY 2015
Fiscal Year
Transactions (000) Toll Revenue(1) ($000)
Average Toll
Toll Paying
Non Revenue Total
Percent Change Amount
Percent Change
2005 1,489 24 1,513 - $4,604 - $3.043
2006 1,660 29 1,689 11.6% 4,997 8.5% 2.959
2007 1,666 4 1,670 (1.1) 4,790 (4.1) 2.868
2008 1,439 4 1,443 (13.6) 4,767 (0.5) 3.304
2009 1,312 7 1,319 (8.6) 4,369 (8.3) 3.312
2010 1,264 4 1,268 (3.9) 4,203 (3.8) 3.315
2011 1,243 8 1,251 (1.3) 4,276 1.7 3.418
2012 1,268 22 1,290 3.1 4,592 7.4 3.559
2013 1,284 26 1,310 1.6 4,736 3.1 3.615
2014 1,421 19 1,440 9.9 5,225 10.3 3.628
2015 1,551 18 1,569 9.0 5,648 8.1 3.600
Source: FDOT Office of the Comptroller and Turnpike Enterprise Finance Office.Note: The non-revenue class includes authorized vehicles that pass through a toll plaza without incurring a toll (i.e., law
enforcement, emergency vehicles) and transactions reported during toll suspensions attributable to hurricanes.(1) Toll revenue reported net of the SunPass® discount since the facility opened.

98 FY 2015 Annual ReportGarcon Point Bridge
ENTERPRISE TOLL OPERATIONS
Florida Department of Transportation
construction in the area. Transactions and revenue declined for the period FY 2007 through FY 2011. This decline is attributed in part to the economic slowdown and rising fuel prices. Additionally, FY 2008 transactions were negatively impacted by the July 2007 toll rate increase. Despite the impacts of the economic slowdown, FY 2008 revenue only decreased by 0.5 percent due to the additional revenue generated from the toll rate increase. From FY 2012 through FY 2014, growth is generally attributed to the continuing economic recovery and the traffic rebound following the BP Oil Spill that occurred in April 2010.
In FY 2015 there were a total of 1.6 million transactions, generating revenues of $5.6 million. Compared to FY 2014, total transactions increased 9.0 percent while revenues increased 8.1 percent. This increase in transactions and revenue can be attributed to the general improving economic conditions in Florida. Pointing to this recovery, Northwest Florida experienced a record breaking tourist season. In fact, hotel bed tax collections were up double digits in April, May and June over 2014 levels.
The factors contributing to the effects on traffic and revenue are discussed in greater detail in the Overview chapter of this report.
Historical operating and routine maintenance expenses from FY 2005 through FY 2015 are presented in Table 7.2. Operating expenses have increased slightly from approximately $1.0 million in FY 2005 to $1.1 million in FY 2015. In FY 2015, total operating expenses increased by 10.7 percent or $109 thousand from FY 2014. This increase in operating expenses is primarily due to an increase in credit card fees, toll equipment maintenance and bank service fees.
Maintenance of the Garcon Point Bridge was performed under a private Asset Maintenance Contract, from FY 2005 through FY 2011, with the Department providing oversight through its Asset Management Coordinator. Maintenance activities include roadside mowing and upkeep, guardrail repair, shoulder repair, bridge inspection and other routine maintenance items. Maintenance activity has been provided in-house beginning in FY 2012. Toll facilities maintenance and bridge inspections are performed outside the scope of the Asset Maintenance Contract. FY 2015 routine
Table 7.2 Garcon Point Bridge
Historical Operating and Routine Maintenance Expenses ($000)
FY 2005 through FY 2015
Fiscal Year
Operating Expense
Routine Maintenance
ExpenseTotal O&M Expenses
2005 $994 $99 $1,093
2006 868 93 961
2007 1,020 118 1,138
2008 1,051 124 1,175
2009 997 98 1,095
2010 956 135 1,091
2011 969 160 1,129
2012 1,017 196 1,213
2013 987 148 1,135
2014 1,014 159 1,173
2015 1,123 102 1,225
Source: FDOT Office of the Comptroller.

99FY 2015 Annual Report Garcon Point Bridge
ENTERPRISE TOLL OPERATIONS
Florida Department of Transportation
maintenance expenses decreased approximately $57 thousand, or 35.8 percent, from the prior year due to a decrease in general maintenance on the facility and bridge inspection costs.
7.2 FY 2015 TRANSACTIONS AND TOLL REVENUE
Monthly transactions and toll revenue on the Garcon Point Bridge during FY 2015 are presented in Table 7.3. The second and third quarters generated a slightly lower number of transactions and toll revenue.
Graph 7.1 shows the number of hourly weekday and weekend transactions of a typical week during FY 2015 on the Garcon Point Bridge. As indicated, weekday demand for travel on the facility is highest during the morning and evening peak hours. The morning peak hour occurs from 8:00 a.m. to 10:00 a.m. and the afternoon peak occurs from 5:00 p.m. to 7:00 p.m. In addition, midday traffic volumes of over 200 vehicles per hour show the relative influence of non-commuters (tourist/recreational travelers) on the facility.
Table 7.3 Garcon Point Bridge
Monthly Transactions and Toll Revenue FY 2015
MonthTransactions
(000)Toll Revenue
($000)
July 2014 182 $672
August 156 562
September 124 444
1st Quarter Total 462 1,678
October 130 454
November 113 407
December 107 381
2nd Quarter Total 350 1,242
January 2015 104 365
February 103 368
March 124 448
3rd Quarter Total 331 1,181
April 128 459
May 147 535
June 151 553
4th Quarter Total 426 1,547
Annual Total 1,569 $5,648
Source: FDOT Office of the Comptroller (Annual Toll Revenue) and Turnpike Enterprise Finance Office.
Note: Transactions represent toll-paying and non-revenue traffic at the mainline plaza.
0
100
200
300
400
500
12:00AM
2:00AM
4:00AM
6:00AM
8:00AM
10:00AM
12:00PM
2:00PM
4:00PM
6:00PM
8:00PM
10:00PM
12:00AM
Tran
sact
ions
Time of Day
Weekday Weekend
Graph 7.1 Garcon Point Bridge
Typical Hourly Transactions FY 2015
Source: Data obtained from Turnpike Enterprise Finance Office for the 7-day period beginning Monday, April 20, 2015.

100 FY 2015 Annual ReportGarcon Point Bridge
ENTERPRISE TOLL OPERATIONS
Florida Department of Transportation
Traffic and revenue contributions for trucks on the Garcon Point Bridge are shown in Graph 7.2. For FY 2015, trucks accounted for approximately 4 percent of traffic on the facility. Correspondingly, the revenue collected from truck traffic translated into 9 percent of the total revenue on the facility. The revenue percentage for trucks is influenced by the “N minus 1” toll structure. In terms of actual revenues, trucks provided approximately $0.5 million of the total revenues, while passenger vehicles comprised the remaining $5.1 million.
7.3 SUNPASS®SunPass® was implemented on the Garcon Point Bridge concurrent with the opening of the facility on May 14, 1999. The toll plaza has five lanes, and tolls are collected in both directions with
The influence of tourists and recreational travelers is noticeably more pronounced on the weekends.
Table 7.4 shows the monthly seasonal transaction variation in FY 2015. On average, approximately 4,300 vehicles use the bridge each day, up 400 vehicles per day from FY 2014. During the spring and summer months, transactions exceed the normal pattern observed on this facility due to tourists and seasonal residents with July exceeding the average by 37 percent. January was the lowest month at 23 percent below the average.
Table 7.4 Garcon Point Bridge
Seasonal Transaction Variation FY 2015
MonthAverage Daily Transactions
Seasonal Factor
July 2014 5,900 1.37
August 5,000 1.16
September 4,100 0.95
October 4,200 0.98
November 3,800 0.88
December 3,500 0.81
January 2015 3,300 0.77
February 3,700 0.86
March 4,000 0.93
April 4,300 1.00
May 4,800 1.12
June 5,000 1.16
AADT 4,300 1.00
4%
Two Axles96%
Additional Axles
Graph 7.2 Garcon Point Bridge
Transactions by Axle Class FY 2015
Revenue Contribution by Axle Class FY 2015
9%
Two Axles91%
Additional Axles

101FY 2015 Annual Report Garcon Point Bridge
ENTERPRISE TOLL OPERATIONS
Florida Department of Transportation
Revenue attributable to SunPass® for FY 2015 totaled $2.2 million, as shown in Table 7.6. This amount represents 39.3 percent of all toll revenue. The SunPass® revenue amount is net of the SunPass® discount for the facility, which for FY 2015, amounted to approximately $438 thousand. The monthly SunPass® revenue contribution ranged from a low of 28.1 percent to a high of 47.1 percent during FY 2015. Non-SunPass® payments accounted for 60.7 percent of total revenue in FY 2015.
7.4 FY 2015 EXPENSES AND LIABILITIES
A comparison between actual and budgeted operating and routine maintenance expenses in FY 2015 are shown in Table 7.7. Actual operating expenses were approximately 4.7 percent, or $50 thousand, more than the FY 2015 budget primarily due to higher costs associated with bank service fees and credit card fees. Routine maintenance expenses were lower than the
SunPass® technology available in select lanes (see Appendix A for the lane configurations). A discount is provided to users of SunPass® beyond the threshold of 30 transactions on the Garcon Point Bridge toll facility per month. As such, drivers of two-axle vehicles are given a 50 percent retroactive discount once they exceed the threshold.
Table 7.5 shows the SunPass® transactions on Garcon Point Bridge during FY 2015. SunPass® usage totaled 670 thousand transactions in FY 2015, resulting in a SunPass® participation rate of 42.7 percent, up from 39.2 percent in FY 2014. On a daily basis, approximately 1,800 vehicles out of 4,300 utilize SunPass®. The monthly SunPass® participation ranged from 30.8 percent in July 2014 to 51.0 percent in January 2015, peaking during the winter months due to a lower percentage of tourists.
Table 7.5 Garcon Point Bridge
Transactions by Payment Method FY 2015
Month
Transactions (000)
Percent SunPass®SunPass®
Non-SunPass® Total
July 2014 56 126 182 30.8%
August 57 99 156 36.5
September 57 67 124 46.0
October 61 69 130 46.9
November 53 60 113 46.9
December 52 55 107 48.6
January 2015 53 51 104 51.0
February 52 51 103 50.5
March 55 69 124 44.4
April 60 68 128 46.9
May 59 88 147 40.1
June 55 96 151 36.4
Total 670 899 1,569
Percentage 42.7% 57.3% 100.0%
Source: Turnpike Enterprise Finance Office.Note: SunPass® and Non-SunPass® transactions represent toll-paying and non-revenue
transactions.
Table 7.6 Garcon Point Bridge
Gross Toll Revenue by Payment MethodFY 2015
Month
Gross Toll Revenue ($000)
Percent SunPass®SunPass®
Non-SunPass® Total
July 2014 $189 $483 $672 28.1%
August 189 373 562 33.6
September 183 261 444 41.2
October 196 258 454 43.2
November 178 229 407 43.7
December 173 208 381 45.4
January 2015 172 193 365 47.1
February 170 198 368 46.2
March 188 260 448 42.0
April 193 266 459 42.0
May 199 336 535 37.2
June 192 361 553 34.7
Total $2,222 $3,426 $5,648
Percentage 39.3% 60.7% 100.0%
Source: FDOT Office of the Comptroller (Annual Toll Revenue) and Turnpike Enterprise Finance Office.

102 FY 2015 Annual ReportGarcon Point Bridge
ENTERPRISE TOLL OPERATIONS
Florida Department of Transportation
7.5 NOTEWORTHY EVENTSThe Santa Rosa Bay Bridge Authority adopted a toll rate increase program to increase tolls every three years beginning July 1, 2001 (FY 2002). Since FY 2002, there have been four toll rate increases from $2.00 to the current toll rate of $3.75.
Despite the adopted toll rate increase program, the Santa Rosa Bay Bridge Authority had its first
FY 2015 budget by 17.1 percent, or $21 thousand, primarily due to a general decrease in routine maintenance needed on the facility compared to what was originally budgeted. Overall, FY 2015 actual operating and routine maintenance expenses were 2.4 percent higher than the budget.
As shown in Figure 7.2, Garcon Point Bridge has liabilities payable to the Department for TFRTF loans and an advance from the STTF. The first payable is an advance from the Department’s Toll Facility Revolving Trust Fund (TFRTF). As of June 30, 2015, the TFRTF balance was approximately $7.9 million, to be paid back when sufficient funds become available.
The second payable is an advance for the costs of operating and maintaining the toll facility. The Department, in accordance with the Lease-Purchase Agreement between the Department and the Santa Rosa Bay Bridge Authority, pays operating and maintenance expenses on the bridge. As such, the Department considers these expenses as long-term receivables. This liability is to be paid subsequent to the payment of the TFRTF loans. An analysis of the long-term liability for FY 2015 is presented in Table 7.8. As indicated, the long-term liability balance as of June 30, 2015 was approximately $21.6 million.
Toll Revenue
Debt Service
Debt Service Reserve
Administrative
TFRTF Loans
STTF-Department FundedOperating, Maintenance, R&R,
SunPass® and Other Improvements
Figure 7.2 Flow of Funds
Garcon Point Bridge Revenue Bonds, Series 1996
Table 7.8 Garcon Point Bridge
Long-Term Liability ($000) FY 2015
Transaction Amount
Balance, July 1, 2014 $20,389
AdditionsOperating & Routine Maintenance 1,225
Other(1) 11
Balance, June 30, 2015 $21,625
(1) Other additions represent increases in the long-term liability due to other periodic maintenance expenses.
Table 7.7Garcon Point Bridge
Operating and Routine Maintenance Expenses ($000)
FY 2015
Type of Expense Budget ActualOver/
(Under) Variance
Operating $1,073 $1,123 $50 4.7%
Routine Maintenance 123 102 (21) (17.1)
Total $1,196 $1,225 $29 2.4%
Source: FDOT Office of the Comptroller, Turnpike Enterprise Finance Office and the FY 2014 Enterprise Toll Operations Traffic Engineer’s Annual Report.

103FY 2015 Annual Report Garcon Point Bridge
ENTERPRISE TOLL OPERATIONS
Florida Department of Transportation
payment default on July 1, 2011. As previously mentioned, the Department continues to operate and maintain the Garcon Point Bridge.
FDOT District 3 is widening SR 87 from two to four lanes in three stages from US 98 to US 90, north of I-10. The 4-mile segment from US 98 to north of Five Forks Road has been completed; the 3-mile segment between Five Forks Road and the Eglin Air Force Base boundary has been completed. In June 2015 a contract was executed for the 5.4-mile segment from the Eglin AFB boundary to two miles south of the Yellow River Bridge. Over the long term, this increased capacity on SR 87 is likely to negatively impact traffic and revenue on the Garcon Point Bridge as customers are diverted to the newly-widened competing facility.
7.6 EXPENSE FORECASTSProjected operating and routine maintenance expenses for FY 2016 through FY 2026 are shown in Table 7.9. The operating expenses in FY 2016 represent the budget in the amount of
approximately $1.1 million. Operating expenses are based on the budget developed by the Turnpike Enterprise Finance Office. Appendix C contains a detailed description of the FY 2016 operating expense budget. Subsequent to FY 2016, operating expenses are projected to grow at 2.0 percent annually. The routine maintenance expense forecast is provided by the Department’s Office of Project Finance through FY 2021. Subsequent to FY 2021, routine maintenance expenses were increased at approximately 2.0 percent annually.
7.7 REVENUE SUFFICIENCYEach year, an amount of principal and accrued interest on the outstanding bonds becomes due and payable. This amount is known as the annual debt service. As a test of the ability of a facility to repay the annual debt service, a “coverage” calculation is performed. In accordance with the Series 1996 Bond Resolution, gross revenues are required to provide 120 percent of the Annual Net Debt Service Requirement (or a 1.2 coverage ratio). It should be noted that the Authority has never met the required coverage ratio.
As required by the bond resolution, annual “net” debt service is defined as annual debt service less interest earnings on funds reserved for debt service and capitalized interest.
It should be noted, effective January 1, 2013, the Bank of New York Mellon serving as trustee, formally noticed that all principal on all the outstanding bonds is due and payable immediately. Such notice permits the trustee to make regular distributions to all bondholders from the revenues made available and as described earlier.
In April 2013, Fitch Ratings affirmed and withdrew its ‘D’ rating on the authority’s outstanding revenue bonds. According to Fitch, this rating was withdrawn as it was no longer considered analytically meaningful.
Table 7.9 Garcon Point Bridge
Projected Operating and Routine Maintenance Expenses ($000)
FY 2016 through FY 2026
Fiscal YearOperating
Expense
Routine Maintenance
Expense
Total Operating & Routine
Maintenance Expenses
2016 $1,103 $154 $1,257
2017 1,125 106 1,231
2018 1,148 106 1,254
2019 1,171 106 1,277
2020 1,194 106 1,300
2021 1,218 106 1,324
2022 1,242 108 1,350
2023 1,267 111 1,378
2024 1,292 113 1,405
2025 1,318 115 1,433
2026 1,345 117 1,462

104 FY 2015 Annual ReportGarcon Point Bridge
ENTERPRISE TOLL OPERATIONS
Florida Department of Transportation
THIS PAGE INTENTIONALLY LEFT BLANK

ENTERPRISE TOLL OPERATIONS
Florida Department of Transportation
105FY 2015 Annual Report Mid-Bay Bridge Authority
8.1 BACKGROUNDThe Mid-Bay Bridge is a 3.6-mile, limited access, two-lane, fixed span toll bridge that traverses Choctawhatchee Bay, connecting Niceville and Destin in southeast Okaloosa County. The bridge opened to traffic in June 1993 with one mainline toll plaza located on the north side of the bay. Figure 8.1 shows a map of the bridge and the 11-mile Walter Francis Spence Parkway (Spence Parkway) which runs from the Mid-Bay Bridge to SR 85. The first section of the Spence Parkway (Mid-Bay Bridge to SR 20) opened to traffic in May 2011 as a four-lane, limited-access approach. The second section (SR 20 to Range Road) opened to traffic in September 2011. Phases 2 and 3 of the Spence Parkway (Range Road to SR 85) opened to traffic on January 4, 2014, with all-electronic toll collection beginning two days later, on January 6, 2014.
The bridge and roadway segments that comprise this facility are designated as SR 293. On the north side of the bay, with the completion of SR 293 to SR 85, the north approach is now four lanes to Range Road and two lanes to SR 85 except for the section of roadway through and in the immediate vicinity of the All-Electronic Toll gantry, where it widens to four lanes. On the south side of the bay, SR 293 continues as a four-lane arterial approach (Danny Wuerffel Way) for approximately one mile and intersects with US 98. Overall, SR 293 is 15.5 miles in length. The Spence Parkway has full interchanges at Lakeshore Drive, SR 20, Range Road, SR 285, SR 85 and an at-grade intersection at Forest Road (located between Range Road and SR 285, north of the toll gantry).
The Mid-Bay Bridge Authority was established in 1986 as a dependent special district of Okaloosa County to plan, construct, operate, and maintain a bridge traversing Choctawhatchee Bay and
other such transportation facilities that become part of the system. The Authority entered into a Lease - Purchase Agreement with the Department whereby the Department maintains and operates the System and remits all of the tolls collected to the Authority as lease payments. The term of the lease runs concurrently with the bonds. At the time the bonds mature and are fully paid, the Department will obtain full ownership of the Mid-Bay Bridge Authority system.
The Mid-Bay Bridge Authority operates on the Okaloosa County fiscal year which ends September 30. However, for consistency across all seven Department-owned and Department-operated facilities, all FY 2015 data for this facility is reported according to the Department’s fiscal year ending June 30, 2015, unless otherwise noted.
Tolls are collected in both directions on the Mid-Bay Bridge. The toll for two-axle vehicles was $2.00 from 1993, when the bridge opened, until September 30, 2004. A book of 20 coupons, valid for one month, was offered for sale to commuters at a cost of $20 (a 50 percent discount). With the conversion to SunPass®, coupons were discontinued on May 31, 1999. The discount for two-axle vehicles continued under SunPass® with a $1.00 discount
Mid-Bay Bridge and Walter Francis Spence Parkway

ENTERPRISE TOLL OPERATIONS
Florida Department of Transportation
106 FY 2015 Annual ReportMid-Bay Bridge Authority
Figu
re 8
.1
Mid
-Bay
Aut
hori
tySy
stem
(SR
293
)
Pens
acol
a SOU
RC
E:Fl
orid
a D
epar
tmen
tof
Tra
nspo
rtatio
n 20
15;
NAV
TEQ
201
5
01.
53 M
iles
CR
EST
VIE
W
Escambia
Sant
aR
osa
Okaloosa
Walton
Alab
ama
Gul
fof
Mex
ico
OK
ALO
OSA
WA
LTO
N
NIC
EV
ILL
E
VAL
APA
RA
ISO
FT. W
ALT
ON
BE
AC
HSHA
LIM
AR
DE
STIN
FRE
EPO
RT
DE
FUN
IAK
SPR
ING
S
Sand
estinCh
octa
w B
each
Eglin
Vill
age
Oce
an C
ity
Eglin
Air
Forc
e B
ase
Poin
t Was
hing
ton
Stat
e Fo
rest
GU
LF O
F M
EXIC
O
Cho
ctaw
hatc
hee
Bay
10
8528
5
9010
10
8333
1
331 83
20 331
83
20
9830
293
9830
20
85
123
85
85
189
TWO
-WAY
TO
LLS
$3.0
0
Sun
Pass
2 -
Axl
es ($
1.00
dis
coun
t app
lied
retro
activ
ely
for 2
-axl
e pe
rson
al (n
on-c
omm
erci
al)
acc
ount
s w
ith 4
1 or
mor
e tra
nsac
tions
per
cal
enda
r mon
th a
t Mid
-Bay
Brid
ge P
laza
)$8
.00
S
unPa
ss 3
- A
xles
$4.0
0
Cas
h 2
- Axl
es$4
.00
E
ach
Add
ition
al A
xle
Rang
e Rd.
Whi
te P
oint
Rd.
Lake
shor
e D
r.
Forest Rd.
BR
IDG
E P
LA
ZA
SPE
NC
E P
AR
KW
AY G
AN
TR
YTW
O-W
AY T
OLL
S$1
.50
S
unPa
ss 2
- A
xles
($0.
50 d
isco
unt a
pplie
d re
troac
tivel
y fo
r 2-a
xle
pers
onal
(non
-com
mer
cial
)
a
ccou
nts
with
41
or m
ore
trans
actio
ns p
er c
alen
dar m
onth
at S
penc
e Pa
rkw
ay)
$4.0
0
Sun
Pass
3 - A
xles
$2.0
0
TO
LL-B
Y-PL
ATE
2 - A
xles
$2.0
0
Eac
h A
dditi
onal
Axl
e
Cou
nty
Bou
ndar
yO
ther
Rou
teM
inor
Arte
rial
Prin
cipa
l Arte
rial
Inte
rsta
te H
ighw
ay
Inte
rcha
nge
with
No
Toll
Col
lect
ion
Toll
Plaz
a
L:\M
aps\
Tolls
TEA
R R
epor
t\Map
s\201
5\Fi
gure
_8_1
_Mid
-Bay
_Aut
horit
y_Sy
stem
.mxd
Mid
-Bay
Brid
ge a
nd S
penc
e Pa
rkw
ay
293
293
® ®
®
® ®

ENTERPRISE TOLL OPERATIONS
Florida Department of Transportation
107FY 2015 Annual Report Mid-Bay Bridge Authority
off the $2.00 cash toll without any limitations on trip frequency. Effective October 1, 2004 (FY 2005), the two-axle toll rate increased to $2.50 for cash customers and $1.50 for SunPass® customers. Then, on June 1, 2010 (FY 2010) tolls were increased to $3.00 for cash customers and $2.00 for SunPass® customers. Tolls for vehicles with three or more axles (regardless of whether they pay by cash or SunPass®) are calculated using the “N minus 1” method and increase at the rate of $3.00 per axle over the $3.00 cash two-axle toll.
Tolls on the Spence Parkway are collected at a point north of Range Road and south of Forrest Road. Tolls are collected using All-Electronic Tolling (AET) technology. Users have the option of paying with SunPass® or TOLL-BY-PLATE® (TBP). Those electing to pay by TBP have the option of either setting up a prepaid account (and avoid service charges) or having a statement sent to them via the US mail. Toll rates on the Spence Parkway are one-half those on the Mid-Bay Bridge, as follows: two-axle vehicles using SunPass® pay $1.00, two-axle vehicles paying by TBP are charged a $1.50 and three- or-more axle vehicles (regardless of the payment method) pay tolls calculated using the “N minus 1” method and increase at the rate of $1.50 per axle over the $1.50 TBP two-axle toll.
Effective October 1, 2015, tolls were increased on both the Bridge and the Spence Parkway as follows:
Two-axle vehicles: Bridge:
• Cash – $4.00• SunPass® (infrequent users,
those making 40-or-less trips per month per account) – $3.00
• SunPass® (frequent users, those making 41-or-more trips per month per account) – $2.00
Spence Parkway:• TOLL-BY-PLATE® – $2.00• SunPass® (infrequent users, those making
40-or-less trips per month per account) – $1.50• SunPass® (frequent users, those making
41-or-more trips per month per account) – $1.00
Three-or-more axle vehicles (regardless of the payment method) pay tolls calculated using the “N minus 1” method and increase at the rate of $4.00 per axle over the $4.00 cash two-axle toll on the Bridge and $2.00 per axle over the $2.00 TOLL-BY-PLATE® two-axle toll on the Spence Parkway.
Generally, both traffic and revenue on the Mid-Bay Bridge have increased over the years. The annual increase in traffic and revenue for the facility from FY 2005 through FY 2015 is presented in Table 8.1. In FY 2005, total transactions were approximately 7.6 million and toll revenues were approximately $13.5 million. In FY 2006, transactions and toll revenue
Table 8.1 Mid-Bay Bridge Authority
Historical Transactions and Revenue Growth State FY 2005 through State FY 2015
State Fiscal Year
Transactions (000) Toll Revenue ($000)
Average Toll
Toll Paying
Non Revenue Total
Percent Change Amount
Percent Change
2005 7,361 256 7,617 - $13,528 - $1.776
2006 7,529 156 7,685 0.9% 14,540 7.5% 1.892
2007 7,452 3 7,455 (3.0) 14,200 (2.3) 1.905
2008 7,165 3 7,168 (3.8) 13,421 (5.5) 1.872
2009 6,789 50 6,839 (4.6) 12,586 (6.2) 1.840
2010 6,755 4 6,759 (1.2) 12,867 2.2 1.904
2011 6,476 13 6,489 (4.0) 15,472 20.2 2.384
2012 6,491 30 6,521 0.5 15,699 1.5 2.407
2013 6,523 42 6,565 0.7 15,797 0.6 2.406
2014(1) 7,644 43 7,687 17.1 17,021 7.7 2.214
2015 9,720 54 9,774 27.1 19,954 17.2 2.042
Source: FDOT Office of the Comptroller and Turnpike Enterprise Finance Office.Notes: The non-revenue class includes authorized vehicles that pass through a toll plaza without incurring a toll (i.e., law
enforcement, emergency vehicles) and transactions reported during toll suspensions attributable to hurricanes. This data will not match the audited data maintained by the Mid-Bay Bridge Authority because of the difference in fiscal years.
(1) The Spence Parkway opened to traffic on January 4, 2014. Toll collection on the facility started on January 6, 2014.

ENTERPRISE TOLL OPERATIONS
Florida Department of Transportation
108 FY 2015 Annual ReportMid-Bay Bridge Authority
increased by 0.9 percent and 7.5 percent, due to a toll rate increase that occurred in the prior year. From FY 2006 to FY 2007, transactions decreased by 3.0 percent and revenues decreased by 2.3 percent. This decrease in traffic and revenue can be attributed to the residual impact of the severe hurricane seasons in 2004 and 2005, as well as the economic slowdown affecting the state of Florida, particularly the reduced level of tourism in Okaloosa and Walton counties. Potential visitors were not making accommodation reservations, not only because of any hurricane threat, but likely due to post-hurricane concerns (from the 2004-2005 seasons). The decline in traffic and revenue in FY 2008 and FY 2009 can be attributed to the economic recession. In FY 2011, transactions decreased by 4.0 percent, whereas revenue increased by 20.2 percent. FY 2011 transactions were negatively impacted by the June 2010 toll rate increase and the continuing uncertainty of the economic recovery, which is further discussed in the Overview chapter of this report. However, FY 2011 revenue significantly increased due to the additional revenue generated from the first full year of the toll rate increase.
Transactions and revenue during the late spring-early summer of 2010 (FY 2011) were also affected by the BP oil spill, which began with the explosion of the Deepwater Horizon drilling platform on April 20, 2010. While the oil slick moved eastward from the waters off of Louisiana to Mississippi and Alabama, and began affecting the beaches in Escambia and Santa Rosa Counties, it only minimally affected Okaloosa Island to the west of Destin. Accordingly, Mid-Bay Bridge traffic was affected more by media reports than by the actual oil spill.
In FY 2012, transactions increased a modest 0.5 percent while revenues increased 1.5 percent. This increase in transactions was the first upward
change since the 0.9 percent increase between FY 2005 and FY 2006, while the increase in revenues was due, in part, to the fact that the toll increase of June 2010 had been in effect for over a year.
FY 2013 transactions increased 0.7 percent while FY 2013 toll revenue increased 0.6 percent reflecting a modest rebound following the economic recession.
With the opening of the Spence Parkway in January 2014, total transactions in FY 2014 increased 17.1 percent, while FY 2014 toll revenue increased 7.7 percent. These large increases can be directly attributable to the opening of the Spence Parkway. Taken separately, there were a total of 6.7 million total transactions on the Bridge in FY 2014, an increase of 2.3 percent.
In FY 2015, the first full year the Spence Parkway was open, total transactions increased 27.1 percent, while FY 2015 toll revenue increased 17.2 percent. These large increases can be directly attributed to the first full year of operation of the Spence Parkway and ramp-up effects.
Additionally, the increase in traffic is attributed to the continued economic recovery and an increase in tourism in the area. Northwest Florida

ENTERPRISE TOLL OPERATIONS
Florida Department of Transportation
109FY 2015 Annual Report Mid-Bay Bridge Authority
Maintenance activities include roadside mowing and upkeep, guardrail repair, shoulder repair, bridge inspection and other routine maintenance. FY 2015 expenses increased 19.5 percent, or $51 thousand, primarily due to the addition of the Spence Parkway. In addition to routine maintenance expenses, approximately $800 thousand in periodic maintenance and capital improvement expenses were incurred during FY 2015 primarily for replacement of bearing pads at the piers on the Bridge and toll facilities design work.
8.2 FY 2015 TRANSACTIONS AND TOLL REVENUES
Monthly transactions and toll revenue on the Mid-Bay Bridge and the Spence Parkway facilities during FY 2015 are presented in Table 8.3. The fourth quarter (April through June) experienced
again experienced another positive tourist season. Hotel bed tax collections were up double digits in April, May and June over 2014 levels.
Historical operating and routine maintenance expenses from FY 2005 through FY 2015 are presented in Table 8.2. Operating expenses have increased from approximately $1.6 million in FY 2005 to $2.8 million in FY 2015. This increase represents an average annual compounded growth rate of 5.6 percent. FY 2015 operating expenses increased by approximately 19.0 percent, or $447 thousand, from FY 2014. The increase was primarily related to higher operating costs due to a full year of operation for the new Spence Parkway.
Maintenance of the Mid-Bay Bridge has been performed under a private Asset Maintenance Contract since FY 2005.
Table 8.2 Florida Department of Transportation
Historical Operating and Routine Maintenance Expenses ($000)
State FY 2005 through State FY 2015
State Fiscal Year
Operating Expense
Routine Maintenance
ExpenseTotal O&M Expenses
2005 $1,624 $196 $1,820
2006 1,643 194 1,837
2007 1,916 246 2,162
2008 2,058 213 2,271
2009 2,155 195 2,350
2010 1,971 167 2,138
2011 2,061 202 2,263
2012 2,124 187 2,311
2013 2,045 314 2,359
2014 2,348 261 2,609
2015 2,795 312 3,107
Source: FDOT Office of the Comptroller.
Table 8.3 Mid-Bay Bridge Authority
Monthly Transactions and Toll Revenue State FY 2015
Month
Transactions (000) Toll Revenue ($000)
Mid-Bay Bridge
Spence Parkway Total
Mid-Bay Bridge
Spence Parkway Total
July 2014 727 245 972 $1,812 $251 $2,063
August 648 215 863 1,578 220 1,798
September 546 189 735 1,306 195 1,501
1st Quarter Total 1,921 649 2,570 4,696 666 5,362
October 590 205 795 1,403 211 1,614
November 510 163 673 1,194 169 1,363
December 546 167 713 1,266 174 1,440
2nd Quarter Total 1,646 535 2,181 3,863 554 4,417
January 2015 507 161 668 1,170 169 1,339
February 495 161 656 1,159 169 1,328
March 620 221 841 1,484 230 1,714
3rd Quarter Total 1,622 543 2,165 3,813 568 4,381
April 621 228 849 1,486 236 1,722
May 711 272 983 1,729 280 2,009
June 732 294 1,026 1,804 259 2,063
4th Quarter Total 2,064 794 2,858 5,019 775 5,794
Annual Total 7,253 2,521 9,774 $17,391 $2,563 $19,954
Source: FDOT Office of the Comptroller (Annual Toll Revenue) and Turnpike Enterprise Finance Office.Notes: Transactions represent toll-paying and non-revenue traffic at Mid-Bay Bridge and the Spence
Parkway plazas.

ENTERPRISE TOLL OPERATIONS
Florida Department of Transportation
110 FY 2015 Annual ReportMid-Bay Bridge Authority
the most transactions and highest revenue of any quarter.
Graph 8.1 shows the number of hourly weekday and weekend transactions of a typical week during FY 2015 for the Bridge and the Spence Parkway facilities. As expected, the demand for travel on the facilities during weekdays is highest during the morning and evening peak hours. Almost 1,200 vehicles used the Bridge during the morning peak hour from 8:00 a.m. to 9:00 a.m. while, during the same time period, almost
500 vehicles used the Spence Parkway. In the evening peak period almost 1,800 vehicles used the Bridge and almost 600 vehicles used the Spence Parkway facility from 6:00 p.m. to 7:00 p.m. On weekends, there is no clear morning or evening peak periods indicating that a large number of non-commuters, many associated with recreational travel, use each of the facilities.
The monthly transaction variations for the Bridge and the Spence Parkway in FY 2015 are analyzed in Table 8.4. The overall two-way annual average daily traffic (AADT) for the combined Mid-Bay Bridge and Spence Parkway for FY 2015 was 26,800. The peak season occurs in spring and summer. May, June and July were the highest months with June at 28 percent above the average for the combined facilities. January was the lowest month at 19 percent below the average. Typically, the lowest transaction levels occur from November through February, as it is the off-season for tourists and seasonal residents in northwest Florida.
Table 8.4 Mid-Bay Bridge Authority
Seasonal Transaction Variation FY 2015
Month
Average Daily Transactions
Seasonal Factor
Mid-Bay Bridge
Spence Parkway Total
July 2014 23,500 7,900 31,400 1.17
August 21,000 6,900 27,900 1.04
September 18,200 6,300 24,500 0.91
October 19,000 6,600 25,600 0.96
November 17,000 5,400 22,400 0.84
December 17,600 5,400 23,000 0.86
January 2015 16,400 5,200 21,600 0.81
February 17,700 5,800 23,500 0.88
March 20,000 7,100 27,100 1.01
April 20,700 7,600 28,300 1.06
May 22,900 8,800 31,700 1.18
June 24,400 9,800 34,200 1.28
AADT 19,900 6,900 26,800 1.00
0
500
1,000
1,500
2,000
12:00AM
2:00AM
4:00AM
6:00AM
8:00AM
10:00AM
12:00PM
2:00PM
4:00PM
6:00PM
8:00PM
10:00PM
12:00AM
Tran
sact
ions
Time of DayMid-Bay Bridge Spence Parkway
0
500
1,000
1,500
2,000
12:00AM
2:00AM
4:00AM
6:00AM
8:00AM
10:00AM
12:00PM
2:00PM
4:00PM
6:00PM
8:00PM
10:00PM
12:00AM
Tran
sact
ions
Time of DayMid-Bay Bridge Spence Parkway
Graph 8.1 Mid-Bay Bridge Authority
Typical Hourly Weekday Transactions FY 2015
Source: Data obtained from Turnpike Enterprise Finance Office for the 7-day period beginning Monday, March 23, 2015.
Typical Hourly Weekend Transactions FY 2015

ENTERPRISE TOLL OPERATIONS
Florida Department of Transportation
111FY 2015 Annual Report Mid-Bay Bridge Authority
8.3 SUNPASS®The Mid-Bay Bridge toll plaza was originally constructed as a three-lane plaza accommodating two-way traffic. In May 1999, capacity improvements were completed and the toll plaza was widened from three to six lanes. The conversion to SunPass® occurred concurrently with the widening in May 1999. The Mid-Bay Bridge toll plaza was expanded again in May 2007 from six to eight lanes. As noted earlier, toll collection on the Spence Parkway is accomplished via AET at a four-lane (two lanes each way) toll gantry (See Appendix A for the toll plaza configurations).
The percentage of SunPass® transactions on the system during FY 2015 is shown in Table 8.5. As indicated, SunPass® transactions totaled approximately 6.3 million, resulting in a participation rate of 64.4 percent. SunPass® transactions on the Spence Parkway were 1.5 million. Individually, the SunPass® participation rate on the Bridge during FY 2015 was 65.6 percent while on the
The traffic and revenue contributions from trucks on the Bridge, the Spence Parkway and the combined facilities are shown in Graph 8.2. For FY 2015, trucks accounted for approximately 2 percent of traffic on the Bridge, 3 percent on the Spence Parkway and 2 percent on the combined facilities. Correspondingly, the revenue collected from truck traffic amounted to 4 percent of the total on the Bridge, 7 percent on the Spence Parkway and 5 percent on the combined facilities. In terms of actual numbers, vehicles with three or more axles provided approximately $0.7 million on the Bridge, $0.2 million on the Spence Parkway and $0.9 million total.
Graph 8.2 Mid-Bay Bridge Authority Transactions by Axle Class
FY 2015
98% 97% 98%
2%3%
2%
90%91%92%93%94%95%96%97%98%99%
100%
Mid-Bay Bridge Spence Parkway Combined
2 Axles Additional Axles
96%
93%95%
4%
7%
5%
90%
92%
94%
96%
98%
100%
Mid-Bay Bridge Combined
2 Axles Additional Axles
Spence Parkway
Revenue Contribution by Axle Class FY 2015
Table 8.5 Transactions by Payment Method
FY 2015
Month
Transactions (000)
Percent SunPass®SunPass®
Non-SunPass® Total
July 2014 545 427 972 56.1%
August 525 338 863 60.8
September 483 252 735 65.7
October 521 274 795 65.5
November 473 200 673 70.3
December 514 199 713 72.1
January 2015 486 182 668 72.8
February 465 191 656 70.9
March 546 295 841 64.9
April 549 300 849 64.7
May 597 386 983 60.7
June 588 438 1,026 57.3
Total 6,292 3,482 9,774
Percentage 64.4% 35.6% 100.0%
Source: Turnpike Enterprise Finance Office.Notes: Non-SunPass® transactions represent toll-paying and non-revenue transactions.

ENTERPRISE TOLL OPERATIONS
Florida Department of Transportation
112 FY 2015 Annual ReportMid-Bay Bridge Authority
Spence Parkway the participation rate was 60.8 percent. Correspondingly, non-SunPass® transactions accounted for the remaining 3.5 million transactions or 35.6 percent. On a monthly basis, the highest SunPass® participation occurred during the winter months (November through February) when commuters constitute a larger share of the total volume on both the Bridge and the Spence Parkway.
The resulting SunPass® revenue on the Bridge and the Spence Parkway is approximately $11.6 million, or 58.2 percent, of all revenue collected on the system. Non-SunPass® revenue totaled approximately $8.3 million, or 41.8 percent, in FY 2015. Table 8.6 shows revenue contributions from SunPass® and non-SunPass® on the combined facilities by month. Note that while SunPass® contributed approximately 58.2 percent of the total combined toll revenue in FY 2015, as previously mentioned, SunPass® comprised approximately 64.4 percent of the overall, combined facilities
Table 8.6 Mid-Bay Bridge Authority
Gross Toll Revenue by Payment Method FY 2015
Month
Gross Toll Revenue ($000)
Percent SunPass®SunPass®
Non-SunPass® Total
July 2014 $1,012 $1,051 $2,063 49.1%
August 972 $826 $1,798 54.1
September 888 $613 $1,501 59.2
October 960 $654 $1,614 59.5
November 869 $494 $1,363 63.8
December 947 $493 $1,440 65.8
January 2015 894 $445 $1,339 66.8
February 861 $467 $1,328 64.8
March 1,009 $705 $1,714 58.9
April 1,006 $716 $1,722 58.4
May 1,102 $907 $2,009 54.9
June 1,085 $978 $2,063 52.6
Total $11,605 $8,349 $19,954
Percentage 58.2% 41.8% 100.0%
Source: FDOT Office of the Comptroller (Annual Toll Revenue) and Turnpike Enterprise Finance Office.
traffic. This is due to the lower (discounted) toll paid by two-axle SunPass® customers.
8.4 FY 2015 EXPENSES AND LIABILITIES
A comparison between actual and budgeted operating and routine maintenance expenses for FY 2015 is presented in Table 8.7. The primary difference in operating expense is attributed to the fact that the budget reflects an estimate of Department charges designed to offset certain costs, whereas such amounts are not reflected in the actual expense. Actual routine maintenance expenses of $312 thousand were higher than the FY 2015 budget by approximately $19 thousand, or 6.5 percent, primarily due to an increase in contract maintenance costs needed on the facility. Overall, operating and routine maintenance expenses for FY 2015 were $202 thousand, or 7.0 percent, more than budgeted amounts.
Table 8.7 Florida Department of Transportation Operating and Routine Maintenance
Expenses ($000) FY 2015
Type of Expense Budget ActualOver/
(Under) Variance
Operating $2,612 $2,795 $183 7.0%
Routine Maintenance 293 312 19 6.5
Total $2,905 $3,107 $202 7.0%
Source: FDOT Office of the Comptroller, Turnpike Enterprise Finance Office and the FY 2014 Enterprise Toll Operations Traffic Engineer’s Annual Report.

ENTERPRISE TOLL OPERATIONS
Florida Department of Transportation
113FY 2015 Annual Report Mid-Bay Bridge Authority
As reflected in Figure 8.2, moneys in excess of the current operating and maintenance liability to the Department shall be applied as follows: 50 percent of the annual amount deposited shall be transferred to the Department until all outstanding amounts due to the Department are fully repaid. The remaining 50 percent is to be used by the Authority for any lawful purpose at such time as the Authority shall determine.
An analysis of the FY 2015 State Transportation Trust Fund (STTF) long-term liability is presented in Table 8.8. FY 2015 additions to the liability totaled approximately $3.9 million, comprised of $3.1 million in operating and routine maintenance expenses and $800 thousand in periodic maintenance and capital improvements. During FY 2015, $3.0 million was reimbursed to
STTF-Department FundedCurrent O&M Budgeted AmountsActual Prior Year O&M Not Reimbursed
STTF-Department Funded Authority General Fund
Until debt is satisfiedOperations, Maintenance, R&R, SunPass®, Improvements/Enhancements
Any Lawful Purpose including Construction, Expansion, Improvements, Enhancements, or additional reimbursements to Department
50% 50%
InterestToll Revenue
Administrative Expenses
Debt Service1st Senior Lien
Debt Service Reserve1st Senior Lien
Debt Service2nd Senior Lien
Deb Service Reserve2nd Senior Lien
Figure 8.2 Flow of Funds
Mid-Bay Bridge Authority Revenue Bonds
Table 8.8 Mid-Bay Bridge Authority
STTF Long-Term Liability ($000) FY 2015
Transaction Amount
Balance, July 1, 2014 $11,264
Additions(1) 3,943
Reductions(2) 2,963
Balance, June 30, 2015 $12,244
Source: FDOT Office of the Comptroller.(1) Additions represent increases in the long-term liability due
to O&M expenses and improvements.(2) As used here, reductions represent reimbursements made by
the Authority to the Department from general reserve funds.
the Department, comprised of $2.8 million for operating and maintenance expenses and $200 thousand for the Mid-Bay Bridge Authority Toll Rate Study.
The Mid-Bay Bridge Authority had a second liability consisting of various advances from a $1.5 million loan (plus investment interest) from the Department’s Toll Facilities Revolving Trust Fund (TFRTF) for a corridor study, traffic and revenue study and project design work. As shown in Table 8.9, the Mid-Bay Bridge Authority paid off its TFRTF liability balance as of June 30, 2015.
8.5 NOTEWORTHY EVENTSThe Authority is presently developing an Asset Management Plan that will incorporate elements of the former Mid-Bay Bridge Capital Improvement
Table 8.9 Mid-Bay Bridge Authority
TFRTF Liability ($000) FY 2015
Transaction Amount
Balance, July 1, 2014 $242
Additions New loans Interest
--
Reductions 242
Balance, June 30, 2015 $0
Source: FDOT Office of Project Finance.

ENTERPRISE TOLL OPERATIONS
Florida Department of Transportation
114 FY 2015 Annual ReportMid-Bay Bridge Authority
(FY 2017). The expansion of US 331 is expected to have a slightly negative effect on the traffic and revenue of the Mid-Bay Bridge Authority System.
8.6 TRAFFIC, REVENUE AND EXPENSE FORECASTS
In forecasting traffic and revenue for the bridge, prior traffic and revenue performance was used as a guide to estimate the total traffic and revenue for FY 2016 through FY 2026. The forecasts presented in Table 8.10 and Table 8.11 show traffic and gross toll revenues, respectively and take into account the planned expansion of US 331.
Current revenue forecasts for FY 2016 through FY 2026 have been updated and revised downward from the forecast in the 2014 Annual Report, based on actual results seen during FY 2015, including the opening of the Spence Parkway. Actual revenues came in at approximately 12 percent below forecast. This was due in part to an over estimation of the impact of traffic using both the Spence Parkway and the
Program. The goal is to stay consistent with the requirements of MAP-21 and future transportation funding which will require performance–based management, with the goal of reducing costs while improving the System’s effectiveness and efficiency. In addition, the Asset Management Plan will serve to instill a more disciplined, deliberate approach to managing the System. It will create an opportunity to team with others on maintenance, repair, and operational needs, resources and uses. It will also include a full depiction of what assets the Authority has and how the System fits in with regional plans. The Asset Management Plan will continue to be refined as a cooperative effort among the Mid-Bay Bridge Authority, the US Air Force, the Florida Department of Transportation, and the local County and City governments and communities.
As noted in last year’s report, the Florida Department of Transportation (FDOT) announced in the first half of calendar year 2013 that they awarded a contract to design and build a second, parallel, US 331 span. A notice-to-proceed (NTP) was issued on August 14, 2013 (FY 2014) with the expected completion date scheduled for summer 2016 (FY 2017). Ground for the project was broken on December 30, 2013 with construction commencing in January 2014. At present, this 3.3-mile project (span) is planned to be toll-free. The expansion of the bridge is expected to be complete by summer 2016 (FY 2017). US 331 is located approximately 20 miles east of the Mid-Bay Bridge and serves as the second alternative route (SR 85 being the first) to using the Mid-Bay Bridge Authority System. This route may be attractive to tourists coming from I-10 and the east. In addition to the second span, US 331 was recently widened to four lanes from the north end of the US 331 bridge to south of SR 20. Ground has also been broken for the widening of US 331 from SR 20 to I-10, with completion expected to take place in winter 2016
Table 8.10 Mid-Bay Bridge Authority
Traffic Forecast Authority FY 2016 through
Authority FY 2026Authority
Fiscal Year
Mid-Bay Bridge (000)
Spence Parkway
(000)
Total Traffic (000)
2016 7,051 2,277 9,328
2017 7,335 2,339 9,674
2018 7,640 2,404 10,044
2019 7,936 2,473 10,409
2020 8,190 2,544 10,734
2021 8,427 2,616 11,043
2022 8,653 2,689 11,342
2023 8,864 2,766 11,630
2024 9,064 2,846 11,910
2025 9,248 2,927 12,175
2026 9,415 3,012 12,427
Note: Traffic and revenue forecasts correspond to the Authority’s fiscal year (October 1 - September 30).

ENTERPRISE TOLL OPERATIONS
Florida Department of Transportation
115FY 2015 Annual Report Mid-Bay Bridge Authority
Bridge. It was also attributed to the newness of the Spence Parkway and perceived possible lack of knowledge of non-local drivers that they can use the Spence Parkway to access the Bridge. The forecast accounts for the increase in tolls on both the Bridge and Spence Parkway which took effect in FY 2016.
On October 1, 2015 a toll rate increase for two-axle cash-paying motorists on the Bridge of $1.00, and $0.50 for those that pay by TBP on the Spence Parkway, with a proportionate increase for multi-axle vehicles, went into effect.
The conservative traffic growth estimate on both the Bridge and the Spence Parkway reflect the return to normal economic conditions as described in the Overview chapter of this report. However, Florida’s economic recovery over the next 10 years will probably not achieve growth rates as high as those seen in the years leading up to the recession.
Accordingly, revenues for the Bridge and Spence Parkway are projected to increase from $24.9 million in FY 2016 to $31.5 million in FY 2026. Traffic profiles are provided in Appendix B showing the two-way AADT on the Mid-Bay Bridge and the Spence Parkway for FY 2015 through FY 2026.
Table 8.11 Mid-Bay Bridge Authority
Gross Toll Revenue Forecast Authority FY 2016 through Authority FY 2026
Authority Fiscal Year
Mid-Bay Bridge ($000)
Spence Parkway
($000)
Toll Revenue Comparisons ($000)
2015 Gross
Revenue Forecast
2014 Annual Report
Forecast
Variance
Amount Percent
2016 $21,421 $3,433 $24,854 $26,517 ($1,663) (6.3%)
2017 22,125 3,499 25,624 27,305 (1,681) (6.2)
2018 22,934 3,584 26,518 28,118 (1,600) (5.7)
2019 23,712 3,673 27,385 28,897 (1,512) (5.2)
2020 24,353 3,764 28,117 29,528 (1,411) (4.8)
2021 24,937 3,855 28,792 30,097 (1,305) (4.3)
2022 25,483 3,948 29,431 30,626 (1,195) (3.9)
2023 25,979 4,045 30,024 31,107 (1,083) (3.5)
2024 26,435 4,145 30,580 31,548 (968) (3.1)
2025 26,840 4,248 31,088 31,940 (852) (2.7)
2026 27,192 4,353 31,545 N/A N/A N/A
Note: Traffic and revenue forecasts correspond to the Authority’s fiscal year (October 1 - September 30).N/A The FY 2014 Traffic Engineer’s Annual Report forecast went through FY 2025.
ENTERPRISE TOLL OPERATIONS
Florida Department of Transportation
116 FY 2015 Annual ReportMid-Bay Bridge Authority
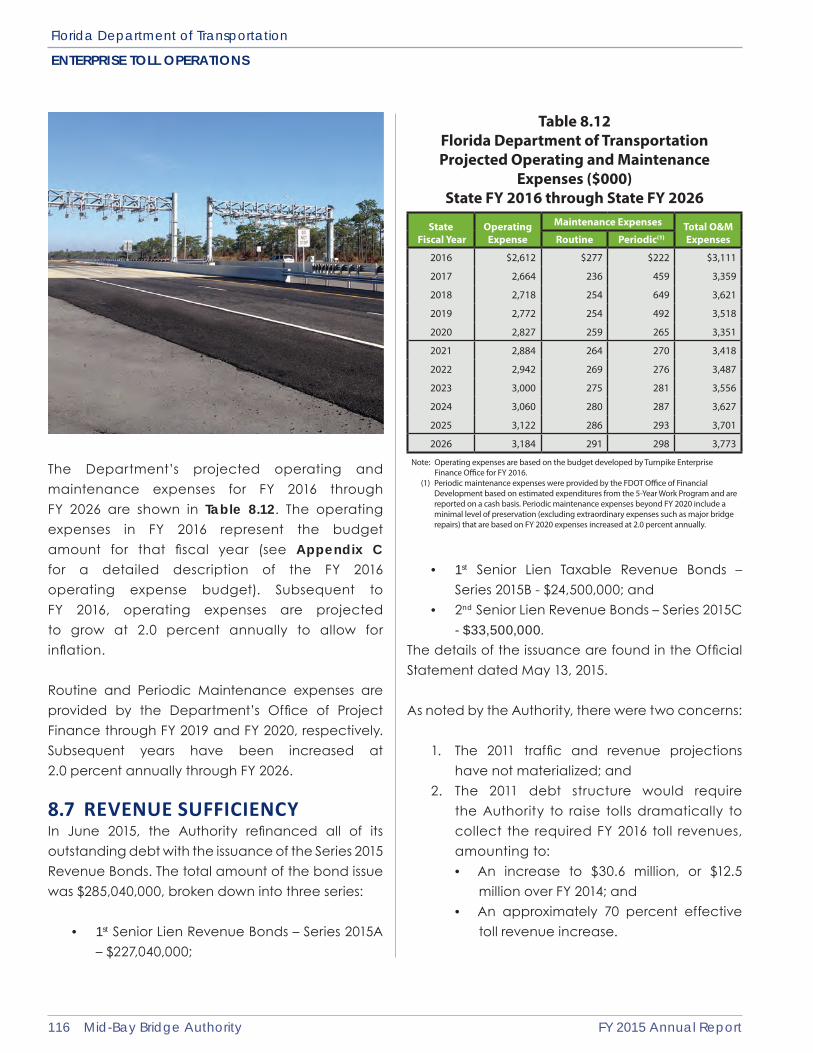
The Department’s projected operating and maintenance expenses for FY 2016 through FY 2026 are shown in Table 8.12. The operating expenses in FY 2016 represent the budget amount for that fiscal year (see Appendix C for a detailed description of the FY 2016 operating expense budget). Subsequent to FY 2016, operating expenses are projected to grow at 2.0 percent annually to allow for inflation.
Routine and Periodic Maintenance expenses are provided by the Department’s Office of Project Finance through FY 2019 and FY 2020, respectively. Subsequent years have been increased at 2.0 percent annually through FY 2026.
8.7 REVENUE SUFFICIENCYIn June 2015, the Authority refinanced all of its outstanding debt with the issuance of the Series 2015 Revenue Bonds. The total amount of the bond issue was $285,040,000, broken down into three series:
• 1st Senior Lien Revenue Bonds – Series 2015A – $227,040,000;
• 1st Senior Lien Taxable Revenue Bonds – Series 2015B - $24,500,000; and
• 2nd Senior Lien Revenue Bonds – Series 2015C - $33,500,000.
The details of the issuance are found in the Official Statement dated May 13, 2015.
As noted by the Authority, there were two concerns:
1. The 2011 traffic and revenue projections have not materialized; and
2. The 2011 debt structure would require the Authority to raise tolls dramatically to collect the required FY 2016 toll revenues, amounting to:• An increase to $30.6 million, or $12.5
million over FY 2014; and• An approximately 70 percent effective
toll revenue increase.
Table 8.12 Florida Department of Transportation Projected Operating and Maintenance
Expenses ($000) State FY 2016 through State FY 2026
State Fiscal Year
Operating Expense
Maintenance Expenses Total O&M ExpensesRoutine Periodic(1)
2016 $2,612 $277 $222 $3,111
2017 2,664 236 459 3,359
2018 2,718 254 649 3,621
2019 2,772 254 492 3,518
2020 2,827 259 265 3,351
2021 2,884 264 270 3,418
2022 2,942 269 276 3,487
2023 3,000 275 281 3,556
2024 3,060 280 287 3,627
2025 3,122 286 293 3,701
2026 3,184 291 298 3,773
Note: Operating expenses are based on the budget developed by Turnpike Enterprise Finance Office for FY 2016.
(1) Periodic maintenance expenses were provided by the FDOT Office of Financial Development based on estimated expenditures from the 5-Year Work Program and are reported on a cash basis. Periodic maintenance expenses beyond FY 2020 include a minimal level of preservation (excluding extraordinary expenses such as major bridge repairs) that are based on FY 2020 expenses increased at 2.0 percent annually.

ENTERPRISE TOLL OPERATIONS
Florida Department of Transportation
117FY 2015 Annual Report Mid-Bay Bridge Authority
In order to resolve the above-noted issues, the Authority decided to take a two-pronged approach to mitigate the toll revenue increase required by the 2011 bond issue:
1. Restructure outstanding debt profile to reduce annual debt service and issue new bonds under a new indenture with lower covenant requirements coupled with the release of certain reserves – ultimately resulting in lower required toll revenues; and
2. Implement a toll rate schedule that is least obtrusive for locals and commuters while continuing to provide an economical direct/convenient route across the Choctawhatchee Bay to Destin.
The refinancing was undertaken in the first half of 2015 due to the following two factors:
1. Low market rates provided the Authority with the ability to refinance and restructure its debt at attractive rates, resulting in lower annual debt service and lower required toll revenues; and
2. The opening of the Spence Parkway allowed the Authority to benefit from the proven toll revenues.
As of September 30, 2015, bonds in the principal amount of $285 million remained outstanding from the Series 2015.
Each year, an amount of principal and accrued interest on the outstanding bonds becomes due and payable. This amount is known as the annual debt service. As a test of the ability of a facility to repay the annual debt service, a “coverage” calculation is performed. In accordance with the Master Indenture of Trust, gross toll revenues and investment earnings are first required to provide 100 percent of the administrative expenses. The amount of revenues remaining (net revenues) is then available for the payment of debt service. The adjusted revenues for any Fiscal Year must be no less than 1.40 times the Annual Debt Service on the Outstanding 1st Senior Lien Bonds and 1.20 times the Annual Debt Service on the Outstanding Senior Lien Bonds. A timeline of Mid-Bay Bridge bond sales for the facility is shown in Figure 8.3.
$21.7 millionRevenue Refunding
Bonds$11.5 million
Revenue Bonds
$25.5 millionRevenue
Bonds
$23.7 millionRevenue
Bonds
$34.9 millionRevenue Refunding
Bonds
$13.0 millionRevenue
Bonds
$2.9 millionRevenue
Bonds
$57.2 millionRevenue Refunding
Bonds
$29.0 million Revenue Refunding
Bonds
$30.8 million Revenue
Bonds
$25.1 million Revenue
Bonds
Note: A list of projects funded by each bond issue is included in Table 1.5 of this report.
2011 2015
$143.9 millionRevenue
Bonds$10.7 million
Revenue Refunding
Bonds
$227.0Revenue
Bonds$24.5
TaxableRevenue
Bonds$33.5
RevenueBonds
1991 1993 1997 2004 2007 2008
Figure 8.3 Mid-Bay Bridge Authority Bond Issues

ENTERPRISE TOLL OPERATIONS
Florida Department of Transportation
118 FY 2015 Annual ReportMid-Bay Bridge Authority
Table 8.13 provides a forecast of the revenues and expenses and amount available for the payment of debt service of the Mid-Bay Bridge through FY 2026. FY 2015 figures are based on a partial fiscal year basis (June 2, 2015 to September 30, 2015) as the Series 2015 bond issue closed on June 2, 2015. Interest earnings are based on estimated FY 2016 amounts (unaudited) and held constant thereafter.
Table 8.13 Mid-Bay Bridge Authority
Analysis of Debt Service Payment ($000) Authority FY 2015 (Partial) through Authority
FY 2026Authority
Fiscal Year(1)
Gross Toll Revenue
Interest Earnings
Administrative Expenses
Total Net
Revenue
Debt Service
Payment(2)
2015(3) $9,525 $88 $333 $9,280 $4,397
2016 24,854 212 735 24,331 17,174
2017 25,624 212 757 25,079 17,171
2018 26,518 212 780 25,950 17,723
2019 27,385 212 803 26,794 18,276
2020 28,117 212 827 27,502 18,836
2021 28,792 212 852 28,152 19,390
2022 29,431 212 878 28,765 18,915
2023 30,024 212 904 29,332 19,363
2024 30,580 212 931 29,861 19,367
2025 31,088 212 959 30,341 20,617
2026 31,545 212 988 30,769 20,620
Note: Interest Earnings and Administrative Expenses for FY 2015 are preliminary totals and are subject to change.
(1) Authority FY - October 1 - September 30.(2) Taken from the Official Statement for the Series 2015 Bonds.(3) From June 2, 2015, the date of closing on the Series 2015 Bonds.
Administrative expenses are based on estimated FY 2016 expenses (unaudited), inflated annually at 3.0 percent. It should be noted that the Authority’s fiscal year corresponds to that of Okaloosa County, starting October 1 and ending September 30. An assessment of the debt service coverage is provided in the Authority’s Annual Audited Financial Statements.