department of physics, university of texas, austin, tx
TRANSCRIPT

Journal of Electron Spectroscopy and Related Phenomena, 32 (1983) 327-341 Elsevier Science Publishers B.V.. Amsterdam - Printed in The Netherlands
ANGLE-RESOLVING PHOTOELECTRON ENERGY ANALYZER: MODE CALCULATIONS, RAY-TRACING ANALYSIS AND PERFORMANCE EVALUATION
H. A. S~VENS~, A. W. DONOHO, A. M. ~RNER and J. L. ERSKINE
Department of Physics, University of Texas, Austin, TX 78712 [U.S.A.)
(First received 15 March 1983; in final form 5 August 1983)
ABSTRACT
This paper describes comprehensive input-lens analysis, ray-tracing studies, empirical mode tests and performance evaluation for a Kuyatt-Simpson-type photoelectron energy analyzer. The analyzer has been designed specifically for angle-resolved photoemission studies using synchrotron radiation. Several operating modes are established using a computer code which combines matrix-optics techniques with ray tracing and least- squares analysis. The code is used to calculate the optimum input-lens voltages required to achieve a prescribed resolution at constant transmission. The modes are also established empirically and are characterized by computer ray-tracing. Performance tests conducted using synchrotron radiation demonstrate that the analyzer is capable of obtaining high- resolution (50 meV) angle-resolved (+- 1.5’) photoelectron spectra at good counting rates (” 10 kHz) without multichannel detection.
INTRODUCTION
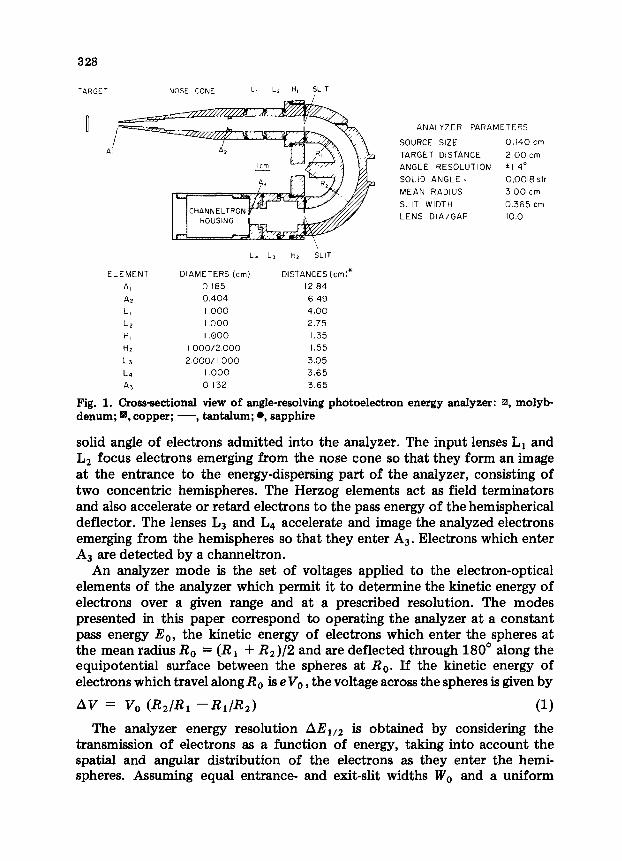
In a previous paper [l] , design considerations, electron-optics analysis and initial perfo~ance tests for an ale-resol~g electron energy analyzer were reported. The analyzer was designed specifically for use with synchrotron radiation. This requirement along with other considerations and constraints led to a configuration based on work by Kuyatt and Simpson 121. A cross- sectional view of the analyzer with all critical dimensions is shown in Fig. 1. The construction details and materials used have been described previously I31 *
The Kuyatt-Simpson analyzer consists of a nose cone, input and output cylindrical lenses, Herzog elements and a pair of hemispheres. The nose cone contains two real apertures Al and Az which determine the source area and
*Submitted in partial fulfiBment of requirements for the degree of Master of Arts in Physics, University of Texas.
0368-2048/83/$03.00 0 1983 Elsevier Science Publishers B.V.
323
TARGET NOSE CONE L. L? H, SLIT
L. L, HL SLIT
ELEMENT DIAMETERS (cm) DISTANCES (cm)*
Al 0 185 12 84
A2 0.404 6.49
Ll I.000 4.00
LP I.000 2.75
H I.000 1.35
HZ I000/2.000 1.55
L3 2.000/l 000 3.05
L4 I.000 3.65
A3 0 132 3.65
Fig. 1. Cross-sectional view of angle-resolving photoelectron energy analyzer: 8, molyb- denum; q , copper; -, tantalum; l , sapphire
lcm L.
-
CHANNELTRON
ANALYZER PARAMETERS
SOURCE SIZE 0.140 cm
TARGET DISTANCE 2.00 cm
ANGLE RESOLUTION *I 4”
SOLID ANGLE. 0.0018 str
MEAN RADIUS 3 00 cm
SLIT WIDTH 0.365 cm
LENS DlA/GAP 10.0
solid angle of electrons admitted into the analyzer. The input lenses L1 and LZ focus electrons emerging from the nose cone so that they form an image at the entrance to the energy-dispersing part of the analyzer, consisting of two concentric hemispheres. The Herzog elements act as field terminators and also accelerate or retard electrons to the pass energy of the hemispherical deflector. The lenses Ls and L4 accelerate and image the analyzed electrons emerging from the hemispheres so that they enter A3. Electrons which enter As are detected by a channeltron.
An analyzer mode is the set of voltages applied to the electron-optical elements of the analyzer which permit it to determine the kinetic energy of electrons over a given range and at a prescribed resolution. The modes presented in this paper correspond to operating the analyzer at a constant pass energy E,, the kinetic energy of electrons which enter the spheres at the mean radius R. = (R, + R,)/2 and are deflected through 180’ along the equipotential surface between the spheres at Ro. If the kinetic energy of electrons which travel along R0 is eV,, , the voltage across the spheres is given by
Av = V, C&/R, --RlIR,l (11
The analyzer energy resolution AEl,2 is obtained by considering the transmission of electrons as a function of energy, taking into account the spatial and angular distribution of the electrons as they enter the hemi- spheres. Assuming equal entrance- and exit-slit widths IV0 and a uniform
329
intensity distribution over the slit area, a triangular energy distribution function is obtained with full width at half-maximum (FWHM) given by
~,,,lEo = Wo/2Ro + (terms in CY~) (2)
The angular contribution to the energy half-width is negligible as long as
CY; < Wo/2Ro (3)
Electrons having energy greater than E. must be decelerated by the lens system, those with kinetic energy less than E. must be accelerated. This is accomplished by applying the appropriate voltage to the Herzog elements with respect to ground. The sphere voltages are adjusted so that the potential at R. is equal to the potential of the Herzog elements. The lens system including the Herzog elements performs two important functions. The input lenses accelerate or decelerate electrons emerging from the nose cone with energy E to energy E,. In order to obtain maximum detection efficiency (unity transmission function), the input lenses must also focus all electrons which exit the nose-cone aperture AZ with energy E + AE1,2 so that they enter the slit W. at an angle less than oo. The gap between the spheres, AR = R2 -R 1, is generally chosen sufficiently wide to guarantee that the spheres are not overfilled by electrons as long as the condition described by eqn. (3) is met. If the lens system functions properly, there is no need to have real slits at the entrance and exit points of the hemispheres. If such an analyzer (called a virtual-slit analyzer) is to function properly, it is important that the operating modes, specifically the lens 1 and lens 2 voltages, be specified correctly as functions of kinetic energy. This is the primary objective of the present paper.
ANGULAR RESOLUTION AND SOURCE-PARAMETER CONSIDERATIONS
The two apertures Ai and AZ which define the source region and angular acceptance of the analyzer are circular (respective diameters 0.185 and 0.404 cm) and are separated by 6.35 cm. Assuming a target to Ai distance of 2.0 cm and a source plane normal to the lens axis, it is possible to determine the source region and solid angle defined by the nose cone. A point source placed at the center of the source region yields a solid angle of + 1.4’. Taking into account the maximum possible source area associated with the ge- ometrical constraints, a solid angle of f 2.5’ and a source region - 0.28 cm in diameter are obtained. We have decided to choose nominal source parameters for our analysis of the analyzer which take into account these parameters and source images typical of synchrotron monochromators. A typical slit image from a 1 m Seya-Namioka or a 3 m torroidal grating monochromator is - 0.1 cm wide and can be considered to be a line source. Based on all of these considerations, we have chosen to use a source diameter of 0.140 cm
and a solid angle of k1.4’ to characterize the source for our ray-tracing studies. These values represent conservative choices in terms of predicted performance.
All ray-tracing results described in this paper assumed rays emerging from a point source located at the center of the defined source region. Effects resulting from off-axis rays were investigated by changing the maximum angle of rays emerging from As from t1.4’ to t2.5’. The primary effects of off- axis rays on analyzer performance are that the angular resolution is de~aded slightly? and the energy range over which the adyzer is able to achieve unity transmission (i.e., maximum transmission) is reduced. ~u~ti~tive analysis of these effects depends on the actual intensity d~tribution of the source over the source region defined by the input apertures. The ray- tracing results and calculated mode voltages presented in tbis paper are valid for the source size and acceptance angles specified, which represent our best estimate of the actual conditions encountered using synchrotron radiation.
The angular acceptance and source area defined by the nose-cone apertures are fixed, and are independent of electron kinetic energy and analyzer pass energy. This is true only if the nose cone and sample are at zero potential, and the target to first aperture distance remains constant. For a given pass energy (analyzer re~lution) and over a preseri~d kinetic-ener~ range, it is possible to select lens voltages which yield a constant analyzer ~~srn~sion function. In the present case, since no grids are used, the transmission func- tion is unity.
ANALYZER OPERATING MODES
A fixed (virtual) slit width is required to maintain a prescribed energy resolution when the analyzer is operated in a fixed-pass-energy mode. It is clear that if the analyzer is to maintain constant transmission and resolution as functions of kinetic energy it is sufficient to ensure that the lens voltages focus electrons at the slit so as to meet the correct retardation, width and angle conditions required by the prescribed resolution. Obtaining the necessary voltages is not an easy task, but they can be derived using two inde~ndent methods, one analytical and one empirical. The present Section outlines the aualytical procedure and results. The next Section describes an independent empirical method which yields basically the same results.
We have used the computer code COMOPT developed by C. E. Kuyatt at the National Bureau of Standards to compute the input-lens voltages which optimize the analyzer performance for a broad range of prescribed energy resolutions. A description of this computer code has been given previously, and a more detailed description is available [S] . Very briefly, COMOPT combines rna~-optics t~h~ques for ~yl~~~al lens systems with ray tracing and least-squares analysis so as to adjust selected lens parameters to
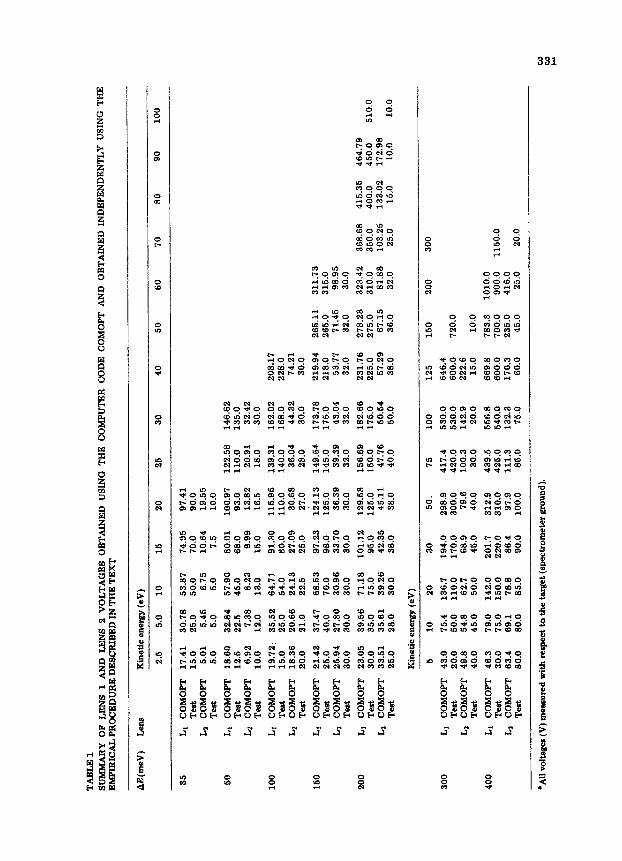
TABLE1
SUMMARY
OF LENS 1 AND LENS 2 VOLTAGES
OBTAINED
USING THE COMPUTER
CODE COMOPT
AND OBTAINED INDEPENDENTLY
USING THE
EMPIRICALPROCEDUREDESCRIBEDINTRETEXT
AE
(meV
} Le
ls
xiie
tic e
nerg
y (6
-V)
2.5
6.0
10
15
20
25
30
40
50
60
70
80
90
100
150
LI COMOPT
h
%&OPT
Test
200
L1 COMOP‘F
23.05 39.66 71.18 101.12 129.58 156.69 182.66
231.76 278.23 323.42 368.68 415.3s 464.79
Test
30.0
36.0
75.0
96.0
125.0
150.0
175.0
225.0
275.0
310.0
350.0
400.0
450.0
510.0
Lz COMOPT
33.51 36.61 39.26
42.36
45.11
47.76
50.54
57.29
67.15
81.38 103.25 133.02 172.98
Tegt
25.0
28.0
30.0
38.0
38.0
40.0
50.0
38.0
36.0
32.0
25.0
15.0
10.0
10.0
35
LI COMOPT
17.41 30.78 53.87
74.9
5 97
.41
Test
15.0
25.0
50.0
70.0
90.0
L* COMOPT
5.01
5.46
6.75
10.64
19.55
Test
5.0
5.0
5.0
7.6
10.0
50
L, COMOPT
18.60 32.84 57.90
80.01 100.97 122.58 146.62
TeSt
12.5
22.5
45.0
68.0
93.0
110.0
135.0
L* COMOPT
6.92
7.38
8.23
9.99
13.82
20.91
32.42
Test
10.0
12.0
13.0
15.0
16.5
18.0
30.0
100
Ll COMOPT
19.72, 35.52 64.71
91.80
Teat
15.0
26.0
54.0
80.0
L2 COMOPT
18.36 20.66 24.13
27.09
Test
20.0
21.0
22.6
25.0
21.43 37.47 68.63
97.23
25.0
40.0
70.0
98.0
25.94 27.80 30.96
33.70
30.0
80.0
30.0
30.0
115.95
110.0
30.68
27.0
124.13
126.0
36.39
30.0
139.31 162.02
208.17
140.0
168.0
228.0
36.04
44.32
74.21
28.0
30.0
30.0
149.54 173.78
219.94 265.11 311.73
145.0
175.0
218.0
265.0
315.0
39.39
43.04
53.77
71.45
98.95
32.0
32.0
32.0
32.0
30.0
Kin
etic
en
ergy
(e
V)
5 10
20
30
50.
75
300
L, COMOPT
43.0
76.4 136.7
194.0
298.9
417.4
Test
20.0
60.0 110.0
170.0
300.0
420.0
Lz COMOPT
49.8
54.8
62.7
63.9
79.6
100.3
Test
40.0
46.0
50.0
46.0
40.0
30.0
400
L, COMOPT
46.3
79.0 142.0
201.7
312.9
439.6
Test
30.0
76.0 150.0
220.0
310.0
426.0
b
COMOPT
63.4
69.1
78.3
86.4
97.9
111.3
Test
80.0
80.0
85.0
90.0
100.0
86.0
aAllvololtagea(V)meksuredwithlespedtothe~et(spectrometerground).
100
125
150
200
300
630.0
646.4
530.0
600.0
720.0
142.9
222.6
20.0
16.0
10.0
556.8
669.8
783.3 1010.0
540.0
600.0
700.0
900.0 1150.0
132.3
170.3
235.0
416.0
75.0
60.0
45.0
25.0
20.0
332
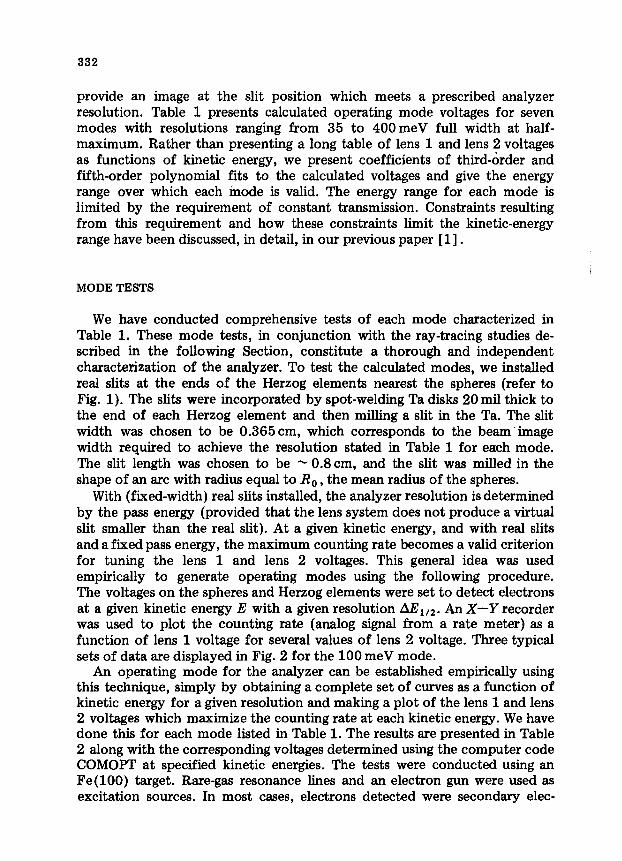
provide an image at the slit position which meets a prescribed analyzer resolution. Table 1 presents calculated operating mode voltages for seven modes with resolutions ranging from 35 to 400meV full width at half- maximum. Rather than presenting a long table of lens 1 and lens 2 voltages as functions of kinetic energy, we present coefficients of third-order and fifth-order polynomial fits to the calculated voltages and give the energy range over which each mode is valid. The energy range for each mode is limited by the requirement of constant transmission. Constraints resulting from this requirement and how these constraints limit the kinetic-energy range have been discussed, in detail, in our previous paper [l] .
MODE TESTS
We have conducted comprehensive tests of each mode characterized in Table 1. These mode tests, in conjunction with the ray-tracing studies de- scribed in the following Section, constitute a thorough and independent characterization of the analyzer. To test the calculated modes, we installed real slits at the ends of the Herzog elements nearest the spheres (refer to Fig. 1). The slits were incorporated by spot-welding Ta disks 20 mil thick to the end of each Herzog element and then milling a slit in the Ta. The slit width was chosen to be 0.365 cm, which corresponds to the beam image width required to achieve the resolution stated in Table 1 for each mode. The slit length was chosen to be - 0.8 cm, and the slit was milled in the shape of an arc with radius equal to R,, , the mean radius of the spheres.
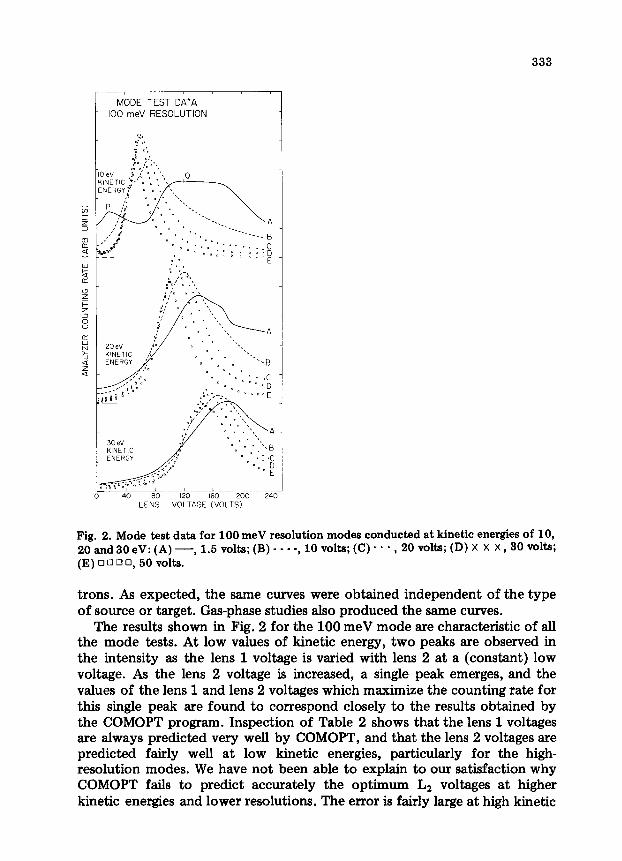
With (fixed-width) real slits installed, the analyzer resolution is determined by the pass energy (provided that the lens system does not produce a virtual slit smaller than the real slit). At a given kinetic energy, and with real slits and a fixed pass energy, the maximum counting rate becomes a valid criterion for tuning the lens 1 and lens 2 voltages. This general idea was used empirically to generate operating modes using the following procedure. The voltages on the spheres and Herzog elements were set to detect electrons at a given kinetic energy E with a given resolution AEl,Z. An X-Y recorder was used to plot the counting rate (analog signal from a rate meter) as a function of lens 1 voltage for several values of lens 2 voltage. Three typical sets of data are displayed in Fig. 2 for the 100 meV mode.
An operating mode for the analyzer can be established empirically using this technique, simply by obtaining a complete set of curves as a function of kinetic energy for a given resolution and making a plot of the lens 1 and lens 2 voltages which maximize the counting rate at each kinetic energy. We have done this for each mode listed in Table 1. The results are presented in Table 2 along with the corresponding voltages determined using the computer code COMOPT at specified kinetic energies. The tests were conducted using an Fe(lOO) target. Rare-gas resonance lines and an electron gun were used as excitation sources. In most cases, electrons detected were secondary elec-
333
MODE TEST DATA 100 meV RESOLUTION
Fig. 2. Mode test data for 100 meV resolution modes conducted at kinetic energies of 10, 20 and 30 eV: (A) -, 1.5 volts; (B) - - - -, 10 volts; (C) * . * , 20 volts; (D) X X X 9 30 Volts; (E) •I 0 q 0, 50 volts.
trons. As expected, the same curves were obtained independent of the type of source or target. Gas-phase studies also produced the same curves.
The results shown in Fig. 2 for the 100 meV mode are characteristic of all the mode tests. At low values of kinetic energy, two peaks are observed in the intensity as the lens 1 voltage is varied with lens 2 at a (constant) low voltage. As the lens 2 voltage is increased, a single peak emerges, and the values of the lens 1 and lens 2 voltages which maximize the counting rate for this single peak are found to correspond closely to the results obtained by the COMOPT program. Inspection of Table 2 shows that the lens 1 voltages are always predicted very welI by COMOPT, and that the lens 2 voltages are predicted fairly well at low kinetic energies, particularly for the high- resolution modes. We have not been able to explain to our satisfaction why COMOPT fails to predict accurately the optimum Lz voltages at higher kinetic energies and lower resolutions. The error is fairly large at high kinetic
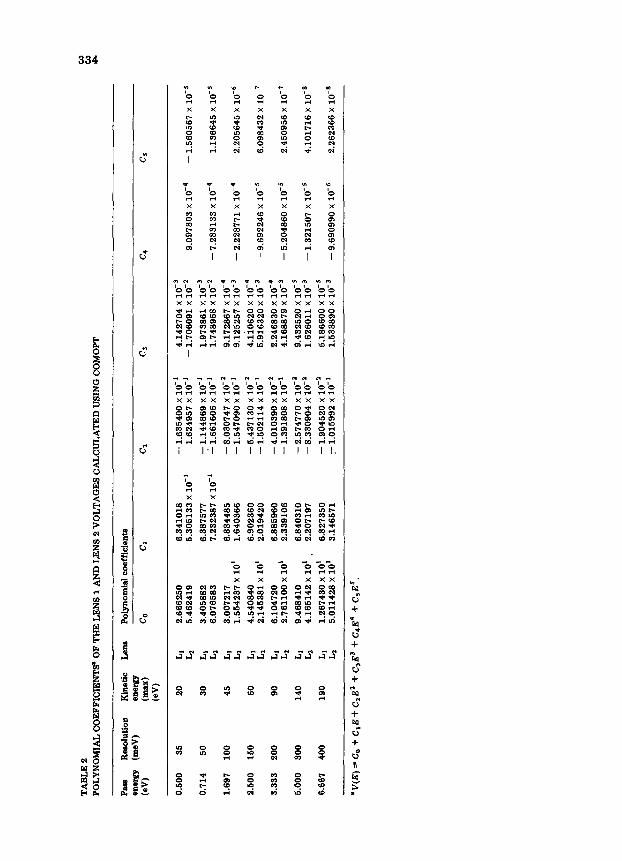
TABLE2
POLYNOMIALCOEFFICIENTS~OFTHELENS1ANDLENS2VOLTAGESCALCULATEDUSINGCOMOPT
Pm
Resolution Kinetic Lens
Polynomial coefficients
eneqy (meV)
ene%y
W)
(m)
CO
Cl
CZ
C3
C‘l
CS
(eV)
0.500
35
20
0.714
50
30
Lt
LP
1.697 100
45
2
2.500 150
60
LI
LI
3.333 200
90
LI
L2
6.000 300
140
2
6.667 400
190
2.666250
6.462419
3.405882
6.076583
3.007217
1.564237 X 10'
4.540840
2.145381~10'
6.164720
2.761100 x 10'
9.468410
4.165142 X 10'
1.267430 X10'
5.011428~10'
6.341018
-1.635400 x 10-l
-5.305133 x10_'
1.624957 x 10-l
6.387577
7.232387 X10-l
~1.144869 x10-l
-1.661606 x10-l
6.884485
-8.030747 x10-'
'1.640366
-1.547090 x10-l
6.902360
-5.437130 x10@
2.019420
-1.602114 X10-l
6.885960
-44.o1o39ox1o-2
2.339106
-1.391308 x 10-l
6.840310
-2.574770X10-*
2.207197
-8.330904 X10-'
6.827350
-l.Q0452OxlO-'
3.146571
F1.015992 x10-l
4.1427O4X1O-3
-1.706091~16~
9.097803 ~10-~
-1.560567 X10-*
1.973861X1O-3
1.748968 X10-'
-7.283133x10⁻⁴
1.136645 x10-'
9.172867x10⁻⁴
9.125257 x10⁻³
-2.228771X1O-4
2.205645 X1O-6
4.1io62ox1o-4
5.916320X10-"
-9.692246x10-'
6.098432x10-'
2.24683OX1O-4
4.168879X10+
-5.204860x10-'
2.450956x10-'
9.432520X10-'
1.626O11X1O-3
-1.321507 X10-'
4.101716 x10-'
5.1866oox1o-5
1.53389OX1O-3
-9.690990 ~10-~
2.262366X10-*
aV(E
) =
Co
+ C
,E
+ C
2E’
+ C
3E’
+ C4E4 + &
Es.

335
energies, although over most of the kinetic-energy range, significant differ- ences in the L2 voltage have only a minor effect on the counting rate. This is apparent from the mode test data shown in Fig. 2. For 30 eV kinetic energy, a change in the LZ voltage by a factor of 30 (from 1.5 to 50 V) changes the counting rate only by - 15%. Contour plots of resolution as a function of the L1 and LZ voltages obtained from COMOPT show that the program also finds a wide range of suitable LZ voltages for a particular Li voltage. We suspect that slight improvements in the optimization algorithm used in COMOPT will permit more accurate results. Our ray-tracing studies, described in the next Section, account for the general behavior of the curves shown in Fig. 2.
We also conducted ray-tracing and empirical tests using the counting rate as a criterion for establishing the optimum voltages for Ls and La. The requirements for this pair of lenses are simple. They must accelerate and focus electrons from the exit slit so that they enter the final aperture As. The aperture As is 0.132 cm in diameter, considerably smaller than the exit- slit width or length, and therefore sufficient acceleration is required to reduce the exit-slit image to less than As. We found that 20 V on Ls and 600 V on L4 (referenced to the Herzog voltage) yielded the best results. Ray-tracing studies indicate that these voltages produce the desired focusing. The Ls and L4 voltages do not depend strongly on the pass energy, as would be expected.
We investigated the analyzer resolution by measuring the width of the Fermi edge for Fe(lOO) for several operating modes and also by analyzing gas-phase photoelectron emission from argon gas. In all cases the results were as expected. We present here only some of the gas-phase results. This represents a definitive and worst-case test of the analyzer performance. Gas-phase photoemission occurs not in a plane as at a solid surface, but over a volume defined by the intersection of the photon beam with the solid angle defined by the analyzer nose cone. The source volume is there- fore larger than for a solid surface, representing a worse case for resolution tests.
Gas-phase data were obtained by admitting argon gas (P = 2 x 10m4 torr) through a 0.2 cm diameter capillary tube. The end of the tube was located within a few millimeters of the ideal target position. Monochromatic He(I) (21.22 eV) and He(I1) (40.82 eV) radiation from a resonance lamp was used to excite ionizing transitions to the 2P1,2 and 2P3,2 states of the argon ion. The ionization potentials of these states are known accurately from spectro- scopic data [4] : 2P1,2, 15.937 eV; 2Ps,2, 15.759 eV. In addition, the widths of the He (I) and He(I1) lines and the emission from gas-phase argon produce photoelectron line widths of a few meV. Therefore, this technique provides an excellent means of calibrating the spectrometer as well as a means of testing its resolution.

336
ARGON GAS 2P3,z /?,
P=2 x lo.4 TORR I 200 2kHz
I COUNTING
Y RATE
; 150 X He1
$00 IkHz - .
X
RESOLUTION
/
HeI
::.~~~~j:‘-I., , ,
520 540 560
HeII 0 1.0 20
248 250 252 PASS ENERGY (eV)
KINETIC ENERGY (eV)
Fig. 3. Gas-phase photoelectron spectra of the 2P ion state of argon gas. The graph shows the resolution and counting rate for He(I) excitation as functions of pass energy Eo: 0, He(I); 0, He(I1).
The actual resolution achieved in each mode was determined to be close to the predicted values. Figure 3(a) shows the argon gas-phase spectra obtained for the 100 and 50 meV modes. Also shown is the best resolution (25 meV) achieved using a low pass energy. Figure 3 (b) shows the intensity and resolution variations as functions of analyzer pass energy. Deviations from the theoretical resolution curve at low analyzer pass energies are probably due to stray magnetic fields. The tests described here were con- ducted with the analyzer mounted on a two-axis goniometer inside an 18” diameter stainless-steel chamber. All electrical leads were shielded from the target area, and the entire analyzer was enclosed in a grounded electrostatic shield. The 18” diameter chamber was lined with a heavy-gauge (0.060” thick) mu-metal shield which reduced the total magnetic field to values typically below 30 mGauss. Better magnetic shielding is necessary to achieve the calculated performance at pass energies below - 0.5 eV.
RAY-TRACING STUDIES
Ray-tracing techniques were used to study the behavior of the counting rate as a function of the lens 1 and lens 2 voltages. Ray-tracing results obtained with real slits in the model and with no slits were used to determine that the presence of slits does not affect the electron trajectories when proper focusing occurs. Clearly, during the mode tests, when the lens 1 and
337
RAY TRACING 100 meV MODE
KINETIC ENERGY q IO eV
LENS 2=15V
LENS 2 = 20V
NOSE CONE
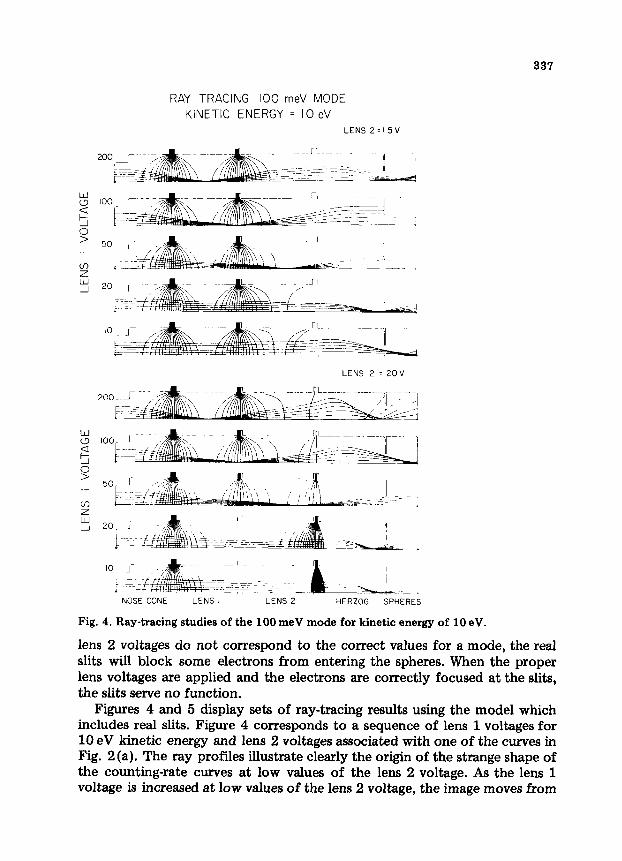
Fig. 4. Ray-tracing studies of the 100 meV mode for kinetic energy of 10 eV.
lens 2 voltages do not correspond to the correct values for a mode, the real slits will block some electrons from entering the spheres. When the proper lens voltages are applied and the electrons are correctly focused at the slits, the slits serve no function.
Figures 4 and 5 display sets of ray-tracing results using the model which includes real slits. Figure 4 corresponds to a sequence of lens 1 voltages for 10 eV kinetic energy and lens 2 voltages associated with one of the curves in Fig. 2 (a). The ray profiles illustrate clearly the origin of the strange shape of the counting-rate curves at low values of the lens 2 voltage. As the lens 1 voltage is increased at low values of the lens 2 voltage, the image moves from
338
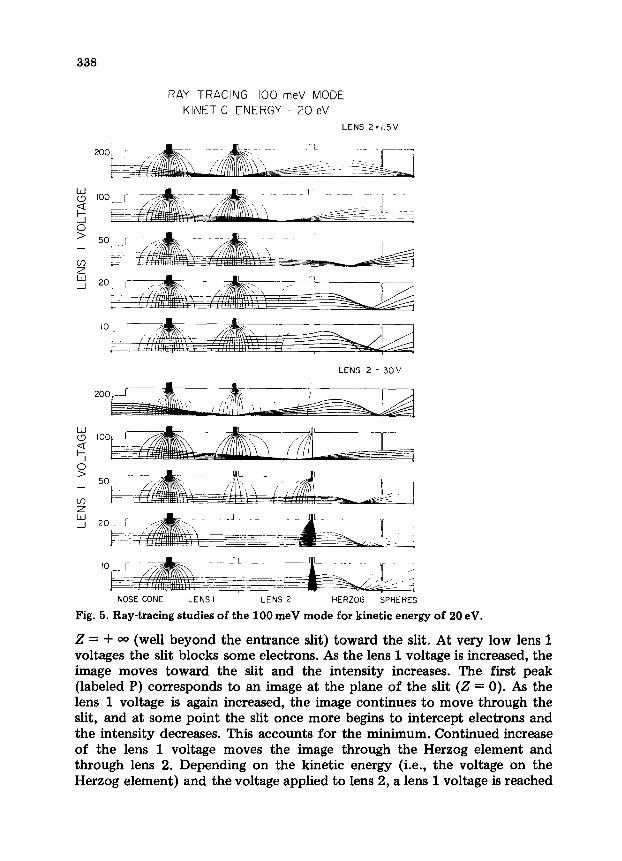
RAY TRACING 100 meV MODE
KINETIC ENERGY q 20 eV
LENS 2=l 5V
LENS 2 = 30V
NOSE CONE LENS I LENS 2 HERZOG SPHERES
Fig. 5. Ray-tracing studies of the 100 meV mode for kinetic energy of 20 eV.
2 = -I- 00 (well beyond the entrance slit) toward the slit. At very low lens 1 voltages the slit blocks some electrons. As the lens 1 voltage is increased, the image moves toward the slit and the intensity increases. The first peak (labeled P) corresponds to an image at the plane of the slit (2 = 0). As the lens 1 voltage is again increased, the image continues to move through the slit, and at some point the slit once more begins to intercept electrons and the intensity decreases. This accounts for the minimum. Continued increase of the lens 1 voltage moves the image through the Herzog element and through lens 2. Depending on the kinetic energy (i.e., the voltage on the Herzog element) and the voltage applied to lens 2, a lens 1 voltage is reached
339
which begins to form a second focal point between 2 = - OCJ and the entrance slit. We find that the operating modes determined by COMOPT and by our empirical procedure correspond to lens 1 and lens 2 voltages which produce one focal point somewhere in front of the slit, and produce a nearly parallel beam of electrons with the correct width to pass through the slits. This condition corresponds to the second broad peak in Fig. 4 (labeled Q). The final decrease in intensity results from the large angular divergence of electrons emerging from the slit at high lens 1 voltages. This overfills the spheres.
Figure 5 displays a set of ray-tracing results for a higher kinetic energy (20 eV), again corresponding to one of the lines in Fig. 2. At higher kinetic energies the second focus due to low values of the lens 2 voltage occurs at low voltages, and only a single peak is observed. Again, low counting rates are produced at low lens 1 voltages because the slits block improperly focused electrons, and also at high lens 1 voltages because the electrons emerging from the slits overfill the spheres. Correct lens 1 and lens 2 voltages fill the slit exactly with a beam of electrons having an angular divergence sufficiently small to meet the criterion given by eqn. (3).
ANALYZER PERFORMANCE USING SYNCHROTRON RADIATION
The electron energy analyzer described in this paper has been used to study the bulk and surface electronic properties of iron using synchrotron radiation. A description of the spectrometer will be given elsewhere [5, 61. Here, we briefly summarize the performance of the electron analyzer when used with synchrotron radiation under typical research conditions.
The experiments using synchrotron radiation were conducted using the Tantalus storage ring in Stoughton, WI. Light from the storage ring was dispersed by a 1 m Seya-Namioka monochromator with a gold-coated grating blazed for A = 500A and having 1200 lines/mm. No attempt was made to obtain an extremely accurate calibration of the slit widths (i.e., the exact monochromator resolution), and for most of the spectra recorded the counting rates were sufficiently high that the analyzer was operated in either the 50 or 100meV mode. The monochromator slits were set to give an overall resolution of 100 meV based on the width of the Fermi edge.
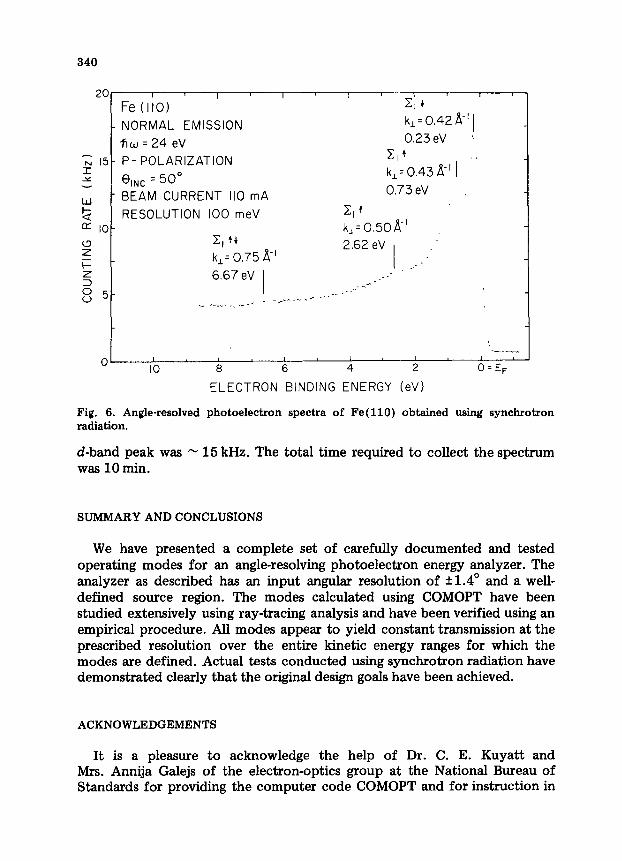
Figure 6 documents the performance. This spectrum was obtained with predominantly p-polarized light incident at 50” on an Fe(ll0) crystal with electrons collected in normal-emission geometry. This geometry probes bands along the r--N direction in Fz space [7], and p-polarization at -Bu = 24eV permits the Xi states to be excited at locations along the E line denoted by the kl values in the Figure. The stored beam current while this scan was taken was - 110 mA. The overall resolution of the spectra is - 100 meV, and at this resolution and beam energy, the counting rate at the
340
L” I
Fe(rtO) ’ ’ NORMAL EMISSION
hw=24eV
P- POLARIZATION
8 ,NC = 50”
BEAM CURRENT II0 mA
k1=0.42H“I
0.23 eV :
,“,I;‘,.,, H-1 I .’
0.73eV ,
RESOLUTION 100 meV
c, fh
k,= 0.75 ii-’
Cl ’ kl= 0.50,&’
2.62 eV . --
6.67 eV _I.
_:. __ ..’ - __.__ :- _ ._ ..,_... _. _ I” .__.. . _ 1 -~
0’ I
IO I 1 I
8 6 4 2
ELECTRON BINDING ENERGY (eV)
I
0 = E,
Fig. 6. Angle-resolved photoelectron spectra of Fe(ll0) obtained using synchrotron radiation.
d-band peak was - 15 kHz. The total time required to collect the spectrum was 10 min.
SUMMARY AND CONCLUSIONS
We have presented a complete set of carefully documented and tested operating modes for an angle-resolving photoelectron energy analyzer. The analyzer as described has an input angular resolution of k1.4’ and a well- defined source region. The modes calculated using COMOPT have been studied extensively using ray-tracing analysis and have been verified using an empirical procedure. All modes appear to yield constant transmission at the prescribed resolution over the entire kinetic energy ranges for which the modes are defined. Actual tests conducted using synchrotron radiation have demonstrated clearly that the original design goals have been achieved.
ACKNOWLEDGEMENTS
It is a pleasure to acknowledge the help of Dr. C. E. Kuyatt and Mrs. Annija Galejs of the electron-optics group at the National Bureau of Standards for providing the computer code COMOPT and for instruction in
341
its use. We would also like to thank E. M. Rowe and R. Otte of the synchro- tron radiation center for their assistance in conducting the synchrotron radiation work. This work was supported by the National Science Foundation under Grant DMR-79-23629 and by the Robert A. Welch Fpundation.
REFERENCES
1 G. K. Ovrebo and J. L. Erskine, J. Electron Spectrosc. Relat. Phenom., 24 (1981) 189.
2 C. E. Kuyatt and J. A. Simpson, Rev. Sci. Instrum., 38 (1967) 103. 3 G. K. Ovreho, M. A. Thesis, University of Texas (1981). 4 D. W. Turner, Molecular Photoelectron Spectroscopy, Wiley, New York, 1970. 5 A. M. Turner, A. W. Donoho and J. L. Erskine, Phys. Rev. B, in press. 6 H. A. Stevens, M. A. Thesis, University of Texas (1983). 7 A. M. Turner and J. L. Erskine, Phys. Rev. B, 25 (1982) 1983.