department of economics discussion paper series · department of economics discussion paper series...
TRANSCRIPT

ISSN 1471-0498
DEPARTMENT OF ECONOMICS
DISCUSSION PAPER SERIES
INTELLECTUAL PROPERTY AT THE FIRM-LEVEL IN THE UK: THE OXFORD FIRM-LEVEL INTELLECTUAL
PROPERTY DATABASE
Christian Helmers, Mark Rogers and Philipp Schautschick
Number 546 April 2011
Manor Road Building, Oxford OX1 3UQ
Intellectual Property at the Firm-Level in the UK:
The Oxford Firm-Level
Intellectual Property Database∗
Christian Helmersa Mark Rogersb,c
Philipp Schautschickd,e
a Universidad Carlos III de Madrid
b Harris Manchester College, University of Oxford
c Aston University
d International Max Planck Research School for Innovation and Competition
e Munich Graduate School of Economics
April 2011
ABSTRACT
This paper provides an overview of a new database that contains intellectual property data – in the form
of patents and trademarks – for the population of firms registered in the UK. The paper discusses the
principal challenges involved in the construction of this integrated database and provides an explanation
of the approach taken to address these issues. We employ the integrated dataset to provide descriptive
evidence on the firm-level use of intellectual property – including patents and trademarks – in the UK
over the period 2000-2007.
KEYWORDS: Firm, patents, trademarks, matching.
JEL Classification: L25, O12
∗We acknowledge financial support from the UKIPO and UK’s Business, Innovation and Skills Department.We benefited from comments from participants to the Comparative Analysis of Enterprise Data 2009 Conference,Tokyo. We are grateful to Steve Bond and Jonathan Haskel for helpful comments and suggestions. Contact:[email protected]
1 Introduction
Innovation is considered to be a major determinant of productivity growth and regarded as
crucial in ensuring sustainable economic growth as acknowledged in the Gowers Review of the
UK HM Treasury (2006). The question of how to achieve innovation and what role public policy
should play in the process, however, is far more controversial. This concerns both the type of
innovation that is considered most effective and the type of policy intervention best suited to
achieve the objective.1 In particular, the role of intellectual property (IP) in promoting innova-
tion and its diffusion is contested.2
Patents are the most studied registered IP right. Patents have been put in place as a way to
give firms an ex post reward in order to provide ex ante incentives to innovate. A patent holder
obtains the legal right to exclude competitors and third parties from using his invention, thereby
allowing the inventor to capitalize on it. This leaves inventors with the problem of financing the
development of the invention into an innovation. Only then, and if the innovation is successful,
can a return on the patent be made. A major strength of this system is that it leaves innovators
to make their investment choices in a decentralized manner (Scotchmer, 2004). Patents are thus
negative rights to an existing invention that only represent a valuable asset when third parties
can effectively be excluded from the use of the invention. This means that firms have to be
able to enforce their property rights against third parties in order to benefit from the patent. A
major controversy surrounding patents arises from this ability, since this may increase the price
to access and use the innovation, inhibit diffusion and hence overall innovation (Greenhalgh and
Rogers, 2010). Proponents of the patent system argue that disclosure of information required by
a patent application counterbalances the exclusive reward from that innovation. The relevant
questions in this context, therefore, revolve around the nexus between innovation, patent use
and firm performance.
At least since the work by Schmookler (1966) and Comanor and Scherer (1969), patents have
been used widely as an indicator of innovation both at the macro and the micro-level (OECD,
2009). As a measure of innovation, patents have the advantage that as a legal requirement they
can only be attributed to inventions that are ‘new to the world’.3 Importantly for empirical
research, patent data is readily available across many countries and time. One of the limitations
in its use as proxy for innovation, however, is the fact that patents do not have a one-to-one link
with inventions. For example, patents only cover certain types of inventions. This implies that
patenting propensities vary across sectors due to exogenous characteristics. However, variation
in patenting propensities across sectors arises also from endogenous firm decisions.4 For instance,
a firm may choose means other than patents in order to protect a patentable invention5 such as
1For example, Acemoglu et al. (2009) argue that in the context of climate-change related technologies, policyintervention in form of research subsidies is needed to re-direct innovation away from ‘dirty’ towards ‘green’technologies.
2For a broad discussion see Boldrin and Levine (2008). For a more narrow discussion of the role of IP inclimate-change related innovation, see Hall and Helmers (2010).
3The ‘novelty’ criterion is commonly interpreted as requiring that there must not exist a single document atthe time of claimed priority that contains all features of all claims made by a patent.
4Alexey and Reitzig (2010), for example, argue that firms such as IBM attempt to mold the appropriabilityregime governing the software industry by actively promoting open science through patent pledges.
5Seminal studies by Levin et al. (1987) and Cohen et al. (2000) surveyed US firms regarding their strategiesto appropriate returns to innovation. Their findings show the relative importance of alternative strategies such
2
secrecy or first-to-market.6 Related to this, patents may be used purely for strategic reasons,
for instance as a signalling device, thereby blurring the link between invention and patenting.7
In particular, patent filing strategies may make it difficult to establish a one-to-one link between
patent documents and the underlying inventions. This implies that the relationship between in-
novation, firms’ use of IP and the resulting performance is characterized by complex interactions
between exogenous and endogenous firm- and market-level characteristics, which has important
implications for the formulation of empirical research strategies and the interpretation of the
results.
There exists a growing body of empirical work on the nexus of innovation and firm behavior.8
Existing empirical studies show evidence of wide firm-heterogeneity with respect to innovation.
Even within the group of innovators, there exists broad heterogeneity with some producing
routinely a constant stream of highly valuable innovations, whereas the majority produce only
sporadically and much less drastic inventions. This variation is also reflected in firms’ use of
IP. The question of the application and effect of IP has to account for these differences and
hence inherently requires an empirical answer at the firm-level. The argument, however, goes
even further. Since patents, for example, take effect by excluding third parties from using the
patented technology, while at the same time disclosing the details of that technology, a patent
document on its own provides little insight with regard to its impact. Hence, an analysis of the
use and value of a patent is only possible at the most disaggregate unit of analysis: patent rights
combined with information on their owners and their economical environment. While patents
have attracted most attention, trademarks have been largely ignored, despite the fact that they
are much more common and are used across all sectors of the economy. Again, analysis of the
economic and strategic value of trademarks requires firm-level data, especially since the strategic
use of trademarking appears to be increasing (Greenhalgh and Rogers, 2010).
The provision of data combining information on intellectual property and its owners at the
firm-level faces an often under-appreciated difficulty: in most countries, there is no unique iden-
tifier allowing researchers to link intellectual property information directly to other firm-level
data.9 Instead, the names indicated on patent documents, including assignee and inventor
names, and the firm names contained in firm-level databases are used to merge both data sets.
Matching firm names across data sets is challenging for reasons to be discussed in detail below.
To avoid name-matching across data sets, a popular alternative is to ask firms directly about
their IP holdings in innovation surveys, the most well-known of which is the Community Inno-
vation Survey (CIS). While survey data accounts for a sizeable share of the empirical literature
on IP, which has generated a series of highly valuable insights, it usually only contains firms’
as secrecy and lead time.6Note that in the UK trade secrecy is also covered by law. However, enforcement through Common Law may
be difficult and secrecy is commonly achieved through confidentiality and non-disclosure agreements and contractswhich are (in principle) enforceable in court.
7For recent survey evidence on the strategic use of patents in the US see Jung and Walsh (2010).8The Handbook of the Economics of Innovation edited by Hall and Rosenberg (2010) provides a broad recent
overview of the existing body of evidence. See also Chapters 5 and 6 in Greenhalgh and Rogers (2010).9A notable exception to this is the Brazilian Institute for Industrial Property (INPI) that requires domestic
assignees to provide their tax number on a patent application, which provides a unique identifier to link patentdocuments to other data sets collected by the National Statistical Office.
3
self-reported qualitative information on their IP holdings.10 There is little quantitative evidence
on how reliable these self-reported numbers are, but experience with similar types of survey
questions suggests the potential for non-negligible and non-random measurement error. More-
over, the information on IP that is commonly obtained from such surveys rarely goes beyond
IP counts, providing little information on the IP’s characteristics, thus limiting the researcher’s
ability to gauge its value and use. Furthermore, the stratified nature of the sampling process
necessarily limits the range of research questions that can be addressed.
For these reasons, considerable effort has been exerted in a number of countries to construct
matched firm-level data sets. The most prominent of which is the NBER Patent data project
which links USPTO patent information to Computstat data (Hall et al., 2001; Cockburn et al.,
2009). More recently, the US Census Bureau matched also trademark data to the confidential
microdata in the US Business Register and Longitudinal Business Database (LBD) (Klimek and
Krizan, 2009). A similar database exists for Japan (Goto and Motohashi, 2007; Motohashi,
2009) and Australia (Buddelmeyer et al., 2010). In addition to these integrated national data
sets, Griffith et al. (2006), Thoma and Torrisi (2007), and Thoma et al. (2010) also matched
European Patent Office (EPO) and US Patent Office (USPTO) patents with Bureau van Dijk’s
Amadeus database, which contains information at the firm-level for about 13 million companies
across 41 European countries.
This paper reports on a new database of the IP activity – in the form of patents and trade-
marks – of the entire population of UK firms for the 2000-2007 period. The paper’s primary
objective is to introduce the data by providing a descriptive illustration of the use of IP at the
firm-level in the UK between 2000-2007. Our descriptive analysis points in several directions
for useful future research employing the dataset. Our aim is, therefore, to stimulate interest in
the empirical investigation of questions revolving around IP use at the firm-level in the UK and
to encourage empirical work by making the data freely available online.11 The paper’s second
objective is to discuss more generally the key data requirements and methodological challenges
involved in the construction of such an integrated database and to document how we tackled
these issues. We believe that awareness of these issues is required in order to gainfully employ
the data in applied research. We also hope that our detailed exposition of the methodological
and data-related challenges assists other researchers in the construction of similar integrated
datasets.
Section 2 describes the key data requirements and methodological challenges involved in the
construction of an integrated database. Section 3 describes the database creation and the nature
of the IP data. Section 4 contains an overview of patenting in the UK. Section 5 concludes.
2 Data and Methodological Challenges
In this section, we discuss different challenges in combining firm-level data sets with patent
information for analytical purposes. In general, survey design matters for statistical inference
if one or more components of the integrated data set are the result of (stratified) sampling.
10For a recent review of the relevant literature see Mairesse and Mohnen (2010).11http://www.epip.eu/datacentre.php
4
However, here population data are used for the construction of the integrated data set. This
allows us to focus on the difficulties involved in linking the different micro-data sets in order to
allow for valid statistical inference.
2.1 Key data requirements and challenges
The analysis of the link between firm behavior and intellectual property requires an integrated
data set that contains information on firm characteristics as well as IP. For expositional sim-
plicity, we assume that the objective is to link only two data sets, a data set containing all
the firm-specific information (which can be administrative or survey data), such as firm charac-
teristics, including firms’ SIC and accounting/financial information, and a data set containing
information on intellectual property. The challenge is to link both data sets to form a single
database that provides information at the firm-level on firm characteristics, performance mea-
sures as well as IP activity.
Commonly, the data sets that are to be linked come from samples of different but connected
populations. As noted by Chesher and Nesheim (2006), this implies the possibility of ‘many-to-
one’ linking, i.e., a firm may hold more than a single patent which may complicate the matching
process.12 Apart from this issue, there are two main challenges in constructing an integrated
database for analytical purposes. The first one relates to data availability and the second to the
actual matching process of the firm-level and IP data sets.
Data availability
In order to facilitate a general discussion, we assume that the firm-level data set at hand
covers either the population of firms in the UK or is a representative sample of it. Regardless,
two major problems remain with regard to the firm-level data set:
A) Data coverage across firms usually differs due to item non-response. In particular,
due to legal requirements, different firms report varying sets of information. This implies
that the information may not be missing at random but rather that a firm’s decision
to report data is a function of firm size and potentially other observed and unobserved
firm characteristics. This is important to bear in mind when designing the appropriate
empirical modeling strategy in order to avoid sample selection bias. Hence, missing data
has an effect on identification, inference and thus the choice of the appropriate statistical
methods.
B) Sample selection bias can also arise due to exit of firms. Growth rates of firms, for
example, can only be computed for firms that survived from one period to another. This
leads inevitably to a sample selection which is biased in favor of succeeding firms and can
therefore not be deemed representative of the underlying population of firms. To account
for this problem, information about firms that have exited, even several periods in the past,
12In fact, there are also several records in PATSTAT for the same patent, which complicates the matchingfurther. These multiple records correspond to different published documents, e.g. a first publication with theEPO is published and recorded with the kind code ‘A1’ and may be subsequently published and recorded againfor example with the kind code ‘A9’ which means that the patent application has been modified.
5
is required. This means that, ideally, the firm-level data set at hand does not drop firms
immediately after exit but keeps their records. This issue is also relevant for matching as
it is important to ensure that the firm-level data set contains all potential IP holders at
any given point during the period for which the integrated data set is constructed. Hence,
if a firm exits, it should nevertheless be kept in the firm-level database that is being used
for the construction of the integrated database as it may have held IP prior to market exit.
While these two problems are not specific to the construction of an integrated IP data set,
accounting for these problems in the construction phase will reduce their relevance and thus
their impact on the empirical analysis.
Linking data sets
Combining two data sets requires variables that are common across both data sets which
serve as identifiers. If both data sets contain the same unique identifier, for instance a firm’s
registered number, matching is less complicated. However, IP data sets are rarely equipped
with unique firm identifiers. Instead, IP documents provide names of applicants and inventors.
Therefore, firm and applicant names have to be used as link between the data sets. This gives
rise to the following two problems, also known as Type I and II errors, which have a strong
impact on the validity of any statistical analysis of the linked data set:
C) Exclusion of unmatched units (false negative): A given firm may not be allocated IP
although in reality it possesses IP.
D) Inclusion of erroneously matched units (false positive): There are firms that are
allocated IP although in reality they do not own any IP, i.e., they have been erroneously
attributed IP due to the matching process.
In practice, these two problems arise mainly due to the following reasons:
a. Firm and IP applicant names are not unique in both data sets;
b. Firm and IP applicant names are misspelled;
c. Firm and IP applicant names are spelled differently in both data sets; this can arise for a
number of reasons including different naming conventions;
d. Firm and IP applicant names contain different affixes, for example the firm name may
include ‘plc’ while the IP applicant name does not;
e. Firms change names over time. This can lead to different names for the same company
across data sets.
C) and D) represent a serious problem in the identification of the true distribution of the
variables of interest across firms because they cause measurement error. Also, increasing the
sample size does not mitigate the problem of that measurement error. These problems are exac-
erbated when individuals’ names, such as the names of companies’ directors, are matched with
an IP database. Therefore, considerable effort has to be devoted to minimizing measurement
error due to the matching process. The objective of the linking process, therefore, is to minimize
6
the occurrence of both problems C) and D).13
Here, firm and IP applicant names are standardized according to a specified algorithm in
order to counter both problems in automated matching. The algorithm needs to be designed
to balance the likelihood of committing Type C) and Type D) errors. This ‘cleaning’ algorithm
determines the quality of the match since names are only matched across data sets if they are
identical after they have been ‘cleaned’ by the algorithm. Some manual checking of unmatched
units should also be employed to reduce the incidence of problems C) and D). However, the
problem of name changes over time (point e. above) remains. To solve this problem, informa-
tion on firms’ previous names is needed.14
There are several problems that emerge independently of whether a unique identifier is
available in both data sets:
E) Transfer of IP (assignment): Firms may transfer their IP to other firms or individuals.
This occurs as a consequence of firm exit, merger and acquisition, or selling of IP. If such
assignments are not recorded in the IP database, the resulting match may be technically
correct, but still deliver a false match.15
F) Ownership structure of firms: Often, firms allocate their IP to specific subsidiaries
(related to point E) above, patents may also be transferred within a holding company). As
a result, the holding company may appear not to hold any IP. Alternatively, subsidiaries
may not hold any IP because all IP is assigned to the holding company. Thus, it may be
necessary to allocate IP held by all subsidiaries to their holding company, or to distribute IP
across subsidiaries - although this involves arbitrary judgment unless further information
is available. Related to this, firms undergo changes in their ownership structure. Hence,
the allocation of IP according to a firm’s ownership structure has to account for such
changes. Finally, business groups may also apply for patents through subsidiaries abroad.
Depending on the question of interest, it might be necessary to allocate these patents to
the UK holding company, although this is only possible if the international business group
structure is known. Similarly, UK-based subsidiaries of foreign companies may conduct
innovative activities in the UK, although the patent is applied for by the headquarter
abroad. While it is unclear to what extent this is common in practice, it may even motivate
the allocation of patents held by foreign multinationals to their UK-based subsidiaries.
Hence, to account for the internal allocation of IP across members of business groups,
information on firms ownership structure is needed.
13Manual matching is often infeasible due to the size of the data sets involved but, in any case, manual matchingmight also suffer from C) and D).
14In practice, PATSTAT does not update applicant names in most cases, which means that if only currentfirm names were available in the firm-level database, it would be impossible to allocate IP to a company thathad applied for IP under its old name. Given the widespread and frequent occurrence of name changes amongregistered companies in the UK, this would lead to a substantial number of false negatives.
15This seems to be indeed a problem in practice; as far as we are aware, in most cases, PATSTAT does notupdate its records when patents are re-assigned. The lack of data on patent re-assignments is a well-known issue inthe literature. Graham et al. (2010: 1274-1275) forward a possible explanation noting that ‘[b]ecause the marketfor buying and selling patents is presumably subject to extensive due diligence and other forms of contractingthat prevent fraudulent assignments of patents, arguably there is not as great a need to pay attorney’s and filingfees to record reassignments as with real property.’
7
2.2 Assessment of matching result
The assessment of the matching result is a pre-condition for drawing valid statistical inference
based on the integrated database. It allows an assessment of how well the problems listed in
Section 2.1 have been tackled and therefore of the extent of (non-)random measurement error
that may be present in the data base. In principle, there are two different reference groups to
assess matching success: IP and firms. This means that one can either look at the share of all
published patents that has been matched to the firm-level data set or at the share of applicant
names contained in patent documents that has been matched to the firm-level data set. Yet, in
general, the success in the construction of integrated data sets is difficult to assess. The main
reasons for this are:
G) Often, there exist no comparable matches of patents to firm-level data sets. Thus, there
is no existing benchmark against which the matching success could be compared.
H) Firm-level data sets vary in coverage. Even when firm-level data covering the population
of firms is available, the data only covers registered firms, which neglects very small firms
and self-employed individuals. If firm samples are used, coverage varies according to the
sampling methods and definitions, which usually involves differences in coverage according
to the definition of firm size.
I) Commonly, patent offices publish only aggregate information. The data usually contain
different types of patentees, such as private firms, individuals, universities, other public
institutions etc. This makes it difficult to gauge the number of patents taken out by the
registered businesses contained in the firm-level data set that could possibly be matched.
Apart from comparing the number of matched units against official data, a crucial part of
the assessment consists of the manual checking of both matched and unmatched units. This is
necessary in order to verify that matched units have indeed been correctly matched and that
there is no pattern among unmatched units.
3 An Integrated Firm-level Intellectual Property Database for
the UK
3.1 Components
The integrated database consists of two components: a firm-level data set and IP data. The
firm-level data is the Financial Analysis Made Easy (FAME) database that covers the entire
population of registered UK firms (FAME downloads data from Companies House records).16
In FAME, ‘firms’ represent registered firms, i.e., the legal entity that organizes production (ad-
ministrative unit), in contrast to census-type data that often uses the plant or production unit.
FAME is a commercial database provided by Bureau van Dijk.17 To construct the latest version
of the database, two versions of the FAME database have been used: FAME October 2005 and
March 2009. The main motivation for using two different versions of FAME is that FAME keeps
16All limited companies in the UK are registered at Companies House, which is a government agency. Seewww.companieshouse.gov.uk
17Note that Amadeus, a pan-European firm-level database provided by Bureau van Dijk contains only a subsetof firms contained in FAME. See http://www.bvdep.com/en/FAME.html
8
details of ‘inactive’ firms (see below) for a period of four years. If only the 2009 version of FAME
were used, intellectual property could not be allocated to any firm that has exited the market
before 2005, which would bias the matching results (see B) Sample selection bias due to
exit of firms above). FAME is available since 2000, which defines the earliest year for which the
integrated data set can consistently be constructed. However, IP stocks can be constructed for
firms as IP data is available pre-2000. Since there are significant reporting delays by companies,
using the FAME 2009 version means that the latest year for which firm-level data can be used
reliably is 2007.
FAME contains basic information on all firms, such as name, registered address, firm type
and industry code. Availability of financial information varies substantially across firms. In
the UK, the smallest firms are legally required to report only very basic balance sheet infor-
mation (shareholders’ funds and total assets). The largest firms provide a much broader range
of profit and loss information, as well as detailed balance sheet data. Nevertheless, the lim-
ited availability of a range of financial and structural information limits the range of potential
research questions that can be reasonably answered by using FAME.18 In terms of numbers
of firms, FAME October 2005 contains information on around 3.1 million firms (of which 0.9
million are inactive). The FAME March 2009 data contain 3.8 million firms (of which 1 million
are inactive). Inactive firms are those that have exited the market and belong to one of the
following categories: dissolved, liquidated, entered receivership or declared non-trading. FAME
contains firms’ Companies House registered numbers, which means that it can easily be linked to
other data sets that also contain registered numbers, such as the ICC British Company Directory.
The intellectual property data come from two different sources: Marquesa Ltd and the EPO
Worldwide Patent Statistical Database (PATSTAT). Marquesa Ltd supplied data on UK trade-
mark publications and Community marks registered. The Community trademark data include
International Marks designating the EU. Data on UK and EPO patent publications by British
entities were downloaded from PATSTAT version April 2010.19 Due to the on average 18 months
delay between the filing and publication date of a patent, using the April 2010 version means
that the patent data are presumably only complete up to the third quarter in 2008. This ef-
fectively means that we can use the patent data only up to 2007. PATSTAT combines patent
information from several sources: DocDB (the EPO master bibliographic database containing
abstracts and citations), PRS (the patent register for legal data), EPASYS (the database for
EP patent grant procedure data), and the EPO patent register as well as the USPTO patent
database for names and addresses of applicants and inventors. PATSTAT covers patent applica-
tions made to 80 patent offices worldwide and provides bibliographic details on over 60 million
patent applications. Importantly, it also includes information on PCT patent applications while
alternative patent databases such as the EPO ESPACE Bulletin do not.
18Eberhardt and Helmers (2010) show, for example, that conducting firm-level productivity analysis with FAMEis a challenging task and is limited to a substantially reduced subset of firms compared to the population of firmsin principle available in FAME.
19A new version of PATSTAT is released twice a year in April and September.
9
3.2 Matching FAME and IP
Since IP records do not include the registered number of a company even if the applicant is a
registered business, it is not possible to merge data sets using a unique firm identifier; instead,
applicant names in the IP documents and firm names in FAME have to be matched. Both, a
firm’s current and previous name(s), were used for matching in order to account for changes in
firm names (see point e. in Section 2.1 above). Matching on the basis of company names requires
names in both data sets to be ‘standardized’ prior to the matching process in order to ensure
that small (but often systematic) differences in the way names are recorded in the two data
sets do not impede the correct matching (see points a.-d. in Section 2.1 above). Once names
have been standardized, they are only considered a match if they are identical.20 Inevitably,
the standardization code is the core element determining the matching success. Consequently,
considerable care has been exerted to ensure a balancing of Type I and II matching errors. To
further reduce the incidence of both errors, we manually checked random draws from the set of
successful matches to reduce the likelihood of the occurrence of false positives in the matched
data. To also correct for false negatives, we manually searched for approximately 3,000 ran-
domly selected firms from the set of unmatched applicants contained in PATSTAT (in total
about 10,000) in FAME.21 We were unable to discover systematic false negatives; those false
negatives that we detected appeared to have occurred randomly due to misspellings in either
firms’ or IP applicants’ names. Those false negatives detected by manually checking the set of
unmatched firms were added to the matched data. Hence, we are confident that the match-
ing algorithm avoids false positives and produces only random false negatives, which suggests
external validity of any analysis conducted based on the integrated data set. Note that we
do not have any information on patent assignments, which means that problem E) Transfer
of patents cannot be tackled. In contrast, FAME contains information on firms’ ownership
structure, which is used to also allocate IP across business groups and thus to address problem
F) Ownership structure of firms. However, the data described here and made available
online do not account for business groups because the allocation of IP across holdings involves
arbitrary decisions which we preferred to avoid in this present context.
Gauging the outcome of the matching procedure requires comparison of the data to exter-
nal sources. This is difficult since there have been no comparable matches of IP to UK firms.
Nevertheless, some insight can be gained from looking at official data on all IP activity. Table
1 summarizes the matches and also some official sources for the year 2003. The official sources
count all IP from UK residents, whether corporate or personal, hence one would expect them
to be greater. Moreover, FAME only contains registered firms and there are a large number of
unregistered businesses in the UK.
As can be seen from Table 1, the number of patent publications matched is around 57%
for UK patents and 83% for EPO patents resulting in an overall matching success of about
62.4% for patents. As mentioned above, imperfect match rates should be expected because IP
20Alternatively, one could use probabilistic matching, although in our experience, this increases the risk of falsepositives disproportionately. For this reason, we preferred to concentrate on optimizing the standardization codeto balance the occurrence of false positives and negatives. For a recent overview of available matching methodssee Thoma et al. (2010).
21Firms were identified by looking for indicators like ‘ltd’ or ‘plc’ etc. in the applicant name available inPATSTAT.
10
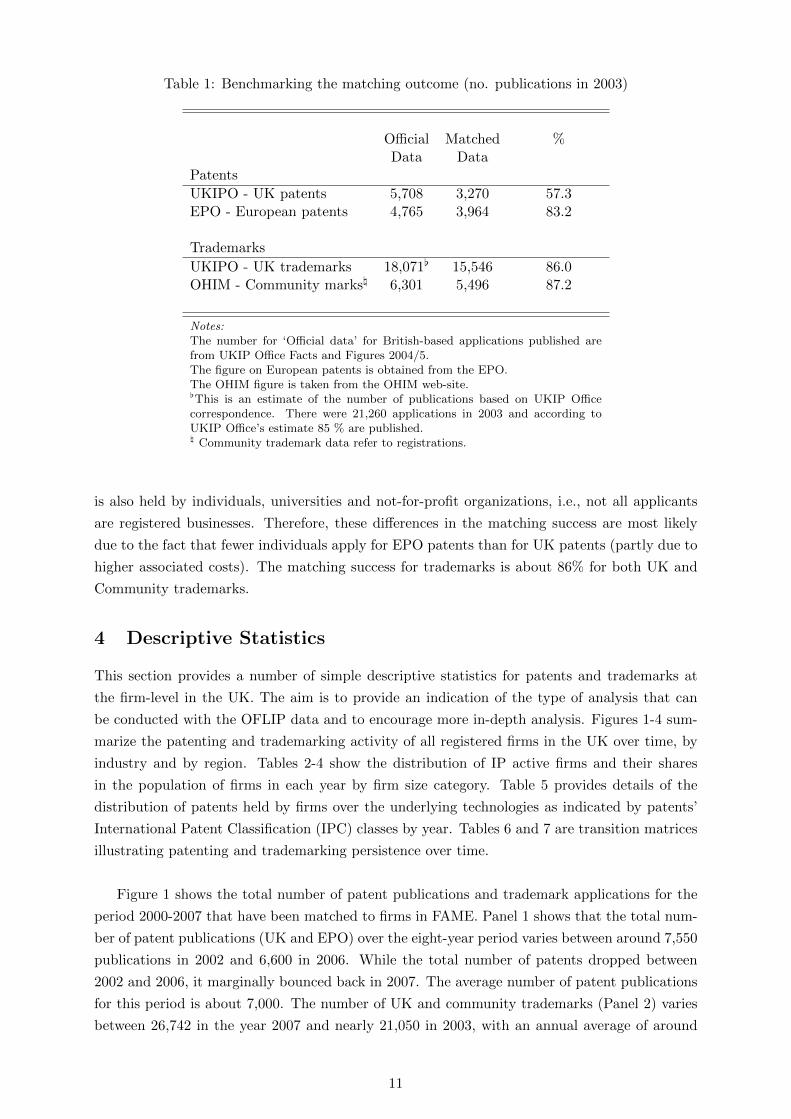
Table 1: Benchmarking the matching outcome (no. publications in 2003)
Official Matched %Data Data
Patents
UKIPO - UK patents 5,708 3,270 57.3EPO - European patents 4,765 3,964 83.2
Trademarks
UKIPO - UK trademarks 18,071[ 15,546 86.0OHIM - Community marks\ 6,301 5,496 87.2
Notes:The number for ‘Official data’ for British-based applications published arefrom UKIP Office Facts and Figures 2004/5.The figure on European patents is obtained from the EPO.The OHIM figure is taken from the OHIM web-site.[This is an estimate of the number of publications based on UKIP Officecorrespondence. There were 21,260 applications in 2003 and according toUKIP Office’s estimate 85 % are published.\ Community trademark data refer to registrations.
is also held by individuals, universities and not-for-profit organizations, i.e., not all applicants
are registered businesses. Therefore, these differences in the matching success are most likely
due to the fact that fewer individuals apply for EPO patents than for UK patents (partly due to
higher associated costs). The matching success for trademarks is about 86% for both UK and
Community trademarks.
4 Descriptive Statistics
This section provides a number of simple descriptive statistics for patents and trademarks at
the firm-level in the UK. The aim is to provide an indication of the type of analysis that can
be conducted with the OFLIP data and to encourage more in-depth analysis. Figures 1-4 sum-
marize the patenting and trademarking activity of all registered firms in the UK over time, by
industry and by region. Tables 2-4 show the distribution of IP active firms and their shares
in the population of firms in each year by firm size category. Table 5 provides details of the
distribution of patents held by firms over the underlying technologies as indicated by patents’
International Patent Classification (IPC) classes by year. Tables 6 and 7 are transition matrices
illustrating patenting and trademarking persistence over time.
Figure 1 shows the total number of patent publications and trademark applications for the
period 2000-2007 that have been matched to firms in FAME. Panel 1 shows that the total num-
ber of patent publications (UK and EPO) over the eight-year period varies between around 7,550
publications in 2002 and 6,600 in 2006. While the total number of patents dropped between
2002 and 2006, it marginally bounced back in 2007. The average number of patent publications
for this period is about 7,000. The number of UK and community trademarks (Panel 2) varies
between 26,742 in the year 2007 and nearly 21,050 in 2003, with an annual average of around
11
23,300.
Figure 2 shows the shares of patents and trademarks by sector for a single year (2005).
The shares are computed as the number of published patents in a sector divided by the total
number of patent publications in each year. Interestingly, the figure shows that the by far most
patent active sector in absolute terms in 2005 was other manufacturing (which excludes high-
and medium-tech firms) with 22% of all patents published in 2005,22 followed by Business and
R&D Services with a share of 15% and 12%, respectively. Furthermore, high- and medium-tech
sectors are also relatively patent active with patent shares of 7.5%. As expected, given the
limited patentability of the services provided, the least patenting-intensive sector is the finance
and real estate sector (SIC 65-71).23 Trademark activity is most intense in wholesale, retail and
hotel industries where 23% of trademarks originate in 2005, again followed by business services
and other manufacturing industries with shares of 19% and 17%, respectively.
Figure 3 shows a breakdown of patenting and trademarking shares within the manufacturing
sector – which traditionally is considered the most IP active sector of the economy – at the SIC
3-digit level. Manufacturing of chemicals and chemical products clearly dominates other man-
ufacturing industries in terms of patents, followed by producers of machinery and equipment,
medical and optical instruments, metal products and furniture. Figure 3 suggests that trade-
marks may be better suited than patents to study innovation in certain sectors such as food and
beverages or publishing and printing.
Finally, Figure 4 shows the distribution of patenting firms by postcode areas for 2005.24
Again the figure shows shares of patenting firms, which explains the seemingly low patenting
activity in the Central London area. This is due to the relatively large number of non-patenting
firms in service industries in these postcode areas. The most patenting-intensive postcode areas
are Oxford and Cambridge, which is explained by the density of high-tech companies in the
R&D (SIC 73) and manufacturing sector (see definition given above).
In Table 2, we use firm-level information to group IP active companies into firm size cat-
egories.25 The table shows that micro firms are substantially under-represented in the sample
of IP active companies (50%) relative to their share in the population of registered businesses
(88%). On average, small and medium sized firms together account for just under a third of all
IP active firms and large firms for about a fifth.26 Hence, we find that the shares of each category
within the sample of IP active firms are inversely related to their shares in the population.
22According to the OECD definition, high-tech sectors include: SIC 2423 pharmaceuticals, SIC 353 aircraftand spacecraft, SIC 30 office, accounting and computing machinery, SIC 32 radio, television and communicationequipment, and SIC 33 medical, precision and optical instruments. Medium-tech sectors include: SIC 24 [exclud-ing 2423] chemical and chemical products, SIC 29 machinery and equipment, SIC 31 electrical machinery andapparatus, SIC 34 motor vehicles, trailers and semi-trailers, and SIC 352 & 359 railroad and transport equipment.
23The seemingly low innovative activity measured by patent counts in the financial services sector in the UKwas noticed by Haskel and Pesole (2010).
24Firms are allocated into geographical areas by using their postcodes provided by FAME.25An IP active firm is defined as any firm that applied for at least one patent and/or trademark in a given year26Firm size categories small, medium and large are determined according to EU definitions. We start by defining
firm size using total assets which are available for all firms in FAME and then place firms into a higher firm sizecategory if either their employment or turnover crosses a larger firm size threshold.
12
Tables 3 and 4 show the shares of patenting and trademarking firms in the population of
firms contained in FAME for each size category. As for patents, the table shows that on average
only 0.11% of micro-sized firms apply for a patent in a given year compared to 1.15% and 2.10%
of medium-sized and large firms respectively. This pattern could, for example, reflect the direct
and indirect costs inherent to a patent application, which may be particularly taxing for smaller
firms.27 We flag these differences in patenting shares across firm size categories as an issue of
further research. While we find in Table 4 that a considerably larger share of firms applies for
trademarks than for patents, the pattern across size categories is similar to that for patents
shown in Table 3. Hence, these figures illustrate the heterogeneity across firms referred to in
the introduction. Moreover, these tables highlight another interesting observation: the share of
patenting and/or trademarking firms in the population of firms is surprisingly low. For example,
with regard to patents, our figures imply that well over 99% of registered businesses in the UK
do not apply for a single patent during the eight-year period 2000-2007.
Further insights can be gained by cross-tabulating information on technologies provided
by patent documents and industry classifications reported in firm-level data. The Interna-
tional Patent Classification (IPC) provides language independent symbols for a categorization
of patents into classes which are determined by different areas of technology. In order to ag-
gregate the different IPC subclasses for Table 5, we mapped IPC codes into broader technology
classes employing a concordance table.28 Table 5 provides a yearly break-down of the most
common technology classes in OFLIP. The table shows that the most common IPC is related
to pharmaceuticals (8.7% of all patents assigned to companies between 2000-2007). Note also
that organic fine chemistry has a relatively high share (7.4%), followed by thermal processes
and apparatus, electrical machinery and energy and biotechnology (around 5%). This reflects
the UK economy’s traditional strength in these sectors. Nevertheless, the table indicates that
the shares of pharmaceuticals and organic fine chemistry inventions peaked in 2002 at 15% and
11.4%, respectively, and declined since, while the share of other IPC classes, as for instance
medical technology and computer technology, is increasing. This type of table can, of course, be
prepared using only patent data; however, the OFLIP data allow investigation of the underlying,
firm-level activity behind these trends.
Table 6 shows the transition matrix for patenting firms year-on-year (where ‘patenting firm’
is again defined as a firm that patents at least once during the period). For example, there is
only a 16% chance that a firm that has not patented in a given year applies for a patent in
the subsequent year. However, firms that applied for more than 20 patents tend to do so again
with a 68% probability which most likely reflects the fact that those few firms that are able to
apply for so many patents within a single year do so routinely. This table has obvious links to
the persistence of innovation literature (see for example Raymond et al., 2010). However, in
many cases empirical work uses survey based samples, such as the CIS in the case of Raymond
et al. (2010), whereas OFLIP can analyze the full sample of patentees as in this case, or even
all firms in the sector or economy. Moreover, the panel nature of OFLIP allows to disentangle
27See Helmers (2011) for a discussion of the use of IP across firms of different size.28The concordance table that maps IPC class symbols to technology categories was developed by the Fraunhofer
ISI and the Observatoire des Sciences et des Technologies in cooperation with the French patent office (seeSchmoch, 2008).
13
true persistence, i.e., the causal effect of patenting in time t on a firm’s probability to patent in
time t + 1 from unobserved heterogeneity. Table 7 shows the corresponding transition matrix
for trademarkers. The most striking difference with respect to Table 6 is the considerably lower
probability that a firm, which applied for more than 20 trademarks in t, applies for more than
20 in t + 1 (now 43%). There also appears to be much less persistence in trademarking, as
the probability that a firm obtains a trademark in time t + 1 conditional on having registered
a trademark in time t is 9%. It might be interesting to disentangle in future work to which
degree IP activity in one period enables a firm to seek IP also in a subsequent period from other
confounding factors.
Therefore, Table 7 completes our descriptive mapping of IP activity at the firm-level in the
UK. We have shown that IP data at the firm-level allow us to uncover an enormous amount
of heterogeneity in terms of IP activity across firms, size categories, industries, technologies,
and geographical areas. There is ample scope to explore the underlying causes for this large
dispersion of IP use at the firm-level.
5 Conclusion
Interest in innovation and its determinants has been increasing substantially in many contexts
over the past few years. There is an on-going heated debate over the role of intellectual property
in promoting innovation and its diffusion. This creates the need for empirical evidence to inform
policy, especially concerning high-tech start-ups and high growth firms which are believed to
make the most substantial contribution to economic growth (Shane, 2009). Despite the wide
interest in these issues, there is still a dearth of empirical evidence on innovation policy issues
related to the use and effect of intellectual property. One reason for this may be the lack of
appropriate databases. Lerner (2009: vii), for example, in a recent book about innovation
policy and specifically venture capital and entrepreneurship, admits early on that ‘the academic
literature is sparse: economists have only recently turned to the question of how to boost
entrepreneurship [...] empirical studies are much fewer in number [than theory papers] and
generally less sophisticated’. With this as background, this paper makes two contributions:
first, it describes the creation of a new database – the Oxford Firm-Level Intellectual Property
(OFLIP) database. In particular, we provide a detailed description of the data requirements
and methodological challenges that we faced when constructing our integrated database and
how we tackled these challenges. There has been increasing interest in such integrated firm-level
IP data sets. Therefore, by providing detailed documentation for OFLIP, we hope to not only
facilitate the use of our freely accessible data, but also to facilitate the construction of similar
data sets in other countries or contexts. Secondly, we employ the data set to provide a range of
descriptive statistics on the firm-level use of IP in the UK. The objective is to suggest a number
of empirical patterns in the data that may motivate other researchers to analyze a wide range
of innovation issues using OFLIP.
14
References
[1] Acemoglu D., P. Aghion, L. Bursztyn, and D. Hemous (2009): ‘The Environment and Di-
rected Technical Change,’ NBER Working Paper No. 15451.
[2] Alexey O. and M Reitzig (2010): ‘Gaining It by Giving It Away: Capturing Value in Mixed
Appropriability Regimes,’available at SSRN: http://ssrn.com/abstract=1430328
[3] Boldrin M. and D. Levine (2008): ‘Against Intellectual Monopoly’, Cambridge University
Press.
[4] Buddelmeyer, H., P. Jensen, E. Webster (2010): ‘Innovation and the determinants of com-
pany survival’, Oxford Economic Papers 62: 261-285.
[5] Chesher A. and L. Nesheim (2006): ‘Review of the Literature on the Statistical Properties
of Linked Datasets,’ DTI Occasional Paper No. 3.
[6] Cockburn I., A. Agrawal, J. Bessen, S. Graham, B. Hall, and M. MacGarvie (2009): ‘The
NBER Patent Citations Datafile Update’.
[7] Cohen W. M., R. R. Nelson, and J. Walsh (2000): ‘Protecting Their Intellectual Assets:
Appropriability Conditions and Why U.S. Manufacturing Firms Patent (or Not),’ NBER
Working Paper No. 7552.
[8] Comanor W. and F. M. Scherer (1969): ‘Patent Statistics as a Measure of Technical Change,’
Journal of Political Economy, Vol. 77, No. 3, pp. 392-398.
[9] Eberhardt M. and C. Helmers (2010): ‘Untested Assumptions and Data Slicing: A Critical
Review of Firm-Level Production Function Estimators,’ Working Paper No. 513, Department
of Economics, University of Oxford.
[10] Goto A. and K. Motohashi (2007): ‘Construction of a Japanese Patent Database and a first
look at Japanese patenting activities,’ Research Policy, Vol. 36, pp. 1431?1442.
[11] Graham S., R. P. Merges, P. Samuelson and T. M. Sichelman (2010): ‘High Technology
Entrepreneurs and the Patent System: Results of the 2008 Berkeley Patent Survey,’ Berkeley
Technology Law Journal, Vol. 24, No. 4, pp. 255-327.
[12] Greenhalgh C. and M. Rogers (2010): ‘Innovation, Intellectual Property, and Economic
Growth,’ Princeton University Press.
[13] Griffith R., R. Harrison, and G. Macartney (2006): ‘Matching patents to firm accounting
data for European countries,’ Paper presented at the EPIP Workshop on Patent Data,
Universita Luigi Bocconi, Italy.
[14] Hall B., A. Jaffe, and M. Trajtenberg (2001): ‘The NBER Patent Citations Data File:
Lessons, Insights, and Methodological Tools’, NBER Working Paper No. 8498.
[15] Hall B. and C. Helmers (2010): ‘The role of patent protection in (clean/green) technology
transfer, Santa Clara High Technology Law Journal, Vol. 26(4), pp. 487-532.
[16] Hall B. and N. Rosenberg (2010): ‘Introduction to the Handbook,’ Handbook of the Eco-
nomics of Innovation, (eds.) Hall B. and N. Rosenberg, Volume I, Chapter 1, Elsevier.
15
[17] Haskel J. and A. Pesole (2010): ‘Productivity innovation in UK financial services: an
intangible assets approach,’ Paper presented at the COINVEST Conference on Intangible
Investments at Macro and Micro Levels and Their Role in Innovation, Competitiveness and
Growth , Lisbon.
[18] Helmers C. (2011): ‘Firm Size and Intellectual Property Management,’ mimeo.
[19] HM Treasury (2006): ‘Gowers Review of Intellectual Property.’
[20] Jung T. and J. Walsh (2010): ‘What Drives Strategic Patenting?: Evidence from the
Georgia Tech Inventor Survey,’ mimeo.
[21] Klimek S. and C.J. Krizan (2009): ‘The Patenting and Trademark Activities of U.S. Firms’,
US Census Bureau.
[22] Lerner J. (2009): ‘Boulevard of Broken Dreams: Why Public Attempts to Boost En-
trepreneurship and Venture Capital have Failed,’ Princeton, Princeton University Press.
[23] Levin R. C., A. K. Klevorick, R. R. Nelson, S. G. Winter, R. Gilbert and Z. Griliches
(1987): ‘Appropriating the Returns from Industrial Research and Development,’ Brookings
Papers on Economic Activity, Vol. 3, pp. 783-831.
[24] Mairesse J. and P. Mohnen (2010): ‘Using Innovation Surveys for Econometric Analysis,’
Chapter for Handbook of the Economics of Innovation, B. H. Hall and N. Rosenberg (eds.),
Elsevier.
[25] Motohashi K. (2009): ‘Innovation and Firm Growth: A First Look at Linkage Data of
Japanese Patent and Enterprise Census’, University of Tokyo, mimeo.
[26] OECD (2009): ‘Innovation in Firms: A Microeconomic Perspective,’ ISBN 978-92-64-05620-
6.
[27] Raymond, W., P. Mohnen, F. Palm, S. van der Loeff (2010): ‘Persistence of Innovation in
Dutch Manufacturing: Is It Spurious?’ Review of Economics and Statistics 92(3): 495-504.
[28] Schmoch U. (2008): ‘Concept of a Technology Classification for Country Comparisons,’
WIPO.
[29] Schmookler J. (1966): ‘Invention and Economic Growth,’ Cambridge, Mass.: Harvard Uni-
versity Press.
[30] Scotchmer S. (2004): ‘Innovation and Incentives,’ MIT Press.
[31] Shane S. (2009): ‘Why encouraging more people to become entrepreneurs ius bad public
policy,’ Small Business Economics, Doi: 10.1007/s11187-009-9215-5.
[32] Thoma G. and S. Torrisi (2007): ‘Creating Powerful Indicators for Innovation Studies with
Approximate Matching Algorithms. A test based on PATSTAT and Amadeus databases’,
CESPRI-Bocconi University WP 211.
[33] Thoma G., S. Torrisi, A. Gambardella, D. Guellec, B. Hall, and D. Harhoff (2010): ‘Har-
monizing and Combining Large Datasets ? An Application to Firm-Level Patent and Ac-
counting Data’, NBER Working Paper No. 15851.
16
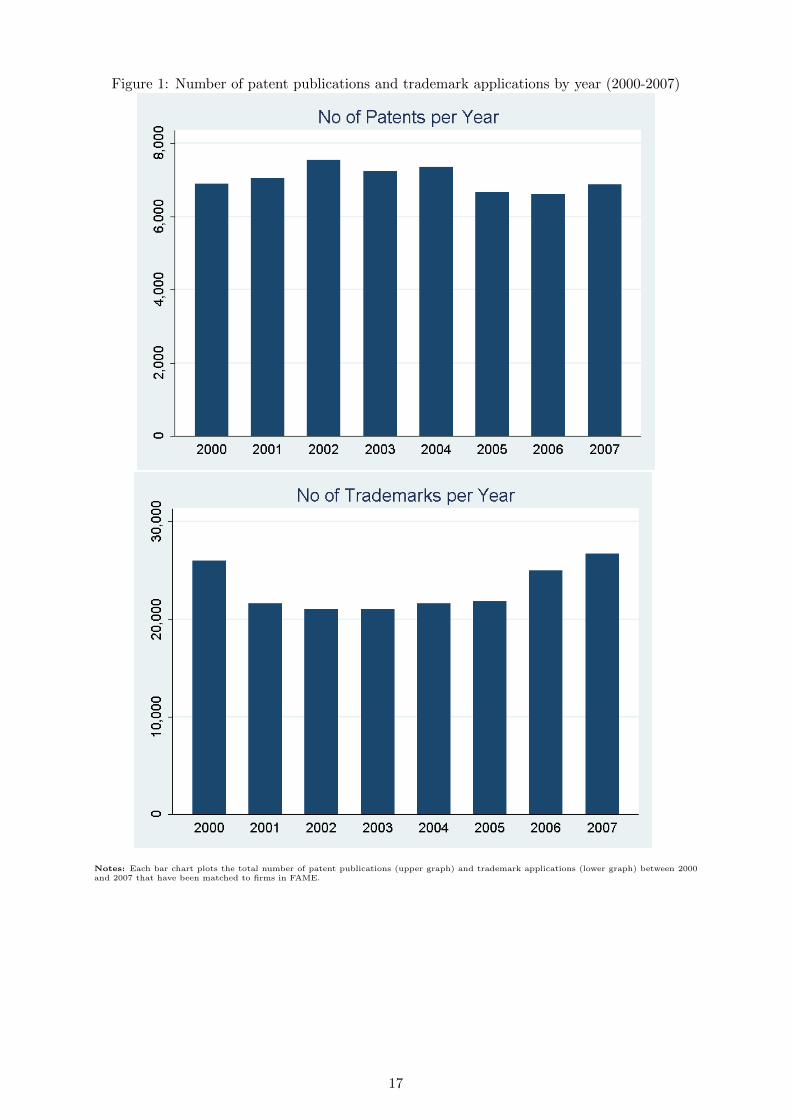
Figure 1: Number of patent publications and trademark applications by year (2000-2007)
Notes: Each bar chart plots the total number of patent publications (upper graph) and trademark applications (lower graph) between 2000and 2007 that have been matched to firms in FAME.
17
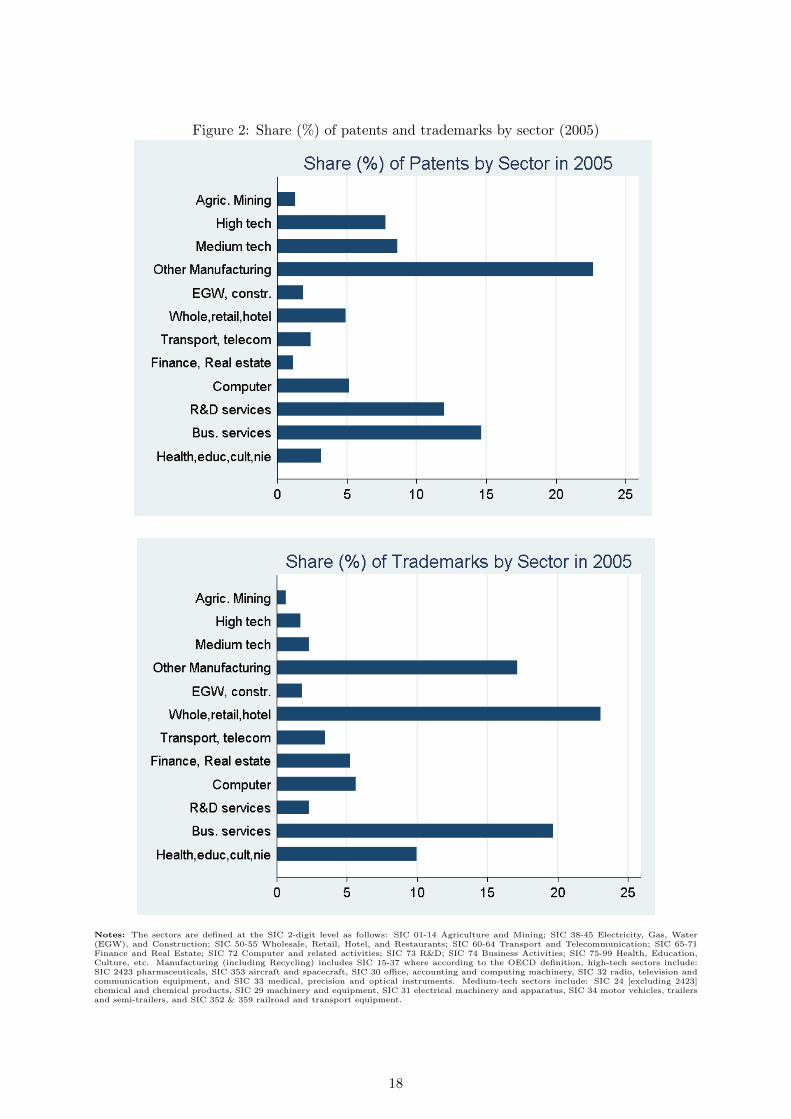
Figure 2: Share (%) of patents and trademarks by sector (2005)
Notes: The sectors are defined at the SIC 2-digit level as follows: SIC 01-14 Agriculture and Mining; SIC 38-45 Electricity, Gas, Water(EGW), and Construction; SIC 50-55 Wholesale, Retail, Hotel, and Restaurants; SIC 60-64 Transport and Telecommunication; SIC 65-71Finance and Real Estate; SIC 72 Computer and related activities; SIC 73 R&D; SIC 74 Business Activities; SIC 75-99 Health, Education,Culture, etc. Manufacturing (including Recycling) includes SIC 15-37 where according to the OECD definition, high-tech sectors include:SIC 2423 pharmaceuticals, SIC 353 aircraft and spacecraft, SIC 30 office, accounting and computing machinery, SIC 32 radio, television andcommunication equipment, and SIC 33 medical, precision and optical instruments. Medium-tech sectors include: SIC 24 [excluding 2423]chemical and chemical products, SIC 29 machinery and equipment, SIC 31 electrical machinery and apparatus, SIC 34 motor vehicles, trailersand semi-trailers, and SIC 352 & 359 railroad and transport equipment.
18
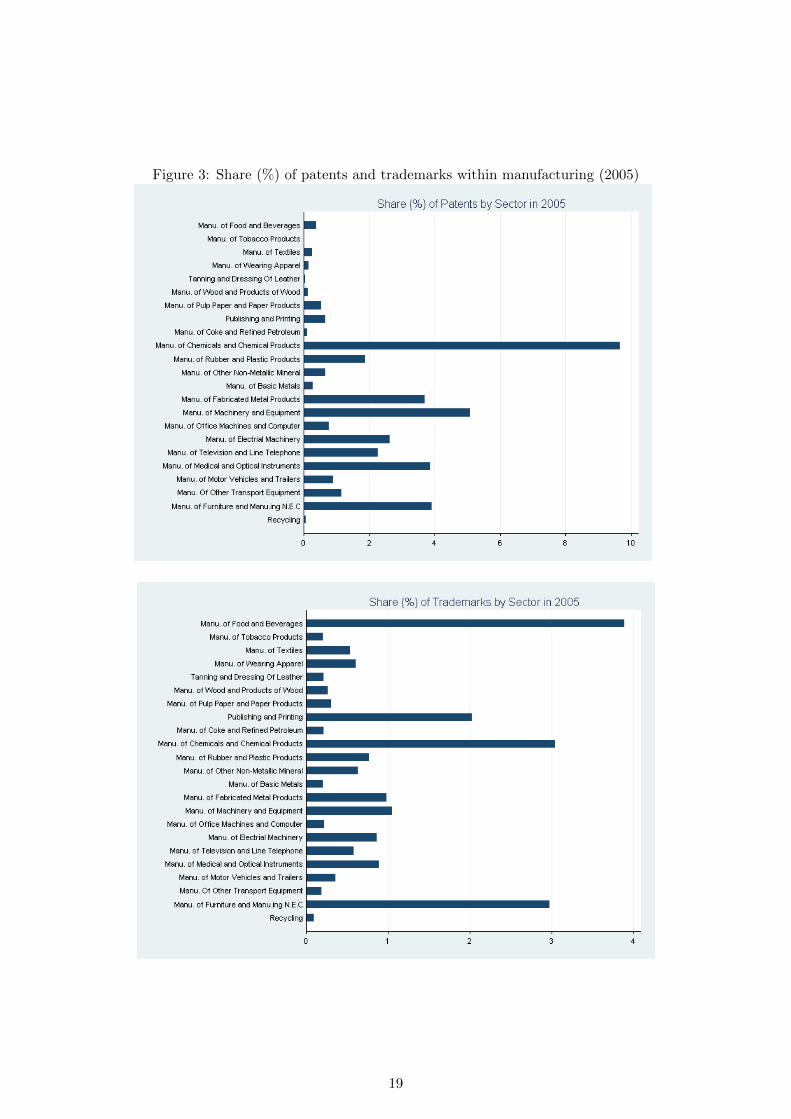
Figure 3: Share (%) of patents and trademarks within manufacturing (2005)
19
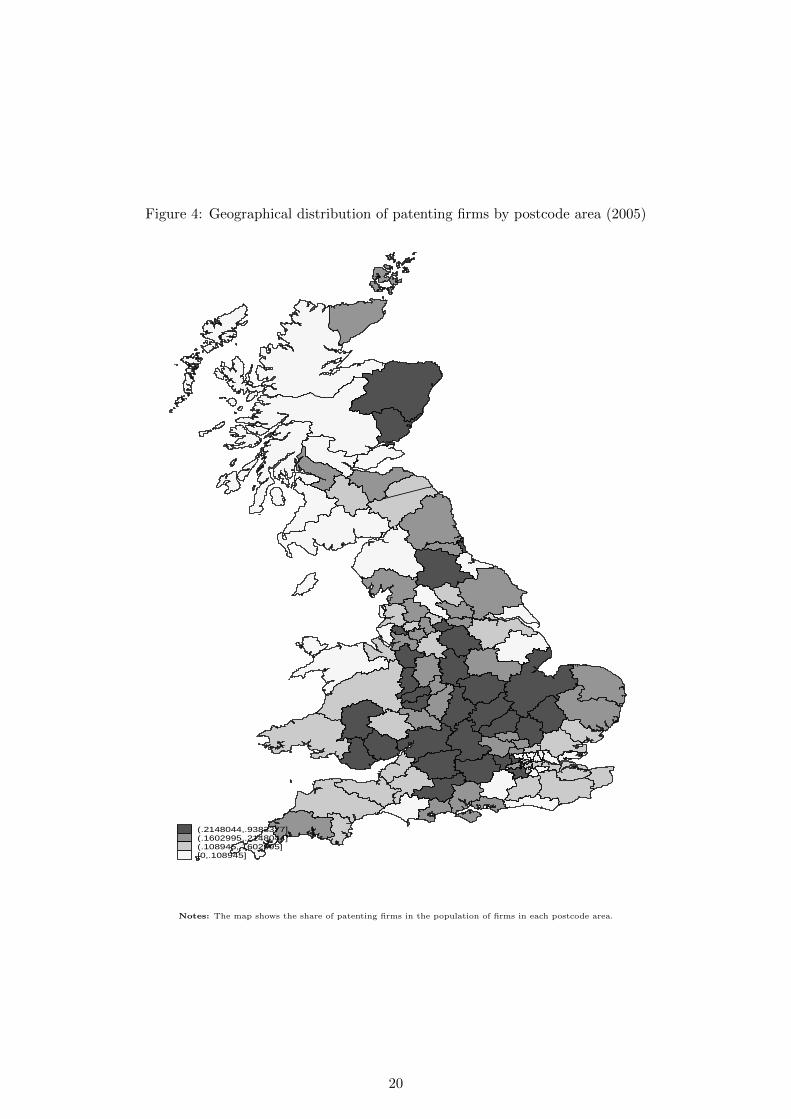
Figure 4: Geographical distribution of patenting firms by postcode area (2005)
(.2148044,.9383377](.1602995,.2148044](.108945,.1602995][0,.108945]
Notes: The map shows the share of patenting firms in the population of firms in each postcode area.
20
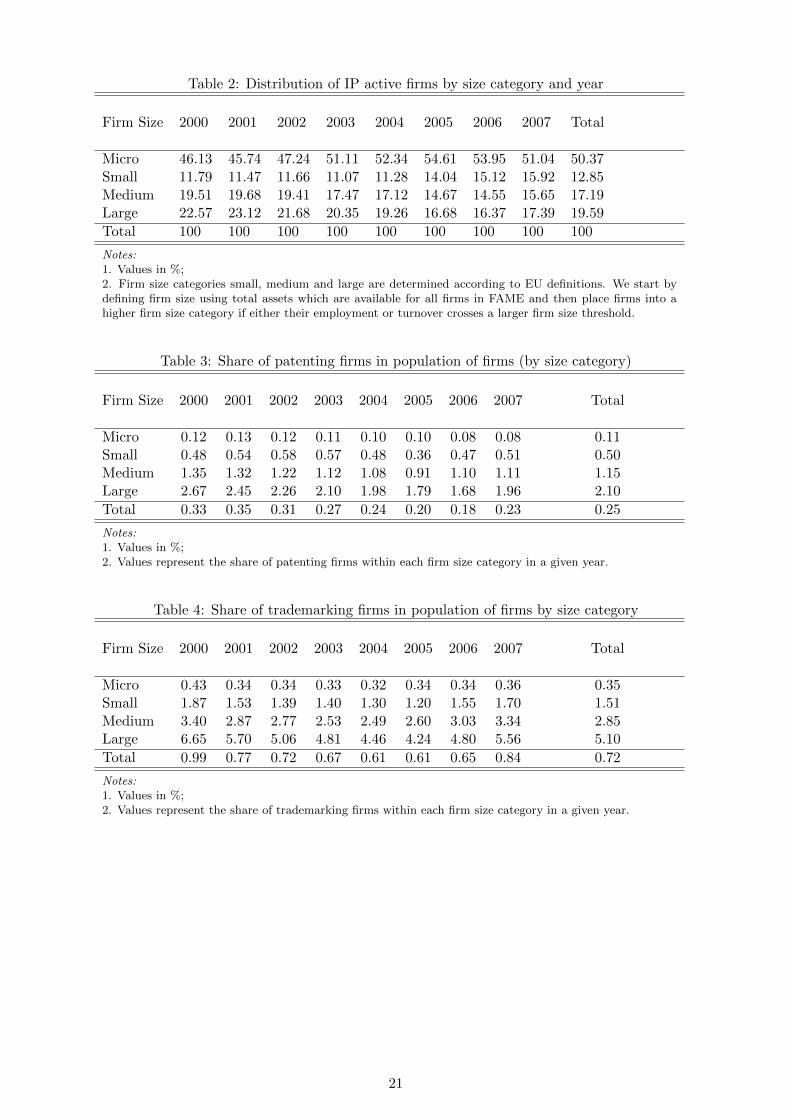
Table 2: Distribution of IP active firms by size category and year
Firm Size 2000 2001 2002 2003 2004 2005 2006 2007 Total
Micro 46.13 45.74 47.24 51.11 52.34 54.61 53.95 51.04 50.37Small 11.79 11.47 11.66 11.07 11.28 14.04 15.12 15.92 12.85Medium 19.51 19.68 19.41 17.47 17.12 14.67 14.55 15.65 17.19Large 22.57 23.12 21.68 20.35 19.26 16.68 16.37 17.39 19.59
Total 100 100 100 100 100 100 100 100 100
Notes:1. Values in %;2. Firm size categories small, medium and large are determined according to EU definitions. We start bydefining firm size using total assets which are available for all firms in FAME and then place firms into ahigher firm size category if either their employment or turnover crosses a larger firm size threshold.
Table 3: Share of patenting firms in population of firms (by size category)
Firm Size 2000 2001 2002 2003 2004 2005 2006 2007 Total
Micro 0.12 0.13 0.12 0.11 0.10 0.10 0.08 0.08 0.11Small 0.48 0.54 0.58 0.57 0.48 0.36 0.47 0.51 0.50Medium 1.35 1.32 1.22 1.12 1.08 0.91 1.10 1.11 1.15Large 2.67 2.45 2.26 2.10 1.98 1.79 1.68 1.96 2.10
Total 0.33 0.35 0.31 0.27 0.24 0.20 0.18 0.23 0.25
Notes:1. Values in %;2. Values represent the share of patenting firms within each firm size category in a given year.
Table 4: Share of trademarking firms in population of firms by size category
Firm Size 2000 2001 2002 2003 2004 2005 2006 2007 Total
Micro 0.43 0.34 0.34 0.33 0.32 0.34 0.34 0.36 0.35Small 1.87 1.53 1.39 1.40 1.30 1.20 1.55 1.70 1.51Medium 3.40 2.87 2.77 2.53 2.49 2.60 3.03 3.34 2.85Large 6.65 5.70 5.06 4.81 4.46 4.24 4.80 5.56 5.10
Total 0.99 0.77 0.72 0.67 0.61 0.61 0.65 0.84 0.72
Notes:1. Values in %;2. Values represent the share of trademarking firms within each firm size category in a given year.
21
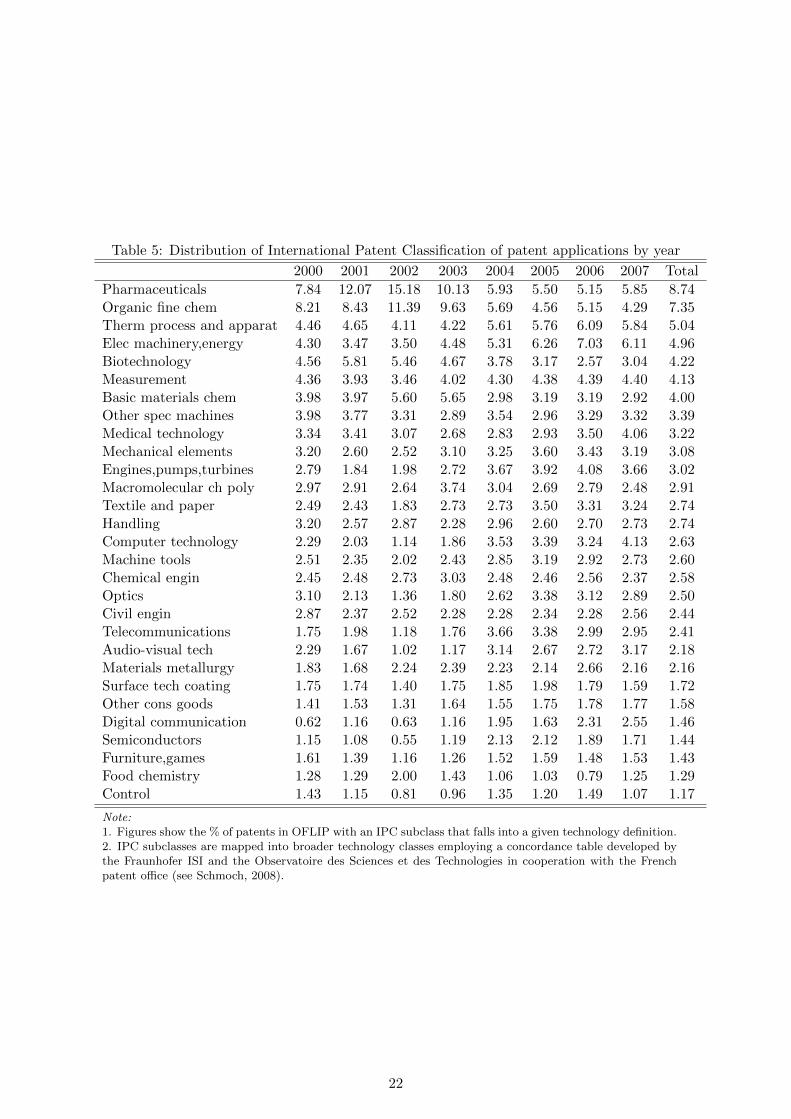
Table 5: Distribution of International Patent Classification of patent applications by year
2000 2001 2002 2003 2004 2005 2006 2007 Total
Pharmaceuticals 7.84 12.07 15.18 10.13 5.93 5.50 5.15 5.85 8.74Organic fine chem 8.21 8.43 11.39 9.63 5.69 4.56 5.15 4.29 7.35Therm process and apparat 4.46 4.65 4.11 4.22 5.61 5.76 6.09 5.84 5.04Elec machinery,energy 4.30 3.47 3.50 4.48 5.31 6.26 7.03 6.11 4.96Biotechnology 4.56 5.81 5.46 4.67 3.78 3.17 2.57 3.04 4.22Measurement 4.36 3.93 3.46 4.02 4.30 4.38 4.39 4.40 4.13Basic materials chem 3.98 3.97 5.60 5.65 2.98 3.19 3.19 2.92 4.00Other spec machines 3.98 3.77 3.31 2.89 3.54 2.96 3.29 3.32 3.39Medical technology 3.34 3.41 3.07 2.68 2.83 2.93 3.50 4.06 3.22Mechanical elements 3.20 2.60 2.52 3.10 3.25 3.60 3.43 3.19 3.08Engines,pumps,turbines 2.79 1.84 1.98 2.72 3.67 3.92 4.08 3.66 3.02Macromolecular ch poly 2.97 2.91 2.64 3.74 3.04 2.69 2.79 2.48 2.91Textile and paper 2.49 2.43 1.83 2.73 2.73 3.50 3.31 3.24 2.74Handling 3.20 2.57 2.87 2.28 2.96 2.60 2.70 2.73 2.74Computer technology 2.29 2.03 1.14 1.86 3.53 3.39 3.24 4.13 2.63Machine tools 2.51 2.35 2.02 2.43 2.85 3.19 2.92 2.73 2.60Chemical engin 2.45 2.48 2.73 3.03 2.48 2.46 2.56 2.37 2.58Optics 3.10 2.13 1.36 1.80 2.62 3.38 3.12 2.89 2.50Civil engin 2.87 2.37 2.52 2.28 2.28 2.34 2.28 2.56 2.44Telecommunications 1.75 1.98 1.18 1.76 3.66 3.38 2.99 2.95 2.41Audio-visual tech 2.29 1.67 1.02 1.17 3.14 2.67 2.72 3.17 2.18Materials metallurgy 1.83 1.68 2.24 2.39 2.23 2.14 2.66 2.16 2.16Surface tech coating 1.75 1.74 1.40 1.75 1.85 1.98 1.79 1.59 1.72Other cons goods 1.41 1.53 1.31 1.64 1.55 1.75 1.78 1.77 1.58Digital communication 0.62 1.16 0.63 1.16 1.95 1.63 2.31 2.55 1.46Semiconductors 1.15 1.08 0.55 1.19 2.13 2.12 1.89 1.71 1.44Furniture,games 1.61 1.39 1.16 1.26 1.52 1.59 1.48 1.53 1.43Food chemistry 1.28 1.29 2.00 1.43 1.06 1.03 0.79 1.25 1.29Control 1.43 1.15 0.81 0.96 1.35 1.20 1.49 1.07 1.17
Note:1. Figures show the % of patents in OFLIP with an IPC subclass that falls into a given technology definition.2. IPC subclasses are mapped into broader technology classes employing a concordance table developed bythe Fraunhofer ISI and the Observatoire des Sciences et des Technologies in cooperation with the Frenchpatent office (see Schmoch, 2008).
22
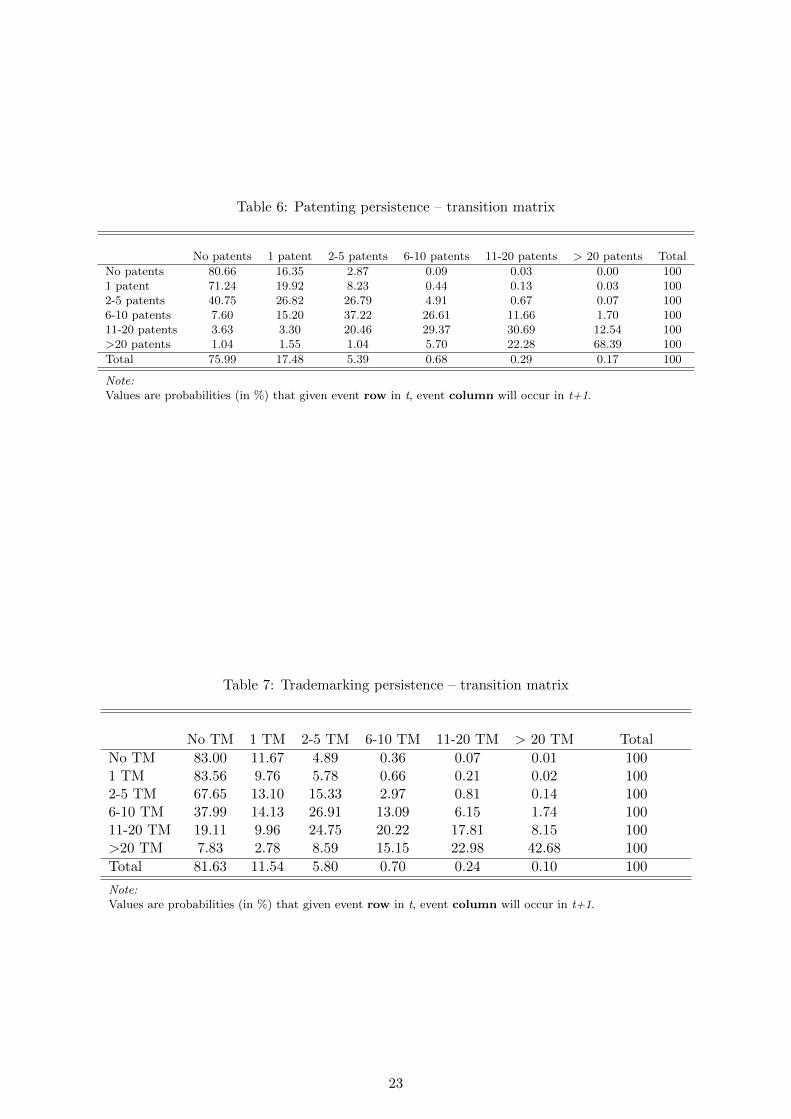
Table 6: Patenting persistence – transition matrix
No patents 1 patent 2-5 patents 6-10 patents 11-20 patents > 20 patents Total
No patents 80.66 16.35 2.87 0.09 0.03 0.00 1001 patent 71.24 19.92 8.23 0.44 0.13 0.03 1002-5 patents 40.75 26.82 26.79 4.91 0.67 0.07 1006-10 patents 7.60 15.20 37.22 26.61 11.66 1.70 10011-20 patents 3.63 3.30 20.46 29.37 30.69 12.54 100>20 patents 1.04 1.55 1.04 5.70 22.28 68.39 100
Total 75.99 17.48 5.39 0.68 0.29 0.17 100
Note:Values are probabilities (in %) that given event row in t, event column will occur in t+1.
Table 7: Trademarking persistence – transition matrix
No TM 1 TM 2-5 TM 6-10 TM 11-20 TM > 20 TM Total
No TM 83.00 11.67 4.89 0.36 0.07 0.01 1001 TM 83.56 9.76 5.78 0.66 0.21 0.02 1002-5 TM 67.65 13.10 15.33 2.97 0.81 0.14 1006-10 TM 37.99 14.13 26.91 13.09 6.15 1.74 10011-20 TM 19.11 9.96 24.75 20.22 17.81 8.15 100>20 TM 7.83 2.78 8.59 15.15 22.98 42.68 100
Total 81.63 11.54 5.80 0.70 0.24 0.10 100
Note:Values are probabilities (in %) that given event row in t, event column will occur in t+1.
23