demyelination affects temporal aspects of perception:...
TRANSCRIPT

ORIGINAL ARTICLE
Demyelination Affects Temporal Aspectsof Perception: An Optic Neuritis Study
Noa Raz, PhD,1 Shlomo Dotan, MD,2 Sylvie Chokron, PhD,3 Tamir Ben-Hur, MD, PhD,1
and Netta Levin, MD, PhD1
Objective: Visual Evoked Potentials (VEPs) following optic neuritis (ON) remain chronically prolonged, althoughstandard visual tests indicate full recovery. We hypothesized that dynamic visual processes, such as motionperception, may be more vulnerable to slowed conduction in the optic nerve, and consequently be better associatedwith projection rates.Methods: Twenty-one patients with acute unilateral, first-ever ON were studied during 1 year. Static visual functions(visual acuity, color perception, visual field, and contrast sensitivity), dynamic visual functions (motion perception),and VEPs were assessed repeatedly.Results: Visual and electrophysiological measurements reached maximal performance 4 months following the acutephase, with no subsequent improvement. Whereas VEP amplitude and static visual functions recovered, VEP latencyremained significantly prolonged, and motion perception remained impaired throughout the 12-month period. Astrong correlation was found between VEP latencies and motion perception. Visual performance at 1 month wasstrongly predictive of visual outcome. For static functions, patients who showed partial recovery at 1 monthsubsequently achieved full recovery. For dynamic functions, the rate of improvement was constant across patients,independent of the initial deficit level.Interpretation: Conduction velocity in the visual pathways correlated closely with dynamic visual functions,implicating the need for rapid transmission of visual input to perceive motion. Motion perception level may serve asa tool to assess the magnitude of myelination in the visual pathways. The constancy across patients may serve as abaseline to assess the efficacy of currently developing neuroprotective and regenerative therapeutic strategies,targeting myelination in the central nervous system.
ANN NEUROL 2012;71:531–538
Optic neuritis (ON) is a demyelinating disease of the
optic nerve, causing painful subacute visual loss.
Visual evoked potentials (VEPs) are frequently prolonged
following ON, and this prolongation may persist for
years.1–4 Although ON diagnosis is based on clinical pre-
sentation, VEP may play a role in distinguishing it from
other optic neuropathies.
VEP amplitudes, which are believed to reflect the
number of functional optic nerve fibers, are typically
reduced in the acute phase of ON, but recover within 3
months along with the recovery of visual acuity.4 VEP
amplitudes were found to correlate with standard visual
measures, that is, visual acuity, color vision, visual field,
and contrast sensitivity.2,5–7 Correlations were also found
with retinal nerve fiber layer (RNFL) thickness, as meas-
ured by optical coherence tomography.8,9 VEP latency pro-
longation, which is believed to reflect demyelination of the
optic nerve fibers,1 typically characterizes the chronic stages
of ON, even after standard visual functions have returned
to normal.2,4,10 Assessment of the correlation between
RNFL thickness and VEP latency has yielded inconsistent
results.8,9,11 Thus, it appears that VEP latency prolonga-
tion, a common characteristic following ON, does not have
an identified structural or behavioral correlate.
In a recent behavioral and functional neuroimaging
study, we have demonstrated a specific sustained deficit
in dynamic visual functions following ON.12 In the cur-
rent study, we aim to identify the mechanism of this def-
icit. We hypothesized that dynamic visual processes, such
as motion perception, may be more vulnerable to slowed
View this article online at wileyonlinelibrary.com. DOI: 10.1002/ana.22692
Received Mar 18, 2011, and in revised form Oct 21, 2011. Accepted for publication Dec 2, 2011.
Address correspondence to Dr Levin, Department of Neurology, Hadassah University Hospital, Jerusalem, Israel 91120. E-mail: [email protected]
From the 1The Agnes Ginges Center for Human Neurogenetics, Laboratory for Neuroimmunology, The Department of Neurology, Hadassah Hebrew
University Medical Center, Jerusalem, Israel; 2The Department of Ophthalmology, Hadassah Hebrew University Medical Center, Jerusalem, Israel;3Neurology Service, Rothschild Ophthalmological Foundation, Paris, France.
Additional supporting information can be found in the online version of this article.
VC 2012 American Neurological Association 531
conduction in the optic nerve, and consequently be bet-
ter associated with projection rates.
In the current study, patients were followed up lon-
gitudinally after an ON attack, providing the timeline
for recovery and visual outcome predictability.
Subjects and Methods
SubjectsTwenty-one patients aged 18 to 59 years (mean 6 standard devia-
tion, 29 6 9.5) presenting with a first-ever episode of acute ON
participated in the study. Patients were enrolled during hospitali-
zation. All patients presented with unilateral visual loss, a relative
afferent pupillary defect, and an otherwise normal neuro-ophthal-
mological examination (Supplementary Table). Two patients had
a recurrent attack during study follow-up, and their data were
therefore excluded from subsequent analyses. Twenty-one control
subjects who were matched to the patients for age, gender, and
dominant eye on a subject-by-subject basis were included in the
study. The Hadassah Hebrew University Medical Center Ethics
Committee approved the experimental procedure. Written
informed consent was obtained from all subjects.
Procedure and Data Analysis
STATIC VISUAL FUNCTIONS. Static visual functions,
including visual acuity (VA; measured by Snellen visual acuity
chart), visual fields estimation (automatic Humphrey perimetry
visual field test 24-2), color perception (standard pseudoiso-
chromatic plates, by Ichikawa), and contrast sensitivity (CS;
Pelli-Robson chart at 1 meter; Metropia, Cambridge, UK),
were performed.
DYNAMIC VISUAL FUNCTIONS. Dynamic visual func-
tions were evaluated by object from motion (OFM) extraction.
This test is a variation of the task used by Regan.13 Subjects
viewed motion-defined objects (OFM), static objects, or coher-
ent moving noise stimuli and were asked to identify and name
an object when it appeared.
For OFM, an array of dots was used to compose an object
by moving the dots within the image rightward while moving
the dots outside the image leftward (or vice versa). The dot pat-
tern generated a camouflaged object that could not be detected
when the dots were stationary or moving as a whole. Object rec-
ognition is dependent on motion perception. OFM stimuli were
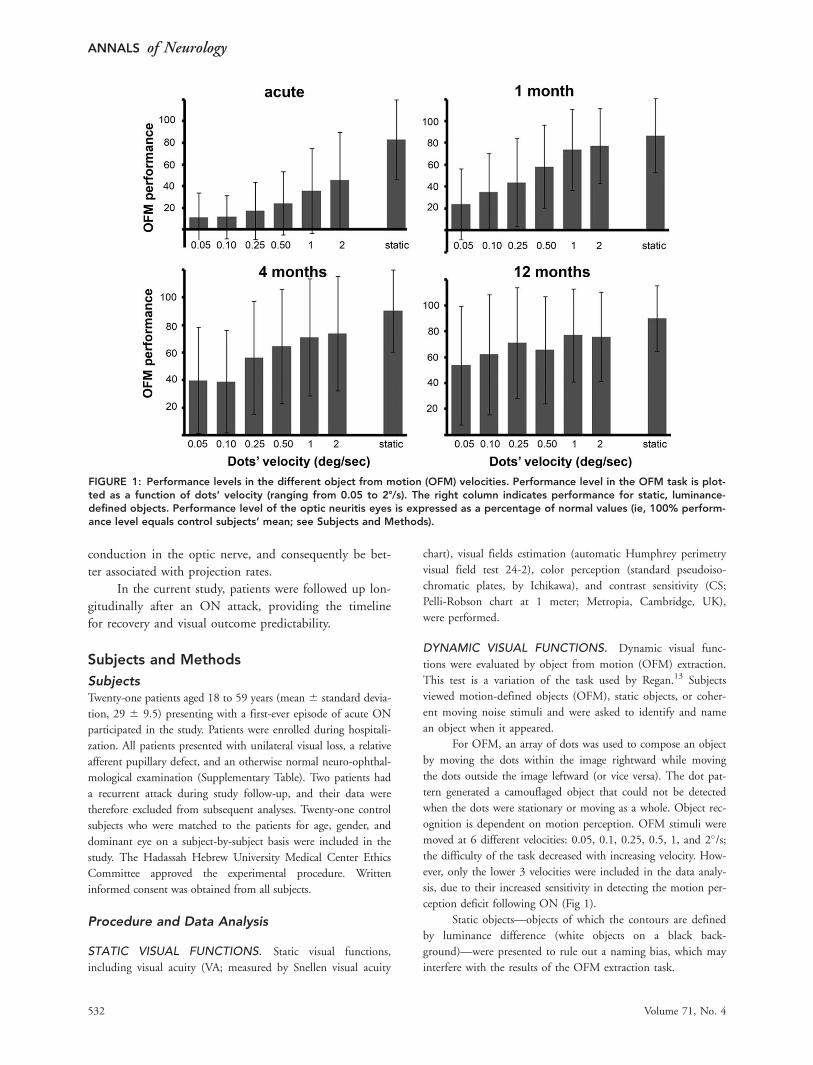
moved at 6 different velocities: 0.05, 0.1, 0.25, 0.5, 1, and 2�/s;the difficulty of the task decreased with increasing velocity. How-
ever, only the lower 3 velocities were included in the data analy-
sis, due to their increased sensitivity in detecting the motion per-
ception deficit following ON (Fig 1).
Static objects—objects of which the contours are defined
by luminance difference (white objects on a black back-
ground)—were presented to rule out a naming bias, which may
interfere with the results of the OFM extraction task.
FIGURE 1: Performance levels in the different object from motion (OFM) velocities. Performance level in the OFM task is plot-ted as a function of dots’ velocity (ranging from 0.05 to 28/s). The right column indicates performance for static, luminance-defined objects. Performance level of the optic neuritis eyes is expressed as a percentage of normal values (ie, 100% perform-ance level equals control subjects’ mean; see Subjects and Methods).
ANNALS of Neurology
532 Volume 71, No. 4
Coherent moving noise consists of an array of dots (similar
to that used for the OFM stimuli) moving as a whole; conse-
quently, motion but no object is apparent. These images were pre-
sented as foil trails (see examples in the Supplementary Videos).
Stimuli were presented on a computer screen situated at
a distance of 50cm from the subjects’ eyes in a random order,
each preceded by a 980-millisecond fixation and lasting until
the subject responded or for a maximum of 4 seconds. Fixation
was not maintained during testing to avoid the impact of
partial field defects on patients’ performance level (this was
especially relevant soon after the ON attack).
To avoid between-eye and between-phase learning, 4 ex-
perimental blocks were created, each consisting of 60 OFM
stimuli (20 at each velocity), 12 moving noise stimuli (4 at
each velocity), and 10 static objects. The 2 eyes of a subject
were shown different blocks on each run, and each eye was
shown different blocks on adjacent runs. The exact experimen-
tal block (1–4) presented to a patient was also shown to his
control subject, matched on the basis of the tested eye; the ex-
perimental block shown to the dominant eye of a patient was
also presented to the dominant eye of the matched control sub-
ject. This was done in each testing phase.
Visual tests were evaluated monocularly at the acute
phase (during hospitalization, 3–5 days following hospital
admission) as well as 1, 4, and 12 months following the attack.
Standard clinical lighting was used for visual testing.
PATTERN VEPS. The amplitudes and latencies of the major
positive component (P100) were recorded on pattern reversal
full-field checkerboards on a Bravo VEP device (Nicolet Bio-
medical, Madison, WI). Standard pattern reversal VEP parame-
ters were used to enable the generalization of the results to
other clinical centers. Achromatic checks were presented on a
computer monitor screen, each check subtending 60� at the
eye. The screen subtended 17� horizontal � 14� vertical. Two
lateral electrodes were placed at O1 and O2 and were referenced
to Fz. The ground electrode was positioned on the forehead.
VEP latencies and amplitudes were assessed from either O1 or
O2, selecting the electrode that produced the sharper VEP
wave. This was exclusively chosen by the technician. In most
cases, the waves obtained from O1 and O2 were similar. At least
2 repetitions were recorded for each eye, and the reported val-
ues are the average of these recordings.
VEP Amplitudes. Due to the wide range of variability
within the normal population, to best study the effect of ON
over time, VEP amplitudes from the affected eye (AE) were
expressed as a percentage of those from the fellow eye (FE).4
VEP Latencies. Patients in whom the VEP waveform was
unobtainable due to poor vision were excluded from the VEP
latency analyses (n ¼ 7 in the acute phase and n ¼ 2 in later
phases). VEP was assessed monocularly at the acute and 4- and
12-month phases.
DATA ANALYSIS. To enable direct comparison between the
different visual measurements (which may vary in task difficulty
and scoring scales), patients’ performance levels were expressed
as a percentage of the normal values (norms) in each measure.
Norms in the standard (static) visual tests were based on estab-
lished norms that are available from the literature. These were
defined as the mean normal population values (Snellen VA � 1
[normal range is according to the Ranges of Vision Loss by the
International Council of Ophthalmology (resolution adopted
by the International Council of Ophthalmology, Sydney, Aus-
tralia, April 20, 2002; available at: www.icoph.org/pdf/visual-
stanres.pdf accessed May 7, 2009)]; Pelli-Robson, logCS �1.8414). Dynamic visual function (OFM) norms were based on
the control group and were defined as the mean control sub-
jects’ values. It should be noted that despite the normalization,
points across the range may not be equivalent or similar
between the different variables.
To determine whether the performance level is signifi-
cantly impaired, we calculated a delta score for each patient
that represents the distance from normal level. Using 2-tailed t
test, significant difference was defined as having deltas that
were significantly different from zero.
Results
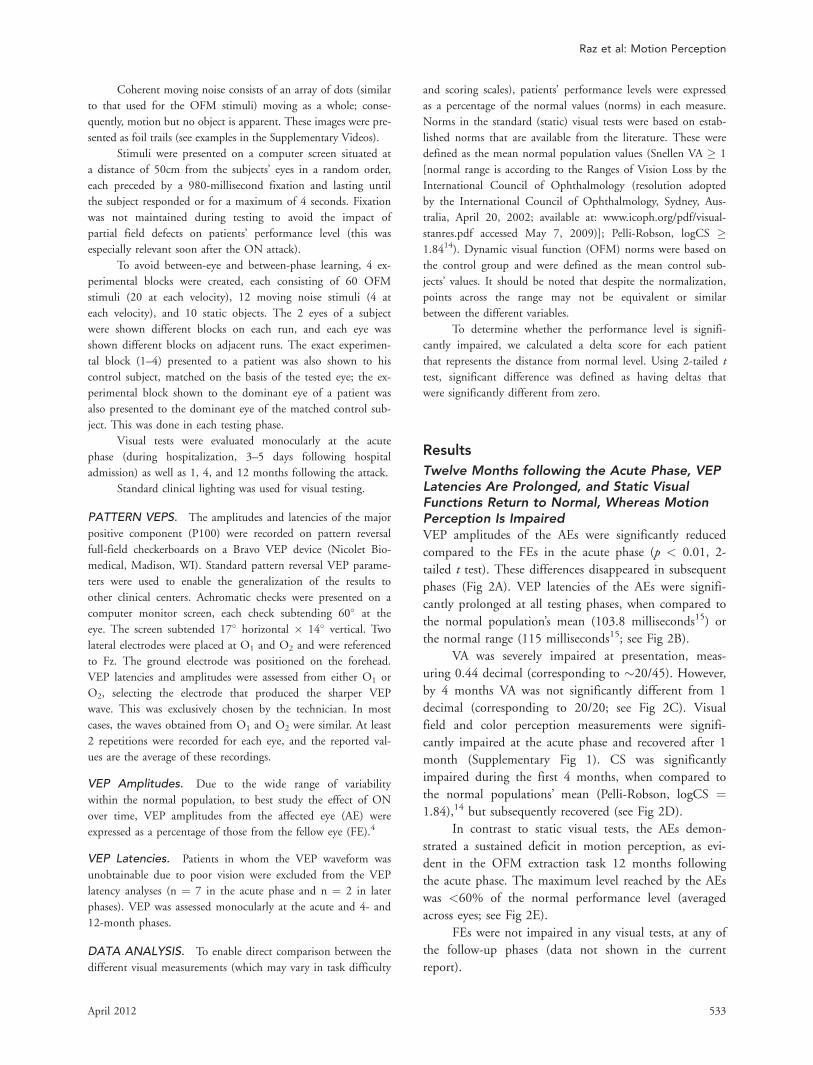
Twelve Months following the Acute Phase, VEPLatencies Are Prolonged, and Static VisualFunctions Return to Normal, Whereas MotionPerception Is ImpairedVEP amplitudes of the AEs were significantly reduced
compared to the FEs in the acute phase (p < 0.01, 2-
tailed t test). These differences disappeared in subsequent
phases (Fig 2A). VEP latencies of the AEs were signifi-
cantly prolonged at all testing phases, when compared to
the normal population’s mean (103.8 milliseconds15) or
the normal range (115 milliseconds15; see Fig 2B).
VA was severely impaired at presentation, meas-
uring 0.44 decimal (corresponding to �20/45). However,
by 4 months VA was not significantly different from 1
decimal (corresponding to 20/20; see Fig 2C). Visual
field and color perception measurements were signifi-
cantly impaired at the acute phase and recovered after 1
month (Supplementary Fig 1). CS was significantly
impaired during the first 4 months, when compared to
the normal populations’ mean (Pelli-Robson, logCS ¼1.84),14 but subsequently recovered (see Fig 2D).
In contrast to static visual tests, the AEs demon-
strated a sustained deficit in motion perception, as evi-
dent in the OFM extraction task 12 months following
the acute phase. The maximum level reached by the AEs
was <60% of the normal performance level (averaged
across eyes; see Fig 2E).
FEs were not impaired in any visual tests, at any of
the follow-up phases (data not shown in the current
report).
Raz et al: Motion Perception
April 2012 533
No Significant Visual or ElectrophysiologicalImprovement Was Evident beyond 4 Monthsfollowing the Acute PhaseWith respect to the visual outcomes on the group level, a
significant improvement in both visual functions and
VEP measures was evident only within the first 4
months. Changes between 4 and 12 months were not
significant. After 4 months, VEP amplitudes had recov-
ered coinciding with recovery of VA and CS functions.
Although VEP latency shortened significantly during the
first 4 months, it remained significantly prolonged. Simi-
larly, motion perception improved within the first 4
months, but remained impaired.
Motion perception was disproportionately impaired
at baseline and recovered less than static visual functions.
Furthermore, the rate of initial recovery was greater for
static functions (improvement of 36, 27, and 20% in the
first 1 month for VA, CS, and OFM, respectively),
FIGURE 2: Visual evoked potential (VEP) measurements, and static and dynamic visual functions throughout the 12-month fol-low-up. Changes in VEP amplitudes (A) and VEP latencies (B) over time are shown. VEP amplitudes from the affected eyes(AEs) are expressed as a percentage of those of the fellow eyes (FEs). Inset denotes absolute amplitude levels for the AEs.Changes in static (C,D) and dynamic (E) visual functions (motion perception assessed by the object from motion [OFM] test)are plotted over time. To obtain a direct comparison between measures, performance levels are expressed as a percentage ofthe normal values in each measure (100% of visual acuity equals 1 decimal; 100% of contrast sensitivity equals logMAR 5
1.84; 100% of OFM equals control subjects’ mean in each phase). Gray horizontal lines mark the mean normal values. Therewere 21, 20, 18, and 14 subjects in the acute, 1-, 4-, and 12-month time points, respectively. Black asterisks denote significantreduction of AE performance compared to the normal values. Gray asterisks denote significant change in the AE measure-ments between testing phases. *p < 0.05; **p < 0.01; ***p < 0.001.
ANNALS of Neurology
534 Volume 71, No. 4
whereas the subsequent recovery rate was similar among
the visual functions (2, 2.5, and 3% per month for VA,
CS, and OFM, respectively, up to the 4-month phase).
Visual Outcome Can Be Predicted 1 Monthfollowing the AttackTesting the visual outcome on a subject-by-subject basis
reveals that visual performance 1 month following the
attack is highly predictive of visual recovery (Supplemen-
tary Fig 2). Visual performance at the 1-month time
point was strongly correlated with visual performance at
subsequent time points. This was seen for VA, CS, and
OFM functions (VA: r ¼ 0.9, p ¼ 5.5 � 10�6; CS: r ¼0.93, p ¼ 5.6 � 10�6; OFM: r ¼ 0.84, p ¼ 2 � 10�4
for correlating the 1- and 4-month time points; VA: r ¼0.93, p ¼ 1.1 � 10�5; CS: r ¼ 0.97, p ¼ 9.2 � 10�7;
OFM: r ¼ 0.91, p ¼ 3.1 � 10�5 for correlating the
1- and 12-month time points).
The process of recovery of static and dynamic vis-
ual functions behaved according to different patterns.
Regarding static functions, patients with VA >0.4 at the
1-month phase (19 of 21 in our cohort) recovered com-
pletely, whereas those suffering from complete visual loss
1 month following the attack (2 of 21 patients) remained
blind in their AE (for the duration of the 12-month fol-
low-up phase). Similar findings were found for CS.
Thus, the outcomes of static functions appear to follow
an all-or-none pattern.
Regarding dynamic functions, the rate of improve-
ment in the OFM task following the 1-month time point
was similar across ON patients, regardless of their initial
performance level (mean 12%, median 6% for improve-
ment between the 1- and 4-month time points across
patients’ cohort; no correlation was found between initial
OFM levels and improvement rate, r ¼ �0.1, p >
0.05). Because patients improve at a constant rate, out-
come is dependent on OFM levels at the 1-month time
point.
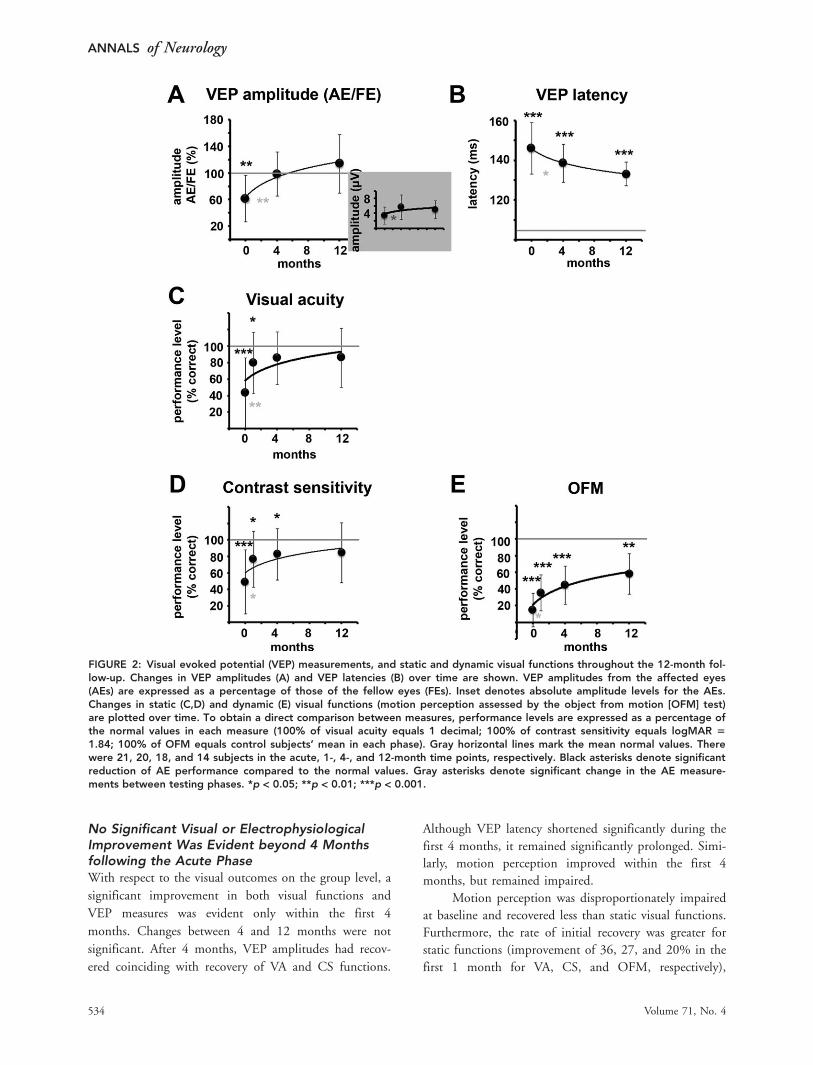
VEP Amplitudes Can Explain Static But NotDynamic Visual FunctionsTo study the effects of VEP amplitudes on visual func-
tions, we separated the eyes into 2 groups corresponding
to either intact or impaired amplitudes. Figure 3A shows
that impaired VEP amplitudes disturb various types of
visual functioning, resulting in impaired static and
dynamic functions. Intact VEP amplitudes (see Fig 3B)
are associated with recovered VA and CS, suggesting that
these visual functions depend solely on a sufficient
amount of visual information reaching the cortex. Given
that all ON eyes had prolonged VEP latencies, the data
indicate that VA and CS do not relate to the latency of
visual projection. However, motion perception was
impaired even in patients with intact VEP amplitudes.
This suggests that an intact amount of visual projection
is insufficient for the completion of dynamic visual
functions.
To investigate the effect of VEP latencies on
motion perception, we divided the eyes with intact VEP
amplitudes according to their projection rates (�136 or
>136 milliseconds). An association between VEP laten-
cies and OFM performance levels was found; longer
VEP latencies were associated with reduced motion per-
ception levels (see Fig 3C).
FIGURE 3: Visual measurements as a function of visualevoked potential (VEP) amplitudes and latencies. Visual acu-ity, contrast sensitivity, and object from motion (OFM) levelsin optic neuritis eyes with (A) impaired and (B) intact ampli-tudes (n 5 5 and 16, respectively) are shown. (C) Perform-ance levels for the different visual measurements for eyeswith intact amplitudes are divided according to their VEPlatencies (<136 milliseconds, n 5 8; >136 milliseconds, n 58; a threshold of 136 milliseconds was chosen because thiswas the median latency level among eyes with intact ampli-tudes). The data included for each patient were taken fromthe latest time point available. Asterisks denote significantreduction of AE performance as compared to the normalvalues, *p < 0.05; ***p < 0.001.
Raz et al: Motion Perception
April 2012 535
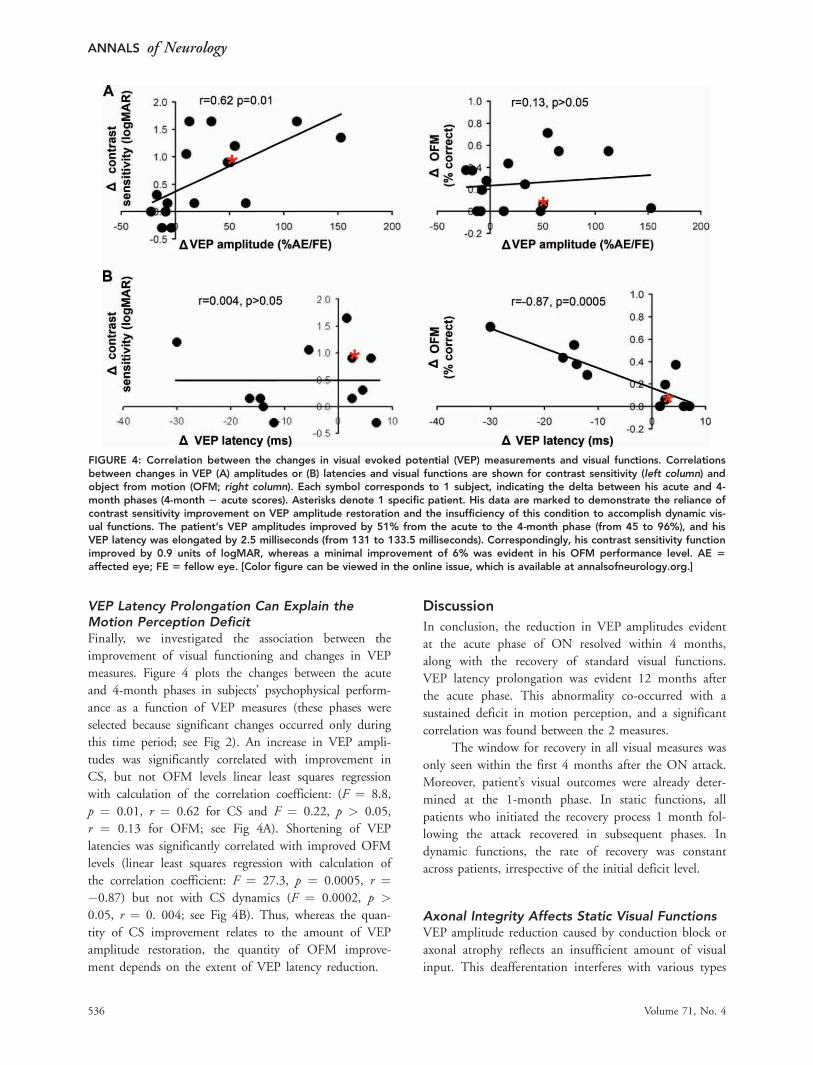
VEP Latency Prolongation Can Explain theMotion Perception DeficitFinally, we investigated the association between the
improvement of visual functioning and changes in VEP
measures. Figure 4 plots the changes between the acute
and 4-month phases in subjects’ psychophysical perform-
ance as a function of VEP measures (these phases were
selected because significant changes occurred only during
this time period; see Fig 2). An increase in VEP ampli-
tudes was significantly correlated with improvement in
CS, but not OFM levels linear least squares regression
with calculation of the correlation coefficient: (F ¼ 8.8,
p ¼ 0.01, r ¼ 0.62 for CS and F ¼ 0.22, p > 0.05,
r ¼ 0.13 for OFM; see Fig 4A). Shortening of VEP
latencies was significantly correlated with improved OFM
levels (linear least squares regression with calculation of
the correlation coefficient: F ¼ 27.3, p ¼ 0.0005, r ¼�0.87) but not with CS dynamics (F ¼ 0.0002, p >
0.05, r ¼ 0. 004; see Fig 4B). Thus, whereas the quan-
tity of CS improvement relates to the amount of VEP
amplitude restoration, the quantity of OFM improve-
ment depends on the extent of VEP latency reduction.
Discussion
In conclusion, the reduction in VEP amplitudes evident
at the acute phase of ON resolved within 4 months,
along with the recovery of standard visual functions.
VEP latency prolongation was evident 12 months after
the acute phase. This abnormality co-occurred with a
sustained deficit in motion perception, and a significant
correlation was found between the 2 measures.
The window for recovery in all visual measures was
only seen within the first 4 months after the ON attack.
Moreover, patient’s visual outcomes were already deter-
mined at the 1-month phase. In static functions, all
patients who initiated the recovery process 1 month fol-
lowing the attack recovered in subsequent phases. In
dynamic functions, the rate of recovery was constant
across patients, irrespective of the initial deficit level.
Axonal Integrity Affects Static Visual FunctionsVEP amplitude reduction caused by conduction block or
axonal atrophy reflects an insufficient amount of visual
input. This deafferentation interferes with various types
FIGURE 4: Correlation between the changes in visual evoked potential (VEP) measurements and visual functions. Correlationsbetween changes in VEP (A) amplitudes or (B) latencies and visual functions are shown for contrast sensitivity (left column) andobject from motion (OFM; right column). Each symbol corresponds to 1 subject, indicating the delta between his acute and 4-month phases (4-month 2 acute scores). Asterisks denote 1 specific patient. His data are marked to demonstrate the reliance ofcontrast sensitivity improvement on VEP amplitude restoration and the insufficiency of this condition to accomplish dynamic vis-ual functions. The patient’s VEP amplitudes improved by 51% from the acute to the 4-month phase (from 45 to 96%), and hisVEP latency was elongated by 2.5 milliseconds (from 131 to 133.5 milliseconds). Correspondingly, his contrast sensitivity functionimproved by 0.9 units of logMAR, whereas a minimal improvement of 6% was evident in his OFM performance level. AE 5
affected eye; FE 5 fellow eye. [Color figure can be viewed in the online issue, which is available at annalsofneurology.org.]
ANNALS of Neurology
536 Volume 71, No. 4
of visual functioning.2,5–7 Intact VEP amplitudes result
in recovery of static visual functions (see Fig 3). VEP
amplitudes were found to correlate with RNFL thickness
levels,8,9 and a high functional–topographic correlation
was found between them.16
Delivery of a sufficient amount of visual informa-
tion is a prerequisite to accomplishing any visual task.
Our results demonstrate that this is true for both static
and dynamic visual functions. However, restoration of
VEP amplitudes alone is insufficient for the execution of
dynamic visual functions (see Fig 3). Patients who had a
significant improvement in their VEP amplitudes but
minimal shortening of their prolonged latencies demon-
strated improvement in their CS function but not in
their OFM performance level (see the patient denoted by
an asterisk in Fig 4).
Demyelination Processes May Specifically AffectTemporal Aspects of PerceptionVEP latency prolongation co-occurring with normal sig-
nal amplitude reflects an intact amount of visual infor-
mation delivered with a time delay. Previous studies have
failed to find a functional correlate for VEP prolonga-
tion.6,7,17,18 One study11 involving patients with multiple
sclerosis (MS) with and without a history of ON
reported correlations between VEP latencies and VA or
CS. However, because all MS eyes were grouped together
in the correlation analysis, correlations could have
resulted from the differences between eyes with and with-
out a history of ON, and not from the association
between prolonged VEPs and visual defects (between
rather than within group correlations). Our results show
that changes in VEP latencies during the first year fol-
lowing the attack are associated with changes in dynamic
but not static visual functions. This suggests that the
myelination status following ON can be evaluated by
dynamic visual functions and their electrophysiological
correlate, VEP latency.
Impaired processing of high-frequency information
following demyelination has been described in several
sensory systems. In the somatosensory domain, loss of
vibration sensitivity is thought to be related to the inabil-
ity of demyelinated nerve fibers to transmit rapid trains
of impulses.10,19 In the visual domain, impaired temporal
resolution of vision,20 delayed visual perception,21 and
motion perception deficit13,22 were reported in ON and
MS patients. Our results, which demonstrate a close rela-
tionship between motion perception and delayed VEP
latencies, suggest that these deficits are caused by the
inability of demyelinated optic nerve fibers to transmit
high temporal frequency information. Thus, motion per-
ception may provide a possible behavioral correlate for
VEP latency prolongation, a classical feature implying
demyelination following ON.23
Dynamic Visual Functions May Be Used as aLongitudinal Marker of Demyelination andRemyelination Processes in the Visual PathwaysGiven the strong correlation between shortening of VEP
latencies and improvement in dynamic visual functions,
the natural history of motion perception may reveal the
progress of nerve myelin pathology following ON.
The magnitude of improvement in motion percep-
tion was found to be constant across patients independ-
ent of the initial deficit level, suggesting that remyelina-
tion processes have a constant rate, regardless of initial
demyelination. This is in accordance with a previous
report demonstrating that the magnitude of latency
shortening was independent of initial latency delay
(measured by multifocal VEP).24 As proposed by Klis-
torner et al,24 the consistency in remyelination magni-
tude across patients may stem from the unique elongated
optic nerve geometry, limiting the interaction between
oligodendrocyte precursor cells and the demyelinated
axons. This structural limitation overpowers other
patient- and lesion-related factors that are known to be
important in the remyelination process.25 The limited
cross-sectional area and the known limited time window
open for remyelination26,27 can explain the lack of signif-
icant changes in VEP latencies and motion perception
beyond 4 months after the attack.
Our results can be evaluated in the light of cur-
rently developing neuroprotective and regenerative thera-
peutic strategies targeting myelination in the central nerv-
ous system.28 The combination of VEP studies and their
functional correlate, dynamic visual functions, may be
used as accurate noninvasive tools to follow processes of
demyelination and remyelination in the visual pathways.
The finding that the magnitude of remyelination (as
expressed by OFM improvement) is independent of ini-
tial demyelination may allow it to serve as a baseline to
assess the efficacy of therapeutic strategies. Because the
expected rate of recovery is constant across patients, the
success of interventions can be easily ascertained.
Acknowledgment
This work was supported by the Caesarea Edmond and
Benjamin de Rothschild foundations.
We thank Z. Magen for running the VEP series.
Potential Conflicts of Interest
S.C.: consultancy, Fondation Ophtalmologique Roths-
child; employment, CNRS. T.B.-H.: board membership,
Raz et al: Motion Perception
April 2012 537

SAB of BrainWatch; stock/stock options, options in
BrainWatch Ltd (involved in developing MR spectroscopy;
no payment received).
References1. Halliday AM, McDonald WI, Mushin J. Delayed visual evoked
response in optic neuritis. Lancet 1972;1:982–985.
2. Halliday AM, McDonald WI, Mushin J. Delayed pattern-evokedresponses in optic neuritis in relation to visual acuity. Trans Oph-thalmol Soc U K 1973;93:315–324.
3. Chiappa KH. Evoked potentials in clinical medicine. 3rd ed. NewYork, NY: Lippincott Williams & Wilkins, 1977.
4. Jones SJ, Brusa A. Neurophysiological evidence for long-termrepair of MS lesions: implications for axon protection. J Neurol Sci2003;206:193–198.
5. Plant GT. Transient visually evoked potentials to sinusoidal gra-tings in optic neuritis. J Neurol Neurosurg Psychiatry 1983;46:1125–1133.
6. Sanders EA, Volkers AC, van der Poel JC, van Lith GH. Visualfunction and pattern visual evoked response in optic neuritis. Br JOphthalmol 1987;71:602–608.
7. Bodis-Wollner I, Hendley CD, Mylin LH, Thornton J. Visual evokedpotentials and the visuogram in multiple sclerosis. Ann Neurol1979;5:40–47.
8. Trip SA, Schlottmann PG, Jones SJ, et al. Retinal nerve fiber layeraxonal loss and visual dysfunction in optic neuritis. Ann Neurol2005;58:383–391.
9. Klistorner A, Arvind H, Nguyen T, et al. Axonal loss and myelin inearly ON loss in postacute optic neuritis. Ann Neurol 2008;64:325–331.
10. Halliday AM, McDonald WI. Pathophysiology of demyelinatingdisease. Br Med Bull 1977;33:21–27.
11. Thurtell MJ, Bala E, Yaniglos SS, et al. Evaluation of optic neurop-athy in multiple sclerosis using low-contrast visual evoked poten-tials. Neurology 2009;73:1849–1857.
12. Raz N, Dotan S, Benoliel T, et al. Sustained motion perceptiondeficit following optic neuritis: behavioral and cortical evidence.Neurology 2011;76:2103–2111.
13. Regan D, Kothe AC, Sharpe JA. Recognition of motion-definedshapes in patients with multiple sclerosis and optic neuritis. Brain1991;114(pt 3):1129–1155.
14. Mantyjarvi M, Laitinen T. Normal values for the Pelli-Robsoncontrast sensitivity test. J Cataract Refract Surg 2001;27:261–266.
15. Halliday AM, McDonald WI, Mushin J. Visual evoked response indiagnosis of multiple sclerosis. Br Med J 1973;4:661–664.
16. Klistorner A, Arvind H, Nguyen T, et al. Multifocal VEP and OCTin optic neuritis: a topographical study of the structure-functionrelationship. Doc Ophthalmol 2009;118:129–137.
17. Neima D, Regan D. Pattern visual evoked potentials and spatialvision in retrobulbar neuritis and multiple sclerosis. Arch Neurol1984;41:198–201.
18. Brusa A, Jones SJ, Kapoor R, et al. Long-term recovery and felloweye deterioration after optic neuritis, determined by serial visualevoked potentials. J Neurol 1999;246:776–782.
19. McDonald WI, Sears TA. The effects of experimental demyelin-ation on conduction in the central nervous system. Brain 1970;93:583–598.
20. Galvin RJ, Regan D, Heron JR. Impaired temporal resolution ofvision after acute retrobulbar neuritis. Brain 1976;99:255–268.
21. Heron JR, Regan D, Milner BA. Delay in visual perception in uni-lateral optic atrophy after retrobulbar neuritis. Brain 1974;97:69–78.
22. Barton JJ, Rizzo M. Motion perception in optic neuropathy. Neu-rology 1994;44:273–278.
23. Kolappan M, Henderson AP, Jenkins TM, et al. Assessingstructure and function of the afferent visual pathway in multiplesclerosis and associated optic neuritis. J Neurol 2009;256:305–319.
24. Klistorner A, Arvind H, Garrick R, et al. Remyelination of opticnerve lesions: spatial and temporal factors. Mult Scler 2010;16:786–795.
25. Franklin RJ, Ffrench-Constant C. Remyelination in the CNS: frombiology to therapy. Nat Rev 2008;9:839–855.
26. Blakemore WF, Chari DM, Gilson JM, Crang AJ. Modelling largeareas of demyelination in the rat reveals the potential and possi-ble limitations of transplanted glial cells for remyelination in theCNS. Glia 2002;38:155–168.
27. Chari DM, Blakemore WF. Efficient recolonisation of progenitor-depleted areas of the CNS by adult oligodendrocyte progenitorcells. Glia 2002;37:307–313.
28. Taveggia C, Feltri ML, Wrabetz L. Signals to promote myelin for-mation and repair. Nat Rev Neurol 2010;6:276–287.
ANNALS of Neurology
538 Volume 71, No. 4