demyelination versus remyelination in progressive multiple sclerosis
TRANSCRIPT
BRAINA JOURNAL OF NEUROLOGY
Demyelination versus remyelination inprogressive multiple sclerosisStephan Bramow,1,2,* Josa M. Frischer,3,4,* Hans Lassmann,3 Nils Koch-Henriksen,5,6
Claudia F. Lucchinetti,7 Per S. Sørensen2 and Henning Laursen1
1 Laboratory of Neuropathology, Copenhagen University Hospital Rigshospitalet, Copenhagen, Denmark
2 Danish Multiple Sclerosis Research Centre, Department of Neurology, University of Copenhagen and Rigshospitalet, Copenhagen, Denmark
3 Department of Neuroimmunology, Centre for Brain Research, Medical University of Vienna, Vienna, Austria
4 Department of Neurosurgery, Medical University of Vienna, Vienna, Austria
5 Danish Multiple Sclerosis Registry, Neuroscience Centre, Copenhagen University Hospital Rigshospitalet, Copenhagen, Denmark
6 Department of Neurology, Aarhus University Hospital in Aalborg, Aalborg, Denmark
7 Department of Neurology, College of Medicine, Mayo Clinic, Rochester, MN, USA
*These authors contributed equally to this work.
Correspondence to: Henning Laursen,
Laboratory of Neuropathology,
Copenhagen University Hospital Rigshospitalet,
Section 6301, Blegdamsvej 9,
DK-2100 Copenhagen, Denmark
E-mail: [email protected]
The causes of incomplete remyelination in progressive multiple sclerosis are unknown, as are the pathological correlates of the
different clinical characteristics of patients with primary and secondary progressive disease. We analysed brains and spinal cords
from 51 patients with progressive multiple sclerosis by planimetry. Thirteen patients with primary progressive disease were
compared with 34 with secondary progressive disease. In patients with secondary progressive multiple sclerosis, we found larger
brain plaques, more demyelination in total and higher brain loads of active demyelination compared with patients with primary
progressive disease. In addition, the brain density of plaques with high-grade inflammation and active demyelination was
highest in secondary progressive multiple sclerosis and remained �18% higher than in primary progressive multiple sclerosis
after adjustments for other plaque types and plaque number (P50.05). Conversely, the proportion of remyelinated shadow
plaques (P50.05) and the overall remyelination capacity (P50.01) per brain were higher in primary, compared with secondary,
progressive multiple sclerosis. By contrast, there were no group differences in the brain load or frequency of low-grade inflam-
matory plaques with slowly expanding demyelination. Spinal cord lesion loads and remyelination capacity were also comparable
in the two patient groups. Remyelinated areas were more vulnerable than the normal-appearing white matter to new demye-
lination, including active demyelination in secondary progressive multiple sclerosis. ‘Recurrent’ slowly expanding demyelination,
affecting remyelinated areas, and the load of slowly expanding demyelination correlated with incomplete remyelination in both
groups. In turn, incomplete remyelination in the spinal cord correlated with higher disease-related disability (determined retro-
spectively; r =�0.53; P50.05 for remyelination capacity versus disease severity). By contrast, such a correlation was not
observed in the brain. We propose that regulatory and reparative properties could protect the white matter of the brain
in patients with primary progressive multiple sclerosis. These patients may, thereby, be spared symptoms until the spinal
doi:10.1093/brain/awq250 Brain 2010: 133; 2983–2998 | 2983
Received March 24, 2010. Revised July 5, 2010. Accepted July 13, 2010. Advance Access publication September 20, 2010
� The Author (2010). Published by Oxford University Press on behalf of the Guarantors of Brain. All rights reserved.
For Permissions, please email: [email protected]
Dow
nloaded from https://academ
ic.oup.com/brain/article/133/10/2983/325331 by guest on 22 January 2022
cord is affected. By contrast, recurrent active demyelination of repaired myelin could explain why similar symptoms often
develop in consecutive relapses in relapsing-remitting/secondary progressive multiple sclerosis. Our data also indicate that
slowly expanding demyelination may irreparably destroy normal and repaired myelin, supporting the concept of slowly expand-
ing demyelination as an important pathological correlate of clinical progression.
Keywords: multiple sclerosis; chronic progressive; immune-mediated demyelination; remyelination; disability; spinal cord
Abbreviations: EDSS = Expanded Disability Status Score; MANOVA = Multivariate Analysis of Variance; MSSS = Multiple SclerosisSeverity Score; PPMS = primary progressive multiple sclerosis; RM = area of remyelination; RRMS = relapsing-remitting multiplesclerosis; SPMS = secondary progressive multiple sclerosis; WM = white matter without de- or remyelination
IntroductionMultiple sclerosis is a chronic, inflammatory demyelinating disease
of the CNS (Charcot, 1880). Most patients have relapsing-
remitting multiple sclerosis (RRMS) from onset. Although some
patients suffer severe disease and die within a year (acute multiple
sclerosis), the vast majority have chronic disease and, with time,
develop secondary progressive multiple sclerosis (SPMS), charac-
terized by gradual accumulation of irreversible impairment. Ten to
fifteen percent have progression from onset, i.e. primary progres-
sive multiple sclerosis (PPMS) (Lublin and Reingold, 1996; Miller
and Leary, 2007). Although patients with PPMS typically have a
later disease onset and a more equal male:female ratio, they reach
major disability milestones at similar ages as patients with SPMS
(Confavreux and Vukusic, 2006). By contrast, several studies indi-
cate that patients with PPMS remain cognitively better preserved
than those with SPMS (Comi et al., 1995; Huijbregts et al., 2004;
Bergendal et al., 2007). In line with these observations, patients
with PPMS have lower T2 brain lesion burdens on MRI, but similar
degrees of spinal cord involvement compared with patients with
SPMS (Nijeholt et al., 1998; Stevenson et al., 1999; Agosta et al.,
2007). Apart from a single study showing higher densities of in-
flammatory cells in selected brain plaques in SPMS compared with
PPMS (Revesz et al., 1994), none of neuropathological data ex-
plains the clinical differences observed between these two patient
groups.
Remyelination by oligodendrocyte lineage cells can be identified
pathologically by sharply demarcated areas of uniformly thin
myelin sheaths (Prineas and Connell, 1979; Bruck et al., 2003;
Patrikios et al., 2006). Remyelination may, in part, underlie remis-
sion following a relapse by restoring conduction velocity (Smith
et al., 1979) and by protection from axonal injury (Kornek
et al., 2000). However, remyelination may not always be stable
and recurrent demyelination of remyelinated areas has been docu-
mented in acute/RRMS (Prineas et al., 1993). In addition, remye-
lination of 460% of the total lesion area was less common in
SPMS than in RRMS brains (Patrikios et al., 2006). This suggests
either that new plaques remyelinate less efficiently in SPMS com-
pared with RRMS or that acquired remyelination may be des-
troyed by renewed inflammatory demyelination as the disease
progresses. Furthermore, the presence of slowly expanding pla-
ques were considered a pathological correlate of progression in
SPMS (Prineas et al., 2001). Consistent with the hypothesis that
slowly expanding demyelination might also be involved in
remyelination failure, these smouldering inflammatory plaques
were frequently found in patients with progressive disease, but
not in those with acute or RRMS (Frischer et al., 2009).
Relapses and related disability are regarded as a consequence of
focal inflammatory demyelination and axonal loss (Marburg,
1906). By contrast, the inflammatory nature of progression has
been questioned by poor correlations between lesion load on
MRI and irreversible disability, particularly in PPMS (Nijeholt
et al., 1998) and by the lack of efficacy of immunomodulatory
treatment for progressive multiple sclerosis. The best correlates of
chronic, irreversible disability have so far been axonal loss and
atrophy in the spinal cord (Stevenson et al., 1998; Bjartmar
et al., 2000), which may occur unrelated to demyelination
(DeLuca et al., 2006). However, the findings of diffuse white
matter inflammation, cortical demyelination (Kutzelnigg et al.,
2005) and an observed correlation between inflammation and
axonal injury in slowly expanding plaques (Frischer et al., 2009)
reinforce the concept that inflammation plays a central role in
contributing to disease progression.
Using planimetric analysis of brains and spinal cords from pa-
tients with clinically well-characterized progressive multiple scler-
osis, we report higher brain loads of active and total demyelination
in SPMS compared with PPMS, despite similar degrees of spinal
cord involvement. Conversely, we find a higher remyelination cap-
acity in the brain in PPMS compared with SPMS. We describe that
remyelinated areas may be more prone to inflammatory demye-
lination compared with the white matter outside plaques and
report that slowly expanding demyelination correlates with incom-
plete remyelination in PPMS and SPMS. In turn, incomplete
remyelination in the spinal cord correlates with severe
disease-related disability, whereas this seems not to be the case
in the brain.
Patients and methods
Sample characterizationWe used paraffin-embedded archival autopsy material from 51 pa-
tients with multiple sclerosis and 12 age-matched normal controls.
The multiple sclerosis sample included 14 patients with PPMS,
34 with SPMS and three patients with progressive disease, in whom
sub-classification was not possible due to insufficient clinical data. We
analysed tissue from patients with clinically diagnosed multiple sclerosis
and at least 18 months of gradual disease progression and in whom
2984 | Brain 2010: 133; 2983–2998 S. Bramow et al.
Dow
nloaded from https://academ
ic.oup.com/brain/article/133/10/2983/325331 by guest on 22 January 2022
multiple sclerosis plaques were subsequently found during neuropatho-
logical examination. Exclusion criteria were other known CNS disease
or significant pathology not attributable to multiple sclerosis. Brain
tissue was available from 50 out of 51 cases. This included large hemi-
spheric or double hemispheric tissue blocks in 15 patients. From six
patients with PPMS and 19 with SPMS, a median of three spinal cord
blocks from different levels could additionally be analysed (number of
levels: PPMS = 2–5; SPMS = 1–8; not significant). Observations from
the brain and spinal cord were paired, except in one patient with
PPMS where only spinal cord tissue was available for analysis. The
majority of sub-categorized patients (41 out of 47) died before 1982
and did not receive immunomodulatory or immunosuppressive treat-
ment, except for two patients who received prednisone during some
periods.
Retrospective clinical ratingDetailed clinical charts were available for the majority of patients. The
retrospective categorization of disease course was performed blinded
to the neuropathological data. All patients with more than one
relapse-like episode recorded prior to progression onset were
rated as SPMS. The majority had reported ophthalmological and/or
pyramidal symptoms during relapses. PPMS was defined when
the progressive symptoms were not preceded by relapses and domi-
nated by progressive disturbance of gait or balance. However,
one patient with one fully remitting episode of paraesthesia in both
feet 6 years before progression onset was also rated as PPMS be-
cause the neurological interpretation of the episode was unclear.
Consistent with PPMS (Stevenson et al., 1999), brain MRI during his
subsequent progressive gait disturbance showed limited lesion burden
(four small periventricular T2 lesions). However, CSF immunoglobulin
G index was increased and motor evoked potentials showed prolonged
central conduction (Bramow et al., 2008). The PPMS group also
included four patients who had a few protracted bouts of gait disturb-
ance after progression onset, i.e. suggestive of so-called progressive
relapsing multiple sclerosis. Due to variability in clinical details
provided, coupled with clinical similarities among these patients
(Montalban, 2004), we included these cases in the PPMS cohort.
The Expanded Disability Status Scale (EDSS; Kurtzke, 1983) was
estimated by two independent observers among cases with sufficient
clinical documentation on disease course in the 3 years prior to death
(n = 40). Scores 56.5 were always based on a full neurological exam-
ination. However, in a few cases where the walking distance was not
clearly stated, the EDSS was estimated from the Kurtzke’s Functional
System Score. EDSS scores between 6.5 and 9.5 could reliably be
determined, based on assessment of ambulation/self-reliance. An
EDSS score of 10 was used in four patients who died in terminal-stage
multiple sclerosis (previous EDSS score 48.5) from sudden aspiration
pneumonia (n = 3) or sudden pulmonary oedema without other find-
ings at general autopsy. The Multiple Sclerosis Severity Score (MSSS),
which combines the EDSS with disease duration, was assigned accord-
ing to the time point of the most recent EDSS score (Roxburgh et al.,
2005).
Neuropathological techniquesSections that were 4–6-mm thick were cut serially and stained with
haematoxylin and eosin. Myelin was visualized with luxol fast
blue-periodic acid Schiff and axons in small blocks with Bodian or
Bielschowsky silver stains. The distribution of axons in different area/
lesion types of the spinal cords were confirmed in nine representative
patients (six SPMS, three PPMS) by staining for neurofilament
light chain (68–70 kDa, Chemicon/Millipore AB 9568, 1:1000).
We stained all (including hemispheric) blocks immunohistochemically
for microglia/macrophages (CD68; Dako, Denmark; M0814; diluted
1:100) and for myelin proteolipid protein (myelin; Serotec, UK;
MCA839G; 1:1000). From 15 patients (3 PPMS and 12 SPMS),
brains were additionally stained for T cells (CD3; LabVision, USA;
RM 9107-R7; 1:1000) and B cells (CD20; LabVision, USA;
MS-340-R7; 1:100) to confirm inflammation.
For immunohistochemistry, endogenous peroxidase was blocked by
incubation of slides in methanol with 0.02% H2O2. Antigens were
retrieved by steaming sections for 90 min in ethylenediaminetetraacetic
acid (EDTA, 0.05 M) in 0.01 M tris(hydroxymethyl)aminomethane
buffer at pH 8.5. Non-specific binding of primary antibody was
blocked by a 20-min incubation of sections in foetal calf serum diluted
to 10% in 0.1 M phosphate buffered saline. Primary antibodies diluted
in foetal calf serum/phosphate buffered saline were then applied at
4�C overnight. Biotinylated secondary sheep anti-mouse or donkey
anti-rabbit (CD3) antibodies were applied for 60 min at room tempera-
ture (GE Healthcare, UK, formerly Amersham, Sweden; RPN1001 and
RPN1004; both diluted 1:200 in foetal calf serum/phosphate buffered
saline). After a 60-min incubation with a complex of avidin and bio-
tinylated horseradish peroxidase (Sigma; A3151; 1 mg/ml diluted 1:100
in foetal calf serum/phosphate buffered saline; room temperature), we
visualized signals with 3,30-diaminobenzidine-tetrahydrochloride
(Fluka; 32 750; 0.5 mg/ml in 0.06 M phosphate buffered saline with
0.01% H2O2) for �2 min during microscopy. Adjacent sections to
which no primary antibody was applied were used as negative
controls.
Plaque classificationRegarding demyelinating activity, three plaque types were distin-
guished. Active plaques were characterized either by the presence of
numerous macrophages positive for luxol fast blue or proteolipid pro-
tein, which were distributed throughout the plaque (i.e. so-called
acute active plaques), or, more often, by the presence of such macro-
phages concentrated at the plaque edge around an inactive centre
(i.e. so-called chronic active plaques, Fig. 1). Active plaques also con-
tained variable perivascular cuffs of mononuclear cells. Acute and
chronic active plaques were grouped into a single category, as we
did not observe differences in inflammatory activity or myelin
breakdown. Slowly expanding plaques displayed a rim of activated
microglia and at least two cells per high-power field with vacuoles
positive for luxol fast blue or proteolipid protein. Inactive plaques
were devoid of macrophages with such vacuoles. Remyelinated areas
were determined by two independent raters, including one neuro-
pathologist, and were characterized by sharply demarcated regions,
showing uniformly thin myelin sheaths and were largely devoid
of macrophages. Remyelinated areas additionally displayed relative
preservation of small and large diameter axons as opposed to the
more profound axonal loss and selective preservation of normally
myelinated large diameter axons in areas of presumed Wallerian de-
generation. This criterion has been validated by recent studies,
indicating that small axons in multiple sclerosis may be particularly
vulnerable (Evangelou et al., 2001; DeLuca et al., 2004) but
that remyelination may protect axons from injury (Kornek et al.,
2000; Irvine and Blakemore, 2008). Areas suggestive of Wallerian de-
generation were particularly often found in the spinal cord
(Supplementary Fig. 1). Plaques with at least 60% of their area
being remyelinated were defined as so-called shadow plaques
(Patrikios et al., 2006).
Demyelination versus remyelination in multiple sclerosis Brain 2010: 133; 2983–2998 | 2985
Dow
nloaded from https://academ
ic.oup.com/brain/article/133/10/2983/325331 by guest on 22 January 2022

Strategy for quantification ofdemyelination and remyelinationAs a first step, we determined the crude distribution of the three
plaque types in the brain and spinal cord (Table 2). We then counted
the numbers of each plaque type per square centimetre of brain tissue,
excluding the cortex. This yielded one density value per patient for
each plaque type (Table 3). In order to estimate the load of inflam-
matory demyelination and the remyelination capacity, we also per-
formed a planimetric analysis across all plaques in the white matter.
Identification of remyelinated white matter areas by light microscopy
has been described and validated (Bruck et al., 2003; Patrikios et al.,
2006). We measured areas of inactive focal lesion (including remyeli-
nation), slowly expanding areas and active areas. By normalizing the
results to the total white matter area in the sections, we obtained one
load value per patient for each lesion type (Table 4). The load of
combined inflammatory demyelination (slowly expanding plus active)
and the total white matter lesion load were also calculated.
Remyelination capacity was defined as the percentage of remyelinated
area in relation to the total white matter lesion area per patient.
However, lesion loads and the remyelination capacity were calculated
in the brain and spinal cord, separately.
For planimetry, slides stained with luxol fast blue were placed on a
light board and photographed digitally with a ruler using macro-photo
equipment. Magnification of photography was chosen such that each
slide was captured in a single image. Contrast and colour were ad-
justed automatically for red, green and blue and each slide was cali-
brated to a ruler. Areas were measured on screen during microscopy
of adjacent slides stained for myelin, axons and microglia/macro-
phages as outlined above. Figure 1 shows a schematic presentation
of the planimetry. In the hemispheres, we obtained a coefficient of
error (SEM/mean) of 50.05 for 10 consecutive measurements of
remyelinated areas �2 mm2 in size.
Estimation of the vulnerability todemyelination in white matter areasWe analysed whether inflammatory demyelination may affect remye-
linated areas differently than the normal-appearing white matter. For
reasons of accuracy (see above), we selected brains with �2 mm2 of
coherent remyelination (n = 43, Table 5 and Fig. 4A–C). A demyelinat-
ing frontline was defined as the border length between areas of in-
flammatory demyelination (active or slowly expanding) and the
surrounding white matter. We defined ‘1st hit’ demyelination as
Cortex
Deep grey matter
L1
L2
L3
L4L6
L7
L5
White matter
area
Remyelinated,
plaque
(inactive)
Inactive
plaque
Slowly
expanding
demyelination
Active
demyelination
Figure 1 A schematic illustration of the planimetry and the quantification of ‘1st hit’ and ‘2nd hit’ slowly expanding (orange) and active
demyelination (red).
2986 | Brain 2010: 133; 2983–2998 S. Bramow et al.
Dow
nloaded from https://academ
ic.oup.com/brain/article/133/10/2983/325331 by guest on 22 January 2022

demyelinating frontlines affecting white matter without evidence for
previous de- and remyelination (WM area), while ‘2nd hit’ demyelin-
ation affected remyelinated areas (RM area). We measured ‘1st hit’
and ‘2nd hit’ frontlines displaying evidence for either slowly expanding
or active demyelination and calculated the sum of the two (combined
frontlines). Adjusting these data for the absolute area sizes, we derived
frontline indices, estimating the vulnerability to inflammatory demye-
lination in remyelinated areas relative to the WM area, in fold. The
estimate rests on the assumption that both ‘1st hit’ and ‘2nd hit’
demyelinating frontlines distribute randomly in the corresponding
areas and was obtained as follows: we first defined the length ratios
of ‘2nd hit’ to ‘1st hit’ frontlines, i.e.
Frontline ratio FRð Þ ¼‘2nd hit0 frontline length at RM area
‘1st hit0 frontline length at WM area
Because of skewed distributions, we subsequently log-transformed the
data. Therefore, we had to add a constant (0.1 mm) to ‘2nd hit’
frontlines in order to avoid losing observations of zero, i.e. stable
remyelination. We balanced the constant added to ‘1st hit’ frontlines
in the WM area by multiplying it by the factor of area difference
between the remyelinated area and the WM area, i.e. 0.1� (WM
area/RM area).
FRþconstant ¼
Frontline length at RM areaþ 0:1 mm
Frontline length at WM area þ 0:1mm� WM area=RM areað Þ½ �
The FR+constant was then adjusted for the factor of size difference be-
tween the remyelinated area and the WM area to yield the frontline
index (FI), i.e.
FI ¼FRþconstant
RM area=WM areað Þ¼
FRþconstant �WM area
RM area
For a calculated example of a slowly expanding frontline index (FI)
based on Fig. 1, assume L1 = 2 mm, L2 = 4 mm and L3 = 8 mm, RM
area = 10 mm2, WM area = 100 mm2. The crude slowly expanding
frontline ratio
FR ¼L1
L2þ L3
FRþ constant ¼L1þ 0:1 mm ¼ 2:1 mm
L2þ L3þ ð0:1 mm� 100=10Þ ¼ 13 mm
FI ¼FRþ constant
ðRM area=WM areaÞ¼
2:1 mm=13 mm
10 mm2=100 mm2¼
1.62 and Log10(1.62) = 0.21.
In this theoretical example, the vulnerability of the RM areas to slowly
expanding demyelination is �1.6-fold higher than expected from the
WM area. The white asterisk in Fig. 4 illustrates such a data point. By
analogy, active and combined frontline indices were determined.
The parameter Log10 (combined FI) was normally distributed in both
PPMS and in SPMS (Fig. 4). An index of one (zero after
log-transformation) would indicate that the length of ‘2nd hit’ fron-
tlines was as expected from the observed length of ‘1st hit’ frontlines.
When analysing hemispheres only, the difference in overall vulnerabil-
ity of remyelinated areas compared with WM areas remained at the
same level as the whole group and also retained its significance when
we tentatively let the constant approach zero.
To further validate this complex quantitative approach, we also
counted the number of areas of ‘1st hit’ inflammatory demyelination
per cm2 in the WM area and the number of inflammatory ‘2nd hit’
demyelinating areas per cm2 remyelinated area. ‘1st hit’ and ‘2nd hit’
areas of inflammatory demyelination were confirmed by two authors.
This approach yielded similar results as those obtained with frontline
measurements, but did not allow estimation of the difference in vul-
nerability between RM and WM areas.
Finally, we estimated the potential importance of ‘2nd hit’ demye-
lination for the remyelination capacity in the brain (Table 6 and
Fig. 4D–F). The lengths of ’2nd hit’ frontlines impinging on remyeli-
nated areas were expressed as proportions of the circumference length
of all remyelinated areas, per brain. The resulting extent of ‘2nd hit’
demyelination was plotted against the remyelination capacity.
Statistical analysisStatistical Package for the Social Sciences (SPSS version 15.0; Chicago,
IL, USA) was used. Due to the data reduction described above, any
one patient only contributed with one degree of freedom to the ana-
lyses described below. Dichotomous variables were tested with a
chi-square test. Variables that were normally distributed in both
groups (ages at disease onset and death) were tested with an unpaired
t-test, whereas variables with skewed distributions were tested with
the Wilcoxon–Mann–Whitney U-test.
Regarding the hypothesized differences between PPMS and SPMS,
we first tested whether the density distributions of the three plaque
types (inactive, slowly expanding and active) were different using
multivariate analysis of variance (MANOVA). Discriminant analysis
was then performed to identify individual plaque types that discrimi-
nated between PPMS and SPMS. Positive findings were confirmed by
logistical regression analysis, estimating whether the odds for SPMS
changed with plaque densities. Group differences in individual plaque
types were Bonferroni corrected for the three plaque types analysed. A
similar strategy was used to analyse whether lesion loads differed be-
tween PPMS and SPMS. Remyelination capacity and shadow plaques
were considered separately because they were pre-planned and inter-
related with the individual types of plaques/lesion loads. However,
differences were confirmed by equalizing other predictors than
group in multiple regression analyses (Tables 3 and 4). In this way,
we also obtained an estimate of the residual difference in remyelina-
tion capacity between PPMS and SPMS when other significant con-
tributors were set equal. Further, pathologically measured predictors of
remyelination capacity were assessed, controlling additionally for
sampled tissue areas and other confounders, such as age. Residuals
were normally distributed and variance inflation factors, testing
co-linearity were 52.5 as compared with a recommended value of
55 (Field, 2005). Interrelations of variables were confirmed using
non-parametric Spearman’s rank correlation (Table 6).
Regarding the vulnerability in remyelinated versus WM areas, we
tested frontline indices (FI) of slowly expanding, active and combined
frontlines against the null-hypotheses with a one-sample t-test.
However, the distributions of Log10(slowly expanding FI) and
Log10(active FI) were slightly skewed in PPMS alone or in SPMS
alone (Fig. 4 and Table 5).
In patients allowing paired observations from the brain and spinal
cord, we assessed the Spearman’s rank correlations between the MSSS
and the load of white matter demyelination (excluding remyelinated
areas) and between the MSSS and remyelination capacity (n = 20).
Brains were compared with spinal cords using the paired Wilcoxon
signed ranks test (Fig. 3). All P-values are the result of two-sided
testing and corrected P-values of 50.05 in the total collection were
regarded significant. Similar trends found separately in the collections
of small brain blocks and hemispheres further confirmed differences
found in the total collection.
Demyelination versus remyelination in multiple sclerosis Brain 2010: 133; 2983–2998 | 2987
Dow
nloaded from https://academ
ic.oup.com/brain/article/133/10/2983/325331 by guest on 22 January 2022
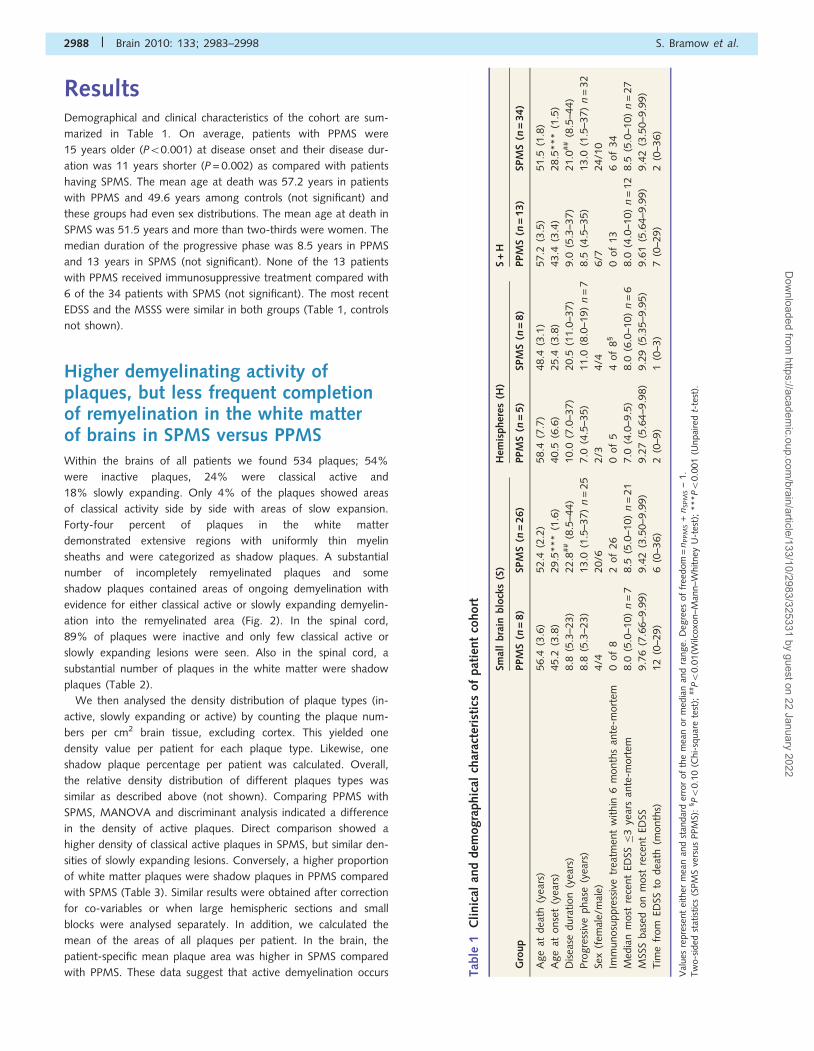
ResultsDemographical and clinical characteristics of the cohort are sum-
marized in Table 1. On average, patients with PPMS were
15 years older (P50.001) at disease onset and their disease dur-
ation was 11 years shorter (P = 0.002) as compared with patients
having SPMS. The mean age at death was 57.2 years in patients
with PPMS and 49.6 years among controls (not significant) and
these groups had even sex distributions. The mean age at death in
SPMS was 51.5 years and more than two-thirds were women. The
median duration of the progressive phase was 8.5 years in PPMS
and 13 years in SPMS (not significant). None of the 13 patients
with PPMS received immunosuppressive treatment compared with
6 of the 34 patients with SPMS (not significant). The most recent
EDSS and the MSSS were similar in both groups (Table 1, controls
not shown).
Higher demyelinating activity ofplaques, but less frequent completionof remyelination in the white matterof brains in SPMS versus PPMSWithin the brains of all patients we found 534 plaques; 54%
were inactive plaques, 24% were classical active and
18% slowly expanding. Only 4% of the plaques showed areas
of classical activity side by side with areas of slow expansion.
Forty-four percent of plaques in the white matter
demonstrated extensive regions with uniformly thin myelin
sheaths and were categorized as shadow plaques. A substantial
number of incompletely remyelinated plaques and some
shadow plaques contained areas of ongoing demyelination with
evidence for either classical active or slowly expanding demyelin-
ation into the remyelinated area (Fig. 2). In the spinal cord,
89% of plaques were inactive and only few classical active or
slowly expanding lesions were seen. Also in the spinal cord, a
substantial number of plaques in the white matter were shadow
plaques (Table 2).
We then analysed the density distribution of plaque types (in-
active, slowly expanding or active) by counting the plaque num-
bers per cm2 brain tissue, excluding cortex. This yielded one
density value per patient for each plaque type. Likewise, one
shadow plaque percentage per patient was calculated. Overall,
the relative density distribution of different plaques types was
similar as described above (not shown). Comparing PPMS with
SPMS, MANOVA and discriminant analysis indicated a difference
in the density of active plaques. Direct comparison showed a
higher density of classical active plaques in SPMS, but similar den-
sities of slowly expanding lesions. Conversely, a higher proportion
of white matter plaques were shadow plaques in PPMS compared
with SPMS (Table 3). Similar results were obtained after correction
for co-variables or when large hemispheric sections and small
blocks were analysed separately. In addition, we calculated the
mean of the areas of all plaques per patient. In the brain, the
patient-specific mean plaque area was higher in SPMS compared
with PPMS. These data suggest that active demyelination occurs Tab
le1
Cli
nic
alan
ddem
ogra
phic
alch
arac
teri
stic
sof
pat
ient
cohort
Smal
lbra
inblo
cks
(S)
Hem
ispher
es(H
)S
+H
Gro
up
PPM
S( n
=8)
SPM
S(n
=26)
PPM
S(n
=5)
SPM
S(n
=8)
PPM
S(n
=13)
SPM
S(n
=34)
Age
atdea
th(y
ears
)56.4
(3.6
)52.4
(2.2
)58.4
(7.7
)48.4
(3.1
)57.2
(3.5
)51.5
(1.8
)
Age
atonse
t(y
ears
)45.2
(3.8
)29.5
***
(1.6
)40.5
(6.6
)25.4
(3.8
)43.4
(3.4
)28.5
***
(1.5
)
Dis
ease
dura
tion
(yea
rs)
8.8
(5.3
–23)
22.8
##
(8.5
–44)
10.0
(7.0
–37)
20.5
(11.0
–37)
9.0
(5.3
–37)
21.0
##
(8.5
–44)
Pro
gre
ssiv
ephas
e(y
ears
)8.8
(5.3
–23)
13.0
(1.5
–37)
n=
25
7.0
(4.5
–35)
11.0
(8.0
–19)
n=
78.5
(4.5
–35)
13.0
(1.5
–37)
n=
32
Sex
(fem
ale/
mal
e)4/4
20/6
2/3
4/4
6/7
24/1
0
Imm
unosu
ppre
ssiv
etr
eatm
ent
within
6m
onth
san
te-m
ort
em0
of
82
of
26
0of
54
of
8§
0of
13
6of
34
Med
ian
most
rece
nt
EDSS�
3ye
ars
ante
-mort
em8.0
(5.0
–10)
n=
78.5
(5.0
–10)
n=
21
7.0
(4.0
–9.5
)8.0
(6.0
–10)
n=
68.0
(4.0
–10)
n=
12
8.5
(5.0
–10)
n=
27
MSS
Sbas
edon
most
rece
nt
EDSS
9.7
6(7
.66–9
.99)
9.4
2(3
.50–9
.99)
9.2
7(5
.64–9
.98)
9.2
9(5
.35–9
.95)
9.6
1(5
.64–9
.99)
9.4
2(3
.50–9
.99)
Tim
efr
om
EDSS
todea
th(m
onth
s)12
(0–2
9)
6(0
–36)
2(0
–9)
1(0
–3)
7(0
–29)
2(0
–36)
Val
ues
repre
sent
eith
erm
ean
and
stan
dar
der
ror
of
the
mea
nor
med
ian
and
range.
Deg
rees
of
free
dom
=n
PPM
S+
nSPM
S–
1.
Tw
o-s
ided
stat
istics
(SPM
Sve
rsus
PPM
S):
§P5
0.1
0(C
hi-
squar
ete
st);
##P5
0.0
1(W
ilcoxo
n–M
ann–W
hitney
U-t
est)
;***P5
0.0
01
(Unpai
red
t-te
st).
2988 | Brain 2010: 133; 2983–2998 S. Bramow et al.
Dow
nloaded from https://academ
ic.oup.com/brain/article/133/10/2983/325331 by guest on 22 January 2022
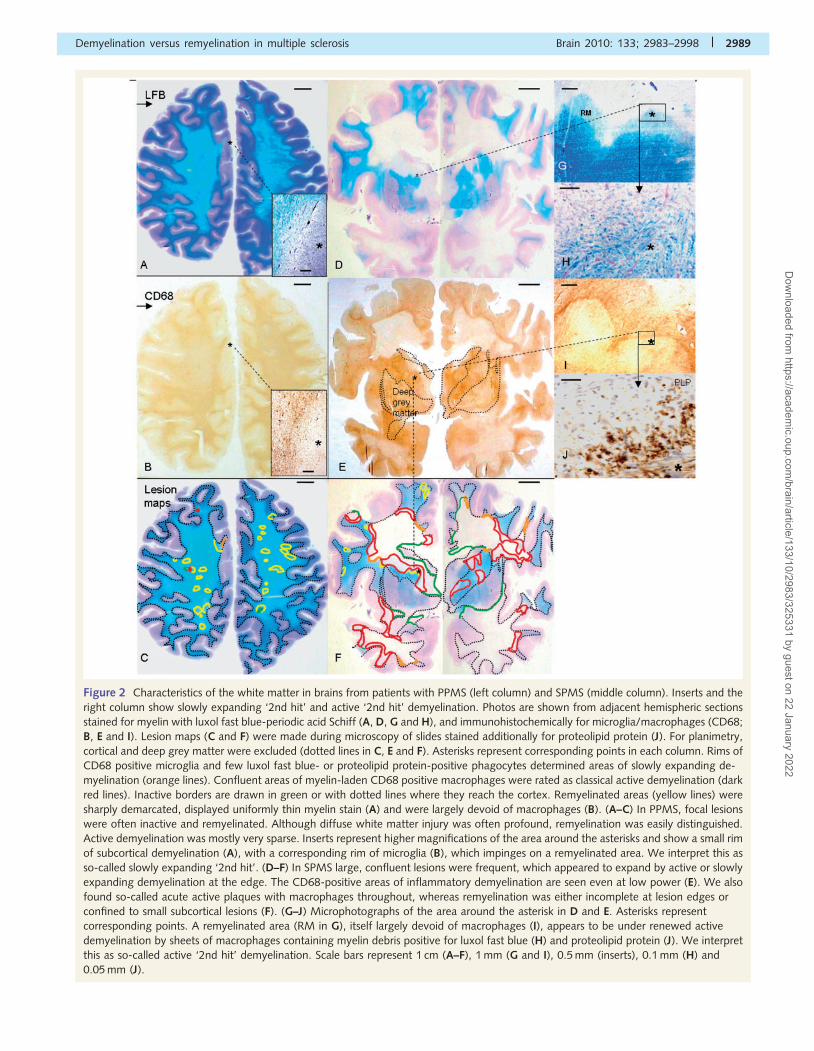
Figure 2 Characteristics of the white matter in brains from patients with PPMS (left column) and SPMS (middle column). Inserts and the
right column show slowly expanding ‘2nd hit’ and active ‘2nd hit’ demyelination. Photos are shown from adjacent hemispheric sections
stained for myelin with luxol fast blue-periodic acid Schiff (A, D, G and H), and immunohistochemically for microglia/macrophages (CD68;
B, E and I). Lesion maps (C and F) were made during microscopy of slides stained additionally for proteolipid protein (J). For planimetry,
cortical and deep grey matter were excluded (dotted lines in C, E and F). Asterisks represent corresponding points in each column. Rims of
CD68 positive microglia and few luxol fast blue- or proteolipid protein-positive phagocytes determined areas of slowly expanding de-
myelination (orange lines). Confluent areas of myelin-laden CD68 positive macrophages were rated as classical active demyelination (dark
red lines). Inactive borders are drawn in green or with dotted lines where they reach the cortex. Remyelinated areas (yellow lines) were
sharply demarcated, displayed uniformly thin myelin stain (A) and were largely devoid of macrophages (B). (A–C) In PPMS, focal lesions
were often inactive and remyelinated. Although diffuse white matter injury was often profound, remyelination was easily distinguished.
Active demyelination was mostly very sparse. Inserts represent higher magnifications of the area around the asterisks and show a small rim
of subcortical demyelination (A), with a corresponding rim of microglia (B), which impinges on a remyelinated area. We interpret this as
so-called slowly expanding ‘2nd hit’. (D–F) In SPMS large, confluent lesions were frequent, which appeared to expand by active or slowly
expanding demyelination at the edge. The CD68-positive areas of inflammatory demyelination are seen even at low power (E). We also
found so-called acute active plaques with macrophages throughout, whereas remyelination was either incomplete at lesion edges or
confined to small subcortical lesions (F). (G–J) Microphotographs of the area around the asterisk in D and E. Asterisks represent
corresponding points. A remyelinated area (RM in G), itself largely devoid of macrophages (I), appears to be under renewed active
demyelination by sheets of macrophages containing myelin debris positive for luxol fast blue (H) and proteolipid protein (J). We interpret
this as so-called active ‘2nd hit’ demyelination. Scale bars represent 1 cm (A–F), 1 mm (G and I), 0.5 mm (inserts), 0.1 mm (H) and
0.05 mm (J).
Demyelination versus remyelination in multiple sclerosis Brain 2010: 133; 2983–2998 | 2989
Dow
nloaded from https://academ
ic.oup.com/brain/article/133/10/2983/325331 by guest on 22 January 2022
more frequently, but that remyelination completes more rarely in
the brain in SPMS compared with PPMS. Collectively, this may
lead to larger brain plaques in the white/deep grey matter in
SPMS (Table 3).
To further confirm our results in the brain, we analysed
by planimetry the lesion areas (inactive, slowly expanding or
active) relative to the total white matter area in the sections,
obtaining one load value per patient for each lesion type.
Overall, the relative load distribution of different lesion types
resembled the distribution of plaque types described above
(not shown). Regarding lesional activity and remyelination in
PPMS and SPMS, the planimetric data also confirmed our re-
sults on plaque densities. MANOVA and discriminant ana-
lyses indicated a difference in the load of active demyelination.
We found the highest load of active demyelination in SPMS
and the difference compared with PPMS retained signifi-
cance after correction for co-variables (Table 4). By contrast,
there was no difference in the load of slowly expanding
demyelination after correction.
We also determined areas of remyelination (incomplete or in
shadow plaques) relative to the total white matter lesion area,
obtaining one value for remyelination capacity per patient. In
line with our observations for shadow plaques, we found a
higher remyelination capacity in PPMS compared with SPMS.
This finding was also confirmed in multivariate analysis
(see below) and in hemispheres and small brain blocks,
separately. In addition, the planimetric comparison revealed that
the total white matter lesion load was lower in PPMS than in
SPMS (Table 4).
In the brains from the subset of patients who also provided
spinal cord tissue (5 with PPMS versus 19 with SPMS), we again
found the highest load of inflammatory demyelination (slowly ex-
panding + classical active) and the lowest remyelination capacity in
SPMS. By contrast, in the spinal cord, inflammatory demyelination
and remyelination capacity did not differ between the groups of
patients (Fig. 3). However, a trend appeared that the average
individual spinal cord plaque (per patient) had grown larger in
PPMS compared with SPMS (P50.1; df = 23; data not shown),
despite similar spinal cord plaque loads. Together, these data
may indicate that the white matter of brains in PPMS is less
prone to inflammatory lesion growth, allowing for more complete
and more persistent remyelination as compared with SPMS. By
contrast, this may not be the case in the spinal cord.
Remyelinated areas are prone to‘2nd hit’ demyelinationTo explain the difference in remyelination between SPMS and
PPMS, we analysed whether new inflammatory demyelination
may affect remyelinated areas differently than the normal-
appearing white matter. We defined ‘1st hit’ demyelination as
inflammatory demyelination affecting white matter without evi-
dence for previous plaques (WM area), while ‘2nd hit’ demyelin-
ation targeted remyelinated areas. From these data we calculated
a frontline index (FI) as outlined in the ‘Patients and methods’
section. When inflammatory demyelination affects the WM and
remyelinated areas in the same way, FI is 0 (Figs 1 and 4A–C).
Among all patients with 42 mm2 of coherent remyelination in the
brain (n = 43; 12 PPMS; 21 SPMS), the length of all ‘2nd hit’
demyelinating frontlines (classical active + slowly expanding) were
�3-fold longer than expected from the length of all ‘1st hit’ fron-
tlines (Fig. 4A–C and Table 5). The increased vulnerability of
remyelinated tissue over the WM area was mainly caused by
slowly expanding demyelination, and less by classical active de-
myelination (Table 5). Furthermore, ‘2nd hit’ demyelination was
predominantly seen in SPMS, and less in PPMS. The results may
indicate that remyelinated areas in brains with multiple sclerosis
are more prone to slow lesion expansion than white matter with-
out previous plaques.
Slowly expanding demyelinationcorrelates with incompleteremyelinationThe results above may indicate that more complete remyelination
in PPMS compared with SPMS could be, at least in part, due to
less ‘2nd hit’ demyelination. To test this further, we analysed the
proportion of the total circumference of remyelinated areas of
42 mm2 in size, which showed inflammatory demyelination. The
result, i.e. the extent of ‘2nd hit’ demyelination, was plotted
against the remyelination capacity. We found a highly significant
negative correlation between the extent of ‘2nd hit’ demyelination
and completion of remyelination for slowly expanding frontlines,
but not for classical active frontlines (Fig. 4D–F and Table 6).
Multiple regression analysis revealed that slowly expanding de-
myelination was a correlate of incomplete remyelination after cor-
rection for co-variables and parameters of sampling. Each doubling
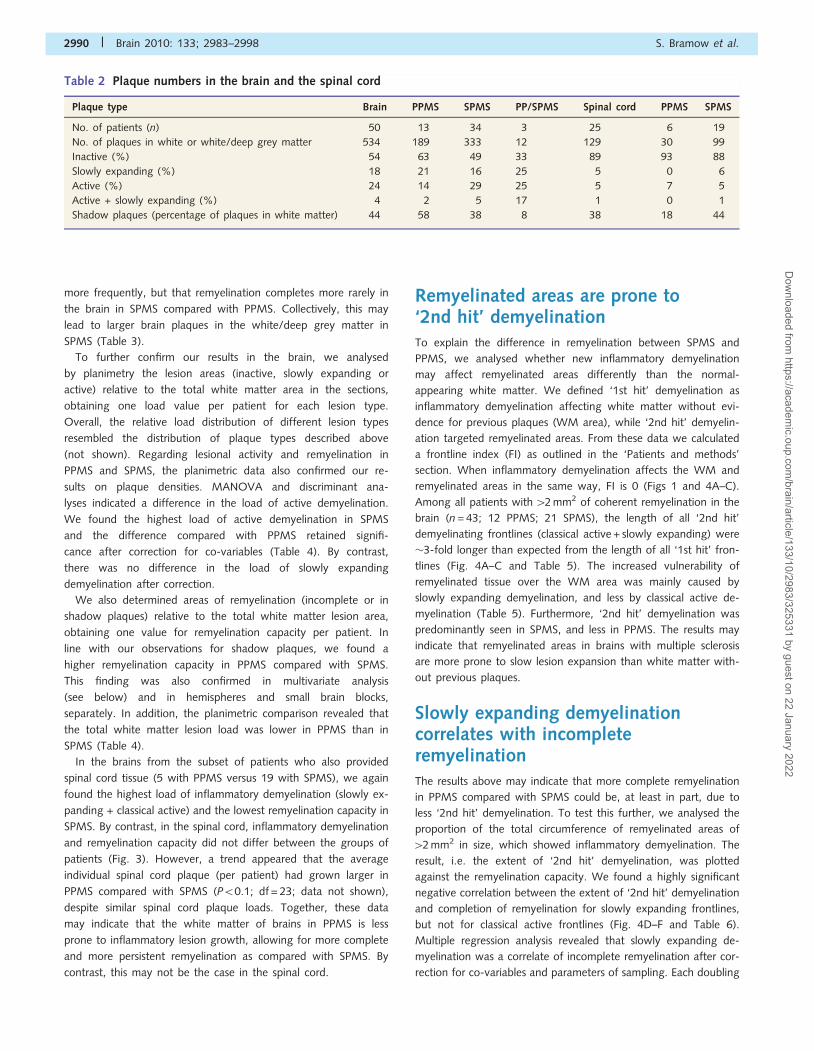
Table 2 Plaque numbers in the brain and the spinal cord
Plaque type Brain PPMS SPMS PP/SPMS Spinal cord PPMS SPMS
No. of patients (n) 50 13 34 3 25 6 19
No. of plaques in white or white/deep grey matter 534 189 333 12 129 30 99
Inactive (%) 54 63 49 33 89 93 88
Slowly expanding (%) 18 21 16 25 5 0 6
Active (%) 24 14 29 25 5 7 5
Active + slowly expanding (%) 4 2 5 17 1 0 1
Shadow plaques (percentage of plaques in white matter) 44 58 38 8 38 18 44
2990 | Brain 2010: 133; 2983–2998 S. Bramow et al.
Dow
nloaded from https://academ
ic.oup.com/brain/article/133/10/2983/325331 by guest on 22 January 2022
Tab
le4
Lesi
on
pla
nim
etry
inpro
gre
ssiv
em
ult
iple
scle
rosi
s
Smal
lbra
inblo
cks
(S)
Hem
ispher
es(H
)S
+H
Gro
up
PPM
S( n
=8)
SPM
S(n
=26)
PPM
S(n
=5)
SPM
S(n
=8)
PPM
S(n
=13)
SPM
S(n
=34)
White
mat
ter
area
(WM
A,
cm2)
7.0
(2.9
–9.1
)7.5
(2.6
–18.4
)42.6
(20.6
–98.1
)31.4
(11.6
–50.0
)8.9
(2.9
–98.1
)9.1
(2.6
–50.0
)
Load
of
white
mat
ter
lesi
on
(WM
L,%
of
WM
A)
10.2
(1.6
–44.7
)23.5
#(6
.9–5
1.0
)5.0
(1.5
–5.2
)21.9
#(2
.4–6
7.4
)5.9
(1.5
–44.7
)23.1
***
,§§
(2.4
–67.4
)
Inac
tive
foca
lle
sion
load
10.2
(0.7
–43.3
)19.8
(4.8
–47.7
)4.3
(1.2
–5.2
)19.0
(1.7
–41.6
)5.8
(0.7
–43.3
)19.8
*(1
.7–4
7.7
)
Slow
lyex
pan
din
gdem
yelin
atio
nlo
ad0.1
(0.0
–2.9
)0.7
(0.0
–4.1
)0.1
(0.0
–0.7
)0.6
(0.0
–2.6
)0.1
(0.0
–2.9
)0.7
(0.0
–4.1
)
Act
ive
dem
yelin
atio
nlo
ad0.0
(0.0
–1.5
)0.4
4(0
.0–1
6.6
)0.1
(0.0
–0.4
)1.9
**
(0.5
–31.9
)0.0
(0.0
–1.5
)0.9
*,§
(0.0
–31.9
)
Com
bin
edin
flam
mat
ory
dem
yelin
atio
nlo
ad0.3
(0.0
–4.4
)1.6
*(0
.0–1
6.6
)0.3
(0.0
–0.8
)2.9
**
(0.5
–32.8
)0.3
(0.0
–4.4
)2.1
***
,§(0
.0–3
2.8
)
Rem
yelin
atio
nca
pac
ity
(%of
WM
Lar
ea)
31.9
(0.0
–67.8
)14.4
*(0
.0–6
1.6
)85.8
(41.7
–94.9
)4.3
**
(1.7
–61.9
)47.0
(0.0
–94.4
)11.1
**
,§(0
.0–6
1.8
)
Val
ues
repre
sent
med
ians
(ran
ges
).Tw
o-s
ided
stat
istics
PPM
Sve
rsus
SPM
S(d
.f.=
pat
ient
n�
1),
Bonfe
rronico
rrec
ted
for
load
sof
thre
ein
div
idual
lesi
on
types
inth
eto
talco
hort
.#P5
0.1
0;
*P5
0.0
5;
**P5
0.0
1;
***P5
0.0
01
(Wilc
oxo
n–M
ann–W
hitney
U-t
est)
.To
obta
inco
rrec
ted
estim
ates
of
the
load
diffe
rence
s(P
PM
Svs
.SP
MS)
we
use
dm
ultip
lelin
ear
regre
ssio
nan
alys
es.
The
load
diffe
rence
inco
mbin
edin
flam
mat
ory
dem
yelin
atio
nw
asco
rrec
ted
for
inac
tive
foca
lle
sion
load
and
for
WM
A,
while
the
diffe
rence
inW
ML
load
was
corr
ecte
dfo
rW
MA
.The
rem
yelin
atio
nca
pac
ity
diffe
rence
was
corr
ecte
dfo
rth
elo
ads
of
inac
tive
foca
lles
ion
and
com
bin
edin
flam
mat
ory
dem
yelin
atio
nan
dfo
rth
eab
solu
tear
eas
of
rem
yelin
atio
nan
dW
MA
sam
ple
d.
The
load
sof
active
dem
yelin
atio
n,
com
bin
edin
flam
mat
ory
dem
yelin
atio
n,
and
WM
Lw
ere
hig
her
inSP
MS
than
inPPM
S.The
load
of
active
dem
yelin
atio
nw
as1.9
fold
hig
her
inSP
MS
vs.
PPM
Sw
hen
oth
erle
sion
types
and
WM
A
wer
ese
teq
ual
(95%
CI=
1.1
to3.4
5,P
=0.0
34).
Inth
ehem
ispher
esal
one,
the
corr
espondin
ges
tim
ate
was
2.9
fold
hig
her
inSP
MS
(P5
0.0
1).
Conve
rsel
y,th
ere
mye
linat
ion
capac
ity
was
hig
her
inPPM
Sco
mpar
edto
SPM
S(s
eeal
soTab
le6).
Multip
lere
gre
ssio
nan
alys
is:
two-s
ided
t-te
stfo
r�
of
chan
ge
from
PPM
Sto
SPM
S6¼
0:
§P5
0.0
5;
§§P5
0.0
1.
D.f
.=47
min
us
num
ber
of
variab
les
inth
em
odel
.
Tab
le3
Pla
que
den
siti
es,
pla
que
area
and
shad
ow
pla
que
freq
uen
cyin
pro
gre
ssiv
em
ult
iple
scle
rosi
s
Smal
lbra
inblo
cks
(S)
Hem
ispher
es(H
)S
+H
Gro
up
PPM
S( n
=8)
SPM
S(n
=26)
Contr
ol
(n=
12)
PPM
S(n
=5)
SPM
S(n
=8)
PPM
S(n
=13)
SPM
S(n
=34)
Blo
cks/
hem
ispher
es(N
o.;
med
ian,
range)
2(1
–6)
2(1
–9)
3(1
–7)
4(2
–6)
3(1
–6)
2(1
–8)
2(1
–9)
Pla
ques
inw
hite/
dee
pgre
ym
atte
r(N
o.)
3(2
–25)
4(1
–19)
0***
(0–0
)19
(17–5
3)
16
(7–6
8)
4(2
–53)
7(1
–68)
Tota
lpla
que
den
sity
(No./
cm2)
0.4
2(0
.31–1
.65)
0.6
6(0
.21–2
.94)
0***
(0–0
)0.5
0(0
.34–0
.59)
0.4
6(0
.32–1
.68)
0.4
4(0
.31–1
.65)
0.5
7(0
.21–2
.94)
Inac
tive
pla
ques
(No./
cm2)
0.2
3(0
.00–0
.61)
0.2
0(0
.00–1
.54)
0.3
3(0
.20–0
.49)
0.2
4(0
.14–1
.16)
0.2
7(0
.00–0
.61)
0.2
1(0
.00–1
.54)
Slow
lyex
pan
din
g(S
E)pla
ques
(No./
cm2)
0.2
2(0
.00–1
.05)
0.1
5(0
.00–0
.93)
0.0
4(0
.04–0
.16)
0.0
3(0
.00–0
.17)
0.1
0(0
.00–1
.05)
0.1
0(0
.00–0
.93)
Act
ive
pla
ques
(No./
cm2)
0.0
(0.0
0–0
.46)
0.1
3#
(0.0
0–2
.31)
0.0
8(0
.00–0
.10)
0.2
0*
(0.0
3–0
.35)
0.0
0(0
.00–0
.46)
0.1
4*
,a(0
.00–2
.31)
Act
ive/
SEpla
ques
(No./
cm2)
0.2
5(0
.00–1
.52)
0.3
8(0
.00–2
.31)
0.1
3(0
.04–0
.24)
0.2
1(0
.03–0
.52)
0.1
4(0
.00–1
.52)
0.3
7*
(0.0
0–2
.31)
Pla
que
area
(mm
2;
med
ian
and
range
of
Pat
ient-
spec
ific
mea
ns)
17.5
(2.2
–144.5
)36.0
(2.6
–151.8
)9.1
(6.1
–19.2
)22.3
#(6
.9–1
82.6
)16.6
(2.2
–144.5
)33.9
*(2
.6–1
82.6
)
Shad
ow
pla
ques
(pat
ient-
spec
ific
per
centa
ge
of
white
mat
ter
pla
ques
)25
(0–5
0)
0(0
–50)
67
(30–8
8)
35
(13–8
1)
50
(0–8
8)
15*
,b(0
–81)
Val
ues
repre
sent
med
ians
(ran
ges
).Tw
o-s
ided
stat
istics
,PP/S
PM
Sve
rsus
contr
ols
:***P5
0.0
01
(Wilc
oxo
n–M
ann–W
hitney
U-t
est,
MW
U)
PPM
Sve
rsus
SPM
S(d
f=pat
ient
n�
1),
Bonfe
rronic
orr
ecte
dfo
rin
div
idual
pla
que
types
inth
eto
talco
hort
#P5
0.1
0;
*P5
0.0
5(M
WU
).
aM
ultip
lelin
ear
regre
ssio
nan
alys
is.
The
den
sity
of
active
pla
ques
inSP
MS
was
18%
hig
her
com
par
edw
ith
PPM
Saf
ter
corr
ection
for
the
den
sities
of
inac
tive
pla
ques
and
slow
lyex
pan
din
gpla
ques
and
for
the
abso
lute
num
ber
of
pla
ques
sam
ple
d(9
5%
confiden
cein
terv
al=
2–3
6%
,P
=0.0
29,
adju
sted
model
R2=
0.1
4,
P=
0.0
33).
Nei
ther
slow
lyex
pan
din
gnor
inac
tive
pla
ques
contr
ibute
dsi
gnifi
cantly
toth
em
odel
.Si
mila
res
tim
ates
wer
eobta
ined
afte
rad
ditio
nal
corr
ection
for
hem
ispher
icve
rsus
smal
lblo
cksa
mplin
g(w
ider
CI)
.b
Multip
lelin
ear
regre
ssio
nan
alys
is.The
shad
ow
pla
que
pro
port
ion
was
,on
aver
age,
16%
poin
tslo
wer
inSP
MS
com
par
edw
ith
PPM
Saf
ter
corr
ection
asab
ove
.(C
I=�
28
to�
3%
,P
=0.0
15,ad
just
edm
odel
R2=
0.5
3,P5
0.0
01).
a+
b:
D.f
.=47
min
us
num
ber
of
vara
iable
sin
cluded
inth
em
odel
.
Demyelination versus remyelination in multiple sclerosis Brain 2010: 133; 2983–2998 | 2991
Dow
nloaded from https://academ
ic.oup.com/brain/article/133/10/2983/325331 by guest on 22 January 2022
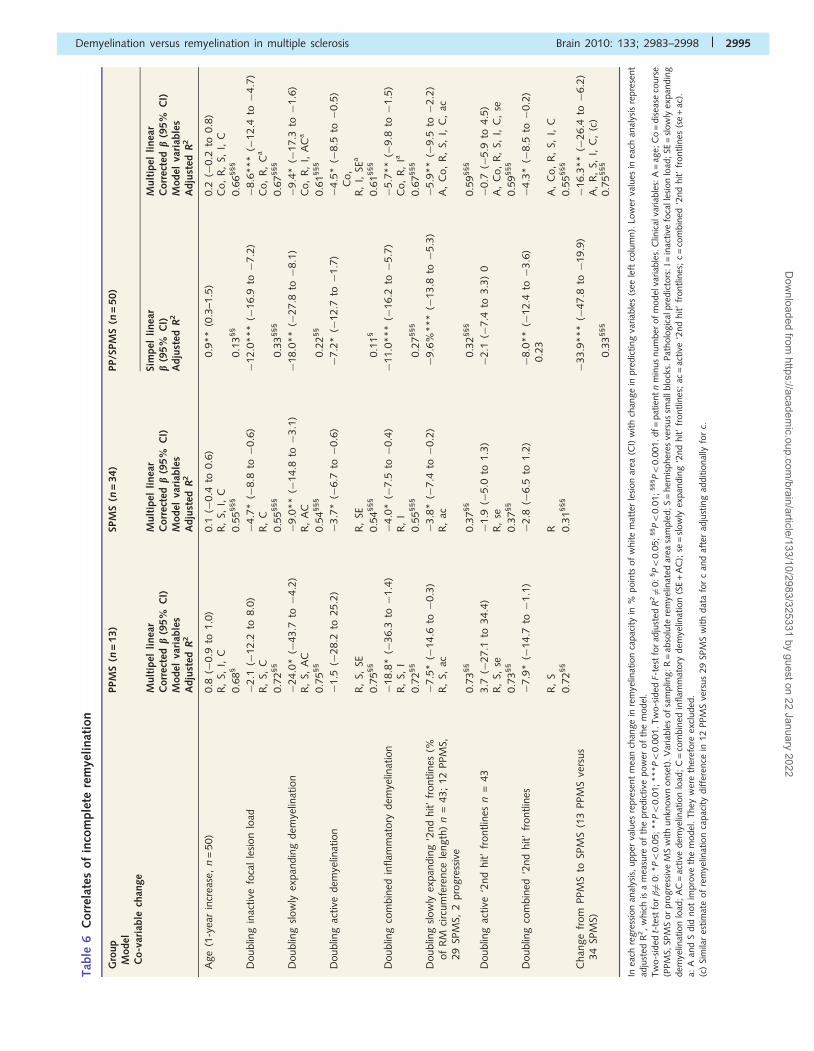
in the extent of slowly expanding ‘2nd hit’ demyelination corre-
lated with a decrease in remyelination capacity of 5.9% points [i.e.
less complete remyelination relative to the white matter lesion
area, 95% confidence interval (CI) �9.5 to �2.2% points,
P50.01]. Furthermore, the extent of slowly expanding ‘2nd hit’
demyelination and the overall load of slowly expanding
demyelination correlated with incomplete remyelination independ-
ently in PPMS and in SPMS. In SPMS, the inactive lesion load
and the load of active demyelination also correlated with incom-
plete remyelination after correction. However, ‘2nd hit’ demyelin-
ation alone or combined with lesion loads could not explain
the entire difference in remyelination between PPMS and SPMS
(Table 6).
Chronic demyelination andremyelination in the spinal cordare oppositely associated with thedisease severityWe also assessed the extent to which the MSSS correlated with
the demyelinated area load and the remyelination capacity in the
brain and in the spinal cord white matter. We selected patients in
whom we had samples from both the brain and spinal cord and
had detailed clinical information within 36 months prior to death
(n = 20; 5 PPMS; 15 SPMS). The demyelinated area load (load of
white matter lesion without remyelination) and the remyelination
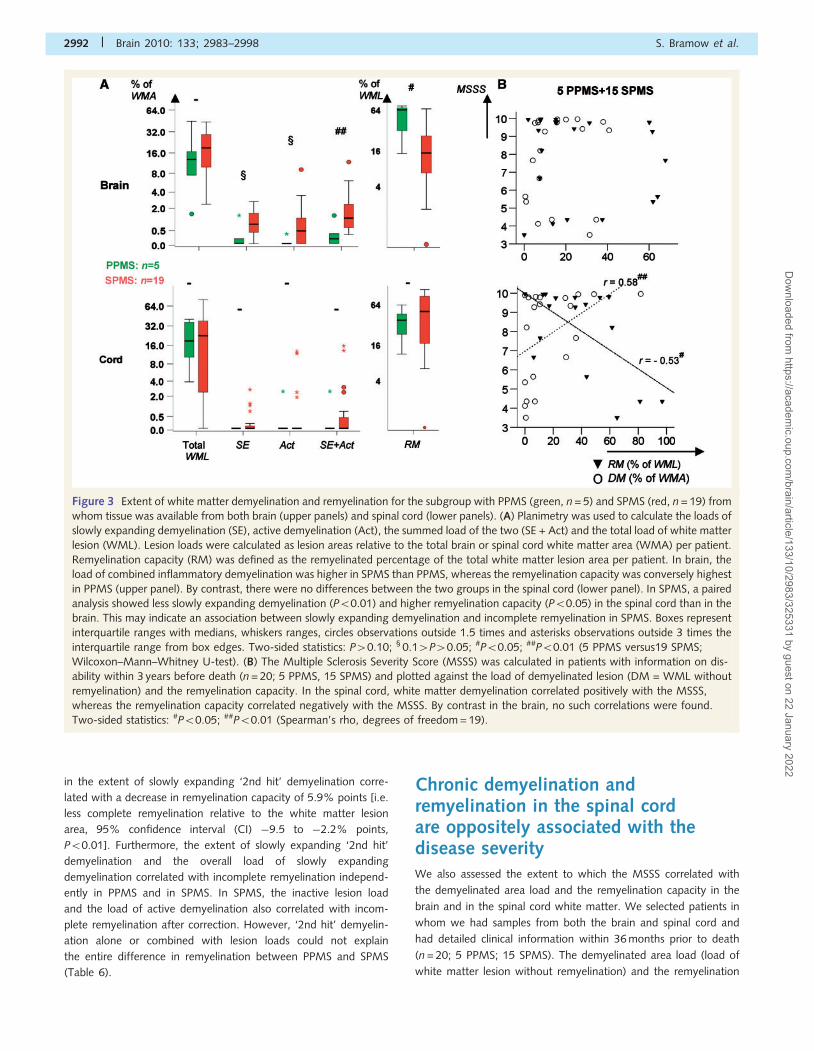
Figure 3 Extent of white matter demyelination and remyelination for the subgroup with PPMS (green, n = 5) and SPMS (red, n = 19) from
whom tissue was available from both brain (upper panels) and spinal cord (lower panels). (A) Planimetry was used to calculate the loads of
slowly expanding demyelination (SE), active demyelination (Act), the summed load of the two (SE + Act) and the total load of white matter
lesion (WML). Lesion loads were calculated as lesion areas relative to the total brain or spinal cord white matter area (WMA) per patient.
Remyelination capacity (RM) was defined as the remyelinated percentage of the total white matter lesion area per patient. In brain, the
load of combined inflammatory demyelination was higher in SPMS than PPMS, whereas the remyelination capacity was conversely highest
in PPMS (upper panel). By contrast, there were no differences between the two groups in the spinal cord (lower panel). In SPMS, a paired
analysis showed less slowly expanding demyelination (P50.01) and higher remyelination capacity (P50.05) in the spinal cord than in the
brain. This may indicate an association between slowly expanding demyelination and incomplete remyelination in SPMS. Boxes represent
interquartile ranges with medians, whiskers ranges, circles observations outside 1.5 times and asterisks observations outside 3 times the
interquartile range from box edges. Two-sided statistics: P40.10; § 0.14P40.05; #P50.05; ##P50.01 (5 PPMS versus19 SPMS;
Wilcoxon–Mann–Whitney U-test). (B) The Multiple Sclerosis Severity Score (MSSS) was calculated in patients with information on dis-
ability within 3 years before death (n = 20; 5 PPMS, 15 SPMS) and plotted against the load of demyelinated lesion (DM = WML without
remyelination) and the remyelination capacity. In the spinal cord, white matter demyelination correlated positively with the MSSS,
whereas the remyelination capacity correlated negatively with the MSSS. By contrast in the brain, no such correlations were found.
Two-sided statistics: #P50.05; ##P50.01 (Spearman’s rho, degrees of freedom = 19).
2992 | Brain 2010: 133; 2983–2998 S. Bramow et al.
Dow
nloaded from https://academ
ic.oup.com/brain/article/133/10/2983/325331 by guest on 22 January 2022
‘2nd hit’ frontline length (% of RM-circumference length)
Log10(frontline index), i.e. RM vulnerability over WM
A
B
C
SE frontlines
Actfrontlines
Act + SE frontlines
SPMS: P < 0.01 PPMS: NS (versus 0)
SPMS: P < 0.01 PPMS: P < 0.05 (versus 0)
Unspecified SPMS: P < 0.01 PPMS: NS (versus 0)
**
RM capacity (% of WML area)
**
NS
D
E
F
No. of patients
*
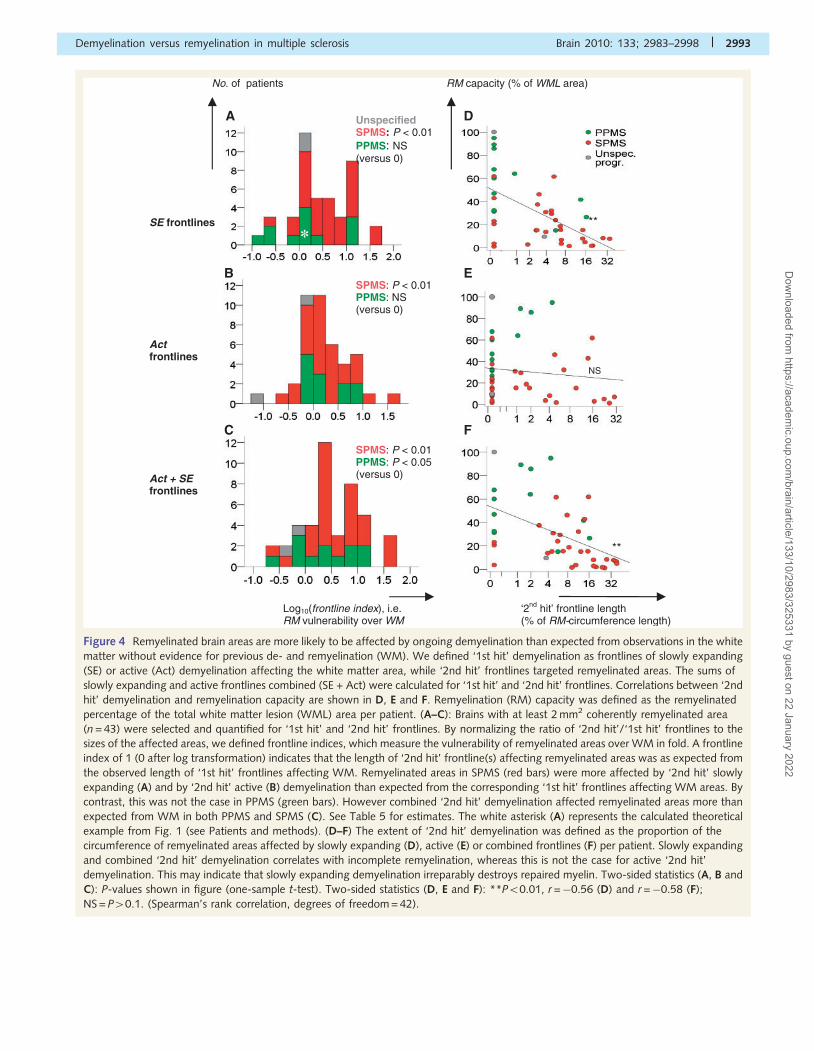
Figure 4 Remyelinated brain areas are more likely to be affected by ongoing demyelination than expected from observations in the white
matter without evidence for previous de- and remyelination (WM). We defined ‘1st hit’ demyelination as frontlines of slowly expanding
(SE) or active (Act) demyelination affecting the white matter area, while ‘2nd hit’ frontlines targeted remyelinated areas. The sums of
slowly expanding and active frontlines combined (SE + Act) were calculated for ‘1st hit’ and ‘2nd hit’ frontlines. Correlations between ‘2nd
hit’ demyelination and remyelination capacity are shown in D, E and F. Remyelination (RM) capacity was defined as the remyelinated
percentage of the total white matter lesion (WML) area per patient. (A–C): Brains with at least 2 mm2 coherently remyelinated area
(n = 43) were selected and quantified for ‘1st hit’ and ‘2nd hit’ frontlines. By normalizing the ratio of ‘2nd hit’/‘1st hit’ frontlines to the
sizes of the affected areas, we defined frontline indices, which measure the vulnerability of remyelinated areas over WM in fold. A frontline
index of 1 (0 after log transformation) indicates that the length of ‘2nd hit’ frontline(s) affecting remyelinated areas was as expected from
the observed length of ‘1st hit’ frontlines affecting WM. Remyelinated areas in SPMS (red bars) were more affected by ‘2nd hit’ slowly
expanding (A) and by ‘2nd hit’ active (B) demyelination than expected from the corresponding ‘1st hit’ frontlines affecting WM areas. By
contrast, this was not the case in PPMS (green bars). However combined ‘2nd hit’ demyelination affected remyelinated areas more than
expected from WM in both PPMS and SPMS (C). See Table 5 for estimates. The white asterisk (A) represents the calculated theoretical
example from Fig. 1 (see Patients and methods). (D–F) The extent of ‘2nd hit’ demyelination was defined as the proportion of the
circumference of remyelinated areas affected by slowly expanding (D), active (E) or combined frontlines (F) per patient. Slowly expanding
and combined ‘2nd hit’ demyelination correlates with incomplete remyelination, whereas this is not the case for active ‘2nd hit’
demyelination. This may indicate that slowly expanding demyelination irreparably destroys repaired myelin. Two-sided statistics (A, B and
C): P-values shown in figure (one-sample t-test). Two-sided statistics (D, E and F): **P50.01, r =�0.56 (D) and r =�0.58 (F);
NS = P40.1. (Spearman’s rank correlation, degrees of freedom = 42).
Demyelination versus remyelination in multiple sclerosis Brain 2010: 133; 2983–2998 | 2993
Dow
nloaded from https://academ
ic.oup.com/brain/article/133/10/2983/325331 by guest on 22 January 2022
capacity were plotted against the MSSS (Fig. 3B). In the spinal
cord, demyelination correlated positively (r = 0.58, P50.01) and
remyelination capacity negatively (r =�0.53, P50.05) with
MSSS. There were also trends to similar correlations with the
EDSS. By contrast, neither demyelination nor remyelination cap-
acity in the brain showed any correlation with the disease severity,
emphasizing that the upper part of the disability scales predomin-
antly reflects spinal cord damage. Furthermore, the data indicate
that demyelination in the spinal cord may contribute to the accu-
mulation of irreversible motor disability.
DiscussionIt is currently unresolved why remyelination largely fails in multiple
sclerosis, and in particular in SPMS (Patrikios et al., 2006). Here
we show in an extensive quantitative study that slowly expanding
demyelination of remyelinated areas is a correlate of incomplete
remyelination in patients with progressive disease. Besides this
result, our study clarifies a number of other points relevant to
the pathology and pathogenesis of progressive multiple sclerosis.
Firstly, we demonstrate a lower overall lesion load and more
complete remyelination in the brain in PPMS compared with
SPMS. As cognitive dysfunction in multiple sclerosis is generally
regarded as subcortical, we speculate that sparing of the white
matter in brains from patients with PPMS could, in part, explain
their relatively preserved cognitive function compared with pa-
tients with SPMS (Comi et al., 1995; Huijbregts et al., 2004;
Bergendal et al., 2007). By contrast, the spinal cord white
matter appears not to be relatively spared in PPMS, and individual
spinal cord plaques may even grow larger in PPMS than in SPMS.
These data are in line with comparable MRI findings (Nijeholt
et al., 1998; Stevenson et al., 1999; Agosta et al., 2007) and
with the faster accrual of physical disability from disease onset in
PPMS compared with SPMS (Confavreux and Vukusic, 2006).
However, one recent pathological study showed less white
matter demyelination in the cervical cords in PPMS compared
with SPMS (Tallantyre et al., 2009). This discrepancy is probably
explained by different procedures of sampling and tissue analysis.
While we included several spinal cord levels and remyelination in
our plaque/lesion analysis, Tallantyre et al. (2009) found evidence
for higher vulnerability of spinal cord axons in PPMS compared
with SPMS. Such a difference could contribute to the ‘catch-up’ in
physical disability in PPMS to similar levels as in SPMS at compar-
able ages, despite shorter disease duration. Larger individual pla-
ques and more vulnerable axons in the spinal cord in PPMS
compared with SPMS could therefore explain the previous findings
of axonal loss and atrophy of the spinal cord in PPMS (Miller and
Leary, 2007), despite sparing of the white matter of the brain (as
shown in this study). These factors may, at least in part, account
for the shorter life span from disease onset among patients with
PPMS. Importantly, however, the extent of brainstem involvement
remains unknown.
The overall load of inflammatory demyelination in the brain was
reduced in PPMS compared with SPMS, also in those patients in
whom no difference could be detected in the spinal cord.
Therefore, the differences in active demyelination and total
lesion load in the brain are unlikely to be explained solely by dif-
ferent disease durations or other clinical/demographic imbalances
in the groups. To further address potential patient selection bias,
we matched the survival of our cohort with that of the population
of Danish patients with multiple sclerosis by means of data from
the Danish Multiple Sclerosis Registry, which contains data from all
diagnosed patients in Denmark. We identified a group of 22 pa-
tients (5 PPMS and 17 SPMS) who died between 1963 and 1975
and whose survival was similar to the survival of Danish patients
with multiple sclerosis during this period (54.8 years). We infer
limited or no selection bias in this group. By contrast, the mean
survival among patients in our study who died after 1975 was
51.6 years, i.e. �10 years shorter than the Danish population of
the time. When we restricted our analysis to the putatively more
unbiased group collected before 1976, the results resembled those
obtained in the whole collection with respect to white matter
lesion load, active demyelination, combined inflammatory demye-
lination and remyelination capacity. Survival and the last recorded
EDSS and MSSS were comparable between patients with PPMS
and SPMS regardless of the period of collection. Together, it is
unlikely that patient selection bias accounts for the pathological
differences between PPMS and SPMS.
Secondly, we found all types of plaques in both PPMS and in
SPMS and the densities of all plaque types together were similar.
Therefore, our data do not support the notion of fundamentally
different disease mechanisms. Rather, they may reflect differential
responses to common mechanisms of demyelination in the white
matter of the brain. While we found evidence for equally frequent
episodes of demyelination with or without remyelination (i.e. equal
densities of all plaque types together), we found a lower density
and load of active demyelination, lower total lesion load and more
complete remyelination in PPMS. Furthermore, the brain plaques
were, on average, smaller in PPMS than in SPMS. This may indi-
cate that a more efficient regulation and repair of the inflamma-
tory disease process contribute to sparing of the white matter of
the brain in PPMS compared with SPMS. Although speculative, a
more efficient regulation of the inflammatory process could arise
from different antigen presentation in PPMS since human leuco-
cyte antigen DR-DQ haplotype frequencies differed between
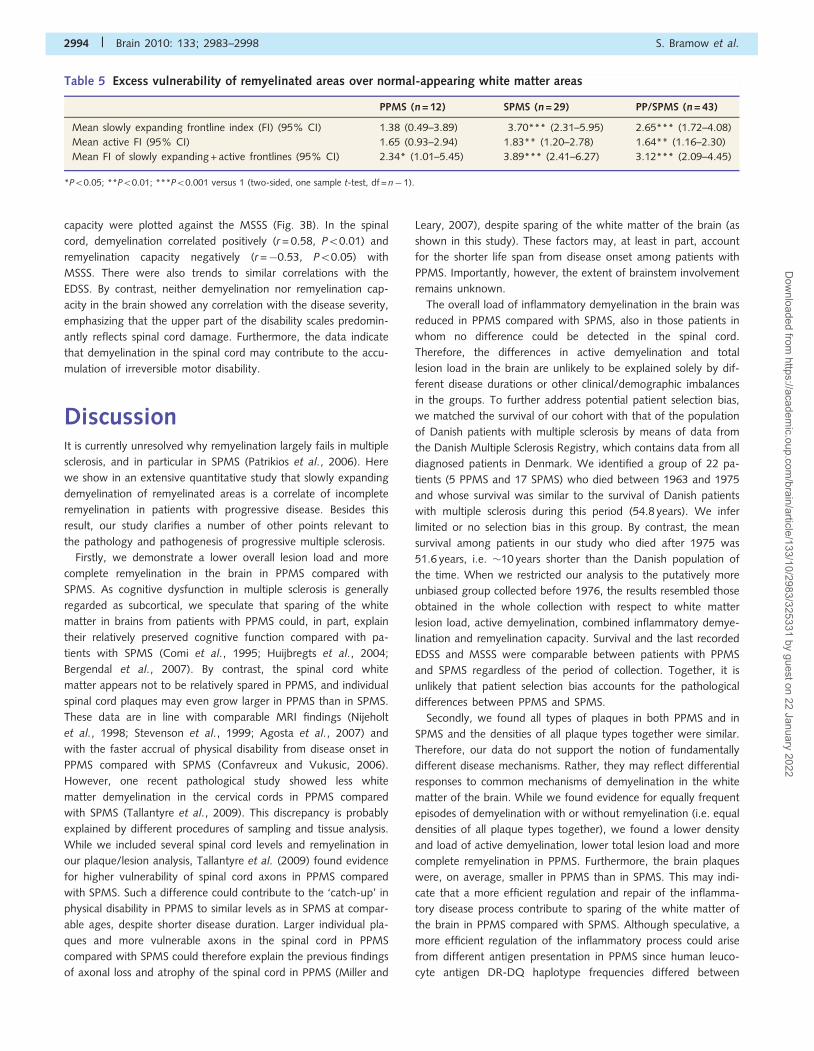
Table 5 Excess vulnerability of remyelinated areas over normal-appearing white matter areas
PPMS (n = 12) SPMS (n = 29) PP/SPMS (n = 43)
Mean slowly expanding frontline index (FI) (95% CI) 1.38 (0.49–3.89) 3.70*** (2.31–5.95) 2.65*** (1.72–4.08)
Mean active FI (95% CI) 1.65 (0.93–2.94) 1.83** (1.20–2.78) 1.64** (1.16–2.30)
Mean FI of slowly expanding + active frontlines (95% CI) 2.34* (1.01–5.45) 3.89*** (2.41–6.27) 3.12*** (2.09–4.45)
*P50.05; **P50.01; ***P50.001 versus 1 (two-sided, one sample t-test, df = n� 1).
2994 | Brain 2010: 133; 2983–2998 S. Bramow et al.
Dow
nloaded from https://academ
ic.oup.com/brain/article/133/10/2983/325331 by guest on 22 January 2022
Tab
le6
Corr
elat
esof
inco
mple
tere
mye
linat
ion
Gro
up
Model
Co-v
aria
ble
chan
ge
PPM
S( n
=13)
SPM
S(n
=34)
PP/S
PM
S(n
=50)
Mult
ipel
linea
rC
orr
ecte
db
(95%
CI)
Model
vari
able
sA
dju
sted
R2
Mult
ipel
linea
rC
orr
ecte
db
(95%
CI)
Model
vari
able
sA
dju
sted
R2
Sim
pel
linea
rb
(95%
CI)
Adju
sted
R2
Mult
ipel
linea
rC
orr
ecte
db
(95%
CI)
Model
vari
able
sA
dju
sted
R2
Age
(1-y
ear
incr
ease
,n
=50)
0.8
(�0.9
to1.0
)0.1
(�0.4
to0.6
)0.9
**
(0.3
–1.5
)0.2
(�0.2
to0.8
)R
,S,
I,C
R,
S,I,
CC
o,
R,
S,I,
C
0.6
8§
0.5
5§§§
0.1
3§§
0.6
6§§§
Doublin
gin
active
foca
lle
sion
load
�2.1
(�12.2
to8.0
)�
4.7
*(�
8.8
to�
0.6
)�
12.0
***
(�16.9
to�
7.2
)�
8.6
***
(�12.4
to�
4.7
)R
,S,
CR
,C
Co,
R,
Ca
0.7
2§§
0.5
5§§§
0.3
3§§§
0.6
7§§§
Doublin
gsl
ow
lyex
pan
din
gdem
yelin
atio
n�
24.0
*(�
43.7
to�
4.2
)�
9.0
**
(�14.8
to�
3.1
)�
18.0
**
(�27.8
to�
8.1
)�
9.4
*(�
17.3
to�
1.6
)R
,S,
AC
R,
AC
Co,
R,
I,A
Ca
0.7
5§§
0.5
4§§§
0.2
2§§
0.6
1§§§
Doublin
gac
tive
dem
yelin
atio
n�
1.5
(�28.2
to25.2
)�
3.7
*(�
6.7
to�
0.6
)�
7.2
*(�
12.7
to�
1.7
)�
4.5
*(�
8.5
to�
0.5
)C
o,
R,
S,SE
R,
SER
,I,
SEa
0.7
5§§
0.5
4§§§
0.1
1§
0.6
1§§§
Doublin
gco
mbin
edin
flam
mat
ory
dem
yelin
atio
n�
18.8
*(�
36.3
to�
1.4
)�
4.0
*(�
7.5
to�
0.4
)�
11.0
***
(�16.2
to�
5.7
)�
5.7
**
(�9.8
to�
1.5
)R
,S,
IR
,I
Co,
R,
Ia
0.7
2§§
0.5
5§§§
0.2
7§§§
0.6
7§§§
Doublin
gsl
ow
lyex
pan
din
g‘2
nd
hit’
frontlin
es(%
of
RM
circ
um
fere
nce
length
)n
=43;
12
PPM
S,29
SPM
S,2
pro
gre
ssiv
e
�7.5
*(�
14.6
to�
0.3
)�
3.8
*(�
7.4
to�
0.2
)�
9.6
%***
(�13.8
to�
5.3
)�
5.9
**
(�9.5
to�
2.2
)R
,S,
acR
,ac
A,
Co,
R,
S,I,
C,
ac
0.7
3§§
0.3
7§§
0.3
2§§§
0.5
9§§§
Doublin
gac
tive
‘2nd
hit’
frontlin
esn
=43
3.7
(�27.1
to34.4
)�
1.9
(�5.0
to1.3
)�
2.1
(�7.4
to3.3
)0
�0.7
(�5.9
to4.5
)R
,S,
seR
,se
A,
Co,
R,
S,I,
C,
se
0.7
3§§
0.3
7§§
0.5
9§§§
Doublin
gco
mbin
ed‘2
nd
hit’
frontlin
es�
7.9
*(�
14.7
to�
1.1
)�
2.8
(�6.5
to1.2
)�
8.0
**
(�12.4
to�
3.6
)0.2
3�
4.3
*(�
8.5
to�
0.2
)
R,
SR
A,
Co,
R,
S,I,
C
0.7
2§§
0.3
1§§§
0.5
5§§§
Chan
ge
from
PPM
Sto
SPM
S(1
3PPM
Sve
rsus
34
SPM
S)�
33.9
***
(�47.8
to�
19.9
)�
16.3
**
(�26.4
to�
6.2
)A
,R
,S,
I,C
,(c
)0.3
3§§§
0.7
5§§§
Inea
chre
gre
ssio
nan
alys
is,
upper
valu
esre
pre
sent
mea
nch
ange
inre
mye
linat
ion
capac
ity
in%
poin
tsof
white
mat
ter
lesi
on
area
(CI)
with
chan
ge
inpre
dic
ting
variab
les
(see
left
colu
mn).
Low
erva
lues
inea
chan
alys
isre
pre
sent
adju
sted
R2,
whic
his
am
easu
reof
the
pre
dic
tive
pow
erof
the
model
.Tw
o-s
ided
t-te
stfo
r�6¼
0:*P5
0.0
5;**P5
0.0
1;***P5
0.0
01.Tw
o-s
ided
F-te
stfo
rad
just
edR
26¼
0:
§P5
0.0
5;
§§P5
0.0
1;
§§§P5
0.0
01.df=
pat
ient
nm
inus
num
ber
of
model
variab
les.
Clin
ical
variab
les:
A=
age;
Co
=dis
ease
cours
e(P
PM
S,SP
MS
or
pro
gre
ssiv
eM
Sw
ith
unkn
ow
nonse
t).V
aria
ble
sof
sam
plin
g:R
=ab
solu
tere
mye
linat
edar
easa
mple
d;S
=hem
ispher
esve
rsus
smal
lblo
cks.
Pat
holo
gic
alpre
dic
tors
:I=
inac
tive
foca
lles
ion
load
;SE
=sl
ow
lyex
pan
din
gdem
yelin
atio
nlo
ad;
AC
=ac
tive
dem
yelin
atio
nlo
ad;
C=
com
bin
edin
flam
mat
ory
dem
yelin
atio
n(S
E+
AC
);se
=sl
ow
lyex
pan
din
g‘2
nd
hit’
frontlin
es;
ac=
active
‘2nd
hit’
frontlin
es;
c=
com
bin
ed‘2
nd
hit’
frontlin
es(s
e+
ac).
a:A
and
Sdid
not
impro
veth
em
odel
.They
wer
eth
eref
ore
excl
uded
.(c
)Si
mila
res
tim
ate
of
rem
yelin
atio
nca
pac
ity
diffe
rence
in12
PPM
Sve
rsus
29
SPM
Sw
ith
dat
afo
rc
and
afte
rad
just
ing
additio
nal
lyfo
rc.
Demyelination versus remyelination in multiple sclerosis Brain 2010: 133; 2983–2998 | 2995
Dow
nloaded from https://academ
ic.oup.com/brain/article/133/10/2983/325331 by guest on 22 January 2022
patients with RRMS/SPMS and PPMS (Olerup et al., 1989; Hillert
et al., 1992). However, unknown genetic differences unrelated to
inflammatory demyelination could additionally explain the differ-
ence in remyelination between patients with PPMS and SPMS
because this difference persisted after correction for inflammatory
demyelination, including ‘2nd hit’ demyelination. For instance, al-
lelic variants in growth-related genes have been suggested to in-
fluence remyelination in mice (Suwansrinon et al., 2009).
It remains obscure why the spinal cord is as equally involved in
PPMS as in SPMS, despite sparing of the white matter in the brain
in PPMS. In addition to potential blood–brain barrier differences
between the brain and the spinal cord (Juhler et al., 1984;
Silwedel and Forster, 2006), the spinal cord white matter is, by
anatomy, more directly exposed to inflammatory cells in the cere-
brospinal fluid (Monson et al., 2005) than white matter in the
brain, with the exception of the periventricular regions. A connec-
tion between demyelination and the cerebrospinal fluid in PPMS is
also supported by the previous paired observation of equal levels
of cortical demyelination in patients with PPMS and SPMS, but a
trend of sparing of the white matter in brains with PPMS as
compared with SPMS (Kutzelnigg et al., 2005), similar to this
study. Thus we speculate that in the spinal cord, putative regula-
tive/reparative properties of the CNS white matter in PPMS could
be offset by chronic inflammation in the cerebrospinal fluid, pos-
sibly driven by B cells (Sellebjerg et al., 2009).
Thirdly, the positive correlation between spinal cord demyelin-
ation and the MSSS and the negative correlation between spinal
cord remyelination capacity and the MSSS represents the first
direct link between the demyelination–remyelination balance and
the severity of clinical disease. By contrast, MRI studies have only
detected weak correlations between spinal cord T2 lesion load and
the EDSS (Stevenson et al., 1999). However, the EDSS does not
consider the disease duration required to develop a given disability
level. Inability to distinguish demyelinated from remyelinated and
white matter from grey matter lesions may also explain the weak
cross-sectional correlations between the EDSS and focal lesion load
as seen on MRI. Our data are consistent with the high weight of
motor function in the upper part of the EDSS and the high con-
densation of motor fibres in the spinal cord, although we did not
separate extents of demyelination in different tracts.
Lastly, although the vulnerability of remyelinated areas to active
demyelination was increased in SPMS, the extent of active
‘2nd hit’ demyelination did not correlate with remyelination cap-
acity. Also, the load of active demyelination correlated only weakly
with incomplete remyelination, whereas the load of inactive lesion
correlated more strongly with incomplete remyelination. These
data are in line with animal experiments of remyelination that
led to the so-called Chari–Blakemore hypothesis of temporal mis-
match (Chari and Blakemore, 2002), stating that oligodendrocyte
lineage cells may migrate, differentiate and remyelinate only in
areas with a sufficient drive from inflammatory mediators and
that demyelination of large areas may uncouple remyelinating
cells from these mediators. Smaller brain plaques in PPMS may
allow for cells of the oligodendrocyte lineage to migrate through-
out the plaque during inflammation and to establish remyelination.
The potential importance of inflammation for remyelination to
succeed was also emphasized by showing signs of complete
maturation of remyelinating cells only in active, but not in inactive
plaques (Kuhlmann et al., 2008). The perspective that trans-
planted oligodendrocyte lineage cells also need inflammatory sti-
muli to complete remyelination was recently shown in
dysmyelinated rat spinal cord (Foote and Blakemore, 2005).
However, the increased vulnerability of remyelinated areas to
active demyelination in SPMS could, at least in part, explain
why similar symptoms often develop in consecutive
relapsing-remitting episodes (Deen et al., 2008). Additionally,
many relapses in RRMS/SPMS, although most likely arising from
active demyelination, do not remit fully (Lublin et al., 2003).
Pathologically, this may be reflected in our data by the weak
negative correlation between the load of active demyelination
and permanent remyelination. Others have found evidence that
each bout of active demyelination may lead to acute axonal injury
(Kornek et al., 2000) and evidence for long-lasting axonal injury
whether seen in relapsing-remitting or in progressive multiple
sclerosis (Frischer et al., 2009). Supplementary Fig. 2 may also
reflect a potential loss of conductive tissue from recurrent active
demyelination, even if yet again remyelinated. Thus, we pro-
pose that a first episode of demyelination and remyelination ren-
ders the area vulnerable to new waves of active demyelination
that, even if again remyelinated, may cause stepwise progressive
loss of conductive tissue and function, if occurring in a
non-redundant area.
It is unknown why remyelination predominantly fails in SPMS
compared with PPMS (as shown in this study) and RRMS
(Patrikios et al., 2006). SPMS is distinguished pathologically from
RRMS by the presence of slowly expanding demyelination
(Frischer et al., 2009) and possibly by more rare active demyelin-
ation (Molyneux et al., 2000). Therefore, we investigated whether
slowly expanding and active demyelination showed a predilection
for remyelinated areas over white matter without evidence for
previous de- and remyelination. Our observations indicate that
slowly expanding demyelination may have a predilection for
remyelinated areas in SPMS, but not necessarily in PPMS.
However, slowly expanding ‘2nd hit’ demyelinating frontlines cor-
related with incomplete remyelination in both PPMS and in SPMS,
whereas active ‘2nd hit’ frontlines did not. The load of slowly
expanding demyelination also correlated more strongly with in-
complete remyelination than did the load of active demyelination.
These observations suggest involvement of slowly expanding de-
myelination in remyelination failure and that recurrence of slowly
expanding demyelination could destroy remyelinated areas in an
irreparable manner as opposed to recurrence of active demyelin-
ation. However, in SPMS, high loads of active demyelination may
not be fully repaired as reflected by a weak correlation with in-
complete remyelination. According to the Chari–Blakemore hy-
pothesis, such a negative correlation could arise if the
inflammatory reaction in actively demyelinating areas in SPMS
was not always sufficient to attract and mature remyelinating
cells. This is in line with previous observations of lower densities
of adaptive immune cells in active plaques in progressive multiple
sclerosis as compared with acute/relapsing-remitting disease
(Frischer et al., 2009). Furthermore, the inactive lesion load also
correlated with incomplete remyelination in SPMS, possibly reflect-
ing a limited migration ability of remyelinating cells, but possibly
2996 | Brain 2010: 133; 2983–2998 S. Bramow et al.
Dow
nloaded from https://academ
ic.oup.com/brain/article/133/10/2983/325331 by guest on 22 January 2022

also reflecting accumulated irreparable slowly expanding and
active demyelination. In addition to the abovementioned factors
influencing remyelination capacity, plaques located in the subcor-
tical white matter seem to remyelinate more efficiently than pla-
ques located in the periventricular white matter (Goldschmidt
et al., 2009). However, we did not separate the plaques according
to these locations. Therefore, it remains unknown to what extent
different plaque locations may account for the different remyeli-
nation capacity between PPMS and SPMS.
We found slowly expanding demyelination in amounts that
were comparable in PPMS and SPMS and that correlated with
incomplete remyelination. In turn, incomplete remyelination in
the spinal cord correlated with disease severity. Although not a
direct indication, these observations are consistent with the con-
cept of slowly expanding demyelination as a pathological correlate
of clinically progressive multiple sclerosis (Prineas et al., 2001).
However, active demyelination could additionally determine the
clinical outcome during progressive disease. The presence of
either active or slowly expanding demyelination has previously
been associated with shorter survival as compared with patho-
logically inactive disease (Frischer et al., 2009).
In conclusion, we confirm that the white matter of the brain is
more severely affected in SPMS than in PPMS, but we do not find
pathological suggestions of fundamentally different disease mech-
anisms between patients with PPMS versus SPMS. Rather, our
findings suggest that regulatory and reparative properties could
protect the white matter of the brain in PPMS. Patients with
PPMS could thereby remain spared of symptoms until the spinal
cord is affected. By contrast, remyelinated areas in SPMS are
prone to recurrent active demyelination, possibly explaining the
frequent recurrence of similar symptoms in consecutive
relapsing-remitting episodes. We find that incomplete remyelina-
tion in the spinal cord correlates with more severe disease and that
slowly expanding demyelination may irreparably destroy existing
remyelination in the brain. Together, our data are consistent with
a hypothesis of focal plaque formation by slowly expanding in-
flammatory demyelination as a correlate of clinical progression.
AcknowledgementsFor outstanding technical assistance, the authors wish to thank
Marianne Leisser and Ulrike Kock, Centre for Brain Reseach,
Vienna, Austria and Sara Johansson, Jan Lauritzen and Mette
Hedegaard Moldaschl, Laboratory of Neuropathology,
Rigshospitalet, Copenhagen, Denmark.
For generous academic support, we thank MD Peter Patrikios,
Associate Professor, DMSc, PhD, MD Finn Sellebjerg, PhD, MD
Dan Hesse, MSc, Henrik Dyrbye and PhD in actuarial mathemat-
ics, Peter Holm Nielsen.
FundingFinancially supported by the Danish Multiple Sclerosis Society,
Copenhagen, Denmark, the European Union funded project PL
018637 (Neuropromise), the Multiple Sclerosis International
Federation, London, UK, the Tode Foundation, Copenhagen,
Denmark and the Neurocluster Foundation, Copenhagen,
Denmark, and the United States National Multiple Sclerosis
Society (NMSS RG3184-B-3-02 and RG3185-B-3).
Conflict of interest: Stephan Bramow received support from
Sanofi-Aventis for attending Congresses related to multiple sclero-
sis (ECTRIMS 2008 and AAN 2009). Whithin the last two years,
Per Soelberg Sørensen and Nils Koch-Henriksen received travel
grants, honoraria and/or research grants from: Bayer–Schering,
Biogen–Idec, Biopartners, Genmab, Merck–Serono, and Sanofi–
Aventis.
Supplementary materialSupplementary material is available at Brain online.
ReferencesAgosta F, Absinta M, Sormani MP, Ghezzi A, Bertolotto A, Montanari E,
et al. In vivo assessment of cervical cord damage in MS patients: a
longitudinal diffusion tensor MRI study. Brain 2007; 130: 2211–9.
Bergendal G, Fredrikson S, Almkvist O. Selective decline in information
processing in subgroups of multiple sclerosis: an 8-year longitudinal
study. Eur Neurol 2007; 57: 193–202.
Bjartmar C, Kidd G, Mork S, Rudick R, Trapp BD. Neurological disability
correlates with spinal cord axonal loss and reduced N-acetyl aspartate
in chronic multiple sclerosis patients. Ann Neurol 2000; 48: 893–901.Bramow S, Faber-Rod JC, Jacobsen C, Kutzelnigg A, Patrikios P,
Sorensen PS, et al. Fatal neurogenic pulmonary edema in a patient
with progressive multiple sclerosis. Mult Scler 2008; 14: 711–15.
Bruck W, Kuhlmann T, Stadelmann C. Remyelination in multiple sclerosis.
J Neurol Sci 2003; 206: 181–5.Charcot JM. Lectures on Diseases of the Nervous System. London: New
Sydenham Society; 1877.Chari DM, Blakemore W. New insights into remyelination failure in mul-
tiple sclerosis: implications for glial cell transplantation. Mult Scler
2002; 8: 271–7.
Comi G, Filippi M, Martinelli V, Campi A, Rodegher M, Alberoni M,
et al. Brain Mri Correlates of Cognitive Impairment in Primary and
Secondary Progressive Multiple-Sclerosis. J Neurol Sci 1995; 132:
222–7.
Confavreux C, Vukusic S. Natural history of multiple sclerosis: a unifying
concept. Brain 2006; 129: 606–16.Deen S, Bacchetti P, High A, Waubant E. Predictors of the location of
multiple sclerosis relapse. J Neurol Neurosurg Psychiatry 2008; 79:
1190–3.
DeLuca GC, Ebers GC, Esiri MM. Axonal loss in multiple sclerosis: a
pathological survey of the corticospinal and sensory tracts. Brain
2004; 127: 1009–18.
DeLuca GC, Williams K, Evangelou N, Ebers GC, Esiri MM. The contri-
bution of demyelination to axonal loss in multiple sclerosis. Brain 2006;
129: 1507–16.Evangelou N, Konz D, Esiri MM, Smith S, Palace J, Matthews PM.
Size-selective neuronal changes in the anterior optic pathways suggest
a differential susceptibility to injury in multiple sclerosis. Brain 2001;
124: 1813–20.Field A. Regression. In: Field A, Breakwell G, Leeuw J, de
O’Muircheartaigh C, Saris W, Schuman H, et al. editors. Discovering
statistics using SPSS. London: SAGE Publications Ltd; 2005.
p. 143–217.Foote AK, Blakemore WF. Inflammation stimulates remyelination in areas
of chronic demyelination. Brain 2005; 128: 528–39.
Demyelination versus remyelination in multiple sclerosis Brain 2010: 133; 2983–2998 | 2997
Dow
nloaded from https://academ
ic.oup.com/brain/article/133/10/2983/325331 by guest on 22 January 2022
Frischer JM, Bramow S, Dal-Bianco A, Lucchinetti CF, Rauschka H,Schmidbauer M, et al. The relation between inflammation and neuro-
degeneration in multiple sclerosis brains. Brain 2009; 132: 1175–89.
Goldschmidt T, Antel J, Konig FB, Bruck W, Kuhlmann T. Remyelination
capacity of the MS brain decreases with disease chronicity. Neurology2009; 72: 1914–21.
Hillert J, Gronning M, Nyland H, Link H, Olerup O. An immunogenetic
heterogeneity in multiple-sclerosis. J Neurol, Neurosurgery, Psychiatry
1992; 55: 887–90.Huijbregts SCJ, Kalkers NF, de Sonneville LMJ, de Groot V, Reuling IEW,
Polman CH. Differences in cognitive impairment of relapsing remitting,
secondary, and primary progressive MS. Neurology 2004; 63: 335–9.Irvine KA, Blakemore WF. Remyelination protects axons from demyeli-
nation-associated axon degeneration. Brain 2008; 131: 1464–77.
Juhler M, Barry DI, Offner H, Konat G, Klinken L, Paulson OB.
Blood-brain and blood-spinal cord barrier permeability during thecourse of experimental allergic encephalomyelitis in the rat. Brain
Res 1984; 302: 347–55.
Kornek B, Storch MK, Weissert R, Wallstroem E, Stefferl A, Olsson T,
et al. Multiple sclerosis and chronic autoimmune encephalomyelitis - Acomparative quantitative study of axonal injury in active, inactive, and
remyelinated lesions. Am J Pathol 2000; 157: 267–76.
Kuhlmann T, Miron V, Cuo Q, Wegner C, Antel J, Bruck W.
Differentiation block of oligodendroglial progenitor cells as a causefor remyelination failure in chronic multiple sclerosis. Brain 2008;
131: 1749–58.
Kurtzke JF. Rating neurologic impairment in multiple-sclerosis - AnExpanded Disability Status Scale (Edss). Neurology 1983; 33: 1444–52.
Kutzelnigg A, Lucchinetti CF, Stadelmann C, Bruck W, Rauschka H,
Bergmann M, et al. Cortical demyelination and diffuse white matter
injury in multiple sclerosis. Brain 2005; 128: 2705–12.Lublin FD, Baier M, Cutter G. Effect of relapses on development of
residual deficit in multiple sclerosis. Neurology 2003; 61: 1528–32.
Lublin FD, Reingold SC. Defining the clinical course of multiple sclerosis:
results of an international survey. Neurology 1996; 46: 907–11.Marburg O. Die sogenannte “acute multiple sklerose”. Jahrb f Psych
1906; 27: 211–312.
Miller DH, Leary SM. Primary-progressive multiple sclerosis. LancetNeurol 2007; 6: 903–12.
Molyneux PD, Kappos L, Polman C, Pozzilli C, Barkhof F, Filippi M, et al.
The effect of interferon beta-1b treatment on MRI measures of cere-
bral atrophy in secondary progressive multiple sclerosis. Brain 2000;123: 2256–63.
Monson NL, Cravens PD, Frohman EM, Hawker K, Racke MK. Effect of
rituximab on the peripheral blood and cerebrospinal fluid B cells in
patients with primary progressive multiple sclerosis. Arch.Neurol2005; 62: 258–64.
Montalban X. Overview of European pilot study of interferon beta-1b in
primary progressive multiple sclerosis. Mult Scler 2004; 10: S62.
Nijeholt GJ, van Walderveen MA, Castelijns JA, van Waesberghe JH,Polman C, Scheltens P, et al. Brain and spinal cord abnormalities in
multiple sclerosis. Correlation between MRI parameters, clinical sub-
types and symptoms. Brain 1998; 121: 687–97.
Olerup O, Hillert J, Fredrikson S, Olsson T, Kamhansen S, Moller E, et al.Primarily chronic progressive and relapsing remitting multiple-sclerosis
2 immunogenetically distinct disease entities. Proc Natl Acad Sci USA
1989; 86: 7113–17.
Patrikios P, Stadelmann C, Kutzelnigg A, Rauschka H, Schmidbauer M,Laursen H, et al. Remyelination is extensive in a subset of multiple
sclerosis patients. Brain 2006; 129: 3165–72.
Prineas JW, Barnard RO, Revesz T, Kwon EE, Sharer L, Cho ES.Multiple-Sclerosis - Pathology of Recurrent Lesions. Brain 1993; 116:
681–93.
Prineas JW, Connell F. Remyelination in multiple-sclerosis. Ann Neurol
1979; 5: 22–31.Prineas JW, Kwon EE, Cho ES, Sharer LR, Barnett MH, Oleszak EL, et al.
Immunopathology of secondary-progressive multiple sclerosis. Ann
Neurol 2001; 50: 646–57.
Revesz T, Kidd D, Thompson AJ, Barnard RO, Mcdonald WI. AComparison of the Pathology of Primary and Secondary Progressive
Multiple-Sclerosis. Brain 1994; 117: 759–65.
Roxburgh RHSR, Seaman SR, Masterman T, Hensiek AE, Sawcer SJ,
Vukusic S, et al. Multiple sclerosis severity score - Using disabilityand disease duration to rate disease severity. Neurology 2005; 64:
1144–51.
Sellebjerg F, Bornsen L, Khademi M, Krakauer M, Olsson T,Frederiksen JL, et al. Increased cerebrospinal fluid concentrations
of the chemokine CXCL13 in active MS. Neurology 2009; 73:
2003–10.
Silwedel C, Forster C. Differential susceptibility of cerebral and cerebellarmurine brain microvascular endothelial cells to loss of barrier properties
in response to inflammatory stimuli. J Neuroimmunol 2006; 179:
37–45.
Smith KJ, Blakemore WF, Mcdonald WI. Central remyelination restoressecure conduction. Nature 1979; 280: 395–6.
Stevenson VL, Leary SM, Losseff NA, Parker GJM, Barker GJ, Husmani Y,
et al. Spinal cord atrophy and disability in MS - A longitudinal study.Neurology 1998; 51: 234–8.
Stevenson VL, Miller DH, Rovaris M, Barkhof F, Brochet B, Dousset V,
et al. Primary and transitional progressive MS - A clinical and MRI
cross-sectional study. Neurology 1999; 52: 839–45.Suwansrinon K, Rodriguez M, Bieber A. Genetic determinants of CNS
repair following chronic demyelination in mice. Mult Scler 2009; 15:
S23.
Tallantyre EC, Bo L, Al-Rawashdeh O, Owens T, Polman CH, Lowe J,et al. Greater loss of axons in primary progressive multiple sclerosis
plaques compared to secondary progressive disease. Brain 2009; 132:
1190–9.
2998 | Brain 2010: 133; 2983–2998 S. Bramow et al.
Dow
nloaded from https://academ
ic.oup.com/brain/article/133/10/2983/325331 by guest on 22 January 2022