demographics report 2007
TRANSCRIPT

Demographic Reports 2007 County of Fairfax, Virginia Department of Systems Management for Human Services
Fairfax County Board of SupervisorsGerald E. Connolly
Chairman
Sharon BulovaBraddock District
John W. FoustDranesville District
Catherine M. HudginsHunter Mill District
Jeffrey C. McKayLee District
Penelope A. GrossMason District
Gerald W. HylandMount Vernon District
Linda Q. SmythProvidence District
Pat HerritySpringfield District
Michael R. FreySully District
Anthony H. GriffinCounty Executive
Kenneth P. Disselkoen, DirectorDepartment of Systems Management
for Human Services
Department of Systems Management for Human ServicesAnne Pickford Cahill
Fatima KhajaMaggie Scott
Demographic Reports 2007

DEMOGRAPHIC REPORTS©
2007
Prepared by:
Fairfax CountyDepartment of Systems Management for Human Services
Visit us at http://www.fairfaxcounty.gov/aboutfairfax


i
TABLE OF CONTENTS
Page Foreword ....................................................................................................... iv Notes..............................................................................................................v I. MAPS Map Notes................................................................................................... I-1 Figure 1.1. Supervisor Districts .................................................................. I-2 Figure 1.2. Towns....................................................................................... I-3 Figure 1.3. Planning Districts ..................................................................... I-4 Figure 1.4. Human Services Regions......................................................... I-5 Figure 1.5. Sewersheds ............................................................................. I-6 Figure 1.6. Census Tracts .......................................................................... I-7 Figure 1.7. Census Tracts and Block Groups............................................. I-8 Table 1.1. Fairfax County Sewershed Codes............................................. I-9 II. DEMOGRAPHIC PROFILE Demographic Trend Notes ......................................................................... II-1 Table 2.1. Estimates and Forecasts of Population, Housing Units and Households, Fairfax County, 1970 through 2030 ...................................................... II-2 Figure 2.1. Historical, Estimated and Forecast Population, Housing Units and Households, Fairfax County, 1970 through 2025 ...................................................... II-3 Table 2.2. Population Age Distribution, Fairfax County, 1970 through 2007 ............................................................................... II-4 Table 2.3. Projected Population Age Distribution, Fairfax County, 2005 through 2025 ...................................................... II-5 Table 2.4. Population of Towns, Fairfax County, 1984 through 2007 ............................................................................... II-6 Table 2.5. Racial and Ethnic Population Distribution,
Fairfax County, 1990, 2000 and 2007 .................................................. II-6 Table 2.6. Average Household Size by Race Fairfax County, 1990, 2000 and 2007 .................................................. II-6 Table 2.7. Household and Family Income Distribution,
Fairfax County, 2007 ............................................................................ II-7 Table 2.8. Estimates of Median Household Income and Median Family Income, Fairfax County, 1979 through 2007 ............................................................................... II-7 Table 2.9. Estimates and Forecasts of Housing Units
by Type of Structure, Fairfax County, 1950 through 2025 .................... II-8 Figure 2.2. Historical and Forecast Housing Units by Type of Structure, Fairfax County, 1970 through 2020 .................... II-9 Table 2.10. Rental Housing Complexes: Total Units, Vacancy Rate and Average Monthly Rent,
Fairfax County, 1980 through 2006 .................................................... II-10
Page Table 2.11. Estimated Median Market Value, Owned Housing Units, Fairfax County, 1979 through 2007 ................II-10 Table 2.12. 2000 and 2007 Population, Median Household Income and
Median Family Income by Selected Jurisdictions in the Washington DC Metropolitan Area, State of Virginia and the United States ...........II-11 Figure 2.3. Average Annual Unemployment Rate and Total Employment, Fairfax County, 1995 through 2007 ......................II-12 III. CURRENT POPULATION Current Population ................................................................................... III-1 Table 3.1. Average Household Size and Vacancy Rate by Planning District, Fairfax County, January 2007............................. III-2 Figure 3.1. Average Persons per Household, Fairfax County,
U.S. South Region and U.S., 1967 through 2007................................ III-3 Table 3.2. Special Institutional (Group Quarters) Population, Fairfax County, 1985 through 2007..................................................... III-4 Figure 3.2. Population Density by Census Block Group, Fairfax County, January 2007 ............................................................. III-5 Table 3.3. 2007 Population, Housing Units and Households by Supervisor District, Fairfax County, January 2007.......................... III-6 Table 3.4. 2007 Population, Housing Units and Households by Town, Fairfax County, January 2007.............................................. III-6 Table 3.5. 2007 Population, Housing Units and Households by Planning District, Fairfax County, January 2007............................. III-7 Table 3.6. 2007 Population, Housing Units and Households by Human Services Region, Fairfax County, January 2007 ............... III-8 Table 3.7. 2007 Population, Housing Units and Households by Zip Code, Fairfax County, January 2007............................................. III-9 Table 3.8. 2007 Population, Housing Units and Households by Sewershed, Fairfax County, January 2007...................................III-11 Table 3.9. 2007 Population, Housing Units and Households by Census Tract and Block Groups, Fairfax County, January 2007 .....................................................................................III-14 IV. POPULATION FORECASTS Population Forecasts ................................................................................ IV-1 Figure 4.1. Year 2030 Forecast Population Density by Census Block Group, Fairfax County, January 2007...................... IV-2 Figure 4.2. 2007 to 2030 Forecast Population Growth by Census Block Group, Fairfax County, January 2007...................... IV-3 Table 4.1. Historical, Estimated and Forecasted Population by Supervisor District, Fairfax County, January 2007.......................... IV-4 Table 4.2. Historical, Estimated and Forecasted Population by Town, Fairfax County, January 2007.............................................. IV-4 Table 4.3. Historical, Estimated and Forecasted Population by Planning District, Fairfax County, January 2007............................. IV-5
ii
Table of Contents (continued) Page
Table 4.4. Estimated and Forecasted Population by Human Services Region, Fairfax County, January 2007 ................ IV-6 Table 4.5. Estimated and Forecasted Population By Zip Code, Fairfax County, January 2007........................................ IV-7 Table 4.6. Estimated and Forecasted Population by Sewershed, Fairfax County, January 2007..................................... IV-9 Table 4.7. Historical, Estimated and Forecasted Population by Census Tract and Block Groups, Fairfax County, January 2007 ....... IV-12 V. FORECAST HOUSEHOLDS Forecast Households .................................................................................V-1 Table 5.1. Estimated and Forecasted Number of Households by Supervisor District, Fairfax County, January 2007................................V-2 Table 5.2. Estimated and Forecasted Number of Households by Town, Fairfax County, January 2007...............................................................V-2 Table 5.3. Estimated and Forecasted Number of Households by Planning District, Fairfax County, January 2007...................................V-3 Table 5.4. Estimated and Forecasted Number of Households by Human Services Region, Fairfax County, January 2007 ......................V-4 Table 5.5. Estimated and Forecasted Number of Households by Zip Code, Fairfax County, January 2007 ..............................................V-5 Table 5.6. Estimated and Forecasted Number of Households by Census Tract and Block Groups, Fairfax County, January 2007 ..........V-7 VI. HOUSING UNIT INVENTORY Housing Unit Inventory ..............................................................................VI-1 Figure 6.1. Housing Units by Structure Type, Fairfax County, 1960 through 2007 .....................................................VI-2 Figure 6.2. Percent Single Family Detached Housing Units
by Census Block Group, Fairfax County, January 2007 ......................VI-3 Figure 6.3. Percent Single Family Attached Housing Units by Census Block Group, Fairfax County, January 2007...........................VI-4 Figure 6.4. Percent Multifamily Housing Units
by Census Block Group, Fairfax County, January 2007 ......................VI-5 Table 6.1. Housing Unit Inventory by Unit Type by Supervisor District, Fairfax County, January 2007...............................VI-6 Table 6.2. Housing Unit Inventory by Unit Type by Town, Fairfax County, January 2007..............................................................VI-6 Table 6.3. Housing Unit Inventory by Unit Type by Planning District, Fairfax County, January 2007..................................VI-7 Table 6.4. Housing Unit Inventory by Unit Type by Human Services Region, Fairfax County, January 2007 .....................VI-8 Table 6.5. Housing Unit Inventory by Unit Type by Zip Code, Fairfax County, January 2007 ........................................VI-9
Page
Table 6.6. Housing Unit Inventory by Unit Type by Sewershed, Fairfax County, January 2007 ....................................... VI-11 Table 6.7 Housing Unit Inventory by Unit Type by Census Tract and Block Group, Fairfax County, January 2007 ........ VI-14 Table 6.8. Housing Unit Inventory by Year Built and Supervisor District, Fairfax County, January 2007 ............................ VI-41 Table 6.9. Housing Unit Inventory by Year Built and Town Fairfax County, January 2007 ........................................................... VI-41 Table 6.10. Housing Unit Inventory by Year Built and Planning District, Fairfax County, January 2007 ............................... VI-42 VII. HOUSING UNIT FORECASTS Housing Unit Forecasts............................................................................ VII-1 Table 7.1. Forecast Housing Unit Change by Supervisor District Fairfax County, 2007 through 2030.................................................... VII-2 Table 7.2. Forecast Housing Unit Change by Planning District
Fairfax County, 2007 through 2030.................................................... VII-2 Table 7.3. Estimated and Forecasted Housing Units by Supervisor District, Fairfax County, January 2007......................... VII-3 Table 7.4. Estimated and Forecasted Housing Units by Town,
Fairfax County, January 2007 ............................................................ VII-3 Table 7.5. Historical, Estimated and Forecasted Housing Units
by Planning District, Fairfax County, January 2007............................ VII-4 Table 7.6. Estimated and Forecasted Housing Units
by Human Services Region, Fairfax County, January 2007 ............... VII-5 Table 7.7. Forecasted Housing Units by Zip Code, Fairfax County, January 2007 ............................................................ VII-6 Table 7.8. Estimated and Forecasted Housing Units by Census Tracts and Block Groups, Fairfax County, January 2007 ................... VII-8 VIII. MARKET VALUE Market Value........................................................................................... VIII-1 Figure 8.1. Median Market Value of Owned Housing Units by Census Tract, Fairfax County, January 2007 .................................... VIII-2 Table 8.1. Median Market Value of Owned Housing Units by Supervisor District, Fairfax County, 2006 and 2007 ..................... VIII-3 Table 8.2. Median Market Value of Owned Housing Units by
Planning District, Fairfax County, 2006 and 2007 ............................. VIII-3 Table 8.3. Estimated Median and Average Market Values,
Owned Housing Units by Unit Type and Supervisor District, Fairfax County, January 2007 ........................................................... VIII-4
Table 8.4. Estimated Median and Average Market Values, Owned Housing Units by Unit Type and Planning District, Fairfax County, January 2007 ........................................................... VIII-5
Table 8.5. Estimated Median and Average Market Values Owned Housing Units by Unit Type and Human Services Region, Fairfax County, January 2007 ............................................................ VII-6
iii
Table of Contents (continued) Page
Table 8.6. Estimated Median and Average Market Values Owned Housing Units by Unit Type and Census Tract,
Fairfax County, January 2007............................................................VIII-7 Table 8.7. Market Value of Owned Housing Units by Unit Type by Supervisor District, Fairfax County, January 2007......................VIII-14 Table 8.8. Market Value of Owned Housing Units by Unit Type by Planning District, Fairfax County, January 2007 .........................VIII-16 Table 8.9. Market Value of Owned Housing Units by Unit Type by Human Services Region, Fairfax County, January 2007 ............. VIII19 IX. RESIDENTIAL DEVELOPMENT ACTIVITY Residential Development Activity .............................................................. IX-1 Figure 9.1. Residential Development Activity, Fairfax County, January 2007.............................................................. IX-2 Table 9.1. Residential Development Activity by Stage of Development
by Supervisor District, Fairfax County, January 2007.......................... IX-3 Table 9.2. Residential Development Activity by Stage of Development
by Town, Fairfax County, January 2007 .............................................. IX-4 Table 9.3. Residential Development Activity by Stage of Development by Planning District, Fairfax County, January 2007 ............................. IX-5 Table 9.4. Residential Development Activity by Stage of Development by Human Services Region, Fairfax County, January 2007 ................ IX-7 Table 9.5. Residential Development Activity by Stage of Development by Census Tract and Block Group, Fairfax County, January 2007 ...... IX-8 X. INDUSTRIAL AND COMMERCIAL GROSS FLOOR AREA Industrial and Commercial Gross Floor Area .............................................X-1 Figure 10.1. Industrial and Commercial Gross Floor Area
Inventory by Year Built, Fairfax County, January 2007.........................X-2 Table 10.1. Industrial and Commercial Gross Floor Area by General Activity, Inventory of Existing Structures by Year Built, Fairfax County, January 2007 ..............................................................X-3 Table 10.2. Industrial and Commercial Gross Floor Area by General Activity by Supervisor District, Fairfax County, January 2007 ..............X-4 Table 10.3. Industrial and Commercial Gross Floor Area by General Activity by Town, Fairfax County, January 2007...................................X-4 Table 10.4. Industrial and Commercial Gross Floor Area by General Activity by Planning District, Fairfax County, January 2007..................X-5 Table 10.5. Industrial and Commercial Gross Floor Area by General Activity by Human Services Region, Fairfax County, January 2007 .....X-6 Table 10.6. Industrial and Commercial Gross Floor Area by General Activity by Sewershed, Fairfax County, January 2007..........................X-7 Table 10.7. Industrial and Commercial Gross Floor Area by General Activity by Census Tract, and Block Group, Fairfax County, January 2007.............................................................X-10

iv
The Demographic Reports is a compilation of population, housing, housing market value, and industrial and commercial gross floor area information. Specifically, within the Demographic Reports are tables showing the following: population estimates and densities, the county's dwelling unit inventory by type of unit; ranges of estimated market values of houses in the county, and industrial and commercial gross floor area. Various geographic arrangements are used to present the data, such as supervisor districts, planning districts, sewersheds, human service regions, and census tracts/census block groups. Also, most of the sections of the Demographic Reports consist of methodologies, tables and maps. All information, except the historical data, is as of January 1 of the given year. The Demographic Reports is the primary publication associated with the Integrated Parcel Lifecycle System (IPLS). While the Demographic Reports summarizes and aggregates much of the information in IPLS, additional electronic reports exist that contain detailed information. There are reports that list each rental apartment complex, existing residential condominium projects, office building listings with gross floor area information, and listings of wholesale and warehouse storage facilities.
Tabular data presented in the Demographic Reports is available electronically at
http://www.fairfaxcounty.gov/aboutfairfax. Inquiries concerning the Demographic Reports should be directed to:
The Department of Systems Management for Human Services
12011 Government Center Parkway Suite 222
Fairfax, Virginia 22035
Email: [email protected]
FOREWORD
v
NOTES
The population and housing unit estimate, market value analysis, and the industrial and commercial gross floor area summaries for Fairfax County are produced by the Research, Analysis and Project Services Group of the Fairfax County Department of Systems Management for Human Services, using the Integrated Parcel Lifecycle System (IPLS). All information produced reflects estimates as of January 1 of each year. Periodically, Fairfax County provides data to Metropolitan Washington Council of Governments (MWCOG) along with other jurisdictions for the purpose of transportation planning, air quality modeling and other programs of regional significance.
MAP NOTES
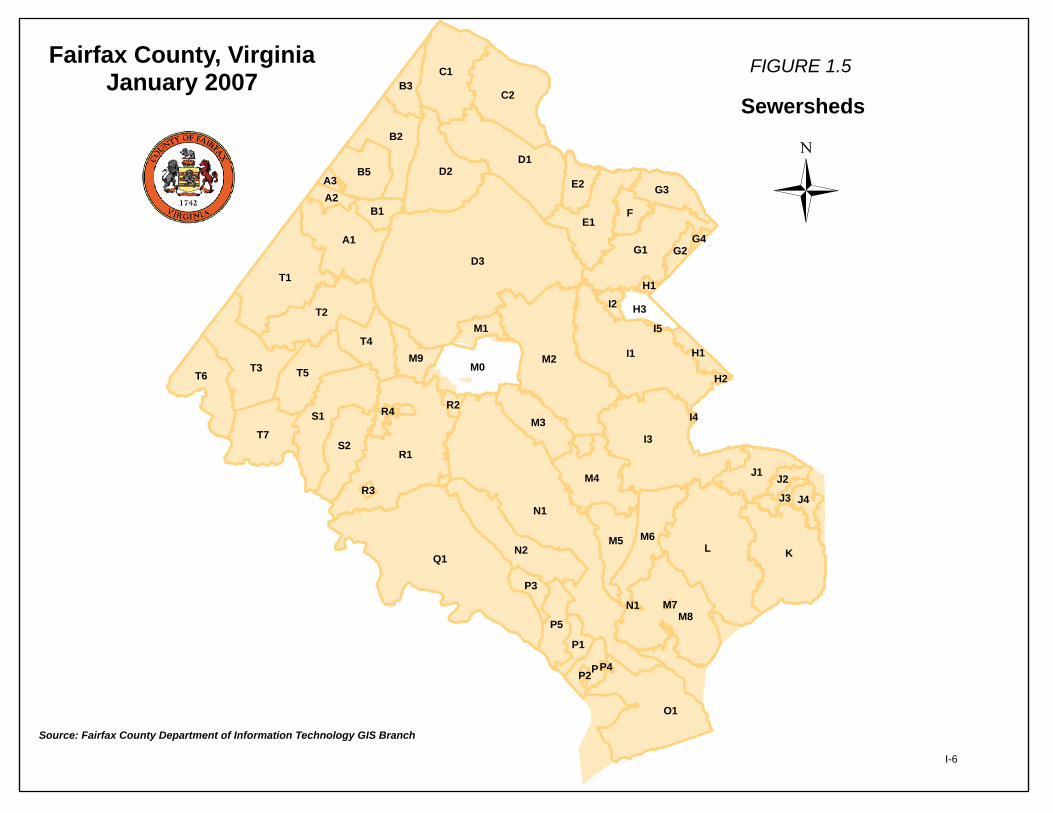
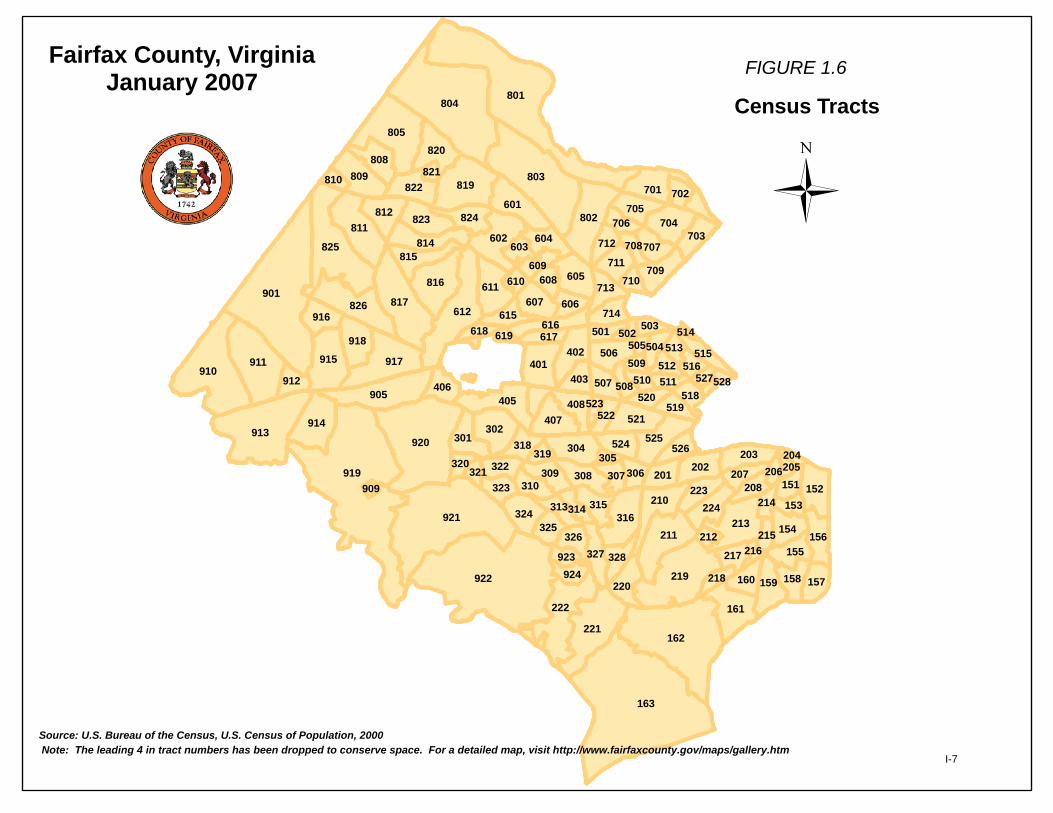
The information contained in the Demographic Reports is presented in a variety of geographic arrangements -- supervisor district, town, planning district, human services region, sanitary sewershed, census tract and census block group. A small scale map of these geographies, along with sewershed codes, are displayed on the following pages. Detailed views of these geographies can be obtained from the Fairfax County Web site map gallery at: http://www.fairfaxcounty.gov/maps/gallery.htm.
I-1
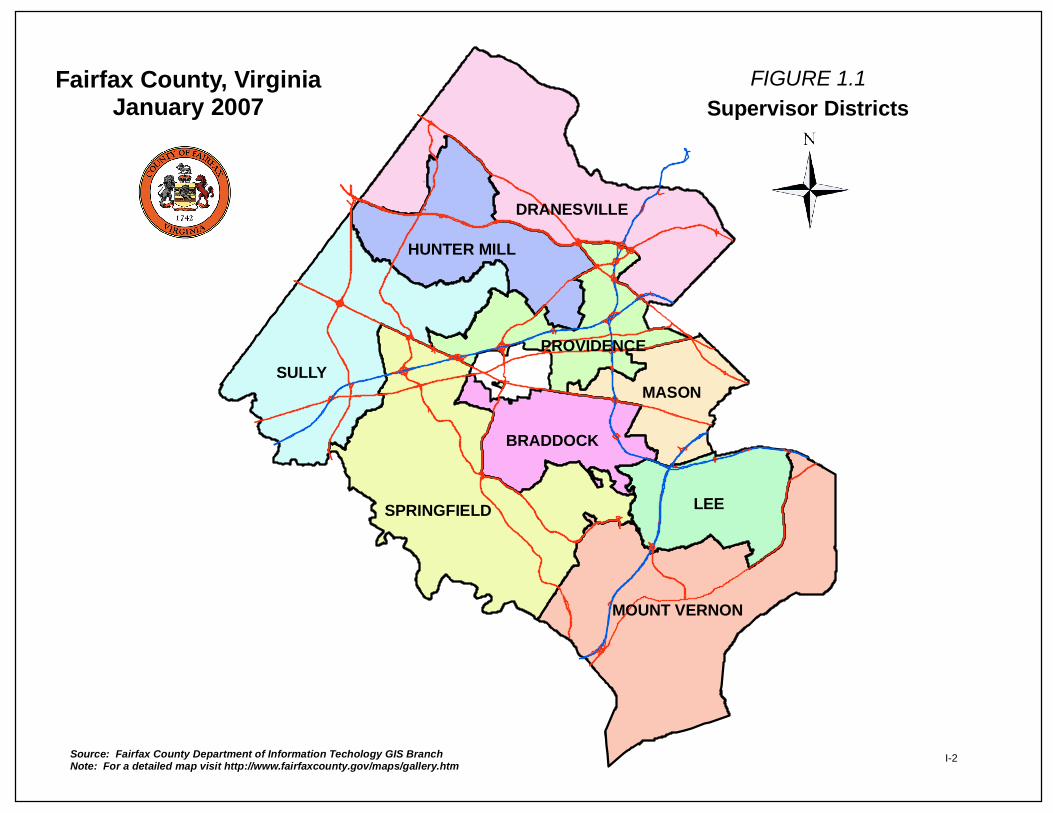
Source: Fairfax County Department of Information Techology GIS BranchNote: For a detailed map visit http://www.fairfaxcounty.gov/maps/gallery.htm
DRANESVILLE
HUNTER MILL
SULLY
SPRINGFIELD
PROVIDENCE
BRADDOCK
MASON
LEE
MOUNT VERNON
Fairfax County, VirginiaJanuary 2007
FIGURE 1.1Supervisor Districts
I-2

VIENNA
HERNDON
CLIFTON
Fairfax County, VirginiaJanuary 2007
Source: Fairfax County Department of Information Technology GIS Branch
−
FIGURE 1.2
Towns
Note: For a detailed map, visit http://www.fairfaxcounty.gov/maps/gallery.htmI-3
Pohick
Bull Run
Upper Potomac
McLean
Fairfax
Lower Potomac
Vienna
Annandale
Mount Vernon
Rose HillSpringfield
Jefferson
Baileys
Lincolnia
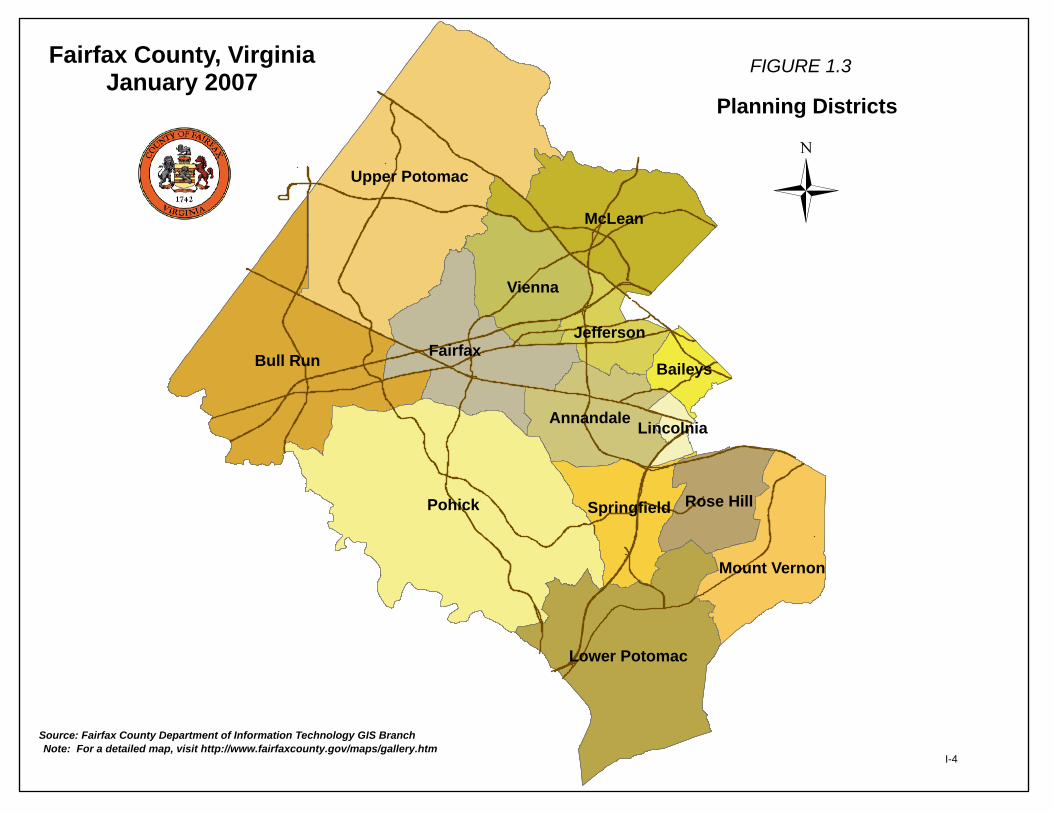
Fairfax County, VirginiaJanuary 2007
Source: Fairfax County Department of Information Technology GIS Branch
−
FIGURE 1.3
Planning Districts
Note: For a detailed map, visit http://www.fairfaxcounty.gov/maps/gallery.htmI-4
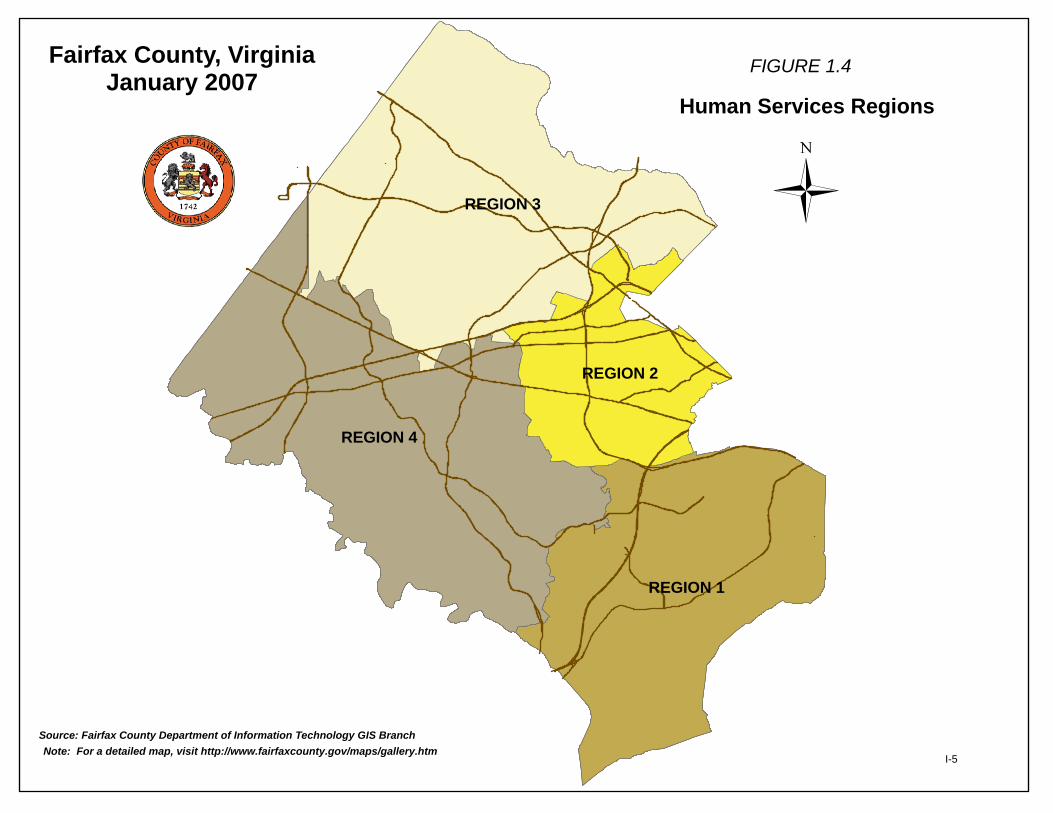
REGION 4
REGION 3
REGION 1
REGION 2
Fairfax County, VirginiaJanuary 2007
Source: Fairfax County Department of Information Technology GIS Branch
−
FIGURE 1.4
Human Services Regions
Note: For a detailed map, visit http://www.fairfaxcounty.gov/maps/gallery.htmI-5
D3
L
N1
Q1
I3
I1
K
R1
M2
O1
T1
D1
M8
T3
C2
G1
D2
S1
T2
N2
C1
A1E1
M0
T7
T6 T5
M4
B2
S2
M6
T4
M3
J1
B5
P
F
M5
P5
G3
B3
E2
M9
H3
B1
P1
P3
M1
J4
J2
I2
A2
H1
J3
G2
R4 R2
A3
H1
G4
R3
I5
P2
N1
H2
P4
I4
M7
Fairfax County, VirginiaJanuary 2007
Source: Fairfax County Department of Information Technology GIS Branch
−
FIGURE 1.5
Sewersheds
I-6
163
919
922
801
901
921
804
162
920
803
913
910
825
219
221
612
911
817
805
222
905
819
917
802
826
811
211
816
915
213
602
701
914
405
316
161
611
601
408
302
210
401
809
525
820
304
814
605
521
704
918402
152
407
823812
822
159
815
324
808
506
203202
607
224
301
308
709
220
824
156
705
916
604
154
711
155
309
158
524
315223
201
157
713
406
707
318
160
714
507
322
403
325326
310323
217
519
912
606
208306
924
151
617
702
153
501616
327
703
328
615
515
526
207
313
712
609
307
504
706
608
518520522
603
923
314
512 516
508
618
708
511
218
710
214
320
215
513
503
610
510
319321
509
810
212
206
502
527528
523
205
216
305
505
204
821
619
909
514
Fairfax County, VirginiaJanuary 2007
Source: U.S. Bureau of the Census, U.S. Census of Population, 2000
−
FIGURE 1.6
Census Tracts
Note: The leading 4 in tract numbers has been dropped to conserve space. For a detailed map, visit http://www.fairfaxcounty.gov/maps/gallery.htmI-7

1
1
1
1
2
2
1
1
1
6
1
1
1
1
2
2
1
3
4
8
2
2
2
3
1
2
3
5
5
5
2
2
4
3
1
4
32
2
2
3
2
1
1
1
11
1
61
3
2
4
4
4
1
2
6
1
2
1
3
3
4
2
1
23
2
2
5
3
3
2
2
2
3
1
3
1
1
1
3
4
4
2
3
1
1
2
4
1
4
1
1
1
2
1
1
1
1
1
2
1
1
5
2
1
2
1
2
4
2
1
6
3
3
2
2
6
2
1
1
1
1
3
5
1
4
3
1
2
2
4
23
3
2
7
1
2
2
3
2
1
1
2
43
3
1
2
5
2
3
1
1
1
5
3
3
2
1
8
21
2
4
2
1
4
6
1
1
2
3
2
2
2
1
5
2
2
2
1
1
1
1
4
7
1
4
1
8
3
1
1
2
1
3
3
2
5
3
3
1
3
41 3
5
1
4
3
1
1
1
2 2
6
34
1
1
2
1
6
2
1
2
4
1
2
4
4
5
1
2
2
2
1
2
3 4
3
1
4
5
2
2
2
1
3
5
3
1
6
4
2
31
1
2
1
3
2
1
7
3
2
3
4
1
5
1
41
1
32
3
3
1
1
2
2
2
2
2
2
3
3
1
2
2
4
3
4
2
5
4
6
1
2
1
3
4
2
1
2
3
3
3
1
1 2
3
6
2
3
2
1
2
2
5
2
1
2
21
3
1
3
2
1
13
23
2
2
1
3
2
1
1
4
3
2
2
3
12
4
3
2
211
1
2
3
4
1
1
3
11
1
1
4
3
1
2
2
3
1
1
2
3
2
1
5
3
2
4
7
9
5
4
1
5
1
3
7
4
4
1
5
5
1
2
4
3
2
51
2
1
4
2
24
1
3
4
4
1
1
1
3
4
3
5
2
5
2
5
2
31
3
5
7
2
1
6
2
1
2
2
1
3
1
4
4
1
4
3
3
2
3
2
3
2
3
1
1
3
2
2
4
1
1
3
3
2
1
1
3
3
1
1
4
3
1
1
2
2
1
41
2
16
32
2
1
5
4
2
8
6
1 4
2
33
3
3
2
3
51
5
7
4
3
5
1
4
3
3
2
2
1
5
1
2
4
2
1
2
3
34
2
Fairfax County, VirginiaJanuary 2007
Source: U.S. Bureau of the Census, U.S. Census of Population, 2000
−
FIGURE 1.7
Census Tracts and Block Groups
Note: For a detailed map, visit http://www.fairfaxcounty.gov/maps/gallery.htm I-8
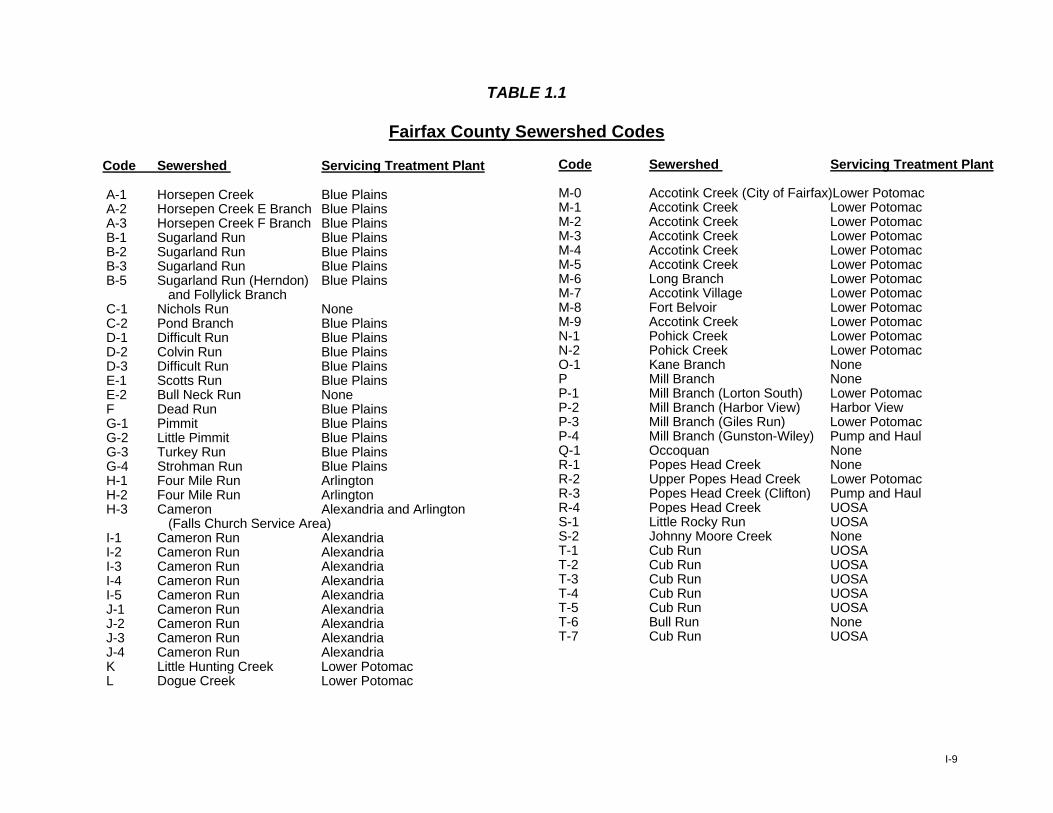
Code Sewershed Servicing Treatment Plant
A-1 Horsepen Creek Blue PlainsA-2 Horsepen Creek E Branch Blue PlainsA-3 Horsepen Creek F Branch Blue PlainsB-1 Sugarland Run Blue PlainsB-2 Sugarland Run Blue PlainsB-3 Sugarland Run Blue PlainsB-5 Sugarland Run (Herndon) Blue Plains
and Follylick BranchC-1 Nichols Run NoneC-2 Pond Branch Blue PlainsD-1 Difficult Run Blue PlainsD-2 Colvin Run Blue PlainsD-3 Difficult Run Blue PlainsE-1 Scotts Run Blue PlainsE-2 Bull Neck Run NoneF Dead Run Blue PlainsG-1 Pimmit Blue PlainsG-2 Little Pimmit Blue PlainsG-3 Turkey Run Blue PlainsG-4 Strohman Run Blue PlainsH-1 Four Mile Run ArlingtonH-2 Four Mile Run ArlingtonH-3 Cameron Alexandria and Arlington
(Falls Church Service Area)I-1 Cameron Run AlexandriaI-2 Cameron Run AlexandriaI-3 Cameron Run AlexandriaI-4 Cameron Run AlexandriaI-5 Cameron Run AlexandriaJ-1 Cameron Run AlexandriaJ-2 Cameron Run AlexandriaJ-3 Cameron Run AlexandriaJ-4 Cameron Run AlexandriaK Little Hunting Creek Lower PotomacL Dogue Creek Lower Potomac
TABLE 1.1
Fairfax County Sewershed Codes
Code Sewershed Servicing Treatment Plant
M-0 Accotink Creek (City of Fairfax)Lower PotomacM-1 Accotink Creek Lower PotomacM-2 Accotink Creek Lower PotomacM-3 Accotink Creek Lower PotomacM-4 Accotink Creek Lower PotomacM-5 Accotink Creek Lower PotomacM-6 Long Branch Lower PotomacM-7 Accotink Village Lower PotomacM-8 Fort Belvoir Lower PotomacM-9 Accotink Creek Lower PotomacN-1 Pohick Creek Lower PotomacN-2 Pohick Creek Lower PotomacO-1 Kane Branch NoneP Mill Branch NoneP-1 Mill Branch (Lorton South) Lower PotomacP-2 Mill Branch (Harbor View) Harbor ViewP-3 Mill Branch (Giles Run) Lower PotomacP-4 Mill Branch (Gunston-Wiley) Pump and HaulQ-1 Occoquan NoneR-1 Popes Head Creek NoneR-2 Upper Popes Head Creek Lower PotomacR-3 Popes Head Creek (Clifton) Pump and HaulR-4 Popes Head Creek UOSAS-1 Little Rocky Run UOSAS-2 Johnny Moore Creek NoneT-1 Cub Run UOSAT-2 Cub Run UOSAT-3 Cub Run UOSAT-4 Cub Run UOSAT-5 Cub Run UOSAT-6 Bull Run NoneT-7 Cub Run UOSA
I-9

DEMOGRAPHIC TRENDS NOTES
The following section provides an overview of the information about Fairfax County. This section presents tables and graphics on the following subjects:
Population, Housing Units and Households Population Age Distribution
Racial and Ethnic Distribution Average Household Size by Race
Measures of Income Housing Units by Type of Structure
Rental Housing Complex Characteristics Market Value of Housing Units
Unemployment Rates and Total Employment Data presented cover historical, current and future time frames. More detailed information about some of these subjects can be found in other sections of the Demographic Reports.
II-1
Total Average Average Annual Housing Average Average Annual
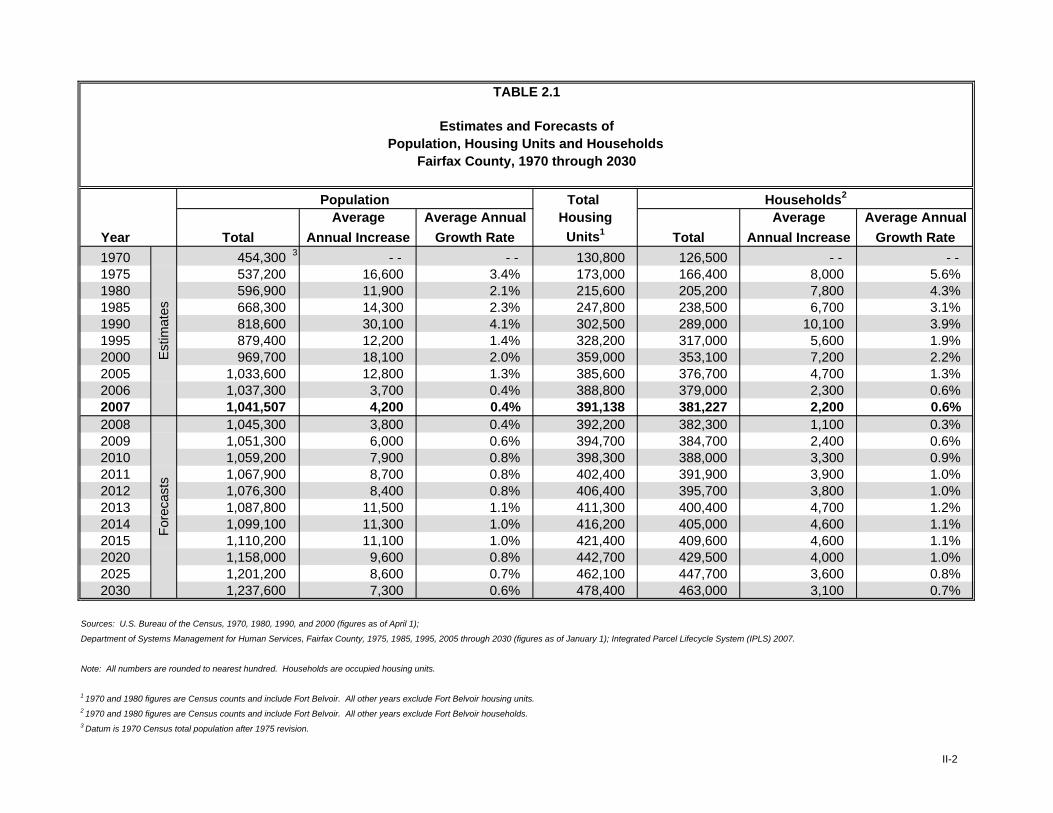
Year Annual Increase Growth Rate Units1 Total Annual Increase Growth Rate1970 454,300 3 - - - - 130,800 126,500 - - - -1975 537,200 16,600 3.4% 173,000 166,400 8,000 5.6%1980 596,900 11,900 2.1% 215,600 205,200 7,800 4.3%1985 668,300 14,300 2.3% 247,800 238,500 6,700 3.1%1990 818,600 30,100 4.1% 302,500 289,000 10,100 3.9%1995 879,400 12,200 1.4% 328,200 317,000 5,600 1.9%2000 969,700 18,100 2.0% 359,000 353,100 7,200 2.2%2005 1,033,600 12,800 1.3% 385,600 376,700 4,700 1.3%2006 1,037,300 3,700 0.4% 388,800 379,000 2,300 0.6%2007 1,041,507 4,200 0.4% 391,138 381,227 2,200 0.6%2008 1,045,300 3,800 0.4% 392,200 382,300 1,100 0.3%2009 1,051,300 6,000 0.6% 394,700 384,700 2,400 0.6%2010 1,059,200 7,900 0.8% 398,300 388,000 3,300 0.9%2011 1,067,900 8,700 0.8% 402,400 391,900 3,900 1.0%2012 1,076,300 8,400 0.8% 406,400 395,700 3,800 1.0%2013 1,087,800 11,500 1.1% 411,300 400,400 4,700 1.2%2014 1,099,100 11,300 1.0% 416,200 405,000 4,600 1.1%2015 1,110,200 11,100 1.0% 421,400 409,600 4,600 1.1%2020 1,158,000 9,600 0.8% 442,700 429,500 4,000 1.0%2025 1,201,200 8,600 0.7% 462,100 447,700 3,600 0.8%2030 1,237,600 7,300 0.6% 478,400 463,000 3,100 0.7%
2 1970 and 1980 figures are Census counts and include Fort Belvoir. All other years exclude Fort Belvoir households.3 Datum is 1970 Census total population after 1975 revision.
Department of Systems Management for Human Services, Fairfax County, 1975, 1985, 1995, 2005 through 2030 (figures as of January 1); Integrated Parcel Lifecycle System (IPLS) 2007.
Note: All numbers are rounded to nearest hundred. Households are occupied housing units.
Sources: U.S. Bureau of the Census, 1970, 1980, 1990, and 2000 (figures as of April 1);
Total
1 1970 and 1980 figures are Census counts and include Fort Belvoir. All other years exclude Fort Belvoir housing units.
Est
imat
esFo
reca
sts
TABLE 2.1
Population, Housing Units and HouseholdsFairfax County, 1970 through 2030
Population Households2
Estimates and Forecasts of
II-2

FIGURE 2.1
Historical, Estimated and Forecast Population, Housing Units and Households
Fairfax County, 1970 through 2025
0
200,000
400,000
600,000
800,000
1,000,000
1,200,000
1,400,000
1970 1975 1980 1985 1990 1995 2000 2005 2007 2010 2015 2020 2025
Population
Housing Units
Households
Sources: U.S. Bureau of the Census, U.S. Censuses of Population and Housing, population, housing units, and households, 1970 and 1980; and population, 1990 and 2000;
Fairfax County Department of Systems Management for Human Services, population, housing units, and households, 1975, 1985, 1995, 2005 through 2025; and housing units and households, 1990 and 2000; 2007 Integrated Parcel Lifecycle System (IPLS).
II-3
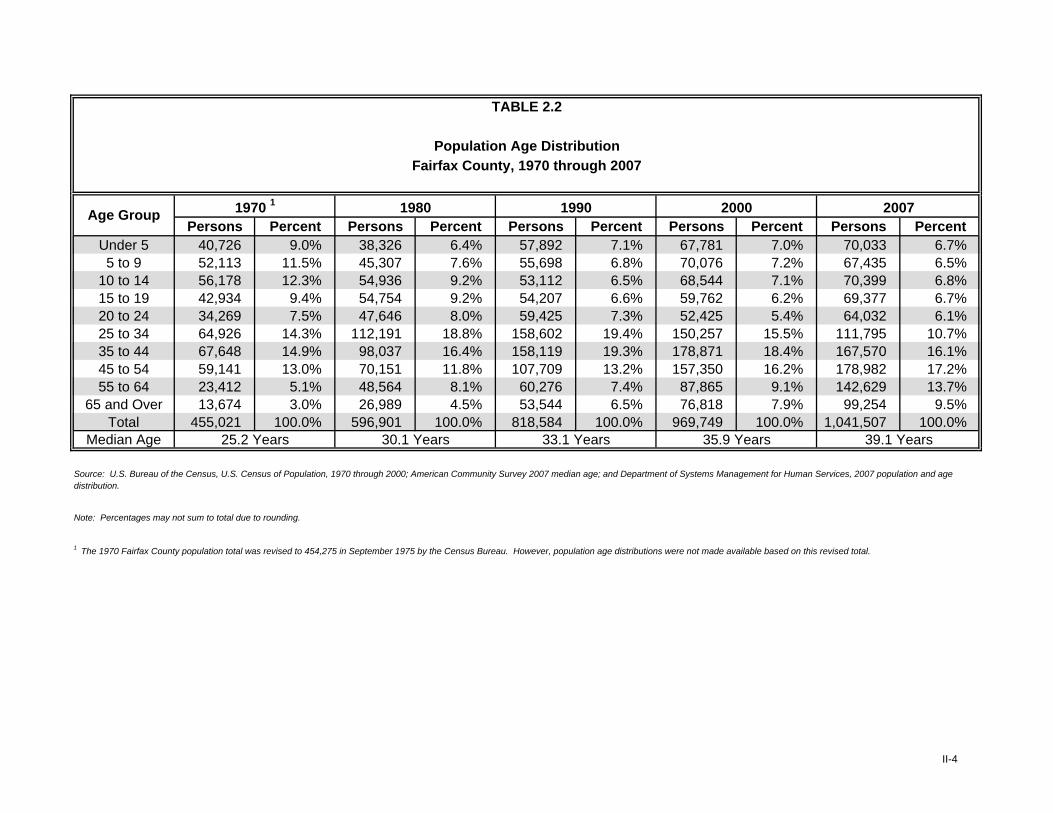
Persons Percent Persons Percent Persons Percent Persons Percent Persons PercentUnder 5 40,726 9.0% 38,326 6.4% 57,892 7.1% 67,781 7.0% 70,033 6.7%5 to 9 52,113 11.5% 45,307 7.6% 55,698 6.8% 70,076 7.2% 67,435 6.5%
10 to 14 56,178 12.3% 54,936 9.2% 53,112 6.5% 68,544 7.1% 70,399 6.8%15 to 19 42,934 9.4% 54,754 9.2% 54,207 6.6% 59,762 6.2% 69,377 6.7%20 to 24 34,269 7.5% 47,646 8.0% 59,425 7.3% 52,425 5.4% 64,032 6.1%25 to 34 64,926 14.3% 112,191 18.8% 158,602 19.4% 150,257 15.5% 111,795 10.7%35 to 44 67,648 14.9% 98,037 16.4% 158,119 19.3% 178,871 18.4% 167,570 16.1%45 to 54 59,141 13.0% 70,151 11.8% 107,709 13.2% 157,350 16.2% 178,982 17.2%55 to 64 23,412 5.1% 48,564 8.1% 60,276 7.4% 87,865 9.1% 142,629 13.7%
65 and Over 13,674 3.0% 26,989 4.5% 53,544 6.5% 76,818 7.9% 99,254 9.5%Total 455,021 100.0% 596,901 100.0% 818,584 100.0% 969,749 100.0% 1,041,507 100.0%
Median Age
Source: U.S. Bureau of the Census, U.S. Census of Population, 1970 through 2000; American Community Survey 2007 median age; and Department of Systems Management for Human Services, 2007 population and age distribution.
Note: Percentages may not sum to total due to rounding.
1970 1 1980 1990 2000 2007
Population Age DistributionFairfax County, 1970 through 2007
Age Group
1 The 1970 Fairfax County population total was revised to 454,275 in September 1975 by the Census Bureau. However, population age distributions were not made available based on this revised total.
TABLE 2.2
25.2 Years 30.1 Years 33.1 Years 35.9 Years 39.1 Years
II-4
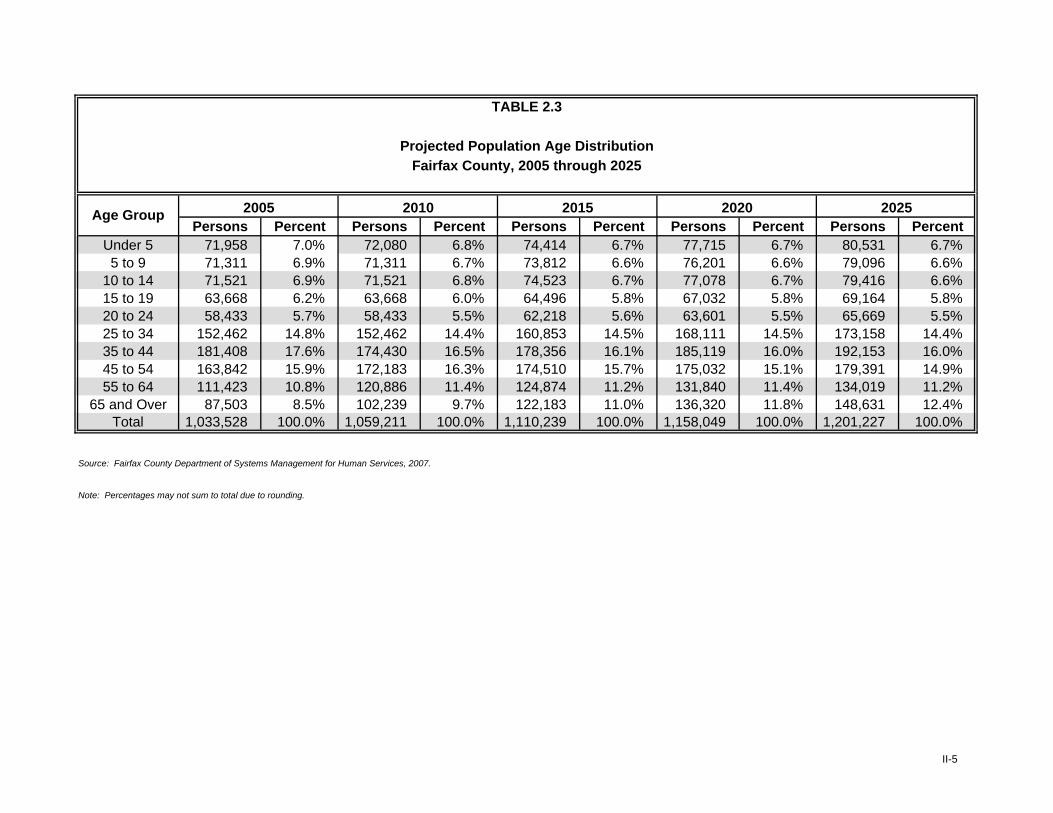
Persons Percent Persons Percent Persons Percent Persons Percent Persons PercentUnder 5 71,958 7.0% 72,080 6.8% 74,414 6.7% 77,715 6.7% 80,531 6.7%5 to 9 71,311 6.9% 71,311 6.7% 73,812 6.6% 76,201 6.6% 79,096 6.6%
10 to 14 71,521 6.9% 71,521 6.8% 74,523 6.7% 77,078 6.7% 79,416 6.6%15 to 19 63,668 6.2% 63,668 6.0% 64,496 5.8% 67,032 5.8% 69,164 5.8%20 to 24 58,433 5.7% 58,433 5.5% 62,218 5.6% 63,601 5.5% 65,669 5.5%25 to 34 152,462 14.8% 152,462 14.4% 160,853 14.5% 168,111 14.5% 173,158 14.4%35 to 44 181,408 17.6% 174,430 16.5% 178,356 16.1% 185,119 16.0% 192,153 16.0%45 to 54 163,842 15.9% 172,183 16.3% 174,510 15.7% 175,032 15.1% 179,391 14.9%55 to 64 111,423 10.8% 120,886 11.4% 124,874 11.2% 131,840 11.4% 134,019 11.2%
65 and Over 87,503 8.5% 102,239 9.7% 122,183 11.0% 136,320 11.8% 148,631 12.4%Total 1,033,528 100.0% 1,059,211 100.0% 1,110,239 100.0% 1,158,049 100.0% 1,201,227 100.0%
Note: Percentages may not sum to total due to rounding.
2005 2010 2015 2020 2025Age Group
Source: Fairfax County Department of Systems Management for Human Services, 2007.
TABLE 2.3
Projected Population Age DistributionFairfax County, 2005 through 2025
II-5

Persons Percent Persons Percent Persons Percent1988 215 15,150 14,429 29,794 White 665,399 81.3% 677,904 69.9% 692,314 66.5%1989 216 16,127 14,674 31,017 Black 63,325 7.7% 83,098 8.6% 98,430 9.5%1990 176 16,143 14,852 31,171 Asian and Pacific Islander 69,338 8.5% 126,729 13.1% 168,165 16.1%1991 196 16,521 14,704 31,421 American Indian and Alaska Native 2,038 0.2% 2,561 0.3% 1,772 0.2%1992 224 15,750 14,911 30,885 Other 18,484 2.3% 79,457 8.2% 80,825 7.8%1993 226 15,792 15,128 31,146 Fairfax County Total Population 818,584 100.0% 969,749 100.0% 1,041,507 100.0%1994 222 16,061 14,644 30,927 Hispanic* 51,874 6.3% 106,958 11.0% 141,429 13.6%1995 222 16,737 14,838 31,7981996 218 17,836 15,099 33,1531997 218 18,085 15,122 33,425 Excluded are persons living in group quarters such as nursing homes, dormitories, and correctional facilities.
1998 223 18,419 15,654 34,2961999 223 18,522 15,672 34,4712000 185 21,655 14,453 36,2932001 253 18,818 15,543 34,6142002 273 19,141 15,669 35,0832003 280 19,721 15,649 35,6502004 276 19,742 15,660 35,6782005 261 22,251 15,045 37,557 1990 2000 20072006 257 22,596 14,961 37,814 White 2.65 2.57 2.512007 260 22,591 14,930 37,781 Black 2.86 2.74 2.69
Asian 3.69 3.33 3.11Hispanic* 3.66 4.06 3.85
Fairfax County 2.75 2.74 2.74
* Hispanic persons may be of any race.
TABLE 2.6
1990 2000
Source: U.S. Bureau of the Census, Census of Population and Housing, 1990 and 2000; and 2007 American Community Survey.
Note: Percentages may not sum to total due to rounding.
2007Race
Fairfax County, 1984 through 2007
Year Town of Clifton
Town of Herndon
Town of Vienna Total
TABLE 2.5
Racial and Ethnic Population DistributionFairfax County, 1990, 2000 and 2007
TABLE 2.4
Population of Towns
Sources: U.S. Bureau of the Census, Census of Population and Housing,
1990 and 2000;
Fairfax County Department of Systems Management for Human Services,
1983 through 1989, 1991 through 1999, 2001 through 2007.
Average Household Size by RaceFairfax County, 1990, 2000 and 2007
Racial or EthnicOrigin Group
Average Household Size
Source: U.S. Bureau of the Census, 1990 and 2000 Decennial; 2007 American Community Survey (Selected Population Profile in the United States).
Excluded are persons living in group quarters such as nursing homes, dormitories, and correctional facilities.
Department of Systems Management for Human Services, Fairfax County, Integrated Parcel Lifecycle System (IPLS) 2006.
Note: Percentages may not sum to total due to rounding.
II-6

Percent of Percent of Median MedianHouseholds Families Household Income Family Income
Under $25,000 6.9% 4.7% 1979 $30,078 $33,236$25,000 - $49,999 12.1% 9.3% 1985 $49,700 $54,200$50,000 - $74,999 14.1% 11.7% 1987 $55,100 $62,000$75,000 - $99,999 13.5% 12.1% 1989 $59,284 $65,201
$100,000 - $149,999 23.1% 24.7% 1991 $61,000 $70,000$150,000 or More 30.2% 37.5% 1993 $64,000 $72,000
Total 100.0% 100.0% 1994 $66,000 $74,0001995 $70,000 $78,0001997 $72,000 $84,0001999 $81,050 $92,1462000 $82,000 $95,0002001 $84,683 $99,0852002 $85,310 $95,6122003 $80,753 $93,9782004 $88,133 $90,1942005 $94,610 $110,1072006 $100,318 $119,8122007 $105,241 $122,027
Income Level
Household Income is defined as that income which is available to all residents of a housing unit, regardless of relationship. Income is from all sources, before taxes and deductions, and includes wages, business, retirement, SSI, alimony, child support, interest, etc.
Family Income is derived by including only those households containing two or more persons related by blood, marriage or adoption.
Source: U.S. Bureau of the Census, American Community Survey, 2007.
Note: Percentages may not sum to total due to rounding.
Year
Sources: U.S. Bureau of the Census, U.S. Census of Population and Housing, 1979, 1989 and 1999; U.S. Bureau of the Census, 2001 Supplemental Survey; American Community Survey, 2002 - 2007; and Fairfax County Department of Systems Management for Human Services, all other years.
and Median Family IncomeFairfax County, 1979 through 2007Fairfax County, 2007
Income DistributionEstimates of Median Household Income
TABLE 2.8TABLE 2.7
Household and Family
II-7

1950 19,979 75.2% 1,997 7.5% 4,582 17.3% 26,558 100.0%1960 59,261 85.7% 3,526 5.1% 6,394 9.2% 69,181 100.0%19701 91,134 69.7% 7,747 5.9% 31,887 24.4% 130,768 100.0%19801 125,717 58.3% 31,882 14.8% 58,072 26.9% 215,671 100.0%1990 163,029 53.9% 67,306 22.3% 72,129 23.8% 302,464 100.0%1995 172,359 52.5% 77,356 23.6% 78,436 23.9% 328,151 100.0%2000 181,591 50.6% 87,171 24.3% 90,198 25.1% 358,960 100.0%2005 189,980 49.3% 97,071 25.2% 98,583 25.6% 385,634 100.0%2007 190,744 48.8% 98,200 25.1% 102,194 26.1% 391,138 100.0%2010 192,934 48.4% 98,995 24.9% 106,353 26.7% 398,282 100.0%2015 199,352 47.3% 100,564 23.9% 121,460 28.8% 421,375 100.0%2020 206,548 46.7% 101,298 22.9% 134,880 30.5% 442,727 100.0%2025 212,886 46.1% 101,888 22.0% 147,319 31.9% 462,093 100.0%
Fairfax County, 1950 through 2025
Year
TABLE 2.9
Estimates and Forecasts of Housing Unitsby Type of Structure
Percent of Total
Percent of Total
Housing Units
TotalHousing
UnitsHousing
Units
Fairfax County Department of Systems Management for Human Services, 1990 through 2025, Integrated Parcel Lifecycle System (IPLS) 2007.
Sources: U.S. Bureau of the Census, U.S. Census of Population and Housing, 1950 through 1980;
Single Family Detached Single Family Attached MultifamilyHousing
UnitsPercent of
TotalPercent of
Total
1 Data are estimates based on a sample and, therefore, may not agree with similar published information.
category includes townhouses, duplex and multiplex units; multifamily category includes garden, mid-rise and high-rise units.
correspond with total housing units elsewhere. Single family detached category includes single family detached units and mobile homes; single family attached
Note: 1950 through 2007 figures are estimates. 2010 through 2025 figures are forecasts. Due to rounding, total housing units on this page may not
II-8
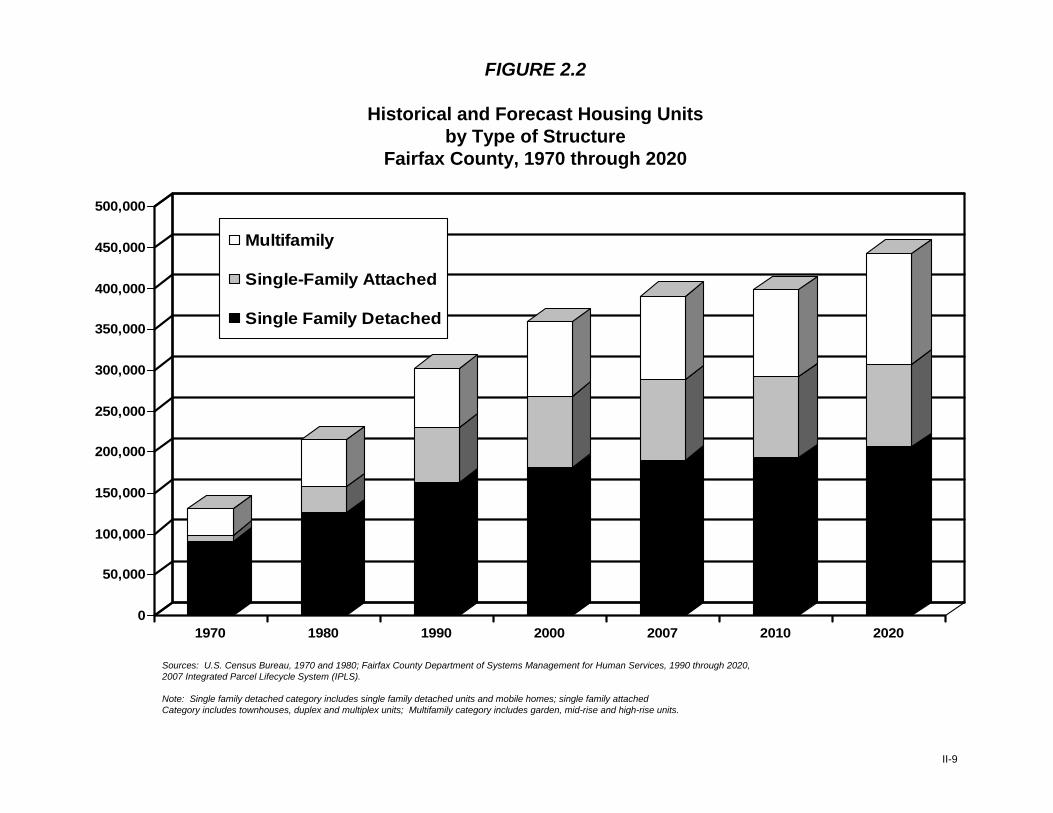
FIGURE 2.2
Historical and Forecast Housing Units by Type of Structure
Fairfax County, 1970 through 2020
0
50,000
100,000
150,000
200,000
250,000
300,000
350,000
400,000
450,000
500,000
1970 1980 1990 2000 2007 2010 2020
Multifamily
Single-Family Attached
Single Family Detached
Sources: U.S. Census Bureau, 1970 and 1980; Fairfax County Department of Systems Management for Human Services, 1990 through 2020, 2007 Integrated Parcel Lifecycle System (IPLS).
Note: Single family detached category includes single family detached units and mobile homes; single family attached Category includes townhouses, duplex and multiplex units; Multifamily category includes garden, mid-rise and high-rise units.
II-9

Year Total Units Vacancy Rate Average Monthly Rent Year Median Market
ValuePercent Change
1980 44,130 4.1% $334 1979 $75,200 10.3%1981 43,114 2.6% $367 1980 $87,200 16.0%1982 42,238 2.6% $403 1981 $97,700 12.0%1983 41,600 3.0% $430 1982 $104,100 6.6%1984 40,813 2.1% $466 1983 $103,600 -0.5%1985 40,186 2.2% $517 1984 $108,100 4.3%1986 40,762 2.5% $566 1985 $110,500 2.2%1987 41,745 4.4% $615 1986 $118,400 7.1%1988 42,802 3.1% $662 1987 $133,400 12.7%1989 45,578 7.4% $705 1988 $152,800 14.5%1990 48,567 6.6% $734 1989 $179,500 17.5%1991 49,253 7.6% $747 1990 $194,700 8.5%1992 50,148 6.2% $739 1991 $190,100 -2.4%1993 49,811 5.2% $753 1992 $183,700 -3.4%1994 50,184 4.7% $767 1993 $183,500 -0.1%1995 50,111 4.9% $792 1994 $184,400 0.5%1996 51,186 5.4% $800 1995 $186,800 1.3%1997 52,024 5.0% $809 1996 $186,300 -0.3%1998 54,243 5.5% $849 1997 $185,700 -0.3%2000 57,226 1.6% $989 1998 $185,600 -0.1%2001 59,128 2.5% $1,129 1999 $192,100 3.5%2002 60,175 5.5% $1,157 2000 $226,800 22.1%2003 61,297 5.6% $1,168 2001 $229,200 1.1%2004 62,934 5.6% $1,157 2002 $265,600 15.9%2005 63,269 6.8% $1,202 2003 $307,600 15.8%2006 62,156 6.0% $1,247 2004 $349,000 13.5%
2005 $484,762 38.9%2006 $538,940 11.2%2007 $536,162 -0.5%
TABLE 2.10 TABLE 2.11
Estimated Median Market ValueOwned Housing Units
Fairfax County, 1979 through 2007
Rental Housing Complexes: Total Units,
Fairfax County, 1980 through 2006Vacancy Rate and Average Monthly Rent
Note: Vacancy rate and average monthly rent figures are calculated based on information provided by those rental housing complexes in major rental housing projects having five or more units. Human Services, Integrated Parcel Lifecycle System (IPLS) 2007.
Source: Fairfax County Department of Systems Management for Human Services, 2006
Source: Fairfax County Department of Systems Management for
II-10

Jurisdiction Population Median Household Income
Median Family Income Population Median Household
IncomeMedian Family
IncomeFairfax County, VA 969,749 $81,050 $92,146 1,041,507 $105,241 $122,027Arlington County, VA 189,453 $63,001 $78,877 204,568 $94,876 $127,179Fauquier County, VA 55,139 $61,999 $69,507 65,957 $84,888 $103,705Loudoun County, VA 169,599 $80,648 $88,387 278,797 $107,207 $128,856
Prince William County, VA 280,813 $65,960 $71,622 360,411 $87,243 $93,002Spotsylvania County, VA 90,395 $57,525 $62,422 119,194 $74,881 $82,981
Stafford County, VA 92,446 $66,809 $71,575 120,723 $87,629 $100,519Alexandria City, VA 128,283 $56,054 $67,023 140,024 $80,806 $102,435
Anne Arundel County, MD 489,656 $61,768 $69,019 512,154 $80,402 $92,100Calvert County, MD 74,563 $65,945 $71,545 88,223 $95,134 $104,874Charles County, MD 120,546 $62,199 $67,602 140,444 $83,412 $92,389
Frederick County, MD 195,277 $60,276 $67,879 224,705 $77,027 $92,430Howard County, MD 247,842 $74,167 $85,422 273,669 $101,672 $115,707
Montgomery County, MD 873,341 $71,551 $84,035 930,813 $91,835 $108,464Prince Georges County, MD 801,515 $55,256 $62,467 828,770 $68,370 $78,294
District of Columbia 572,059 $40,127 $46,283 588,292 $54,317 $66,672Berkeley County, WV 75,905 $38,763 $44,302 99,734 $54,625 $61,768
Washington DC-MD-VA-WV MSA 5,306,125 $83,200 $99,678 5,288,670 $78,978 $94,386State of Virginia 7,078,515 $46,677 $54,169 7,712,091 $59,562 $70,894United States 281,421,906 $41,994 $50,046 301,621,159 $50,740 $61,173
Note: Household Income is defined as that income which is available to all residents of a housing unit, regardless of relationship. Income is from all sources, before taxes and deductions, and includes wages,
business income, retirement, SSI, alimony, child support, interest, etc. Family Income is derived by including only those households containing two or more persons related by birth , marriage or adoption.
Sources: Fairfax County Department of Systems Management for Human Services, 2007 Fairfax County population; and U.S. Bureau of the Census, 2000 Census of Population and Housing,
2007 Population Estimates, and 2007 American Community Survey.
2000 Census 2007
TABLE 2.12
2000 and 2007 Population, Median Household Income and Median Family Incomeby Selected Jurisdictions in the Washington DC Metropolitan Area, State of Virginia and the United States
II-11
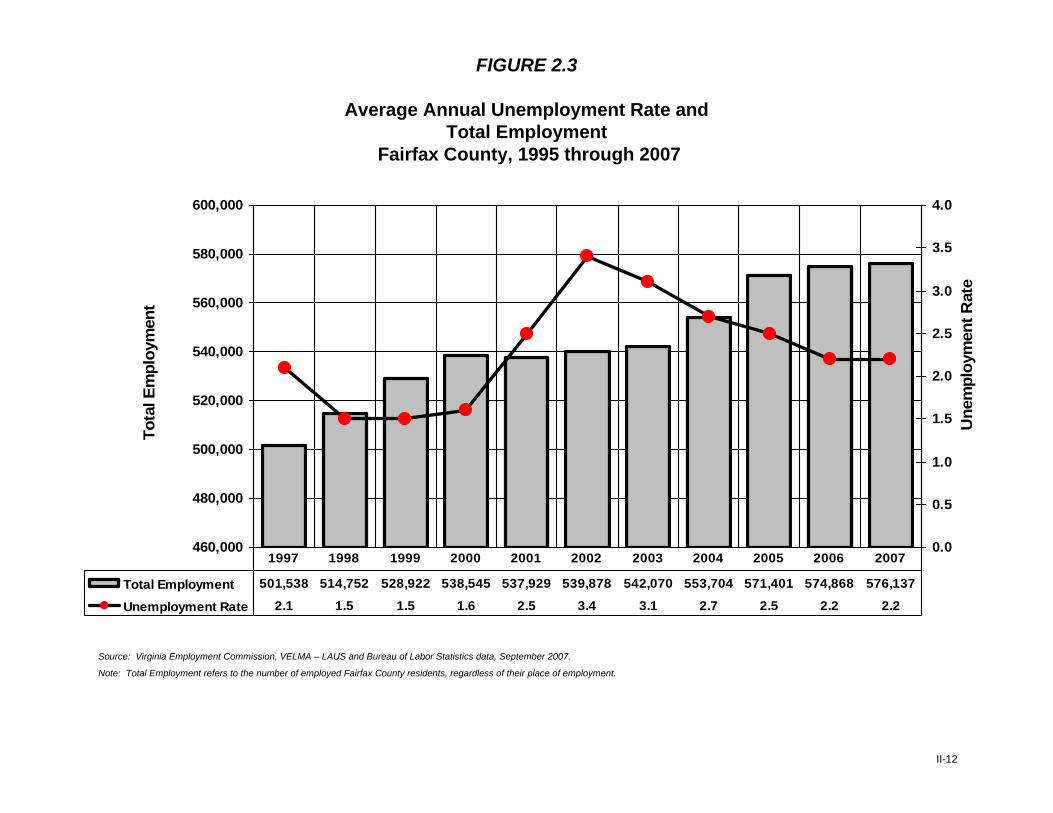
FIGURE 2.3
Average Annual Unemployment Rate and Total Employment
Fairfax County, 1995 through 2007
460,000
480,000
500,000
520,000
540,000
560,000
580,000
600,000
Tota
l Em
ploy
men
t
0.0
0.5
1.0
1.5
2.0
2.5
3.0
3.5
4.0
Une
mpl
oym
ent R
ate
Total Employment 501,538 514,752 528,922 538,545 537,929 539,878 542,070 553,704 571,401 574,868 576,137
Unemployment Rate 2.1 1.5 1.5 1.6 2.5 3.4 3.1 2.7 2.5 2.2 2.2
1997 1998 1999 2000 2001 2002 2003 2004 2005 2006 2007
Source: Virginia Employment Commission, VELMA – LAUS and Bureau of Labor Statistics data, September 2007.
Note: Total Employment refers to the number of employed Fairfax County residents, regardless of their place of employment.
II-12
CURRENT POPULATION The current population estimates are summarized by supervisor district and town, planning district, sewershed, human services region, and census tract and block groups. Total population is a combination of household population and group quarters population as of January 1 of the current year. Household population estimates are developed for these specific geographical areas by applying vacancy rates and household size factors by dwelling unit type for the applicable planning district to the current housing inventory of the geographical area. The household size factors and vacancy rates used for the household population estimates are determined from the results of the most recent U.S. Census Bureau data and county survey data.
Group quarters population for each geographical area is added to the household population estimate to obtain the total population estimate. The population of special institutions, such as Fort Belvoir, Fairfax County adult and juvenile detention centers, pre-release centers, nursing homes, George Mason University dormitories, and other group facilities, are obtained directly from these institutions. Institutional and group quarters population is included in all geographies. Population Density Population density is based on the total land and water acres or square miles in the County.
III-1

Table 3.1
Average Household Size and Vacancy Rate by Planning DistrictFairfax County, January 2007
PlanningDistrict
Average Household Size(Persons per Occupied Unit) Overall
AverageHousehold
Size
Vacancy Rate
OverallVacancy
Rate
SingleFamily
Detached
SingleFamily
AttachedMulti-Family
MobileHome Owner Renter
Annandale 2.88 2.74 2.45 2.76 1.33 1.90 1.46
Baileys 2.89 3.17 2.25 2.50 1.56 3.67 2.91
Bull Run 2.95 2.67 2.01 3.43 2.66 2.10 2.72 2.23
Fairfax 2.97 2.49 1.95 2.52 2.44 1.49 5.17 3.02
Jefferson 2.95 2.67 2.02 2.51 2.10 2.72 2.37
Lincolnia 2.98 2.96 2.65 2.85 1.92 2.47 2.12
Lower Potomac 2.93 3.19 1.91 2.83 4.63 6.00 4.91
Mclean 2.89 2.06 1.69 2.49 2.21 9.35 4.13
Mount Vernon 2.71 2.52 2.05 2.74 2.43 2.37 4.70 3.24
Pohick 3.19 2.82 1.95 3.03 1.04 1.32 1.05
Rose Hill 2.87 2.32 1.72 2.42 1.25 3.62 1.80
Springfield 3.09 2.66 2.04 2.77 1.02 6.00 1.80
Upper Potomac 3.56 2.57 2.02 2.89 1.63 6.96 3.08
Vienna 2.91 2.57 2.25 2.73 1.50 7.36 2.38
Fairfax County 3.06 2.64 2.05 2.91 2.69 1.70 4.89 2.53
Source: Fairfax County Department of Systems Management for Human Services, 2007
III-2
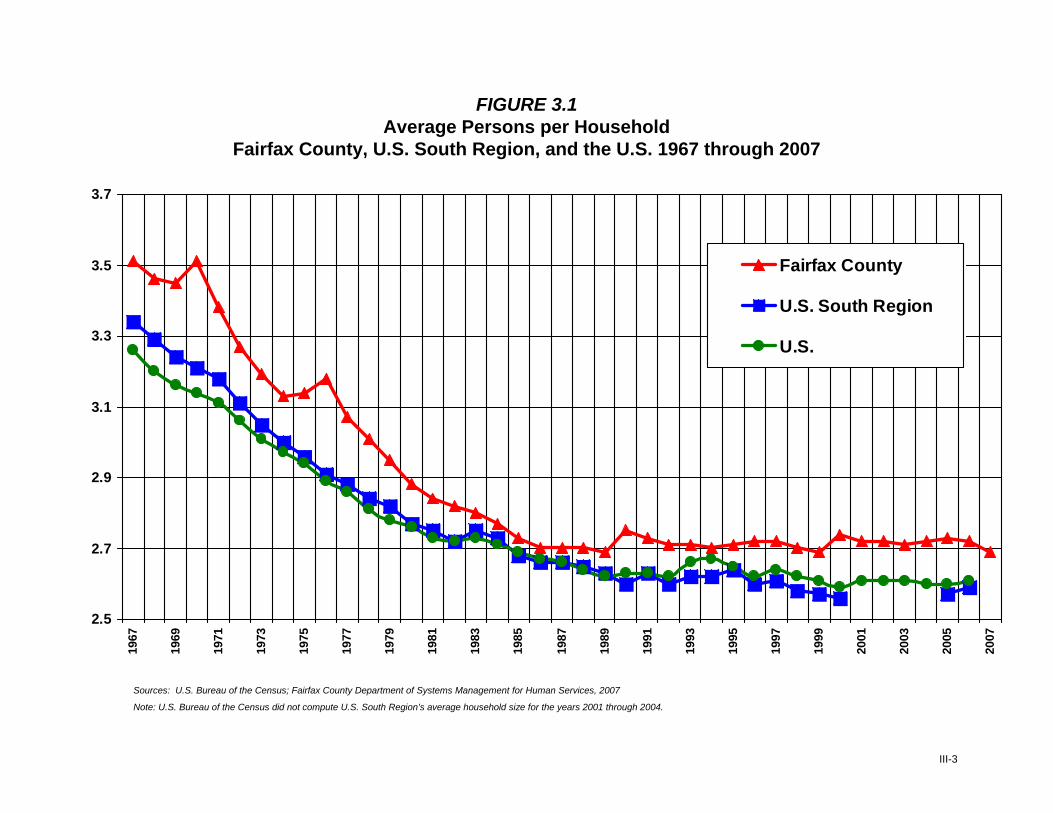
FIGURE 3.1Average Persons per Household
Fairfax County, U.S. South Region, and the U.S. 1967 through 2007
2.5
2.7
2.9
3.1
3.3
3.5
3.7
1967
1969
1971
1973
1975
1977
1979
1981
1983
1985
1987
1989
1991
1993
1995
1997
1999
2001
2003
2005
2007
Fairfax County
U.S. South Region
U.S.
Sources: U.S. Bureau of the Census; Fairfax County Department of Systems Management for Human Services, 2007
Note: U.S. Bureau of the Census did not compute U.S. South Region’s average household size for the years 2001 through 2004.
III-3
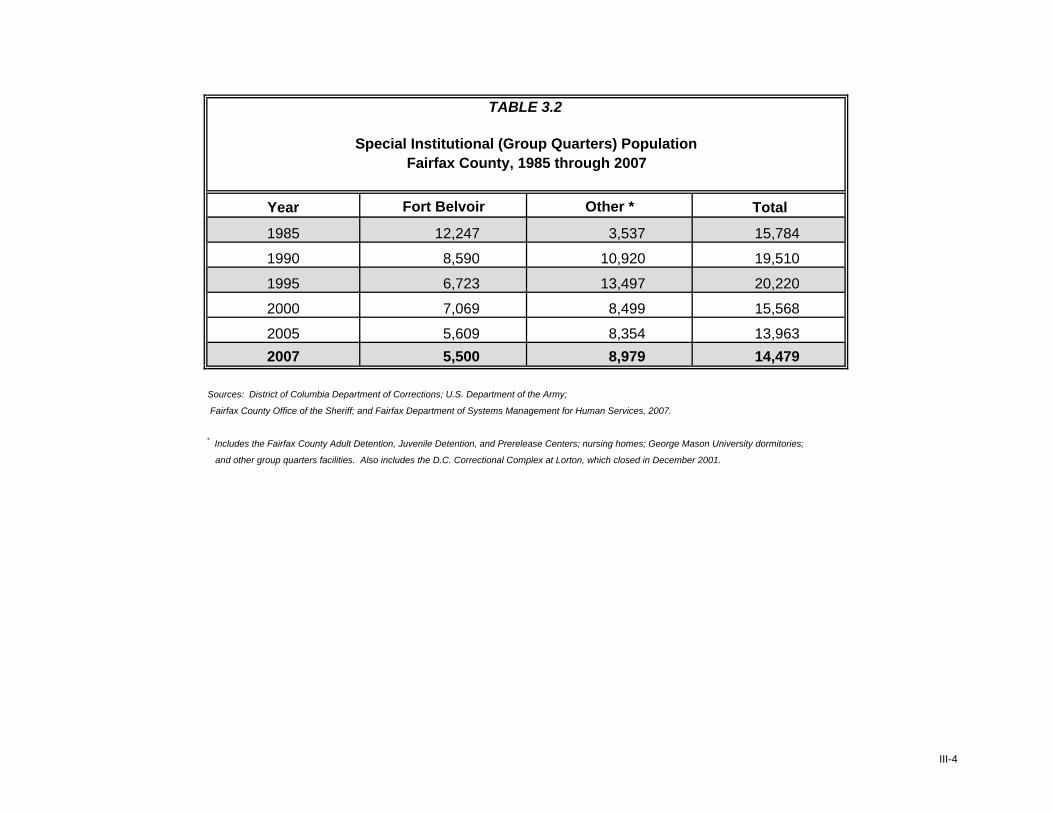
Year Fort Belvoir Other * Total
1985 12,247 3,537 15,784
1990 8,590 10,920 19,510
1995 6,723 13,497 20,220
2000 7,069 8,499 15,568
2005 5,609 8,354 13,9632007 5,500 8,979 14,479
and other group quarters facilities. Also includes the D.C. Correctional Complex at Lorton, which closed in December 2001.
* Includes the Fairfax County Adult Detention, Juvenile Detention, and Prerelease Centers; nursing homes; George Mason University dormitories;
Fairfax County Office of the Sheriff; and Fairfax Department of Systems Management for Human Services, 2007.
Sources: District of Columbia Department of Corrections; U.S. Department of the Army;
TABLE 3.2
Special Institutional (Group Quarters) PopulationFairfax County, 1985 through 2007
III-4
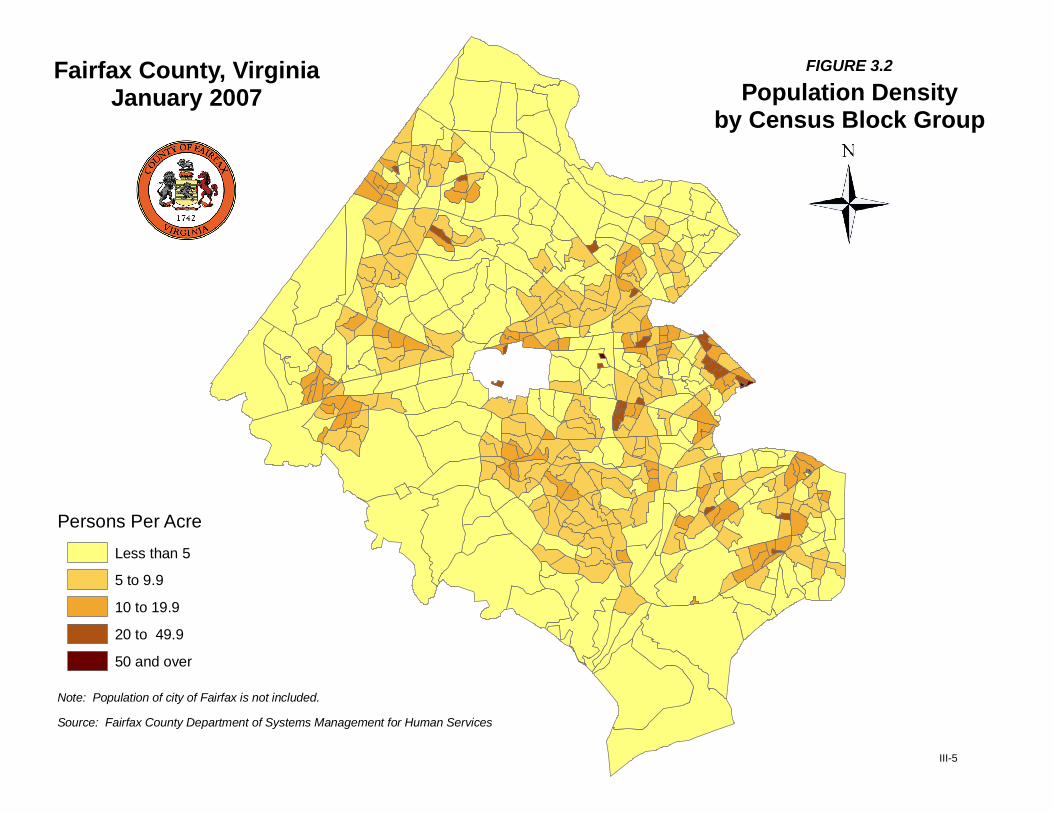
Fairfax County, VirginiaJanuary 2007
FIGURE 3.2
Population Densityby Census Block Group
Persons Per AcreLess than 5
5 to 9.9
10 to 19.9
20 to 49.9
50 and over
Note: Population of city of Fairfax is not included.
Source: Fairfax County Department of Systems Management for Human Services
III-5

Table 3.3
2007 Population, Housing Units and Households by Supervisor DistrictFairfax County, January 2007
Supervisor District PopulationHousing
Units Households AcresPopulationper Acre
Square Miles
Population perSquare Mile
Braddock 108,004 36,919 36,454 15,740 6.9 24.59 4,392
Dranesville 1/ 118,249 39,950 38,913 41,731 2.8 65.20 1,814
Hunter Mill 2/ 131,184 50,869 49,124 22,973 5.7 35.90 3,654
Lee 104,097 42,492 41,545 17,161 6.1 26.81 3,883
Mason 102,414 39,171 38,244 13,561 7.6 21.19 4,833
Mount Vernon 123,905 45,854 44,466 48,201 2.6 75.31 1,645
Providence 114,346 48,243 46,570 17,343 6.6 27.10 4,219
Springfield 3/ 124,931 45,488 44,616 47,670 2.6 74.48 1,677
Sully 114,377 42,152 41,294 35,987 3.2 56.23 2,034
Fairfax County 1,041,507 391,138 381,227 260,368 4.0 406.83 2,560
Table 3.4
2007 Population, Housing Units and Households by TownFairfax County, January 2007
Town PopulationHousing
Units Households AcresPopulationper Acre
Square Miles
Population perSquare Mile
Town of Clifton 260 87 85 159 1.6 0.25 1,041
Town of Herndon 22,591 7,652 7,459 2,736 8.3 4.28 5,278
Town of Vienna 14,930 5,609 5,506 2,816 5.3 4.40 3,393
Towns Total 37,781 13,348 13,050 5,711 6.6 8.92 4,236
Source: Fairfax County Department of Systems Management for Human Services, 2007
Note: Households are occupied housing units. Area measurements (acres and square miles) includes both land and water area. Countywidetotals may vary by table depending on how well the geographic layer aligns with actual county boundaries.
1/ Includes the Town of Herndon.
2/ Includes the Town of Vienna.
3/ Includes the Town of Clifton.
III-6

Table 3.5
2007 Population, Housing Units and Households by Planning DistrictFairfax County, January 2007
Planning District PopulationHousing
Units Households AcresPopulationper Acre
Square Miles
Population perSquare Mile
Annandale 70,357 25,660 25,284 11,947 5.9 18.67 3,768
Baileys 42,487 17,459 16,951 4,047 10.5 6.32 6,723
Bull Run 114,027 43,937 42,959 32,002 3.6 50.00 2,281
Fairfax 65,011 25,264 24,501 12,958 5.0 20.25 3,210
Jefferson 49,796 20,299 19,819 6,339 7.9 9.90 5,030
Lincolnia 17,452 6,226 6,094 2,055 8.5 3.21 5,437
Lower Potomac 30,321 9,119 8,671 29,287 1.0 45.76 663
Mclean 66,395 27,471 26,338 19,372 3.4 30.27 2,193
Mount Vernon 88,883 37,588 36,370 14,435 6.2 22.55 3,942
Pohick 1/ 139,816 46,510 46,023 48,952 2.9 76.49 1,828
Rose Hill 48,665 20,468 20,100 9,095 5.4 14.21 3,425
Springfield 50,902 18,606 18,272 10,425 4.9 16.29 3,125
Upper Potomac 2/ 193,809 68,784 66,662 47,487 4.1 74.20 2,612
Vienna 3/ 63,587 23,747 23,183 11,982 5.3 18.72 3,397
Fairfax County 1,041,507 391,138 381,227 260,380 4.0 406.84 2,560
Source: Fairfax County Department of Systems Management for Human Services, 2007
Note: Households are occupied housing units. Area measurements (acres and square miles) includes both
land and water area. Countywide totals may vary by table depending on how well the geographic layer
aligns with actual county boundaries.
1/ Includes the Town of Clifton.
2/ Includes the Town of Herndon.
3/ Includes the Town of Vienna.
III-7
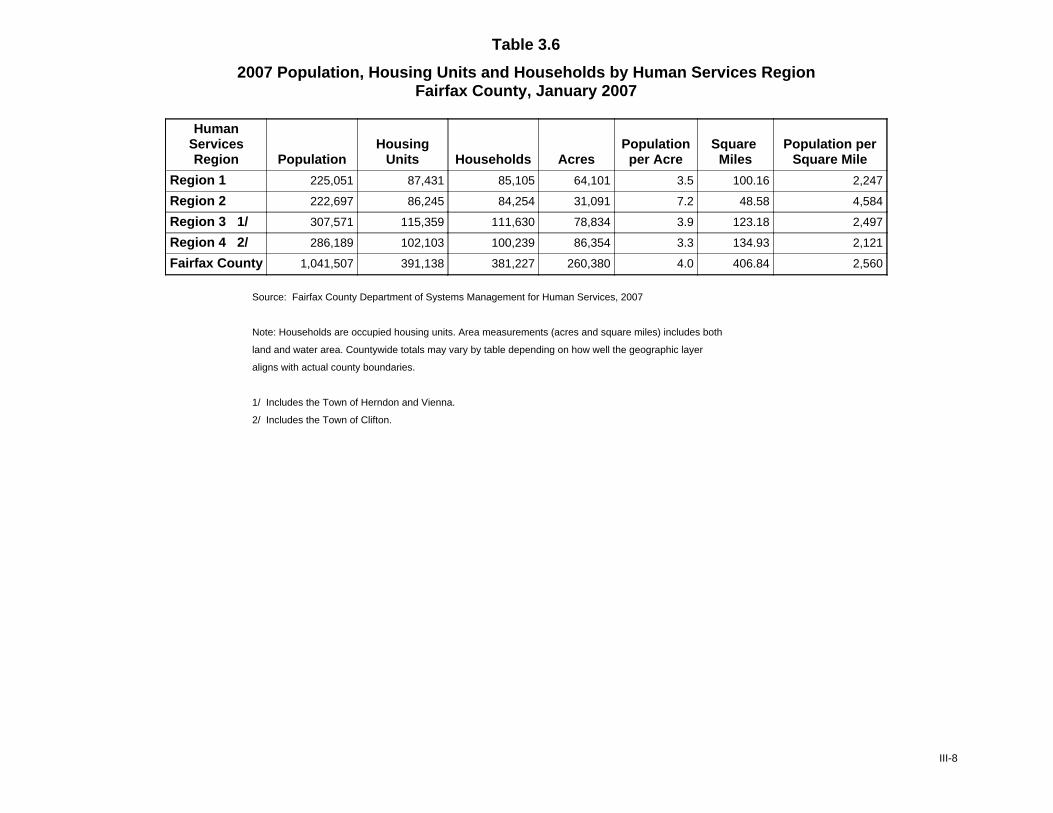
Table 3.6
2007 Population, Housing Units and Households by Human Services RegionFairfax County, January 2007
HumanServicesRegion Population
HousingUnits Households Acres
Populationper Acre
Square Miles
Population perSquare Mile
Region 1 225,051 87,431 85,105 64,101 3.5 100.16 2,247
Region 2 222,697 86,245 84,254 31,091 7.2 48.58 4,584
Region 3 1/ 307,571 115,359 111,630 78,834 3.9 123.18 2,497
Region 4 2/ 286,189 102,103 100,239 86,354 3.3 134.93 2,121
Fairfax County 1,041,507 391,138 381,227 260,380 4.0 406.84 2,560
Source: Fairfax County Department of Systems Management for Human Services, 2007
Note: Households are occupied housing units. Area measurements (acres and square miles) includes both
land and water area. Countywide totals may vary by table depending on how well the geographic layer
aligns with actual county boundaries.
1/ Includes the Town of Herndon and Vienna.
2/ Includes the Town of Clifton.
III-8
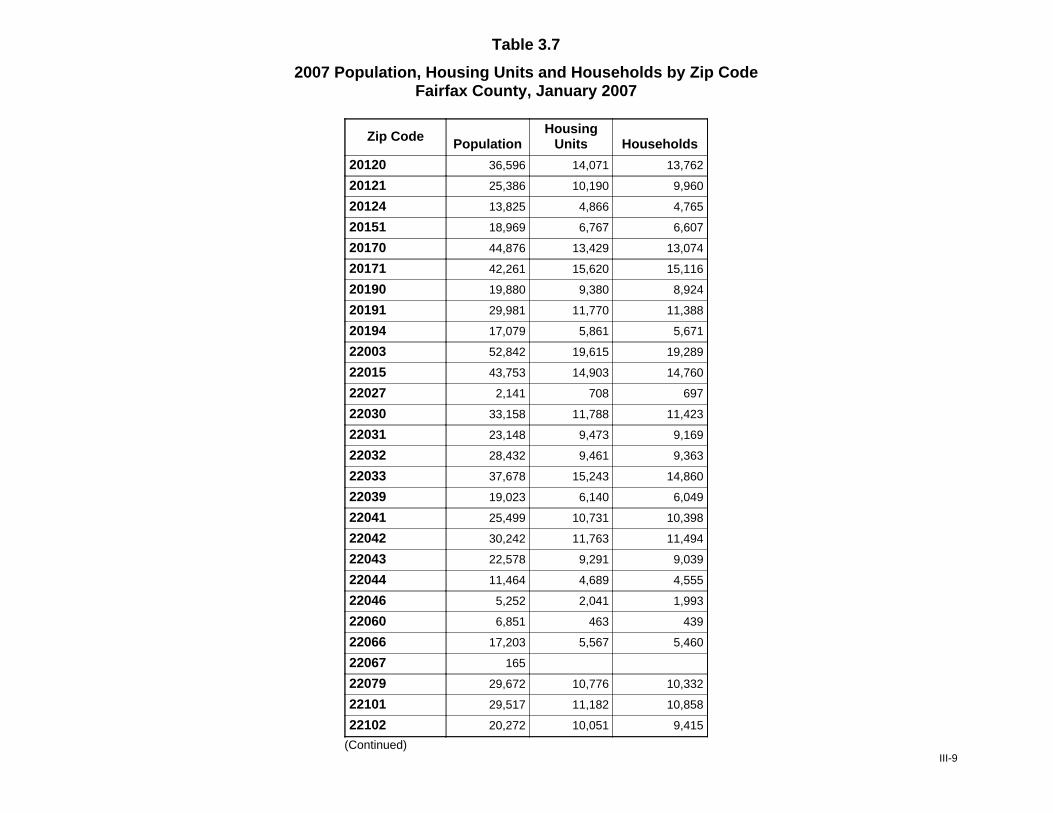
Table 3.7
2007 Population, Housing Units and Households by Zip CodeFairfax County, January 2007
Zip Code PopulationHousing
Units Households
20120 36,596 14,071 13,762
20121 25,386 10,190 9,960
20124 13,825 4,866 4,765
20151 18,969 6,767 6,607
20170 44,876 13,429 13,074
20171 42,261 15,620 15,116
20190 19,880 9,380 8,924
20191 29,981 11,770 11,388
20194 17,079 5,861 5,671
22003 52,842 19,615 19,289
22015 43,753 14,903 14,760
22027 2,141 708 697
22030 33,158 11,788 11,423
22031 23,148 9,473 9,169
22032 28,432 9,461 9,363
22033 37,678 15,243 14,860
22039 19,023 6,140 6,049
22041 25,499 10,731 10,398
22042 30,242 11,763 11,494
22043 22,578 9,291 9,039
22044 11,464 4,689 4,555
22046 5,252 2,041 1,993
22060 6,851 463 439
22066 17,203 5,567 5,460
22067 165
22079 29,672 10,776 10,332
22101 29,517 11,182 10,858
22102 20,272 10,051 9,415
(Continued)III-9
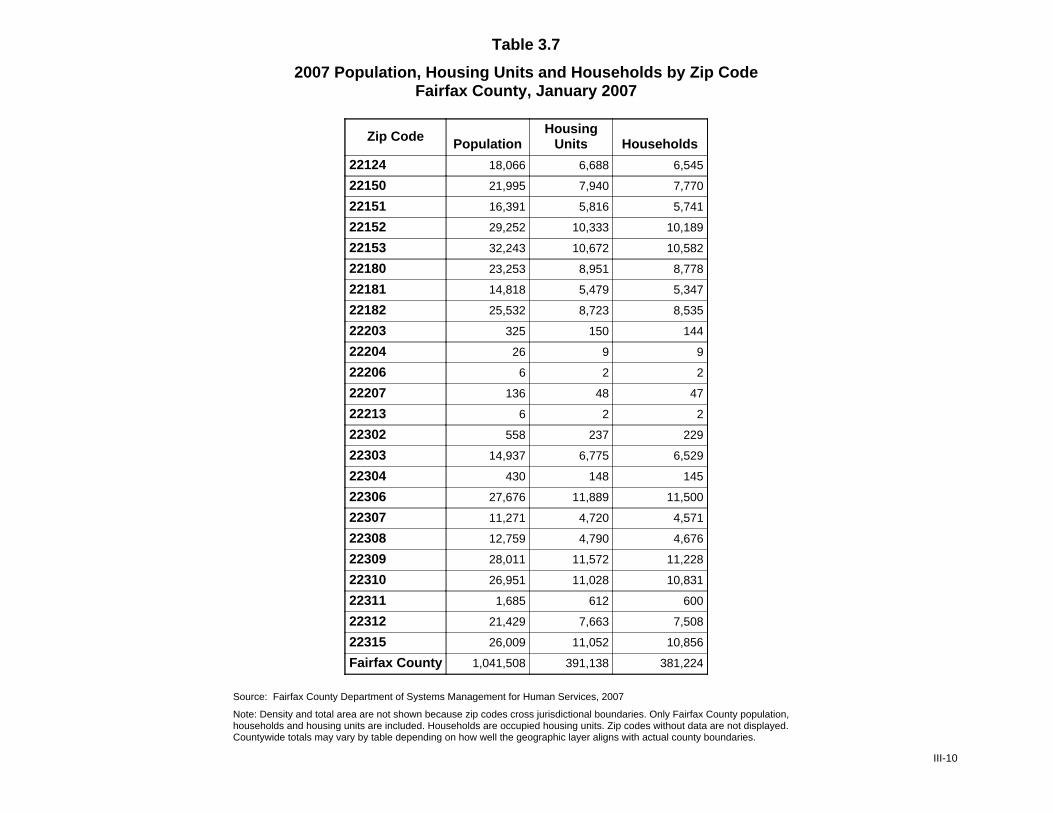
Table 3.7
2007 Population, Housing Units and Households by Zip CodeFairfax County, January 2007
Zip Code PopulationHousing
Units Households
22124 18,066 6,688 6,545
22150 21,995 7,940 7,770
22151 16,391 5,816 5,741
22152 29,252 10,333 10,189
22153 32,243 10,672 10,582
22180 23,253 8,951 8,778
22181 14,818 5,479 5,347
22182 25,532 8,723 8,535
22203 325 150 144
22204 26 9 9
22206 6 2 2
22207 136 48 47
22213 6 2 2
22302 558 237 229
22303 14,937 6,775 6,529
22304 430 148 145
22306 27,676 11,889 11,500
22307 11,271 4,720 4,571
22308 12,759 4,790 4,676
22309 28,011 11,572 11,228
22310 26,951 11,028 10,831
22311 1,685 612 600
22312 21,429 7,663 7,508
22315 26,009 11,052 10,856
Fairfax County 1,041,508 391,138 381,224
Source: Fairfax County Department of Systems Management for Human Services, 2007
Note: Density and total area are not shown because zip codes cross jurisdictional boundaries. Only Fairfax County population,households and housing units are included. Households are occupied housing units. Zip codes without data are not displayed.Countywide totals may vary by table depending on how well the geographic layer aligns with actual county boundaries.
III-10
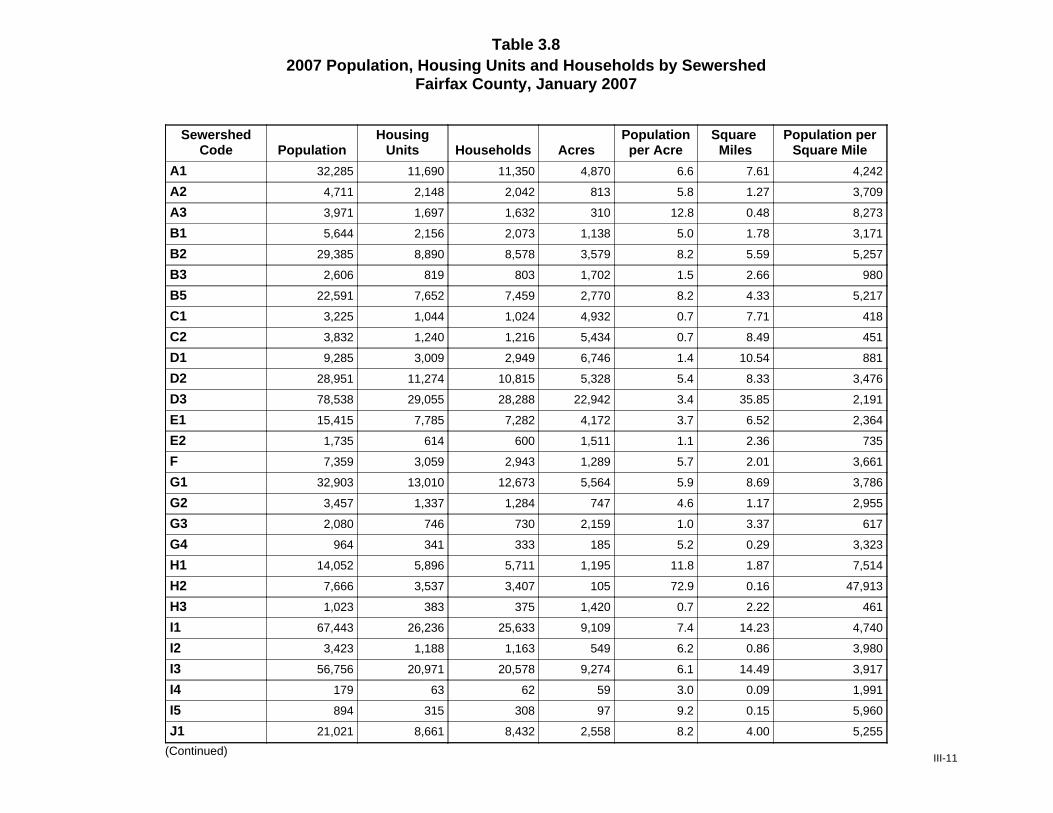
Table 3.82007 Population, Housing Units and Households by Sewershed
Fairfax County, January 2007
SewershedCode Population
HousingUnits Households Acres
Populationper Acre
Square Miles
Population perSquare Mile
A1 32,285 11,690 11,350 4,870 6.6 7.61 4,242
A2 4,711 2,148 2,042 813 5.8 1.27 3,709
A3 3,971 1,697 1,632 310 12.8 0.48 8,273
B1 5,644 2,156 2,073 1,138 5.0 1.78 3,171
B2 29,385 8,890 8,578 3,579 8.2 5.59 5,257
B3 2,606 819 803 1,702 1.5 2.66 980
B5 22,591 7,652 7,459 2,770 8.2 4.33 5,217
C1 3,225 1,044 1,024 4,932 0.7 7.71 418
C2 3,832 1,240 1,216 5,434 0.7 8.49 451
D1 9,285 3,009 2,949 6,746 1.4 10.54 881
D2 28,951 11,274 10,815 5,328 5.4 8.33 3,476
D3 78,538 29,055 28,288 22,942 3.4 35.85 2,191
E1 15,415 7,785 7,282 4,172 3.7 6.52 2,364
E2 1,735 614 600 1,511 1.1 2.36 735
F 7,359 3,059 2,943 1,289 5.7 2.01 3,661
G1 32,903 13,010 12,673 5,564 5.9 8.69 3,786
G2 3,457 1,337 1,284 747 4.6 1.17 2,955
G3 2,080 746 730 2,159 1.0 3.37 617
G4 964 341 333 185 5.2 0.29 3,323
H1 14,052 5,896 5,711 1,195 11.8 1.87 7,514
H2 7,666 3,537 3,407 105 72.9 0.16 47,913
H3 1,023 383 375 1,420 0.7 2.22 461
I1 67,443 26,236 25,633 9,109 7.4 14.23 4,740
I2 3,423 1,188 1,163 549 6.2 0.86 3,980
I3 56,756 20,971 20,578 9,274 6.1 14.49 3,917
I4 179 63 62 59 3.0 0.09 1,991
I5 894 315 308 97 9.2 0.15 5,960
J1 21,021 8,661 8,432 2,558 8.2 4.00 5,255
(Continued) III-11
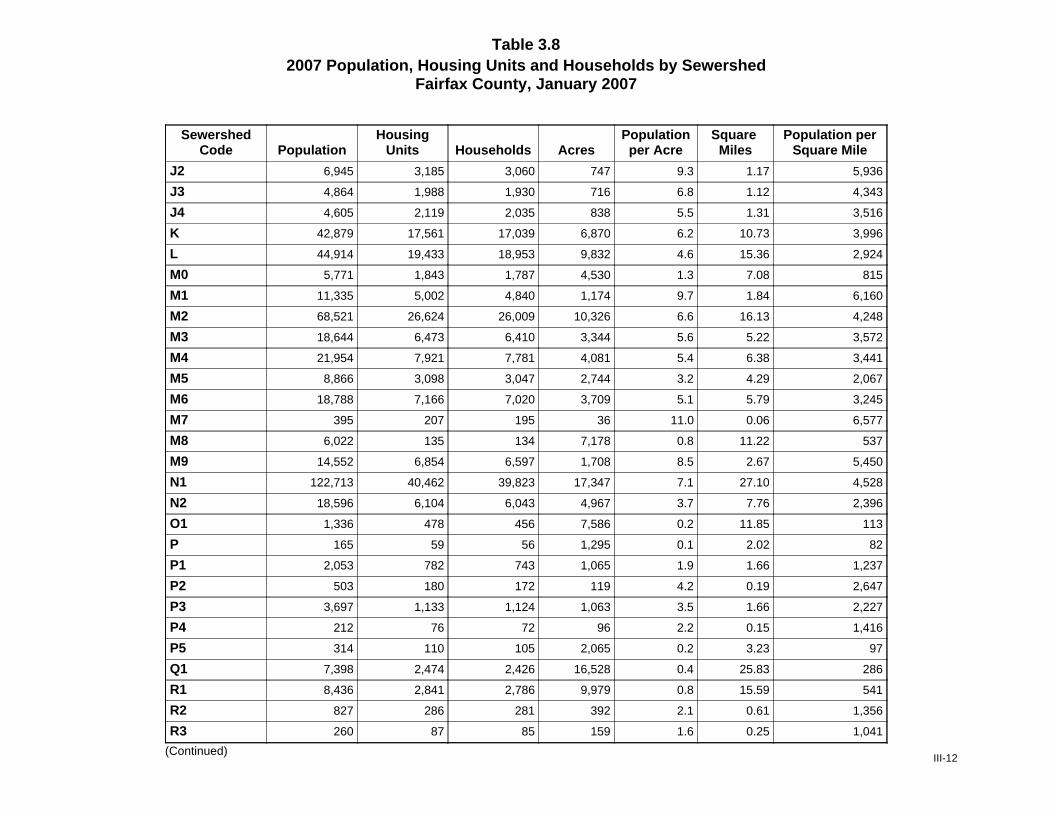
Table 3.82007 Population, Housing Units and Households by Sewershed
Fairfax County, January 2007
SewershedCode Population
HousingUnits Households Acres
Populationper Acre
Square Miles
Population perSquare Mile
J2 6,945 3,185 3,060 747 9.3 1.17 5,936
J3 4,864 1,988 1,930 716 6.8 1.12 4,343
J4 4,605 2,119 2,035 838 5.5 1.31 3,516
K 42,879 17,561 17,039 6,870 6.2 10.73 3,996
L 44,914 19,433 18,953 9,832 4.6 15.36 2,924
M0 5,771 1,843 1,787 4,530 1.3 7.08 815
M1 11,335 5,002 4,840 1,174 9.7 1.84 6,160
M2 68,521 26,624 26,009 10,326 6.6 16.13 4,248
M3 18,644 6,473 6,410 3,344 5.6 5.22 3,572
M4 21,954 7,921 7,781 4,081 5.4 6.38 3,441
M5 8,866 3,098 3,047 2,744 3.2 4.29 2,067
M6 18,788 7,166 7,020 3,709 5.1 5.79 3,245
M7 395 207 195 36 11.0 0.06 6,577
M8 6,022 135 134 7,178 0.8 11.22 537
M9 14,552 6,854 6,597 1,708 8.5 2.67 5,450
N1 122,713 40,462 39,823 17,347 7.1 27.10 4,528
N2 18,596 6,104 6,043 4,967 3.7 7.76 2,396
O1 1,336 478 456 7,586 0.2 11.85 113
P 165 59 56 1,295 0.1 2.02 82
P1 2,053 782 743 1,065 1.9 1.66 1,237
P2 503 180 172 119 4.2 0.19 2,647
P3 3,697 1,133 1,124 1,063 3.5 1.66 2,227
P4 212 76 72 96 2.2 0.15 1,416
P5 314 110 105 2,065 0.2 3.23 97
Q1 7,398 2,474 2,426 16,528 0.4 25.83 286
R1 8,436 2,841 2,786 9,979 0.8 15.59 541
R2 827 286 281 392 2.1 0.61 1,356
R3 260 87 85 159 1.6 0.25 1,041
(Continued) III-12
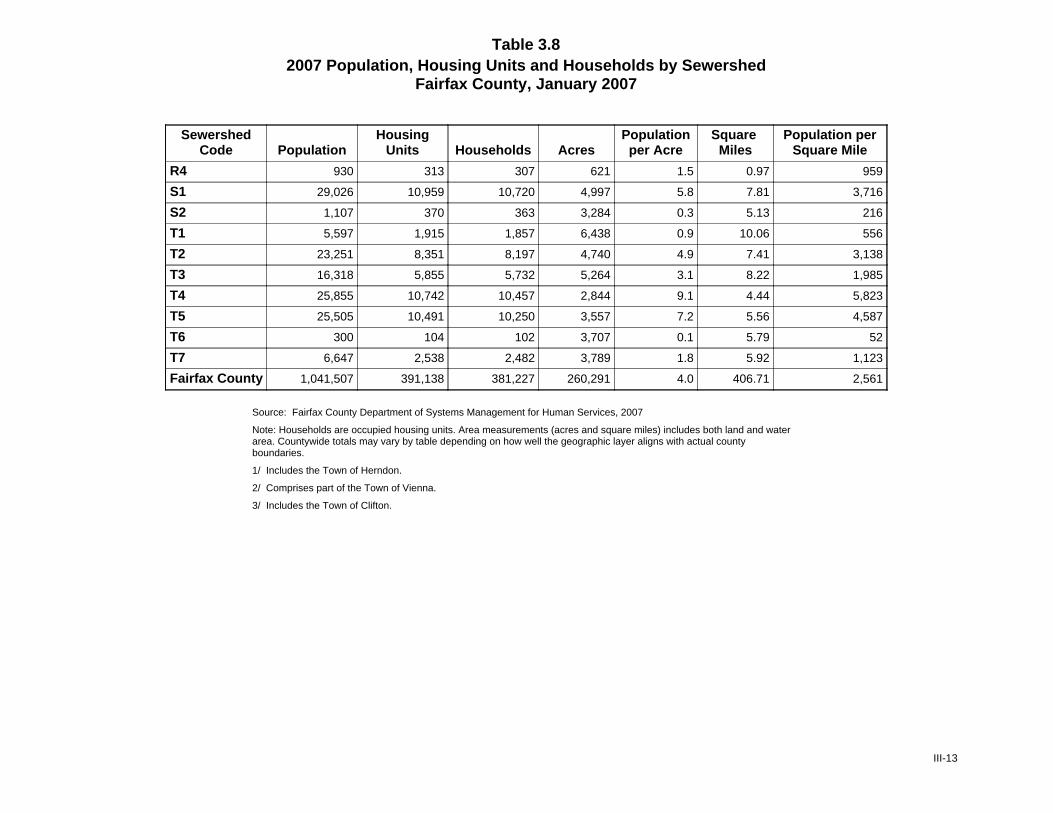
Table 3.82007 Population, Housing Units and Households by Sewershed
Fairfax County, January 2007
SewershedCode Population
HousingUnits Households Acres
Populationper Acre
Square Miles
Population perSquare Mile
R4 930 313 307 621 1.5 0.97 959
S1 29,026 10,959 10,720 4,997 5.8 7.81 3,716
S2 1,107 370 363 3,284 0.3 5.13 216
T1 5,597 1,915 1,857 6,438 0.9 10.06 556
T2 23,251 8,351 8,197 4,740 4.9 7.41 3,138
T3 16,318 5,855 5,732 5,264 3.1 8.22 1,985
T4 25,855 10,742 10,457 2,844 9.1 4.44 5,823
T5 25,505 10,491 10,250 3,557 7.2 5.56 4,587
T6 300 104 102 3,707 0.1 5.79 52
T7 6,647 2,538 2,482 3,789 1.8 5.92 1,123
Fairfax County 1,041,507 391,138 381,227 260,291 4.0 406.71 2,561
Source: Fairfax County Department of Systems Management for Human Services, 2007
Note: Households are occupied housing units. Area measurements (acres and square miles) includes both land and waterarea. Countywide totals may vary by table depending on how well the geographic layer aligns with actual countyboundaries.
1/ Includes the Town of Herndon.
2/ Comprises part of the Town of Vienna.
3/ Includes the Town of Clifton.
III-13
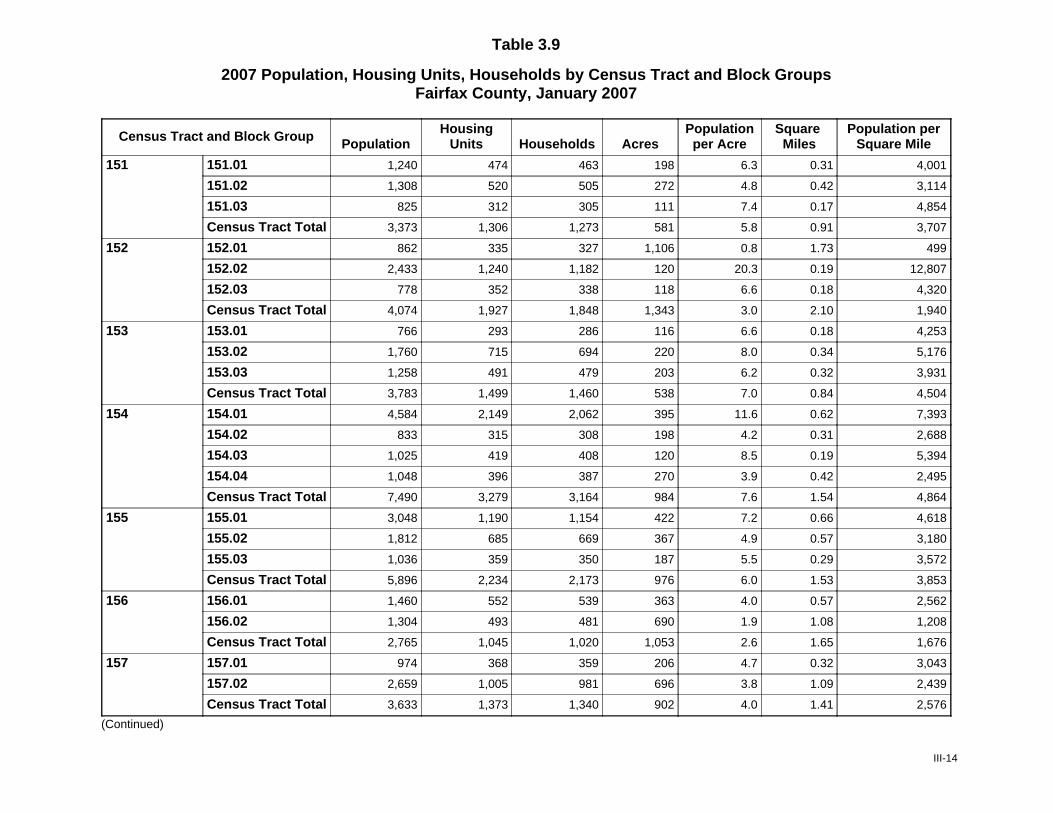
Table 3.9
2007 Population, Housing Units, Households by Census Tract and Block GroupsFairfax County, January 2007
Census Tract and Block Group PopulationHousing
Units Households AcresPopulationper Acre
Square Miles
Population perSquare Mile
151 151.01 1,240 474 463 198 6.3 0.31 4,001
151.02 1,308 520 505 272 4.8 0.42 3,114
151.03 825 312 305 111 7.4 0.17 4,854
Census Tract Total 3,373 1,306 1,273 581 5.8 0.91 3,707
152 152.01 862 335 327 1,106 0.8 1.73 499
152.02 2,433 1,240 1,182 120 20.3 0.19 12,807
152.03 778 352 338 118 6.6 0.18 4,320
Census Tract Total 4,074 1,927 1,848 1,343 3.0 2.10 1,940
153 153.01 766 293 286 116 6.6 0.18 4,253
153.02 1,760 715 694 220 8.0 0.34 5,176
153.03 1,258 491 479 203 6.2 0.32 3,931
Census Tract Total 3,783 1,499 1,460 538 7.0 0.84 4,504
154 154.01 4,584 2,149 2,062 395 11.6 0.62 7,393
154.02 833 315 308 198 4.2 0.31 2,688
154.03 1,025 419 408 120 8.5 0.19 5,394
154.04 1,048 396 387 270 3.9 0.42 2,495
Census Tract Total 7,490 3,279 3,164 984 7.6 1.54 4,864
155 155.01 3,048 1,190 1,154 422 7.2 0.66 4,618
155.02 1,812 685 669 367 4.9 0.57 3,180
155.03 1,036 359 350 187 5.5 0.29 3,572
Census Tract Total 5,896 2,234 2,173 976 6.0 1.53 3,853
156 156.01 1,460 552 539 363 4.0 0.57 2,562
156.02 1,304 493 481 690 1.9 1.08 1,208
Census Tract Total 2,765 1,045 1,020 1,053 2.6 1.65 1,676
157 157.01 974 368 359 206 4.7 0.32 3,043
157.02 2,659 1,005 981 696 3.8 1.09 2,439
Census Tract Total 3,633 1,373 1,340 902 4.0 1.41 2,576
(Continued)
III-14
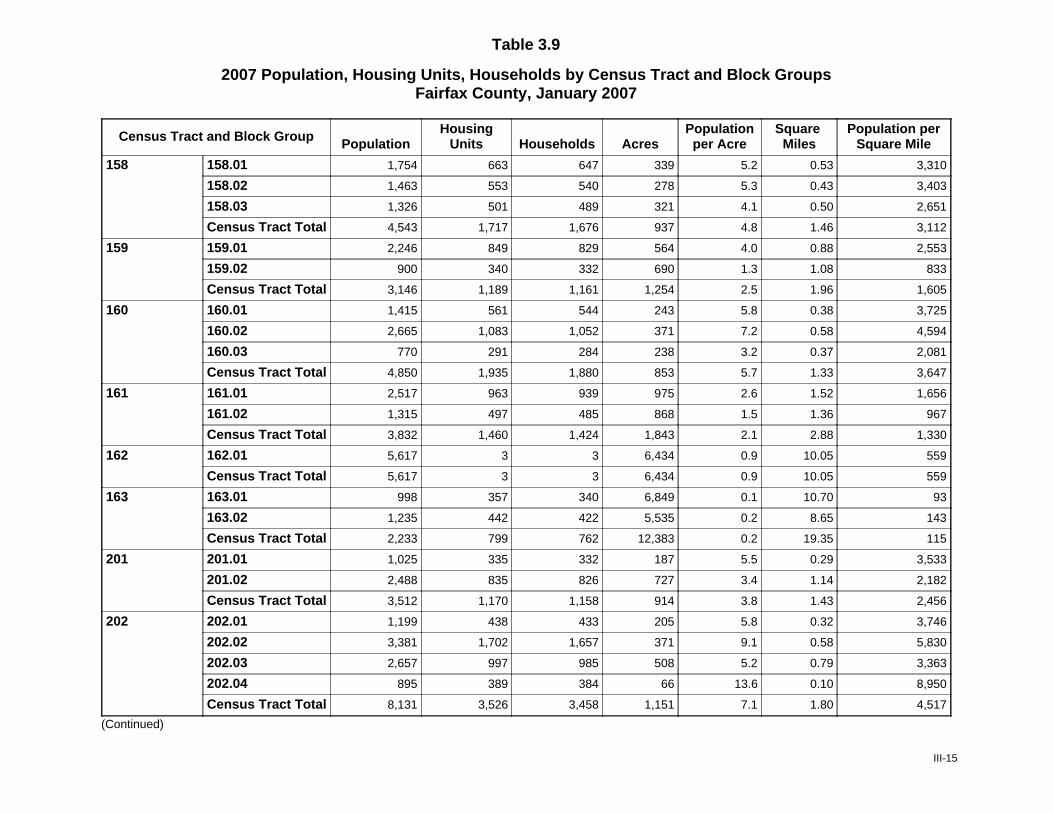
Table 3.9
2007 Population, Housing Units, Households by Census Tract and Block GroupsFairfax County, January 2007
Census Tract and Block Group PopulationHousing
Units Households AcresPopulationper Acre
Square Miles
Population perSquare Mile
158 158.01 1,754 663 647 339 5.2 0.53 3,310
158.02 1,463 553 540 278 5.3 0.43 3,403
158.03 1,326 501 489 321 4.1 0.50 2,651
Census Tract Total 4,543 1,717 1,676 937 4.8 1.46 3,112
159 159.01 2,246 849 829 564 4.0 0.88 2,553
159.02 900 340 332 690 1.3 1.08 833
Census Tract Total 3,146 1,189 1,161 1,254 2.5 1.96 1,605
160 160.01 1,415 561 544 243 5.8 0.38 3,725
160.02 2,665 1,083 1,052 371 7.2 0.58 4,594
160.03 770 291 284 238 3.2 0.37 2,081
Census Tract Total 4,850 1,935 1,880 853 5.7 1.33 3,647
161 161.01 2,517 963 939 975 2.6 1.52 1,656
161.02 1,315 497 485 868 1.5 1.36 967
Census Tract Total 3,832 1,460 1,424 1,843 2.1 2.88 1,330
162 162.01 5,617 3 3 6,434 0.9 10.05 559
Census Tract Total 5,617 3 3 6,434 0.9 10.05 559
163 163.01 998 357 340 6,849 0.1 10.70 93
163.02 1,235 442 422 5,535 0.2 8.65 143
Census Tract Total 2,233 799 762 12,383 0.2 19.35 115
201 201.01 1,025 335 332 187 5.5 0.29 3,533
201.02 2,488 835 826 727 3.4 1.14 2,182
Census Tract Total 3,512 1,170 1,158 914 3.8 1.43 2,456
202 202.01 1,199 438 433 205 5.8 0.32 3,746
202.02 3,381 1,702 1,657 371 9.1 0.58 5,830
202.03 2,657 997 985 508 5.2 0.79 3,363
202.04 895 389 384 66 13.6 0.10 8,950
Census Tract Total 8,131 3,526 3,458 1,151 7.1 1.80 4,517
(Continued)
III-15
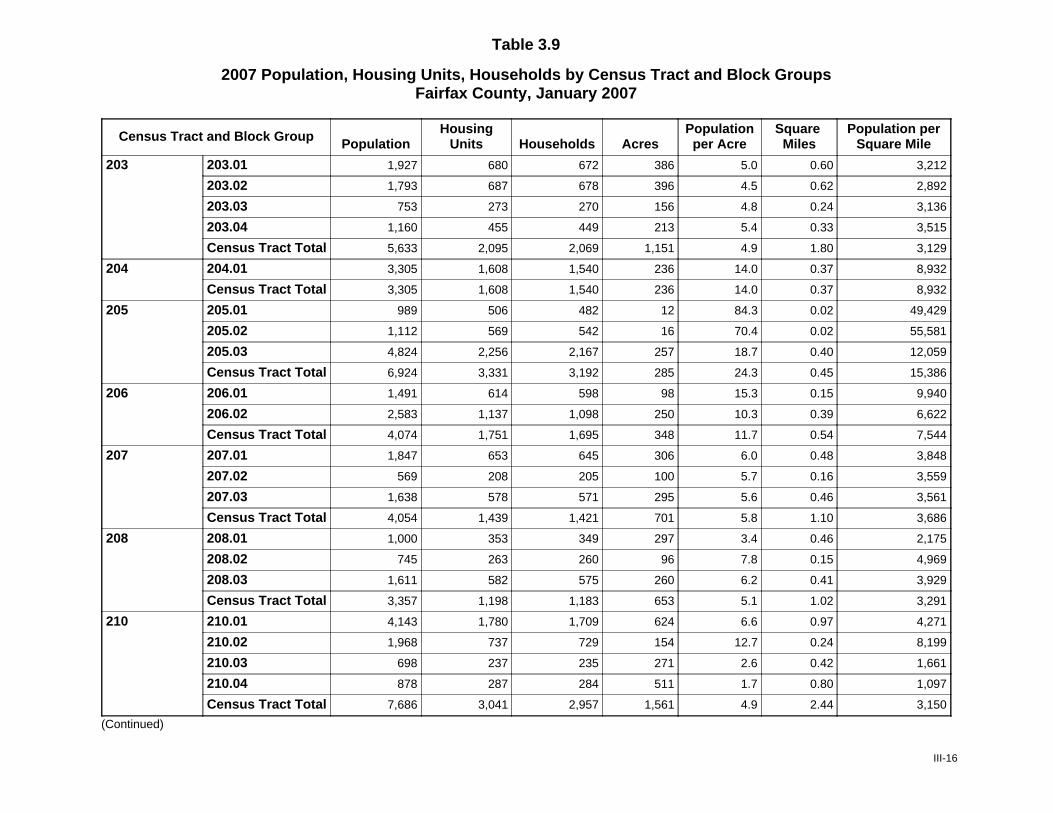
Table 3.9
2007 Population, Housing Units, Households by Census Tract and Block GroupsFairfax County, January 2007
Census Tract and Block Group PopulationHousing
Units Households AcresPopulationper Acre
Square Miles
Population perSquare Mile
203 203.01 1,927 680 672 386 5.0 0.60 3,212
203.02 1,793 687 678 396 4.5 0.62 2,892
203.03 753 273 270 156 4.8 0.24 3,136
203.04 1,160 455 449 213 5.4 0.33 3,515
Census Tract Total 5,633 2,095 2,069 1,151 4.9 1.80 3,129
204 204.01 3,305 1,608 1,540 236 14.0 0.37 8,932
Census Tract Total 3,305 1,608 1,540 236 14.0 0.37 8,932
205 205.01 989 506 482 12 84.3 0.02 49,429
205.02 1,112 569 542 16 70.4 0.02 55,581
205.03 4,824 2,256 2,167 257 18.7 0.40 12,059
Census Tract Total 6,924 3,331 3,192 285 24.3 0.45 15,386
206 206.01 1,491 614 598 98 15.3 0.15 9,940
206.02 2,583 1,137 1,098 250 10.3 0.39 6,622
Census Tract Total 4,074 1,751 1,695 348 11.7 0.54 7,544
207 207.01 1,847 653 645 306 6.0 0.48 3,848
207.02 569 208 205 100 5.7 0.16 3,559
207.03 1,638 578 571 295 5.6 0.46 3,561
Census Tract Total 4,054 1,439 1,421 701 5.8 1.10 3,686
208 208.01 1,000 353 349 297 3.4 0.46 2,175
208.02 745 263 260 96 7.8 0.15 4,969
208.03 1,611 582 575 260 6.2 0.41 3,929
Census Tract Total 3,357 1,198 1,183 653 5.1 1.02 3,291
210 210.01 4,143 1,780 1,709 624 6.6 0.97 4,271
210.02 1,968 737 729 154 12.7 0.24 8,199
210.03 698 237 235 271 2.6 0.42 1,661
210.04 878 287 284 511 1.7 0.80 1,097
Census Tract Total 7,686 3,041 2,957 1,561 4.9 2.44 3,150
(Continued)
III-16
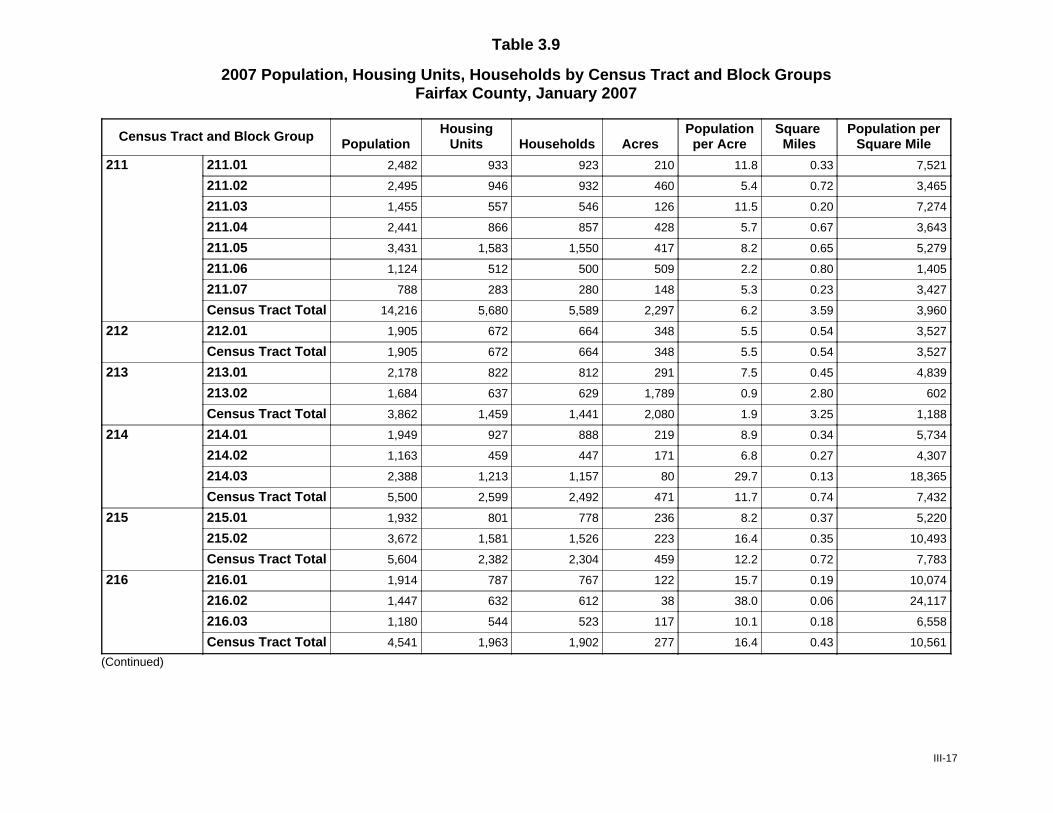
Table 3.9
2007 Population, Housing Units, Households by Census Tract and Block GroupsFairfax County, January 2007
Census Tract and Block Group PopulationHousing
Units Households AcresPopulationper Acre
Square Miles
Population perSquare Mile
211 211.01 2,482 933 923 210 11.8 0.33 7,521
211.02 2,495 946 932 460 5.4 0.72 3,465
211.03 1,455 557 546 126 11.5 0.20 7,274
211.04 2,441 866 857 428 5.7 0.67 3,643
211.05 3,431 1,583 1,550 417 8.2 0.65 5,279
211.06 1,124 512 500 509 2.2 0.80 1,405
211.07 788 283 280 148 5.3 0.23 3,427
Census Tract Total 14,216 5,680 5,589 2,297 6.2 3.59 3,960
212 212.01 1,905 672 664 348 5.5 0.54 3,527
Census Tract Total 1,905 672 664 348 5.5 0.54 3,527
213 213.01 2,178 822 812 291 7.5 0.45 4,839
213.02 1,684 637 629 1,789 0.9 2.80 602
Census Tract Total 3,862 1,459 1,441 2,080 1.9 3.25 1,188
214 214.01 1,949 927 888 219 8.9 0.34 5,734
214.02 1,163 459 447 171 6.8 0.27 4,307
214.03 2,388 1,213 1,157 80 29.7 0.13 18,365
Census Tract Total 5,500 2,599 2,492 471 11.7 0.74 7,432
215 215.01 1,932 801 778 236 8.2 0.37 5,220
215.02 3,672 1,581 1,526 223 16.4 0.35 10,493
Census Tract Total 5,604 2,382 2,304 459 12.2 0.72 7,783
216 216.01 1,914 787 767 122 15.7 0.19 10,074
216.02 1,447 632 612 38 38.0 0.06 24,117
216.03 1,180 544 523 117 10.1 0.18 6,558
Census Tract Total 4,541 1,963 1,902 277 16.4 0.43 10,561
(Continued)
III-17
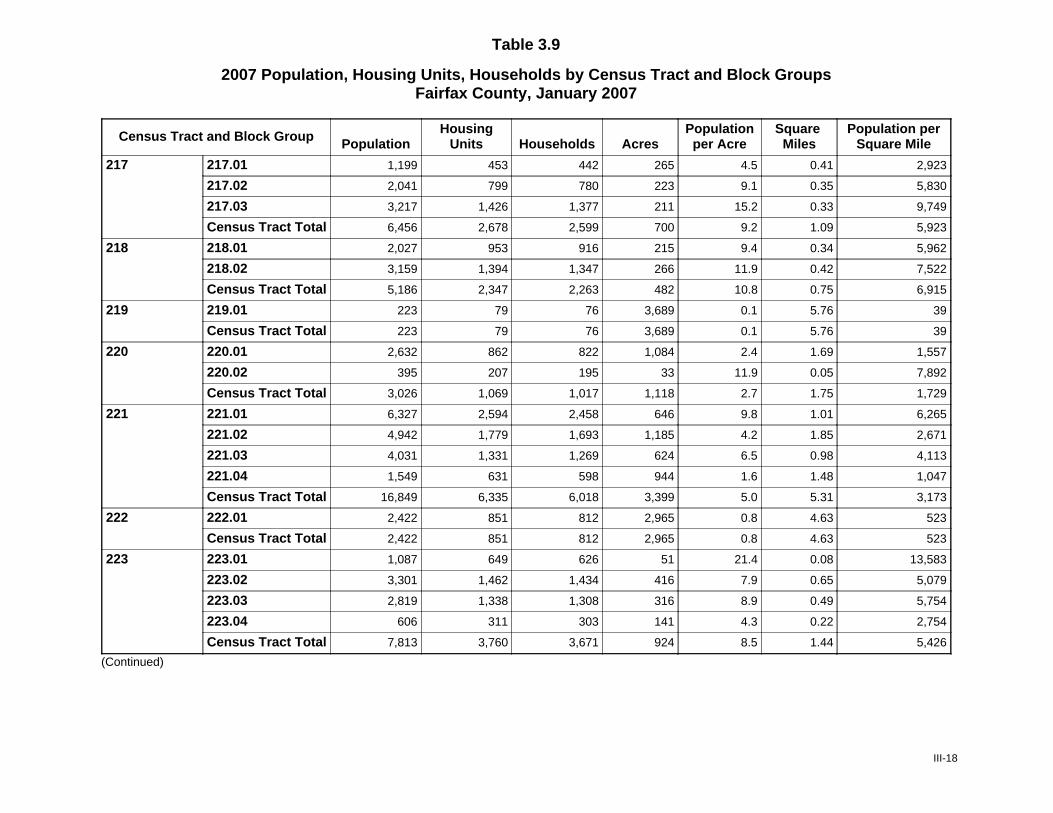
Table 3.9
2007 Population, Housing Units, Households by Census Tract and Block GroupsFairfax County, January 2007
Census Tract and Block Group PopulationHousing
Units Households AcresPopulationper Acre
Square Miles
Population perSquare Mile
217 217.01 1,199 453 442 265 4.5 0.41 2,923
217.02 2,041 799 780 223 9.1 0.35 5,830
217.03 3,217 1,426 1,377 211 15.2 0.33 9,749
Census Tract Total 6,456 2,678 2,599 700 9.2 1.09 5,923
218 218.01 2,027 953 916 215 9.4 0.34 5,962
218.02 3,159 1,394 1,347 266 11.9 0.42 7,522
Census Tract Total 5,186 2,347 2,263 482 10.8 0.75 6,915
219 219.01 223 79 76 3,689 0.1 5.76 39
Census Tract Total 223 79 76 3,689 0.1 5.76 39
220 220.01 2,632 862 822 1,084 2.4 1.69 1,557
220.02 395 207 195 33 11.9 0.05 7,892
Census Tract Total 3,026 1,069 1,017 1,118 2.7 1.75 1,729
221 221.01 6,327 2,594 2,458 646 9.8 1.01 6,265
221.02 4,942 1,779 1,693 1,185 4.2 1.85 2,671
221.03 4,031 1,331 1,269 624 6.5 0.98 4,113
221.04 1,549 631 598 944 1.6 1.48 1,047
Census Tract Total 16,849 6,335 6,018 3,399 5.0 5.31 3,173
222 222.01 2,422 851 812 2,965 0.8 4.63 523
Census Tract Total 2,422 851 812 2,965 0.8 4.63 523
223 223.01 1,087 649 626 51 21.4 0.08 13,583
223.02 3,301 1,462 1,434 416 7.9 0.65 5,079
223.03 2,819 1,338 1,308 316 8.9 0.49 5,754
223.04 606 311 303 141 4.3 0.22 2,754
Census Tract Total 7,813 3,760 3,671 924 8.5 1.44 5,426
(Continued)
III-18
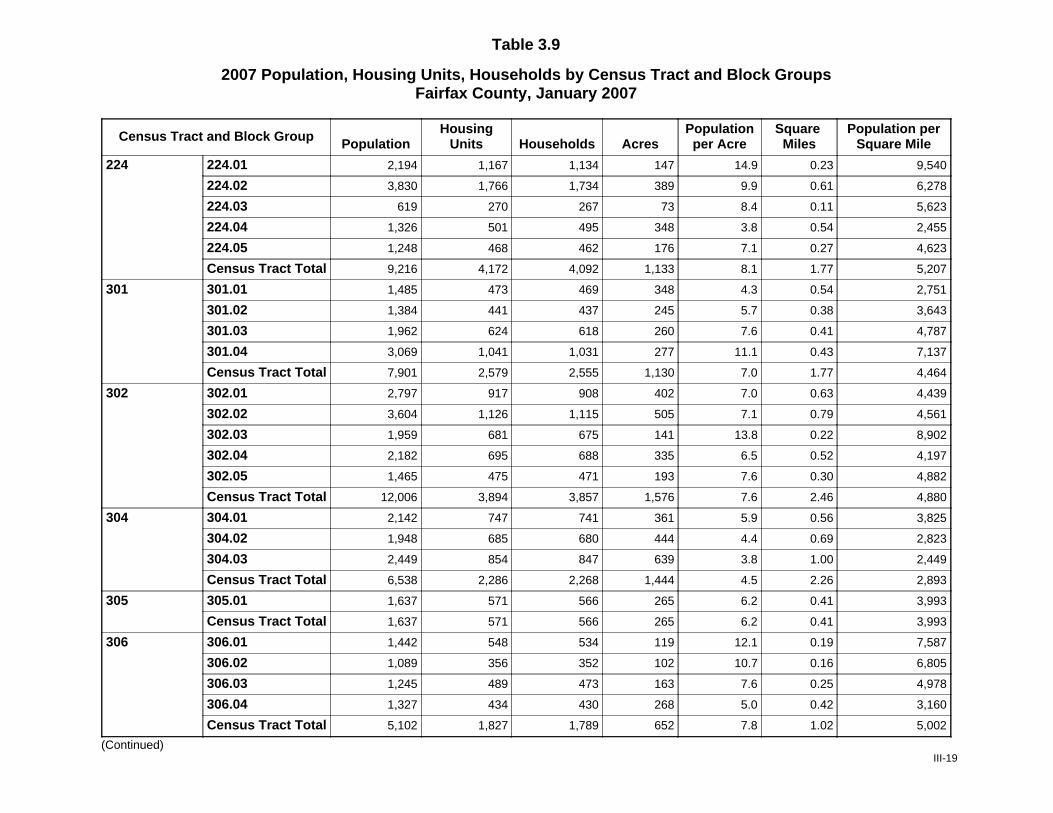
Table 3.9
2007 Population, Housing Units, Households by Census Tract and Block GroupsFairfax County, January 2007
Census Tract and Block Group PopulationHousing
Units Households AcresPopulationper Acre
Square Miles
Population perSquare Mile
224 224.01 2,194 1,167 1,134 147 14.9 0.23 9,540
224.02 3,830 1,766 1,734 389 9.9 0.61 6,278
224.03 619 270 267 73 8.4 0.11 5,623
224.04 1,326 501 495 348 3.8 0.54 2,455
224.05 1,248 468 462 176 7.1 0.27 4,623
Census Tract Total 9,216 4,172 4,092 1,133 8.1 1.77 5,207
301 301.01 1,485 473 469 348 4.3 0.54 2,751
301.02 1,384 441 437 245 5.7 0.38 3,643
301.03 1,962 624 618 260 7.6 0.41 4,787
301.04 3,069 1,041 1,031 277 11.1 0.43 7,137
Census Tract Total 7,901 2,579 2,555 1,130 7.0 1.77 4,464
302 302.01 2,797 917 908 402 7.0 0.63 4,439
302.02 3,604 1,126 1,115 505 7.1 0.79 4,561
302.03 1,959 681 675 141 13.8 0.22 8,902
302.04 2,182 695 688 335 6.5 0.52 4,197
302.05 1,465 475 471 193 7.6 0.30 4,882
Census Tract Total 12,006 3,894 3,857 1,576 7.6 2.46 4,880
304 304.01 2,142 747 741 361 5.9 0.56 3,825
304.02 1,948 685 680 444 4.4 0.69 2,823
304.03 2,449 854 847 639 3.8 1.00 2,449
Census Tract Total 6,538 2,286 2,268 1,444 4.5 2.26 2,893
305 305.01 1,637 571 566 265 6.2 0.41 3,993
Census Tract Total 1,637 571 566 265 6.2 0.41 3,993
306 306.01 1,442 548 534 119 12.1 0.19 7,587
306.02 1,089 356 352 102 10.7 0.16 6,805
306.03 1,245 489 473 163 7.6 0.25 4,978
306.04 1,327 434 430 268 5.0 0.42 3,160
Census Tract Total 5,102 1,827 1,789 652 7.8 1.02 5,002
(Continued)III-19
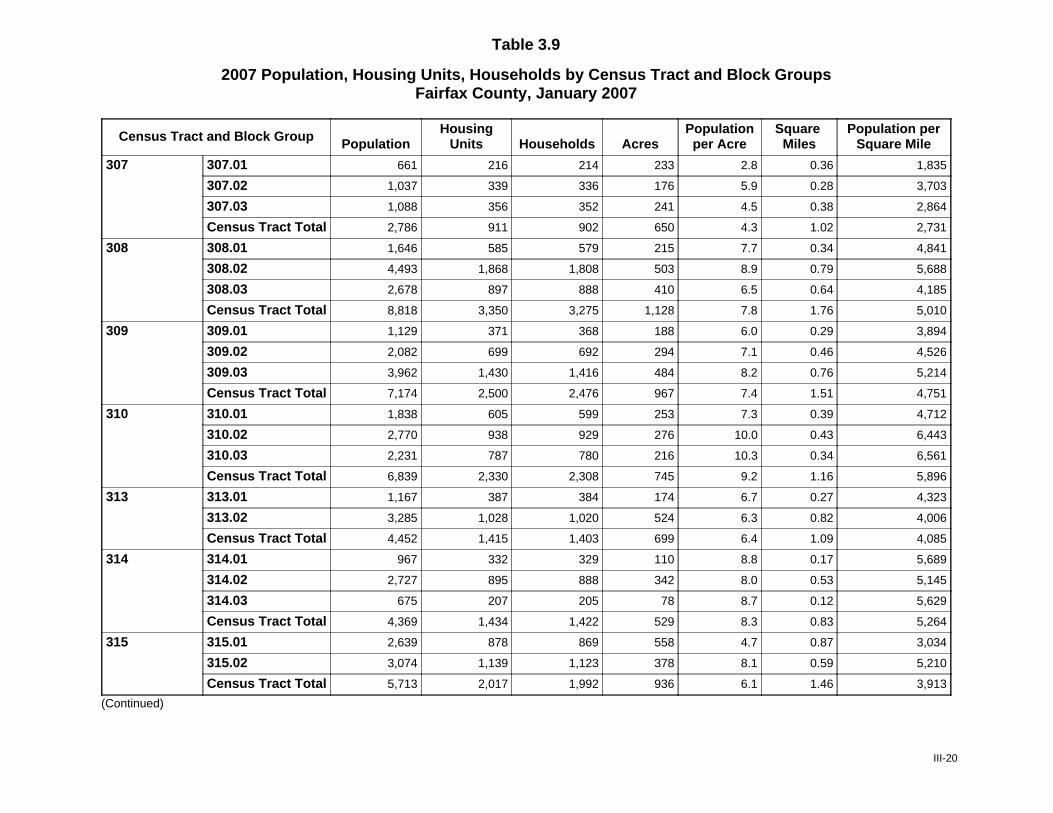
Table 3.9
2007 Population, Housing Units, Households by Census Tract and Block GroupsFairfax County, January 2007
Census Tract and Block Group PopulationHousing
Units Households AcresPopulationper Acre
Square Miles
Population perSquare Mile
307 307.01 661 216 214 233 2.8 0.36 1,835
307.02 1,037 339 336 176 5.9 0.28 3,703
307.03 1,088 356 352 241 4.5 0.38 2,864
Census Tract Total 2,786 911 902 650 4.3 1.02 2,731
308 308.01 1,646 585 579 215 7.7 0.34 4,841
308.02 4,493 1,868 1,808 503 8.9 0.79 5,688
308.03 2,678 897 888 410 6.5 0.64 4,185
Census Tract Total 8,818 3,350 3,275 1,128 7.8 1.76 5,010
309 309.01 1,129 371 368 188 6.0 0.29 3,894
309.02 2,082 699 692 294 7.1 0.46 4,526
309.03 3,962 1,430 1,416 484 8.2 0.76 5,214
Census Tract Total 7,174 2,500 2,476 967 7.4 1.51 4,751
310 310.01 1,838 605 599 253 7.3 0.39 4,712
310.02 2,770 938 929 276 10.0 0.43 6,443
310.03 2,231 787 780 216 10.3 0.34 6,561
Census Tract Total 6,839 2,330 2,308 745 9.2 1.16 5,896
313 313.01 1,167 387 384 174 6.7 0.27 4,323
313.02 3,285 1,028 1,020 524 6.3 0.82 4,006
Census Tract Total 4,452 1,415 1,403 699 6.4 1.09 4,085
314 314.01 967 332 329 110 8.8 0.17 5,689
314.02 2,727 895 888 342 8.0 0.53 5,145
314.03 675 207 205 78 8.7 0.12 5,629
Census Tract Total 4,369 1,434 1,422 529 8.3 0.83 5,264
315 315.01 2,639 878 869 558 4.7 0.87 3,034
315.02 3,074 1,139 1,123 378 8.1 0.59 5,210
Census Tract Total 5,713 2,017 1,992 936 6.1 1.46 3,913
(Continued)
III-20
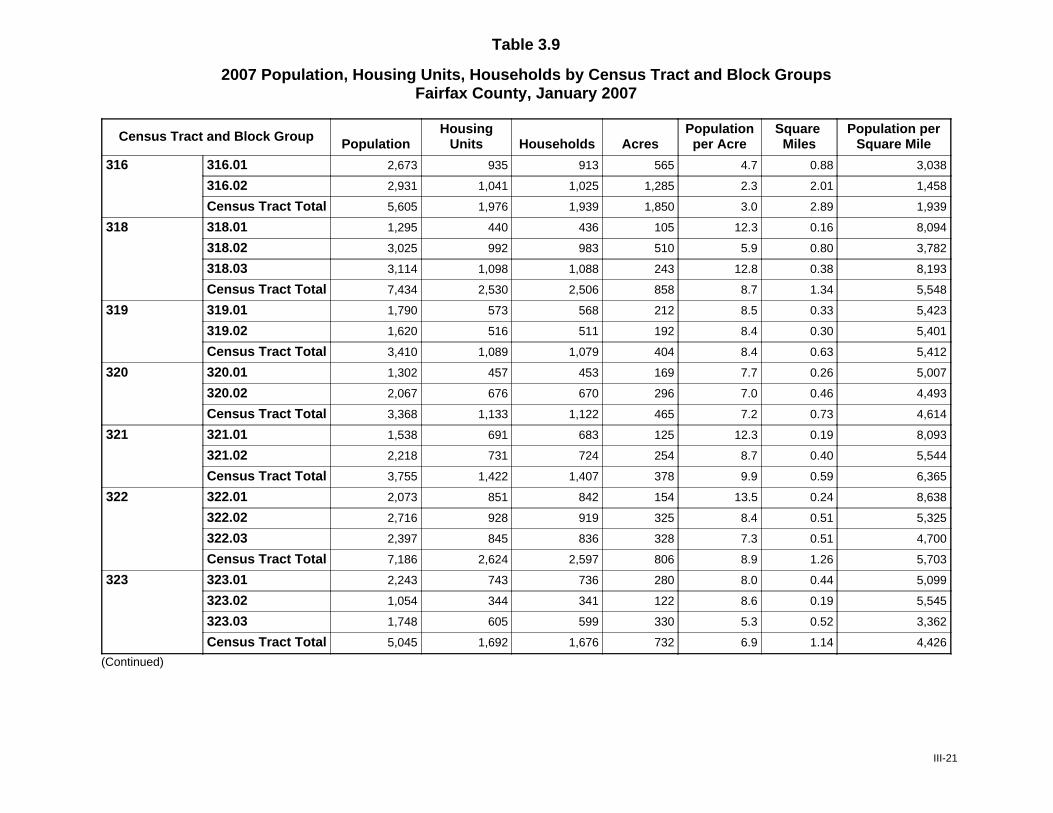
Table 3.9
2007 Population, Housing Units, Households by Census Tract and Block GroupsFairfax County, January 2007
Census Tract and Block Group PopulationHousing
Units Households AcresPopulationper Acre
Square Miles
Population perSquare Mile
316 316.01 2,673 935 913 565 4.7 0.88 3,038
316.02 2,931 1,041 1,025 1,285 2.3 2.01 1,458
Census Tract Total 5,605 1,976 1,939 1,850 3.0 2.89 1,939
318 318.01 1,295 440 436 105 12.3 0.16 8,094
318.02 3,025 992 983 510 5.9 0.80 3,782
318.03 3,114 1,098 1,088 243 12.8 0.38 8,193
Census Tract Total 7,434 2,530 2,506 858 8.7 1.34 5,548
319 319.01 1,790 573 568 212 8.5 0.33 5,423
319.02 1,620 516 511 192 8.4 0.30 5,401
Census Tract Total 3,410 1,089 1,079 404 8.4 0.63 5,412
320 320.01 1,302 457 453 169 7.7 0.26 5,007
320.02 2,067 676 670 296 7.0 0.46 4,493
Census Tract Total 3,368 1,133 1,122 465 7.2 0.73 4,614
321 321.01 1,538 691 683 125 12.3 0.19 8,093
321.02 2,218 731 724 254 8.7 0.40 5,544
Census Tract Total 3,755 1,422 1,407 378 9.9 0.59 6,365
322 322.01 2,073 851 842 154 13.5 0.24 8,638
322.02 2,716 928 919 325 8.4 0.51 5,325
322.03 2,397 845 836 328 7.3 0.51 4,700
Census Tract Total 7,186 2,624 2,597 806 8.9 1.26 5,703
323 323.01 2,243 743 736 280 8.0 0.44 5,099
323.02 1,054 344 341 122 8.6 0.19 5,545
323.03 1,748 605 599 330 5.3 0.52 3,362
Census Tract Total 5,045 1,692 1,676 732 6.9 1.14 4,426
(Continued)
III-21
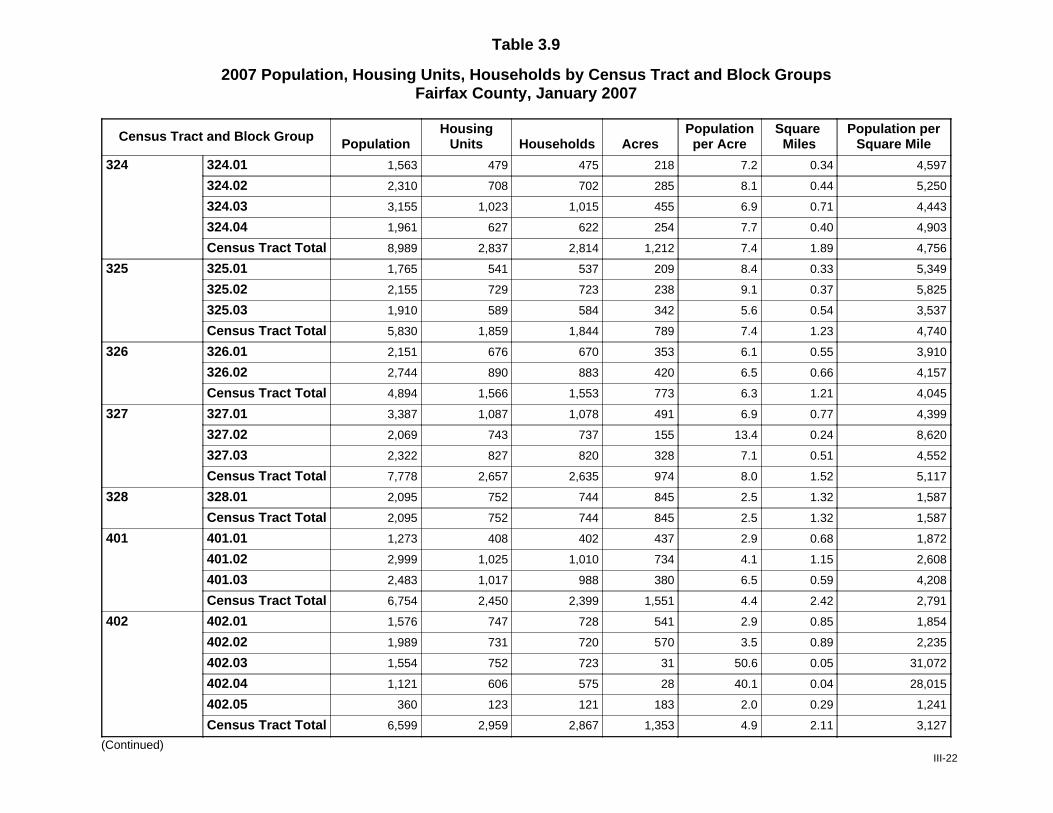
Table 3.9
2007 Population, Housing Units, Households by Census Tract and Block GroupsFairfax County, January 2007
Census Tract and Block Group PopulationHousing
Units Households AcresPopulationper Acre
Square Miles
Population perSquare Mile
324 324.01 1,563 479 475 218 7.2 0.34 4,597
324.02 2,310 708 702 285 8.1 0.44 5,250
324.03 3,155 1,023 1,015 455 6.9 0.71 4,443
324.04 1,961 627 622 254 7.7 0.40 4,903
Census Tract Total 8,989 2,837 2,814 1,212 7.4 1.89 4,756
325 325.01 1,765 541 537 209 8.4 0.33 5,349
325.02 2,155 729 723 238 9.1 0.37 5,825
325.03 1,910 589 584 342 5.6 0.54 3,537
Census Tract Total 5,830 1,859 1,844 789 7.4 1.23 4,740
326 326.01 2,151 676 670 353 6.1 0.55 3,910
326.02 2,744 890 883 420 6.5 0.66 4,157
Census Tract Total 4,894 1,566 1,553 773 6.3 1.21 4,045
327 327.01 3,387 1,087 1,078 491 6.9 0.77 4,399
327.02 2,069 743 737 155 13.4 0.24 8,620
327.03 2,322 827 820 328 7.1 0.51 4,552
Census Tract Total 7,778 2,657 2,635 974 8.0 1.52 5,117
328 328.01 2,095 752 744 845 2.5 1.32 1,587
Census Tract Total 2,095 752 744 845 2.5 1.32 1,587
401 401.01 1,273 408 402 437 2.9 0.68 1,872
401.02 2,999 1,025 1,010 734 4.1 1.15 2,608
401.03 2,483 1,017 988 380 6.5 0.59 4,208
Census Tract Total 6,754 2,450 2,399 1,551 4.4 2.42 2,791
402 402.01 1,576 747 728 541 2.9 0.85 1,854
402.02 1,989 731 720 570 3.5 0.89 2,235
402.03 1,554 752 723 31 50.6 0.05 31,072
402.04 1,121 606 575 28 40.1 0.04 28,015
402.05 360 123 121 183 2.0 0.29 1,241
Census Tract Total 6,599 2,959 2,867 1,353 4.9 2.11 3,127
(Continued)III-22
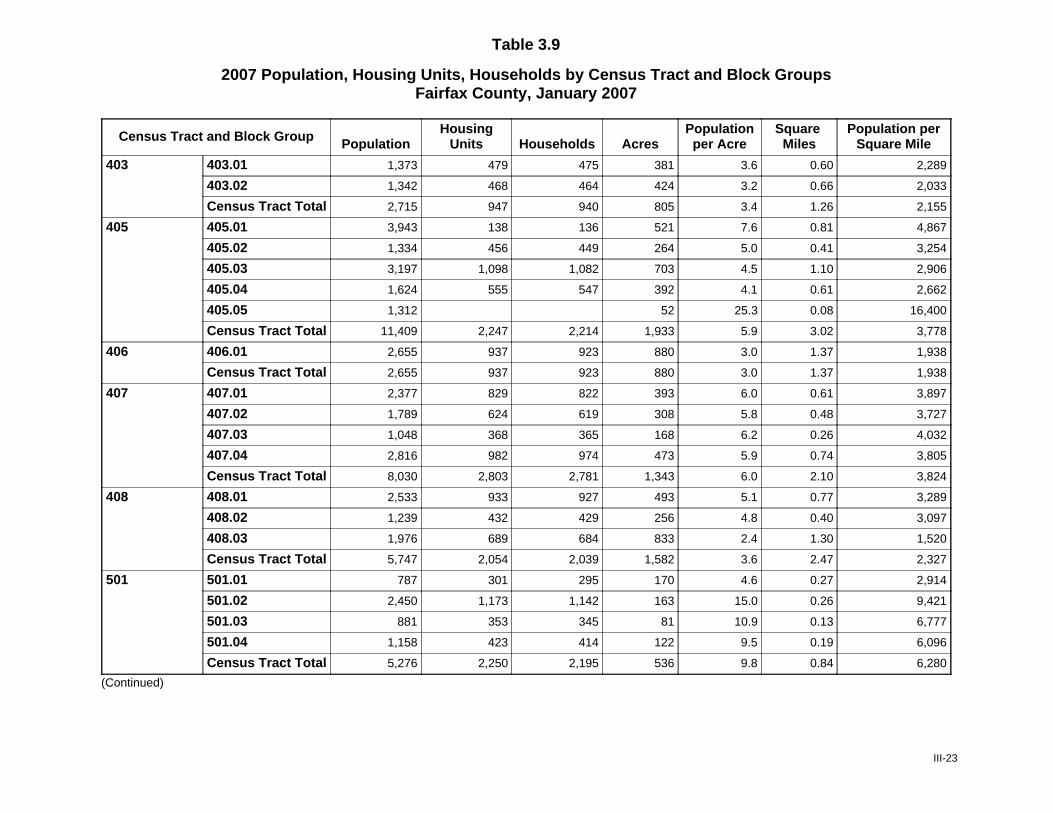
Table 3.9
2007 Population, Housing Units, Households by Census Tract and Block GroupsFairfax County, January 2007
Census Tract and Block Group PopulationHousing
Units Households AcresPopulationper Acre
Square Miles
Population perSquare Mile
403 403.01 1,373 479 475 381 3.6 0.60 2,289
403.02 1,342 468 464 424 3.2 0.66 2,033
Census Tract Total 2,715 947 940 805 3.4 1.26 2,155
405 405.01 3,943 138 136 521 7.6 0.81 4,867
405.02 1,334 456 449 264 5.0 0.41 3,254
405.03 3,197 1,098 1,082 703 4.5 1.10 2,906
405.04 1,624 555 547 392 4.1 0.61 2,662
405.05 1,312 52 25.3 0.08 16,400
Census Tract Total 11,409 2,247 2,214 1,933 5.9 3.02 3,778
406 406.01 2,655 937 923 880 3.0 1.37 1,938
Census Tract Total 2,655 937 923 880 3.0 1.37 1,938
407 407.01 2,377 829 822 393 6.0 0.61 3,897
407.02 1,789 624 619 308 5.8 0.48 3,727
407.03 1,048 368 365 168 6.2 0.26 4,032
407.04 2,816 982 974 473 5.9 0.74 3,805
Census Tract Total 8,030 2,803 2,781 1,343 6.0 2.10 3,824
408 408.01 2,533 933 927 493 5.1 0.77 3,289
408.02 1,239 432 429 256 4.8 0.40 3,097
408.03 1,976 689 684 833 2.4 1.30 1,520
Census Tract Total 5,747 2,054 2,039 1,582 3.6 2.47 2,327
501 501.01 787 301 295 170 4.6 0.27 2,914
501.02 2,450 1,173 1,142 163 15.0 0.26 9,421
501.03 881 353 345 81 10.9 0.13 6,777
501.04 1,158 423 414 122 9.5 0.19 6,096
Census Tract Total 5,276 2,250 2,195 536 9.8 0.84 6,280
(Continued)
III-23
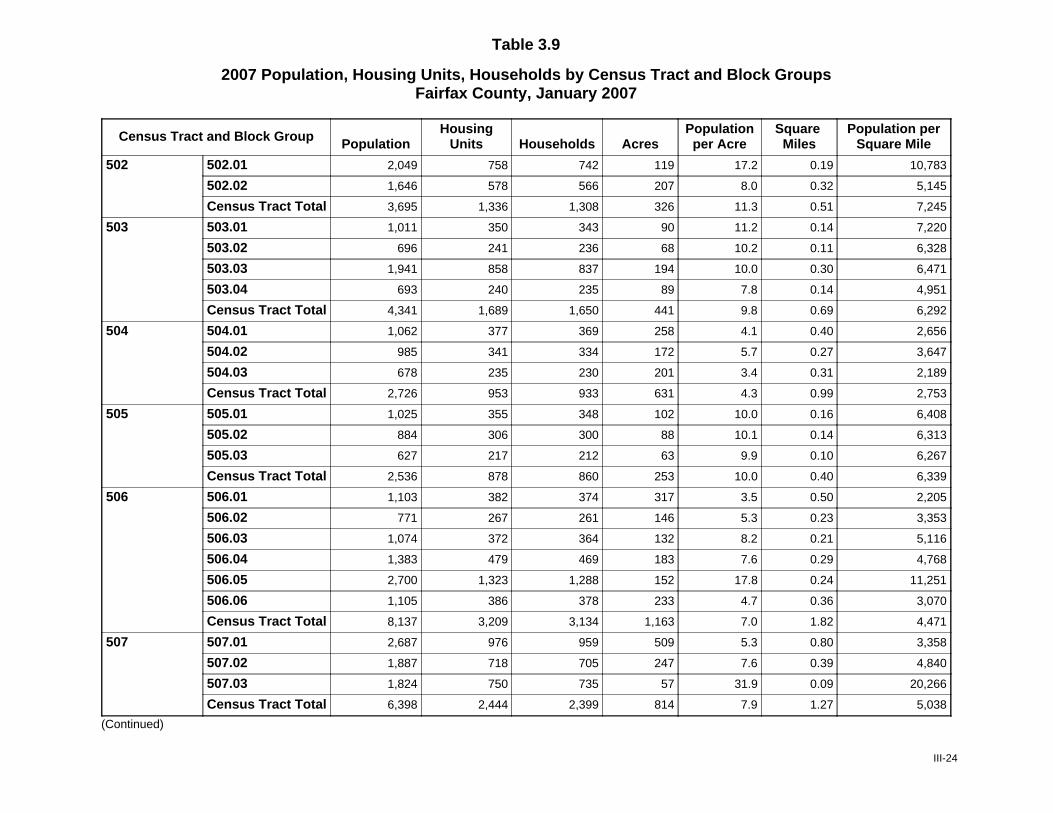
Table 3.9
2007 Population, Housing Units, Households by Census Tract and Block GroupsFairfax County, January 2007
Census Tract and Block Group PopulationHousing
Units Households AcresPopulationper Acre
Square Miles
Population perSquare Mile
502 502.01 2,049 758 742 119 17.2 0.19 10,783
502.02 1,646 578 566 207 8.0 0.32 5,145
Census Tract Total 3,695 1,336 1,308 326 11.3 0.51 7,245
503 503.01 1,011 350 343 90 11.2 0.14 7,220
503.02 696 241 236 68 10.2 0.11 6,328
503.03 1,941 858 837 194 10.0 0.30 6,471
503.04 693 240 235 89 7.8 0.14 4,951
Census Tract Total 4,341 1,689 1,650 441 9.8 0.69 6,292
504 504.01 1,062 377 369 258 4.1 0.40 2,656
504.02 985 341 334 172 5.7 0.27 3,647
504.03 678 235 230 201 3.4 0.31 2,189
Census Tract Total 2,726 953 933 631 4.3 0.99 2,753
505 505.01 1,025 355 348 102 10.0 0.16 6,408
505.02 884 306 300 88 10.1 0.14 6,313
505.03 627 217 212 63 9.9 0.10 6,267
Census Tract Total 2,536 878 860 253 10.0 0.40 6,339
506 506.01 1,103 382 374 317 3.5 0.50 2,205
506.02 771 267 261 146 5.3 0.23 3,353
506.03 1,074 372 364 132 8.2 0.21 5,116
506.04 1,383 479 469 183 7.6 0.29 4,768
506.05 2,700 1,323 1,288 152 17.8 0.24 11,251
506.06 1,105 386 378 233 4.7 0.36 3,070
Census Tract Total 8,137 3,209 3,134 1,163 7.0 1.82 4,471
507 507.01 2,687 976 959 509 5.3 0.80 3,358
507.02 1,887 718 705 247 7.6 0.39 4,840
507.03 1,824 750 735 57 31.9 0.09 20,266
Census Tract Total 6,398 2,444 2,399 814 7.9 1.27 5,038
(Continued)
III-24

Table 3.9
2007 Population, Housing Units, Households by Census Tract and Block GroupsFairfax County, January 2007
Census Tract and Block Group PopulationHousing
Units Households AcresPopulationper Acre
Square Miles
Population perSquare Mile
508 508.01 863 306 301 141 6.1 0.22 3,922
508.02 1,308 464 456 215 6.1 0.34 3,848
508.03 1,144 432 424 152 7.5 0.24 4,766
Census Tract Total 3,315 1,202 1,181 508 6.5 0.79 4,196
509 509.01 875 303 297 168 5.2 0.26 3,366
509.02 861 298 292 194 4.4 0.30 2,869
Census Tract Total 1,736 601 588 362 4.8 0.57 3,045
510 510.01 1,136 403 396 171 6.6 0.27 4,209
510.02 1,614 494 485 260 6.2 0.41 3,937
Census Tract Total 2,750 897 881 432 6.4 0.67 4,105
511 511.01 1,030 362 356 206 5.0 0.32 3,218
511.02 1,334 469 462 263 5.1 0.41 3,254
Census Tract Total 2,364 831 818 469 5.0 0.73 3,239
512 512.01 981 345 340 299 3.3 0.47 2,088
512.02 834 293 288 227 3.7 0.35 2,382
Census Tract Total 1,815 638 628 526 3.5 0.82 2,213
513 513.01 1,210 425 418 251 4.8 0.39 3,103
513.02 1,336 490 480 197 6.8 0.31 4,311
Census Tract Total 2,546 915 898 448 5.7 0.70 3,638
514 514.01 2,282 1,053 1,014 76 30.0 0.12 19,019
514.02 643 252 245 55 11.8 0.09 7,149
Census Tract Total 2,926 1,305 1,259 131 22.4 0.20 14,628
515 515.01 2,164 965 932 111 19.5 0.17 12,732
515.02 3,186 1,302 1,264 199 16.0 0.31 10,277
515.03 2,171 828 808 274 7.9 0.43 5,049
515.04 2,201 966 932 170 12.9 0.27 8,151
Census Tract Total 9,722 4,061 3,935 755 12.9 1.18 8,239
(Continued)
III-25

Table 3.9
2007 Population, Housing Units, Households by Census Tract and Block GroupsFairfax County, January 2007
Census Tract and Block Group PopulationHousing
Units Households AcresPopulationper Acre
Square Miles
Population perSquare Mile
516 516.01 1,846 844 814 72 25.6 0.11 16,784
516.02 1,894 801 776 153 12.4 0.24 7,891
516.03 1,590 682 660 131 12.1 0.20 7,950
516.04 963 385 375 164 5.9 0.26 3,702
Census Tract Total 6,292 2,712 2,625 520 12.1 0.81 7,768
518 518.01 1,345 468 461 199 6.8 0.31 4,338
518.02 1,801 633 623 395 4.6 0.62 2,905
Census Tract Total 3,145 1,101 1,084 594 5.3 0.93 3,382
519 519.01 3,199 1,100 1,079 332 9.6 0.52 6,152
519.02 3,376 1,196 1,170 363 9.3 0.57 5,923
Census Tract Total 6,575 2,296 2,249 696 9.5 1.09 6,032
520 520.01 3,016 1,120 1,100 585 5.2 0.91 3,315
Census Tract Total 3,016 1,120 1,100 585 5.2 0.91 3,315
521 521.01 3,002 1,046 1,027 572 5.2 0.89 3,373
521.02 1,670 600 590 336 5.0 0.53 3,151
521.03 1,714 629 618 214 8.0 0.33 5,194
521.04 1,116 403 396 293 3.8 0.46 2,426
Census Tract Total 7,503 2,678 2,631 1,415 5.3 2.21 3,395
522 522.01 2,041 815 799 142 14.4 0.22 9,278
522.02 1,633 627 616 100 16.3 0.16 10,206
522.03 1,077 382 375 176 6.1 0.28 3,847
522.04 911 323 317 159 5.7 0.25 3,643
Census Tract Total 5,662 2,147 2,108 578 9.8 0.90 6,291
523 523.01 3,157 1,296 1,271 101 31.3 0.16 19,728
523.02 535 209 205 147 3.6 0.23 2,328
523.03 4,157 1,678 1,646 61 67.6 0.10 41,575
Census Tract Total 7,849 3,183 3,122 310 25.3 0.48 16,353
(Continued)
III-26
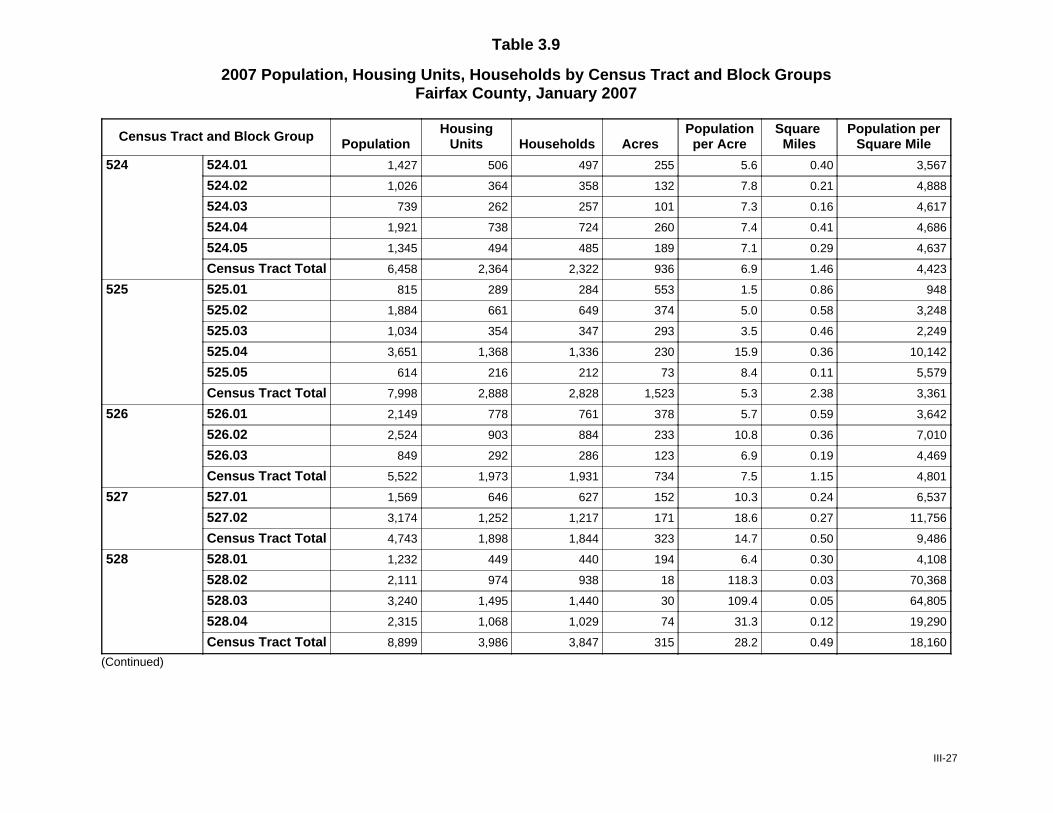
Table 3.9
2007 Population, Housing Units, Households by Census Tract and Block GroupsFairfax County, January 2007
Census Tract and Block Group PopulationHousing
Units Households AcresPopulationper Acre
Square Miles
Population perSquare Mile
524 524.01 1,427 506 497 255 5.6 0.40 3,567
524.02 1,026 364 358 132 7.8 0.21 4,888
524.03 739 262 257 101 7.3 0.16 4,617
524.04 1,921 738 724 260 7.4 0.41 4,686
524.05 1,345 494 485 189 7.1 0.29 4,637
Census Tract Total 6,458 2,364 2,322 936 6.9 1.46 4,423
525 525.01 815 289 284 553 1.5 0.86 948
525.02 1,884 661 649 374 5.0 0.58 3,248
525.03 1,034 354 347 293 3.5 0.46 2,249
525.04 3,651 1,368 1,336 230 15.9 0.36 10,142
525.05 614 216 212 73 8.4 0.11 5,579
Census Tract Total 7,998 2,888 2,828 1,523 5.3 2.38 3,361
526 526.01 2,149 778 761 378 5.7 0.59 3,642
526.02 2,524 903 884 233 10.8 0.36 7,010
526.03 849 292 286 123 6.9 0.19 4,469
Census Tract Total 5,522 1,973 1,931 734 7.5 1.15 4,801
527 527.01 1,569 646 627 152 10.3 0.24 6,537
527.02 3,174 1,252 1,217 171 18.6 0.27 11,756
Census Tract Total 4,743 1,898 1,844 323 14.7 0.50 9,486
528 528.01 1,232 449 440 194 6.4 0.30 4,108
528.02 2,111 974 938 18 118.3 0.03 70,368
528.03 3,240 1,495 1,440 30 109.4 0.05 64,805
528.04 2,315 1,068 1,029 74 31.3 0.12 19,290
Census Tract Total 8,899 3,986 3,847 315 28.2 0.49 18,160
(Continued)
III-27

Table 3.9
2007 Population, Housing Units, Households by Census Tract and Block GroupsFairfax County, January 2007
Census Tract and Block Group PopulationHousing
Units Households AcresPopulationper Acre
Square Miles
Population perSquare Mile
601 601.01 1,124 397 388 550 2.0 0.86 1,307
601.02 1,823 645 631 625 2.9 0.98 1,860
601.03 1,065 379 371 466 2.3 0.73 1,458
Census Tract Total 4,011 1,421 1,390 1,641 2.4 2.56 1,567
602 602.01 1,946 668 657 1,078 1.8 1.68 1,158
602.02 1,876 644 634 918 2.0 1.43 1,312
Census Tract Total 3,822 1,312 1,291 1,996 1.9 3.12 1,225
603 603.01 778 267 263 213 3.6 0.33 2,357
603.02 2,019 693 682 363 5.6 0.57 3,542
Census Tract Total 2,797 960 945 576 4.9 0.90 3,107
604 604.01 1,465 503 495 446 3.3 0.70 2,093
604.02 3,624 1,480 1,419 554 6.5 0.87 4,166
Census Tract Total 5,090 1,983 1,914 1,001 5.1 1.56 3,263
605 605.01 2,521 874 860 559 4.5 0.87 2,897
605.02 2,033 752 740 264 7.7 0.41 4,958
605.03 1,674 595 586 246 6.8 0.38 4,406
605.04 2,412 880 866 353 6.8 0.55 4,385
Census Tract Total 8,639 3,101 3,052 1,422 6.1 2.22 3,892
606 606.01 1,427 490 482 247 5.8 0.39 3,658
606.02 2,493 816 803 445 5.6 0.70 3,562
Census Tract Total 3,920 1,306 1,285 692 5.7 1.08 3,630
607 /1 607.01 1,061 391 386 198 5.4 0.31 3,424
607.02 1,489 542 535 258 5.8 0.40 3,722
607.03 1,712 646 638 251 6.8 0.39 4,391
607.04 1,198 432 426 184 6.5 0.29 4,132
607.05 1,840 745 717 251 7.3 0.39 4,719
Census Tract Total 7,301 2,756 2,702 1,142 6.4 1.78 4,102
(Continued)
III-28
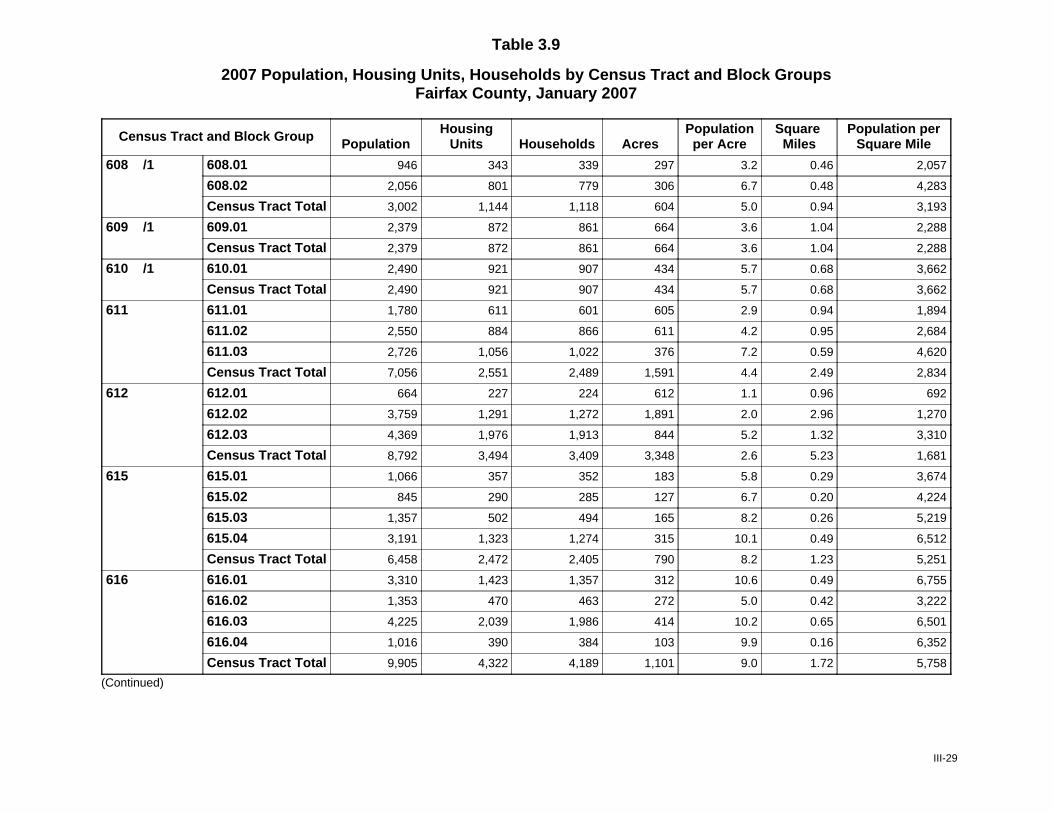
Table 3.9
2007 Population, Housing Units, Households by Census Tract and Block GroupsFairfax County, January 2007
Census Tract and Block Group PopulationHousing
Units Households AcresPopulationper Acre
Square Miles
Population perSquare Mile
608 /1 608.01 946 343 339 297 3.2 0.46 2,057
608.02 2,056 801 779 306 6.7 0.48 4,283
Census Tract Total 3,002 1,144 1,118 604 5.0 0.94 3,193
609 /1 609.01 2,379 872 861 664 3.6 1.04 2,288
Census Tract Total 2,379 872 861 664 3.6 1.04 2,288
610 /1 610.01 2,490 921 907 434 5.7 0.68 3,662
Census Tract Total 2,490 921 907 434 5.7 0.68 3,662
611 611.01 1,780 611 601 605 2.9 0.94 1,894
611.02 2,550 884 866 611 4.2 0.95 2,684
611.03 2,726 1,056 1,022 376 7.2 0.59 4,620
Census Tract Total 7,056 2,551 2,489 1,591 4.4 2.49 2,834
612 612.01 664 227 224 612 1.1 0.96 692
612.02 3,759 1,291 1,272 1,891 2.0 2.96 1,270
612.03 4,369 1,976 1,913 844 5.2 1.32 3,310
Census Tract Total 8,792 3,494 3,409 3,348 2.6 5.23 1,681
615 615.01 1,066 357 352 183 5.8 0.29 3,674
615.02 845 290 285 127 6.7 0.20 4,224
615.03 1,357 502 494 165 8.2 0.26 5,219
615.04 3,191 1,323 1,274 315 10.1 0.49 6,512
Census Tract Total 6,458 2,472 2,405 790 8.2 1.23 5,251
616 616.01 3,310 1,423 1,357 312 10.6 0.49 6,755
616.02 1,353 470 463 272 5.0 0.42 3,222
616.03 4,225 2,039 1,986 414 10.2 0.65 6,501
616.04 1,016 390 384 103 9.9 0.16 6,352
Census Tract Total 9,905 4,322 4,189 1,101 9.0 1.72 5,758
(Continued)
III-29
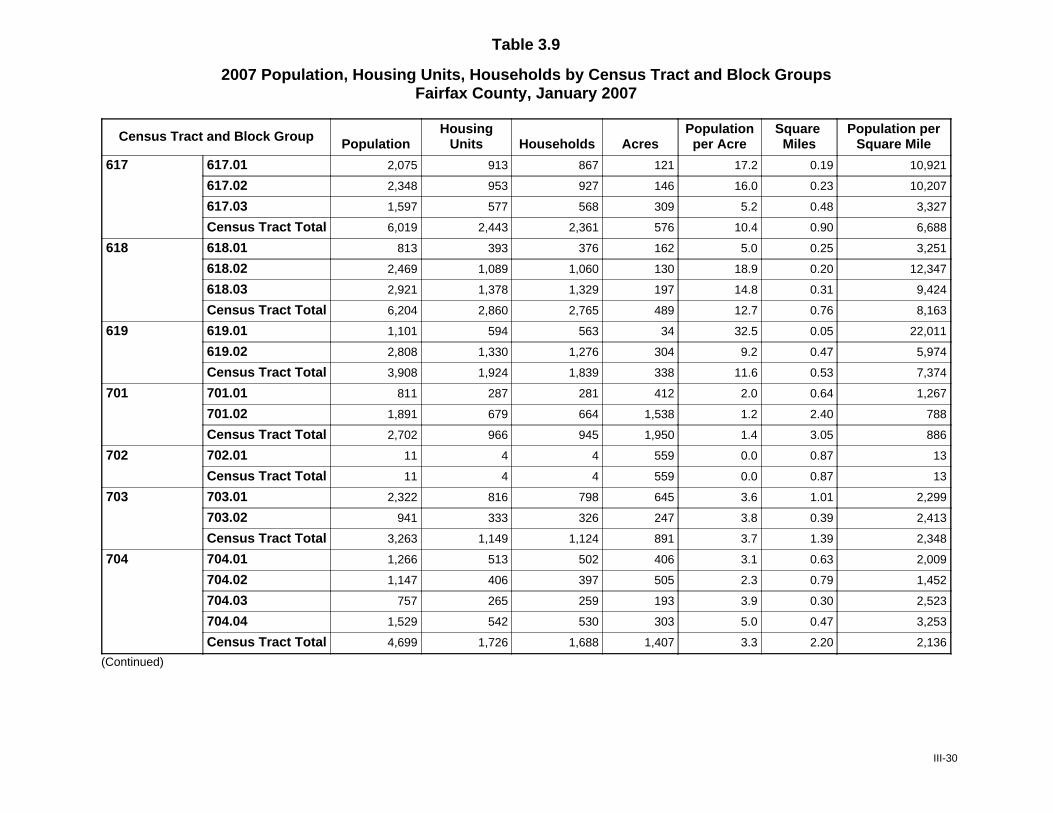
Table 3.9
2007 Population, Housing Units, Households by Census Tract and Block GroupsFairfax County, January 2007
Census Tract and Block Group PopulationHousing
Units Households AcresPopulationper Acre
Square Miles
Population perSquare Mile
617 617.01 2,075 913 867 121 17.2 0.19 10,921
617.02 2,348 953 927 146 16.0 0.23 10,207
617.03 1,597 577 568 309 5.2 0.48 3,327
Census Tract Total 6,019 2,443 2,361 576 10.4 0.90 6,688
618 618.01 813 393 376 162 5.0 0.25 3,251
618.02 2,469 1,089 1,060 130 18.9 0.20 12,347
618.03 2,921 1,378 1,329 197 14.8 0.31 9,424
Census Tract Total 6,204 2,860 2,765 489 12.7 0.76 8,163
619 619.01 1,101 594 563 34 32.5 0.05 22,011
619.02 2,808 1,330 1,276 304 9.2 0.47 5,974
Census Tract Total 3,908 1,924 1,839 338 11.6 0.53 7,374
701 701.01 811 287 281 412 2.0 0.64 1,267
701.02 1,891 679 664 1,538 1.2 2.40 788
Census Tract Total 2,702 966 945 1,950 1.4 3.05 886
702 702.01 11 4 4 559 0.0 0.87 13
Census Tract Total 11 4 4 559 0.0 0.87 13
703 703.01 2,322 816 798 645 3.6 1.01 2,299
703.02 941 333 326 247 3.8 0.39 2,413
Census Tract Total 3,263 1,149 1,124 891 3.7 1.39 2,348
704 704.01 1,266 513 502 406 3.1 0.63 2,009
704.02 1,147 406 397 505 2.3 0.79 1,452
704.03 757 265 259 193 3.9 0.30 2,523
704.04 1,529 542 530 303 5.0 0.47 3,253
Census Tract Total 4,699 1,726 1,688 1,407 3.3 2.20 2,136
(Continued)
III-30
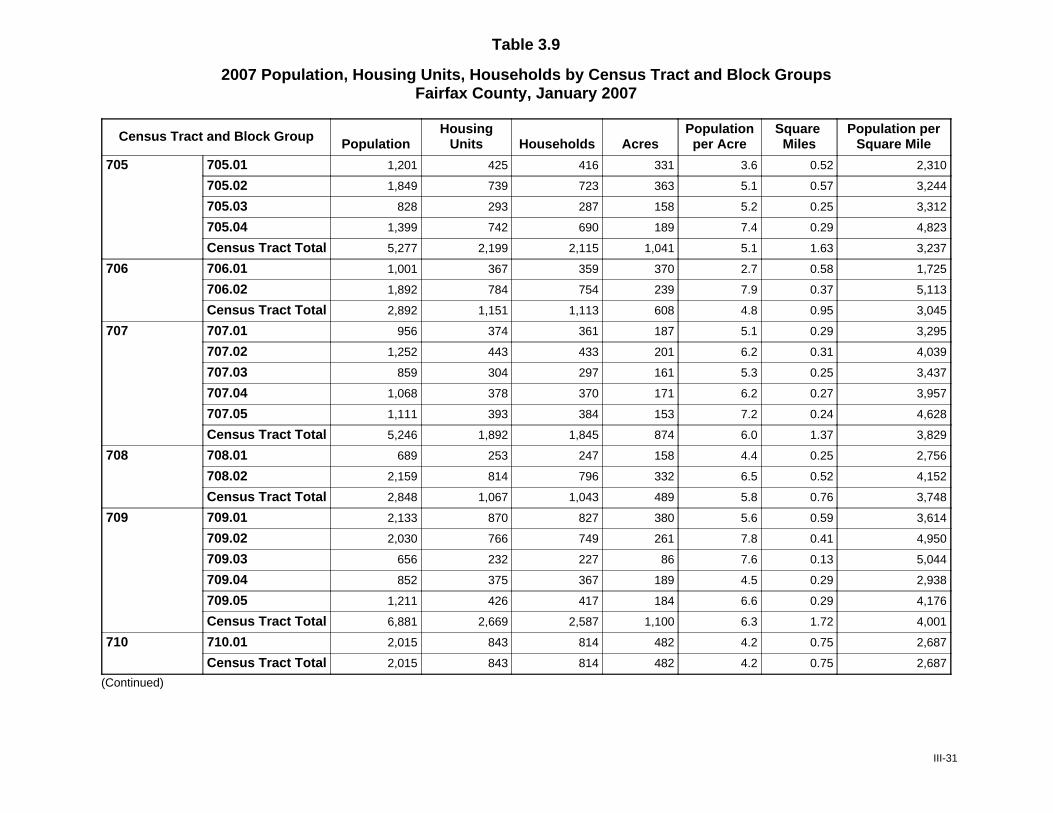
Table 3.9
2007 Population, Housing Units, Households by Census Tract and Block GroupsFairfax County, January 2007
Census Tract and Block Group PopulationHousing
Units Households AcresPopulationper Acre
Square Miles
Population perSquare Mile
705 705.01 1,201 425 416 331 3.6 0.52 2,310
705.02 1,849 739 723 363 5.1 0.57 3,244
705.03 828 293 287 158 5.2 0.25 3,312
705.04 1,399 742 690 189 7.4 0.29 4,823
Census Tract Total 5,277 2,199 2,115 1,041 5.1 1.63 3,237
706 706.01 1,001 367 359 370 2.7 0.58 1,725
706.02 1,892 784 754 239 7.9 0.37 5,113
Census Tract Total 2,892 1,151 1,113 608 4.8 0.95 3,045
707 707.01 956 374 361 187 5.1 0.29 3,295
707.02 1,252 443 433 201 6.2 0.31 4,039
707.03 859 304 297 161 5.3 0.25 3,437
707.04 1,068 378 370 171 6.2 0.27 3,957
707.05 1,111 393 384 153 7.2 0.24 4,628
Census Tract Total 5,246 1,892 1,845 874 6.0 1.37 3,829
708 708.01 689 253 247 158 4.4 0.25 2,756
708.02 2,159 814 796 332 6.5 0.52 4,152
Census Tract Total 2,848 1,067 1,043 489 5.8 0.76 3,748
709 709.01 2,133 870 827 380 5.6 0.59 3,614
709.02 2,030 766 749 261 7.8 0.41 4,950
709.03 656 232 227 86 7.6 0.13 5,044
709.04 852 375 367 189 4.5 0.29 2,938
709.05 1,211 426 417 184 6.6 0.29 4,176
Census Tract Total 6,881 2,669 2,587 1,100 6.3 1.72 4,001
710 710.01 2,015 843 814 482 4.2 0.75 2,687
Census Tract Total 2,015 843 814 482 4.2 0.75 2,687
(Continued)
III-31
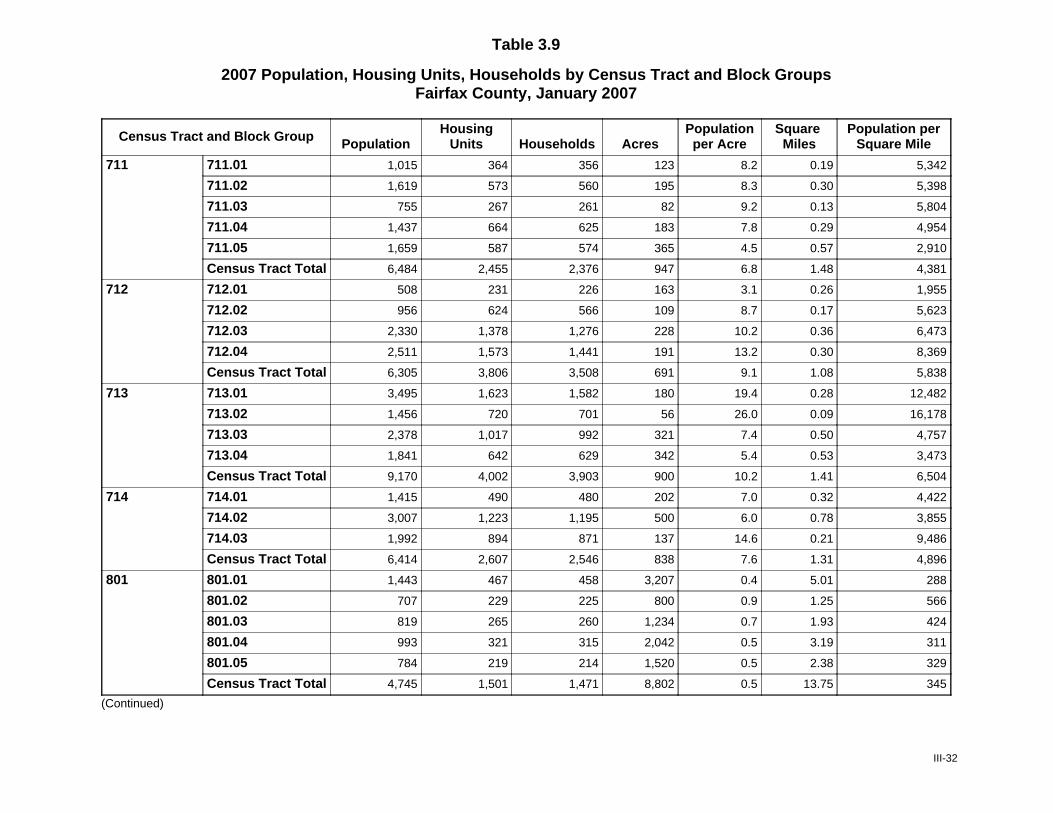
Table 3.9
2007 Population, Housing Units, Households by Census Tract and Block GroupsFairfax County, January 2007
Census Tract and Block Group PopulationHousing
Units Households AcresPopulationper Acre
Square Miles
Population perSquare Mile
711 711.01 1,015 364 356 123 8.2 0.19 5,342
711.02 1,619 573 560 195 8.3 0.30 5,398
711.03 755 267 261 82 9.2 0.13 5,804
711.04 1,437 664 625 183 7.8 0.29 4,954
711.05 1,659 587 574 365 4.5 0.57 2,910
Census Tract Total 6,484 2,455 2,376 947 6.8 1.48 4,381
712 712.01 508 231 226 163 3.1 0.26 1,955
712.02 956 624 566 109 8.7 0.17 5,623
712.03 2,330 1,378 1,276 228 10.2 0.36 6,473
712.04 2,511 1,573 1,441 191 13.2 0.30 8,369
Census Tract Total 6,305 3,806 3,508 691 9.1 1.08 5,838
713 713.01 3,495 1,623 1,582 180 19.4 0.28 12,482
713.02 1,456 720 701 56 26.0 0.09 16,178
713.03 2,378 1,017 992 321 7.4 0.50 4,757
713.04 1,841 642 629 342 5.4 0.53 3,473
Census Tract Total 9,170 4,002 3,903 900 10.2 1.41 6,504
714 714.01 1,415 490 480 202 7.0 0.32 4,422
714.02 3,007 1,223 1,195 500 6.0 0.78 3,855
714.03 1,992 894 871 137 14.6 0.21 9,486
Census Tract Total 6,414 2,607 2,546 838 7.6 1.31 4,896
801 801.01 1,443 467 458 3,207 0.4 5.01 288
801.02 707 229 225 800 0.9 1.25 566
801.03 819 265 260 1,234 0.7 1.93 424
801.04 993 321 315 2,042 0.5 3.19 311
801.05 784 219 214 1,520 0.5 2.38 329
Census Tract Total 4,745 1,501 1,471 8,802 0.5 13.75 345
(Continued)
III-32
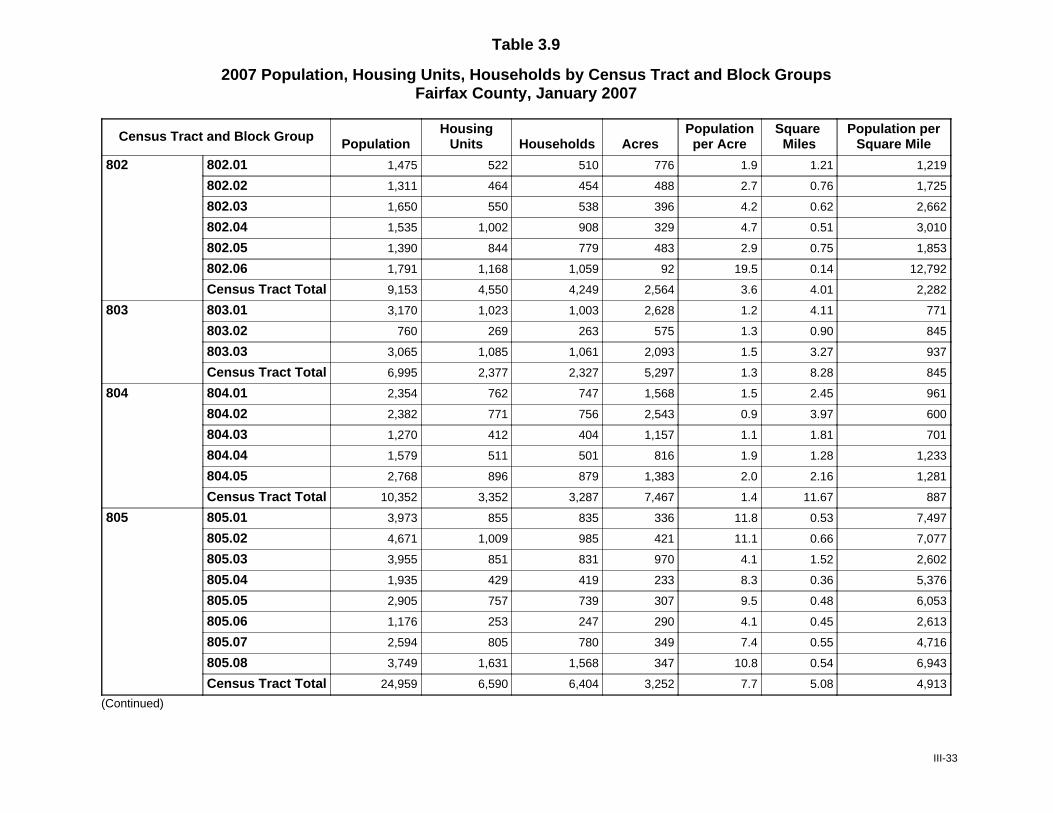
Table 3.9
2007 Population, Housing Units, Households by Census Tract and Block GroupsFairfax County, January 2007
Census Tract and Block Group PopulationHousing
Units Households AcresPopulationper Acre
Square Miles
Population perSquare Mile
802 802.01 1,475 522 510 776 1.9 1.21 1,219
802.02 1,311 464 454 488 2.7 0.76 1,725
802.03 1,650 550 538 396 4.2 0.62 2,662
802.04 1,535 1,002 908 329 4.7 0.51 3,010
802.05 1,390 844 779 483 2.9 0.75 1,853
802.06 1,791 1,168 1,059 92 19.5 0.14 12,792
Census Tract Total 9,153 4,550 4,249 2,564 3.6 4.01 2,282
803 803.01 3,170 1,023 1,003 2,628 1.2 4.11 771
803.02 760 269 263 575 1.3 0.90 845
803.03 3,065 1,085 1,061 2,093 1.5 3.27 937
Census Tract Total 6,995 2,377 2,327 5,297 1.3 8.28 845
804 804.01 2,354 762 747 1,568 1.5 2.45 961
804.02 2,382 771 756 2,543 0.9 3.97 600
804.03 1,270 412 404 1,157 1.1 1.81 701
804.04 1,579 511 501 816 1.9 1.28 1,233
804.05 2,768 896 879 1,383 2.0 2.16 1,281
Census Tract Total 10,352 3,352 3,287 7,467 1.4 11.67 887
805 805.01 3,973 855 835 336 11.8 0.53 7,497
805.02 4,671 1,009 985 421 11.1 0.66 7,077
805.03 3,955 851 831 970 4.1 1.52 2,602
805.04 1,935 429 419 233 8.3 0.36 5,376
805.05 2,905 757 739 307 9.5 0.48 6,053
805.06 1,176 253 247 290 4.1 0.45 2,613
805.07 2,594 805 780 349 7.4 0.55 4,716
805.08 3,749 1,631 1,568 347 10.8 0.54 6,943
Census Tract Total 24,959 6,590 6,404 3,252 7.7 5.08 4,913
(Continued)
III-33
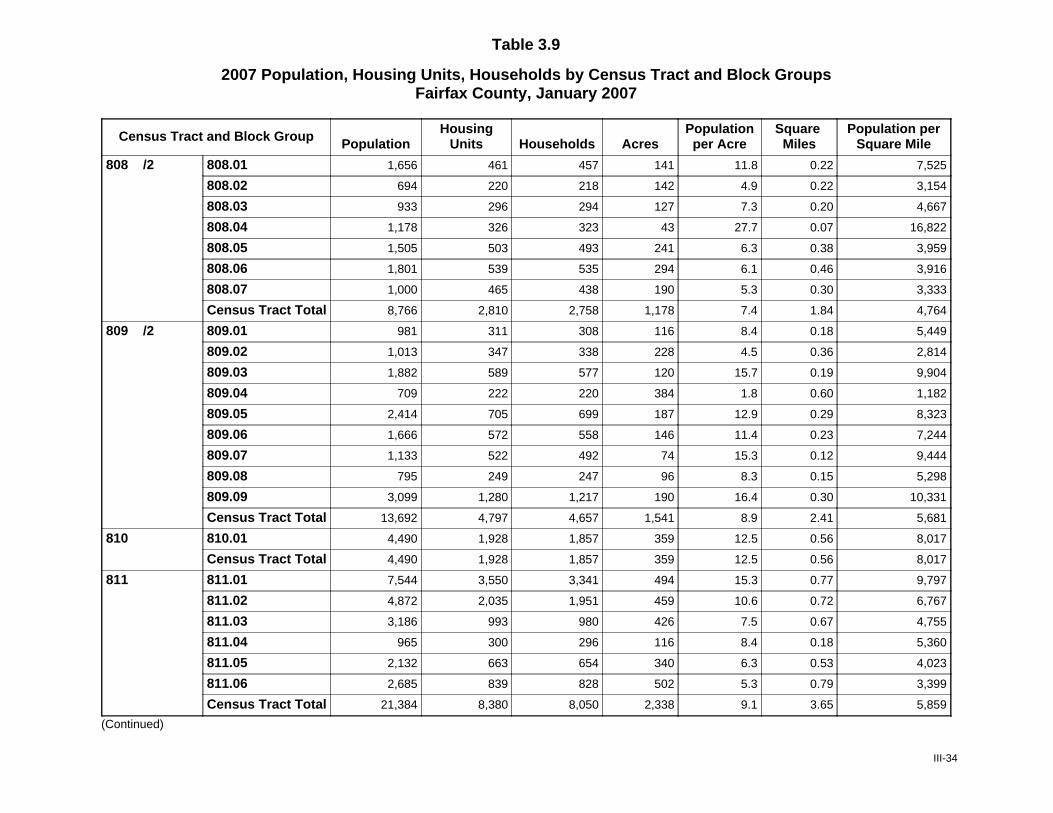
Table 3.9
2007 Population, Housing Units, Households by Census Tract and Block GroupsFairfax County, January 2007
Census Tract and Block Group PopulationHousing
Units Households AcresPopulationper Acre
Square Miles
Population perSquare Mile
808 /2 808.01 1,656 461 457 141 11.8 0.22 7,525
808.02 694 220 218 142 4.9 0.22 3,154
808.03 933 296 294 127 7.3 0.20 4,667
808.04 1,178 326 323 43 27.7 0.07 16,822
808.05 1,505 503 493 241 6.3 0.38 3,959
808.06 1,801 539 535 294 6.1 0.46 3,916
808.07 1,000 465 438 190 5.3 0.30 3,333
Census Tract Total 8,766 2,810 2,758 1,178 7.4 1.84 4,764
809 /2 809.01 981 311 308 116 8.4 0.18 5,449
809.02 1,013 347 338 228 4.5 0.36 2,814
809.03 1,882 589 577 120 15.7 0.19 9,904
809.04 709 222 220 384 1.8 0.60 1,182
809.05 2,414 705 699 187 12.9 0.29 8,323
809.06 1,666 572 558 146 11.4 0.23 7,244
809.07 1,133 522 492 74 15.3 0.12 9,444
809.08 795 249 247 96 8.3 0.15 5,298
809.09 3,099 1,280 1,217 190 16.4 0.30 10,331
Census Tract Total 13,692 4,797 4,657 1,541 8.9 2.41 5,681
810 810.01 4,490 1,928 1,857 359 12.5 0.56 8,017
Census Tract Total 4,490 1,928 1,857 359 12.5 0.56 8,017
811 811.01 7,544 3,550 3,341 494 15.3 0.77 9,797
811.02 4,872 2,035 1,951 459 10.6 0.72 6,767
811.03 3,186 993 980 426 7.5 0.67 4,755
811.04 965 300 296 116 8.4 0.18 5,360
811.05 2,132 663 654 340 6.3 0.53 4,023
811.06 2,685 839 828 502 5.3 0.79 3,399
Census Tract Total 21,384 8,380 8,050 2,338 9.1 3.65 5,859
(Continued)
III-34
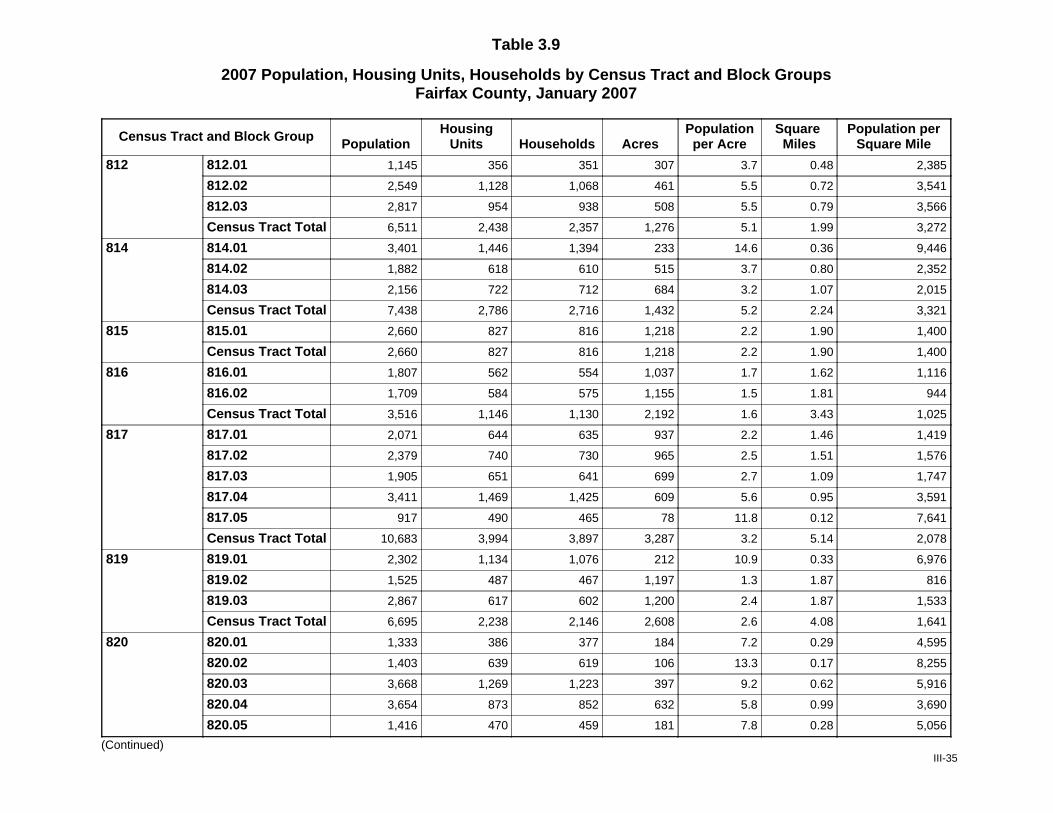
Table 3.9
2007 Population, Housing Units, Households by Census Tract and Block GroupsFairfax County, January 2007
Census Tract and Block Group PopulationHousing
Units Households AcresPopulationper Acre
Square Miles
Population perSquare Mile
812 812.01 1,145 356 351 307 3.7 0.48 2,385
812.02 2,549 1,128 1,068 461 5.5 0.72 3,541
812.03 2,817 954 938 508 5.5 0.79 3,566
Census Tract Total 6,511 2,438 2,357 1,276 5.1 1.99 3,272
814 814.01 3,401 1,446 1,394 233 14.6 0.36 9,446
814.02 1,882 618 610 515 3.7 0.80 2,352
814.03 2,156 722 712 684 3.2 1.07 2,015
Census Tract Total 7,438 2,786 2,716 1,432 5.2 2.24 3,321
815 815.01 2,660 827 816 1,218 2.2 1.90 1,400
Census Tract Total 2,660 827 816 1,218 2.2 1.90 1,400
816 816.01 1,807 562 554 1,037 1.7 1.62 1,116
816.02 1,709 584 575 1,155 1.5 1.81 944
Census Tract Total 3,516 1,146 1,130 2,192 1.6 3.43 1,025
817 817.01 2,071 644 635 937 2.2 1.46 1,419
817.02 2,379 740 730 965 2.5 1.51 1,576
817.03 1,905 651 641 699 2.7 1.09 1,747
817.04 3,411 1,469 1,425 609 5.6 0.95 3,591
817.05 917 490 465 78 11.8 0.12 7,641
Census Tract Total 10,683 3,994 3,897 3,287 3.2 5.14 2,078
819 819.01 2,302 1,134 1,076 212 10.9 0.33 6,976
819.02 1,525 487 467 1,197 1.3 1.87 816
819.03 2,867 617 602 1,200 2.4 1.87 1,533
Census Tract Total 6,695 2,238 2,146 2,608 2.6 4.08 1,641
820 820.01 1,333 386 377 184 7.2 0.29 4,595
820.02 1,403 639 619 106 13.3 0.17 8,255
820.03 3,668 1,269 1,223 397 9.2 0.62 5,916
820.04 3,654 873 852 632 5.8 0.99 3,690
820.05 1,416 470 459 181 7.8 0.28 5,056
(Continued)III-35
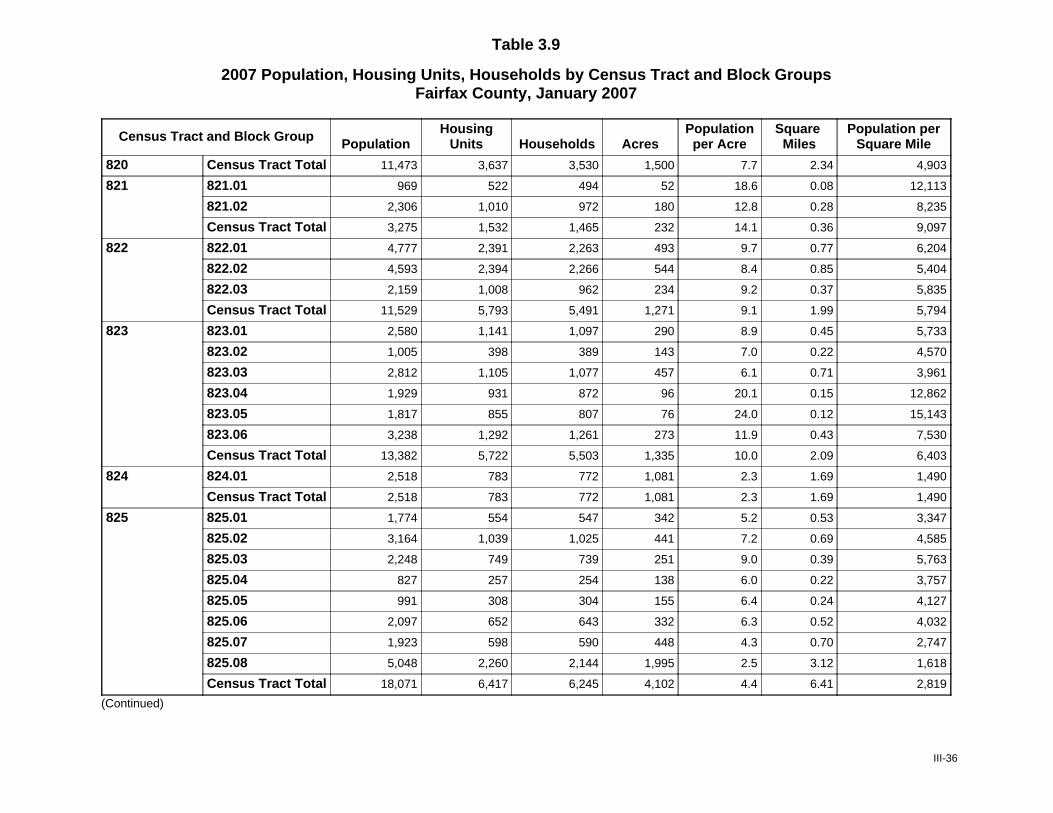
Table 3.9
2007 Population, Housing Units, Households by Census Tract and Block GroupsFairfax County, January 2007
Census Tract and Block Group PopulationHousing
Units Households AcresPopulationper Acre
Square Miles
Population perSquare Mile
Census Tract Total 11,473 3,637 3,530 1,500 7.7 2.34 4,903820
821 821.01 969 522 494 52 18.6 0.08 12,113
821.02 2,306 1,010 972 180 12.8 0.28 8,235
Census Tract Total 3,275 1,532 1,465 232 14.1 0.36 9,097
822 822.01 4,777 2,391 2,263 493 9.7 0.77 6,204
822.02 4,593 2,394 2,266 544 8.4 0.85 5,404
822.03 2,159 1,008 962 234 9.2 0.37 5,835
Census Tract Total 11,529 5,793 5,491 1,271 9.1 1.99 5,794
823 823.01 2,580 1,141 1,097 290 8.9 0.45 5,733
823.02 1,005 398 389 143 7.0 0.22 4,570
823.03 2,812 1,105 1,077 457 6.1 0.71 3,961
823.04 1,929 931 872 96 20.1 0.15 12,862
823.05 1,817 855 807 76 24.0 0.12 15,143
823.06 3,238 1,292 1,261 273 11.9 0.43 7,530
Census Tract Total 13,382 5,722 5,503 1,335 10.0 2.09 6,403
824 824.01 2,518 783 772 1,081 2.3 1.69 1,490
Census Tract Total 2,518 783 772 1,081 2.3 1.69 1,490
825 825.01 1,774 554 547 342 5.2 0.53 3,347
825.02 3,164 1,039 1,025 441 7.2 0.69 4,585
825.03 2,248 749 739 251 9.0 0.39 5,763
825.04 827 257 254 138 6.0 0.22 3,757
825.05 991 308 304 155 6.4 0.24 4,127
825.06 2,097 652 643 332 6.3 0.52 4,032
825.07 1,923 598 590 448 4.3 0.70 2,747
825.08 5,048 2,260 2,144 1,995 2.5 3.12 1,618
Census Tract Total 18,071 6,417 6,245 4,102 4.4 6.41 2,819
(Continued)
III-36
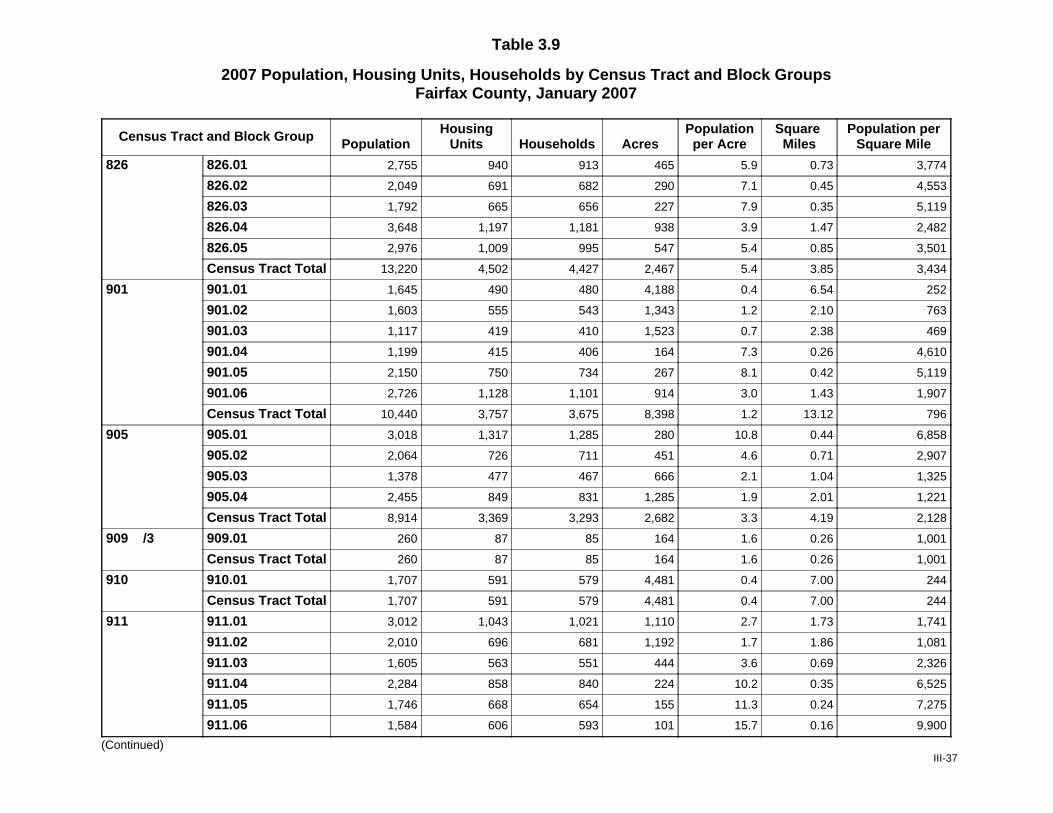
Table 3.9
2007 Population, Housing Units, Households by Census Tract and Block GroupsFairfax County, January 2007
Census Tract and Block Group PopulationHousing
Units Households AcresPopulationper Acre
Square Miles
Population perSquare Mile
826 826.01 2,755 940 913 465 5.9 0.73 3,774
826.02 2,049 691 682 290 7.1 0.45 4,553
826.03 1,792 665 656 227 7.9 0.35 5,119
826.04 3,648 1,197 1,181 938 3.9 1.47 2,482
826.05 2,976 1,009 995 547 5.4 0.85 3,501
Census Tract Total 13,220 4,502 4,427 2,467 5.4 3.85 3,434
901 901.01 1,645 490 480 4,188 0.4 6.54 252
901.02 1,603 555 543 1,343 1.2 2.10 763
901.03 1,117 419 410 1,523 0.7 2.38 469
901.04 1,199 415 406 164 7.3 0.26 4,610
901.05 2,150 750 734 267 8.1 0.42 5,119
901.06 2,726 1,128 1,101 914 3.0 1.43 1,907
Census Tract Total 10,440 3,757 3,675 8,398 1.2 13.12 796
905 905.01 3,018 1,317 1,285 280 10.8 0.44 6,858
905.02 2,064 726 711 451 4.6 0.71 2,907
905.03 1,378 477 467 666 2.1 1.04 1,325
905.04 2,455 849 831 1,285 1.9 2.01 1,221
Census Tract Total 8,914 3,369 3,293 2,682 3.3 4.19 2,128
909 /3 909.01 260 87 85 164 1.6 0.26 1,001
Census Tract Total 260 87 85 164 1.6 0.26 1,001
910 910.01 1,707 591 579 4,481 0.4 7.00 244
Census Tract Total 1,707 591 579 4,481 0.4 7.00 244
911 911.01 3,012 1,043 1,021 1,110 2.7 1.73 1,741
911.02 2,010 696 681 1,192 1.7 1.86 1,081
911.03 1,605 563 551 444 3.6 0.69 2,326
911.04 2,284 858 840 224 10.2 0.35 6,525
911.05 1,746 668 654 155 11.3 0.24 7,275
911.06 1,584 606 593 101 15.7 0.16 9,900
(Continued)III-37
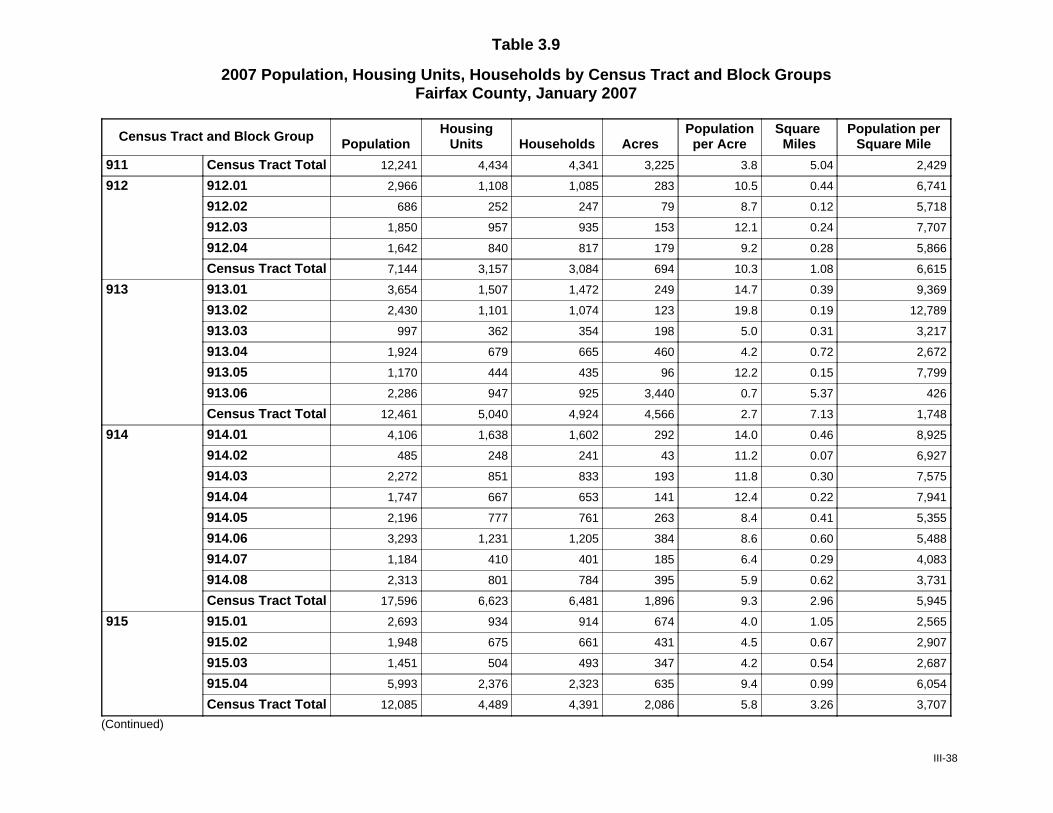
Table 3.9
2007 Population, Housing Units, Households by Census Tract and Block GroupsFairfax County, January 2007
Census Tract and Block Group PopulationHousing
Units Households AcresPopulationper Acre
Square Miles
Population perSquare Mile
Census Tract Total 12,241 4,434 4,341 3,225 3.8 5.04 2,429911
912 912.01 2,966 1,108 1,085 283 10.5 0.44 6,741
912.02 686 252 247 79 8.7 0.12 5,718
912.03 1,850 957 935 153 12.1 0.24 7,707
912.04 1,642 840 817 179 9.2 0.28 5,866
Census Tract Total 7,144 3,157 3,084 694 10.3 1.08 6,615
913 913.01 3,654 1,507 1,472 249 14.7 0.39 9,369
913.02 2,430 1,101 1,074 123 19.8 0.19 12,789
913.03 997 362 354 198 5.0 0.31 3,217
913.04 1,924 679 665 460 4.2 0.72 2,672
913.05 1,170 444 435 96 12.2 0.15 7,799
913.06 2,286 947 925 3,440 0.7 5.37 426
Census Tract Total 12,461 5,040 4,924 4,566 2.7 7.13 1,748
914 914.01 4,106 1,638 1,602 292 14.0 0.46 8,925
914.02 485 248 241 43 11.2 0.07 6,927
914.03 2,272 851 833 193 11.8 0.30 7,575
914.04 1,747 667 653 141 12.4 0.22 7,941
914.05 2,196 777 761 263 8.4 0.41 5,355
914.06 3,293 1,231 1,205 384 8.6 0.60 5,488
914.07 1,184 410 401 185 6.4 0.29 4,083
914.08 2,313 801 784 395 5.9 0.62 3,731
Census Tract Total 17,596 6,623 6,481 1,896 9.3 2.96 5,945
915 915.01 2,693 934 914 674 4.0 1.05 2,565
915.02 1,948 675 661 431 4.5 0.67 2,907
915.03 1,451 504 493 347 4.2 0.54 2,687
915.04 5,993 2,376 2,323 635 9.4 0.99 6,054
Census Tract Total 12,085 4,489 4,391 2,086 5.8 3.26 3,707
(Continued)
III-38
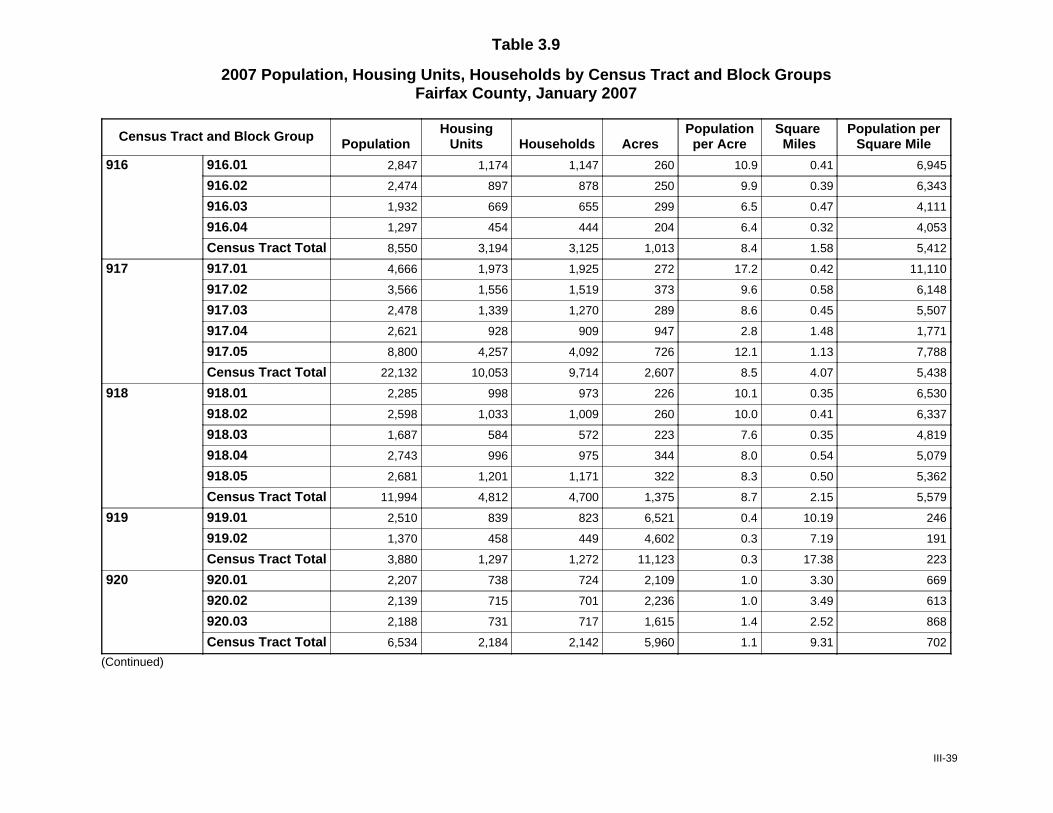
Table 3.9
2007 Population, Housing Units, Households by Census Tract and Block GroupsFairfax County, January 2007
Census Tract and Block Group PopulationHousing
Units Households AcresPopulationper Acre
Square Miles
Population perSquare Mile
916 916.01 2,847 1,174 1,147 260 10.9 0.41 6,945
916.02 2,474 897 878 250 9.9 0.39 6,343
916.03 1,932 669 655 299 6.5 0.47 4,111
916.04 1,297 454 444 204 6.4 0.32 4,053
Census Tract Total 8,550 3,194 3,125 1,013 8.4 1.58 5,412
917 917.01 4,666 1,973 1,925 272 17.2 0.42 11,110
917.02 3,566 1,556 1,519 373 9.6 0.58 6,148
917.03 2,478 1,339 1,270 289 8.6 0.45 5,507
917.04 2,621 928 909 947 2.8 1.48 1,771
917.05 8,800 4,257 4,092 726 12.1 1.13 7,788
Census Tract Total 22,132 10,053 9,714 2,607 8.5 4.07 5,438
918 918.01 2,285 998 973 226 10.1 0.35 6,530
918.02 2,598 1,033 1,009 260 10.0 0.41 6,337
918.03 1,687 584 572 223 7.6 0.35 4,819
918.04 2,743 996 975 344 8.0 0.54 5,079
918.05 2,681 1,201 1,171 322 8.3 0.50 5,362
Census Tract Total 11,994 4,812 4,700 1,375 8.7 2.15 5,579
919 919.01 2,510 839 823 6,521 0.4 10.19 246
919.02 1,370 458 449 4,602 0.3 7.19 191
Census Tract Total 3,880 1,297 1,272 11,123 0.3 17.38 223
920 920.01 2,207 738 724 2,109 1.0 3.30 669
920.02 2,139 715 701 2,236 1.0 3.49 613
920.03 2,188 731 717 1,615 1.4 2.52 868
Census Tract Total 6,534 2,184 2,142 5,960 1.1 9.31 702
(Continued)
III-39

Table 3.9
2007 Population, Housing Units, Households by Census Tract and Block GroupsFairfax County, January 2007
Census Tract and Block Group PopulationHousing
Units Households AcresPopulationper Acre
Square Miles
Population perSquare Mile
921 921.01 1,873 626 614 3,395 0.6 5.30 353
921.02 712 238 233 753 0.9 1.18 603
921.03 1,137 381 374 741 1.5 1.16 980
921.04 1,134 379 372 1,215 0.9 1.90 597
921.05 1,735 580 569 1,498 1.2 2.34 741
Census Tract Total 6,590 2,204 2,162 7,602 0.9 11.88 555
922 922.01 2,096 700 687 5,574 0.4 8.71 241
922.02 784 263 258 1,929 0.4 3.01 260
922.03 2,633 807 800 427 6.2 0.67 3,930
922.04 1,940 615 610 605 3.2 0.95 2,042
922.05 2,212 678 672 401 5.5 0.63 3,512
922.06 3,547 1,087 1,078 984 3.6 1.54 2,303
922.07 802 246 244 197 4.1 0.31 2,588
Census Tract Total 14,014 4,396 4,349 10,117 1.4 15.81 886
923 923.01 760 234 232 146 5.2 0.23 3,303
923.02 2,529 852 845 393 6.4 0.61 4,146
Census Tract Total 3,289 1,086 1,077 539 6.1 0.84 3,915
924 924.01 4,856 1,712 1,698 606 8.0 0.95 5,111
Census Tract Total 4,856 1,712 1,698 606 8.0 0.95 5,111
Fairfax County Total 1,041,507 391,138 381,227 261,113 4.0 407.99 2,553
Source: Fairfax County Department of Systems Management for Human Services, 2007
Note: All census tracts in Fairfax County begin with number 4. To conserve space, the leading 4 is dropped from the census tract name in
the information contained in this table. Households are occupied housing units. Area measurements (acres and square miles) includes both
land and water area. Countywide totals may vary by table depending on how well the geographic layer aligns with actual county boundaries.
1/ Comprises part of the Town of Vienna.
2/ Comprises part of the Town of Herndon.
3/ Town of Clifton.
III-40
POPULATION FORECASTS Population forecasts are derived from forecast housing units and calculated similarly to the current population estimates for each geographic area considered. Thus, population forecasts reflect projections as of January 1 of each year. Forecast household population is calculated using the forecast number of housing units by type. Vacancy rates and average household sizes are applied based on estimates of vacancies and average persons per household by planning district. Finally, total population is calculated by adding the most recent estimate of group quarters population to the forecast household population. Vacancy rates and household size factors are developed by the Fairfax County Department of Systems Management for Human Services. An overall vacancy rate of 2.53 percent (and thus, an occupancy rate of 97.47 percent) is assumed for all forecast years in Fairfax County. This is based on trends in the overall occupancy rate, which has remained in the 95 to 98 percent range for the last 20 years. The increasingly diverse racial
composition of Fairfax County and emerging differences in average household size by unit type are significant factors that are likely to influence projected average household size. Between 1990 and 2000, the population of Fairfax County increased by 151,165 persons. All of the net population increase was comprised of nonwhites and persons of Hispanic origin. As a result, whites currently make up a smaller proportion of total population than in 1990. It is important to note that the average household size for Asian, Black, and Hispanic households are higher than the current countywide average household size. As these minority households increase as a proportion of total households in the future it will put upward pressure on Fairfax County's overall average household size. This trend, offset by the long-term trend toward smaller household size within each racial or ethnic category, will result in relatively stable average household sizes for Fairfax County through 2025.
IV-1
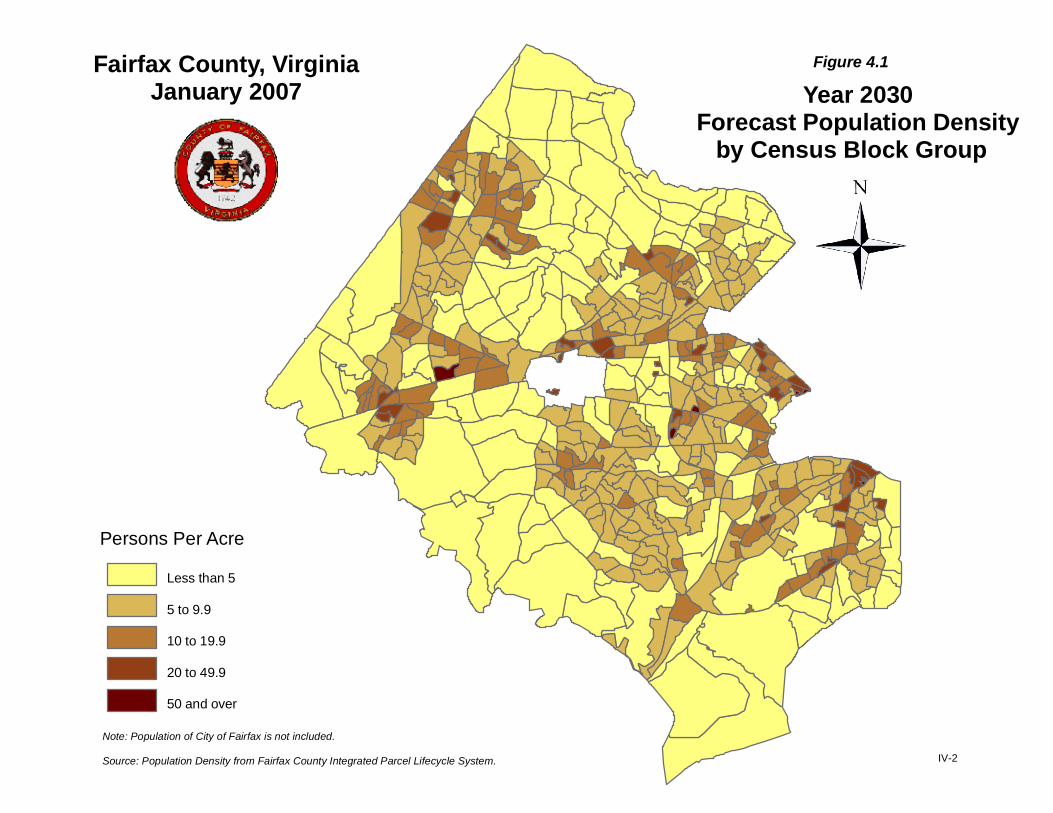
Fairfax County, VirginiaJanuary 2007 Year 2030
Forecast Population Densityby Census Block Group
Figure 4.1
Note: Population of City of Fairfax is not included.
Source: Population Density from Fairfax County Integrated Parcel Lifecycle System.
Persons Per Acre
Less than 5
5 to 9.9
10 to 19.9
20 to 49.9
50 and over
IV-2
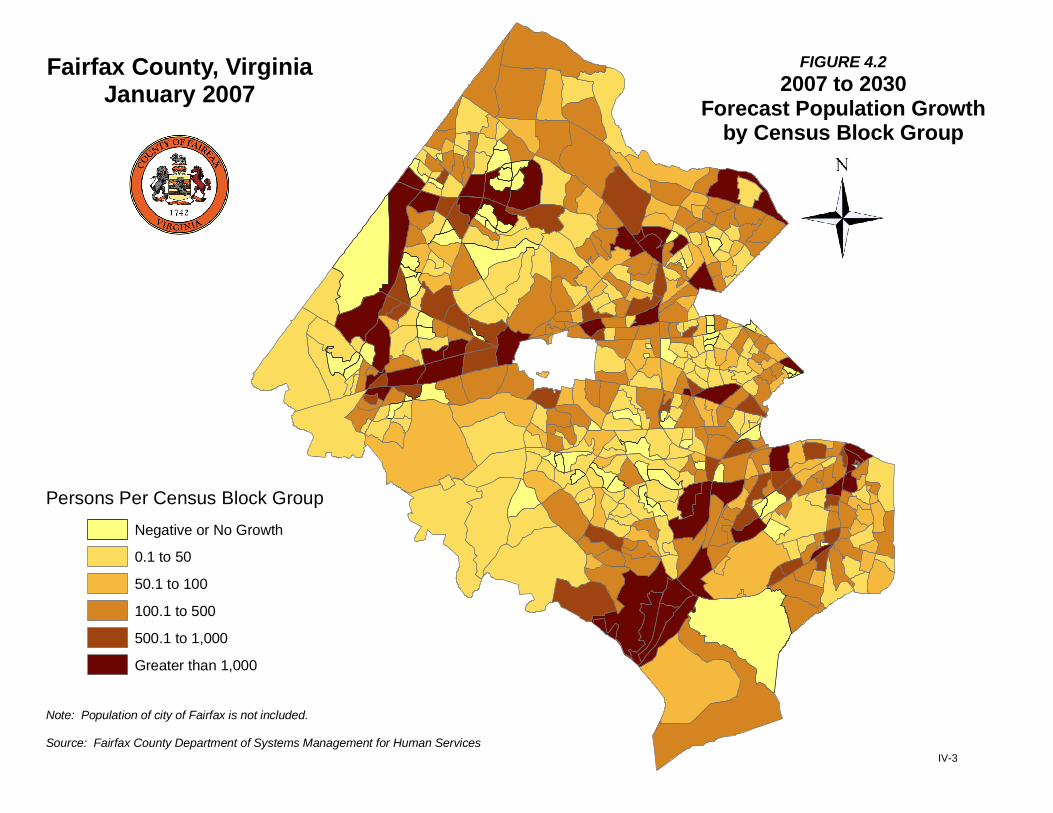
Fairfax County, VirginiaJanuary 2007
FIGURE 4.22007 to 2030
Forecast Population Growthby Census Block Group
Persons Per Census Block GroupNegative or No Growth
0.1 to 50
50.1 to 100
100.1 to 500
500.1 to 1,000
Greater than 1,000
Note: Population of city of Fairfax is not included.
Source: Fairfax County Department of Systems Management for Human ServicesIV-3
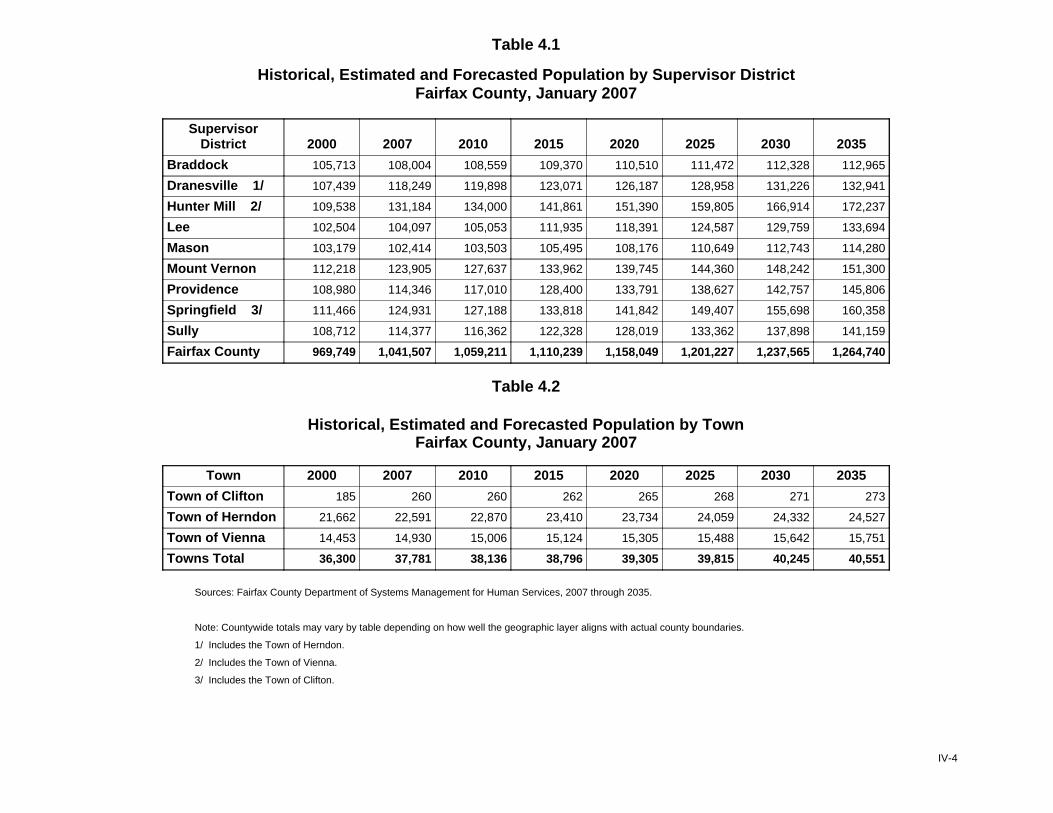
Table 4.1
Historical, Estimated and Forecasted Population by Supervisor DistrictFairfax County, January 2007
SupervisorDistrict 2000 2007 2010 2015 2020 2025 2030 2035
Braddock 105,713 108,004 108,559 109,370 110,510 111,472 112,328 112,965
Dranesville 1/ 107,439 118,249 119,898 123,071 126,187 128,958 131,226 132,941
Hunter Mill 2/ 109,538 131,184 134,000 141,861 151,390 159,805 166,914 172,237
Lee 102,504 104,097 105,053 111,935 118,391 124,587 129,759 133,694
Mason 103,179 102,414 103,503 105,495 108,176 110,649 112,743 114,280
Mount Vernon 112,218 123,905 127,637 133,962 139,745 144,360 148,242 151,300
Providence 108,980 114,346 117,010 128,400 133,791 138,627 142,757 145,806
Springfield 3/ 111,466 124,931 127,188 133,818 141,842 149,407 155,698 160,358
Sully 108,712 114,377 116,362 122,328 128,019 133,362 137,898 141,159
Fairfax County 969,749 1,041,507 1,059,211 1,110,239 1,158,049 1,201,227 1,237,565 1,264,740
Table 4.2
Historical, Estimated and Forecasted Population by TownFairfax County, January 2007
Town 2000 2007 2010 2015 2020 2025 2030 2035
Town of Clifton 185 260 260 262 265 268 271 273
Town of Herndon 21,662 22,591 22,870 23,410 23,734 24,059 24,332 24,527
Town of Vienna 14,453 14,930 15,006 15,124 15,305 15,488 15,642 15,751
Towns Total 36,300 37,781 38,136 38,796 39,305 39,815 40,245 40,551
Sources: Fairfax County Department of Systems Management for Human Services, 2007 through 2035.
Note: Countywide totals may vary by table depending on how well the geographic layer aligns with actual county boundaries.
1/ Includes the Town of Herndon.
2/ Includes the Town of Vienna.
3/ Includes the Town of Clifton.
IV-4
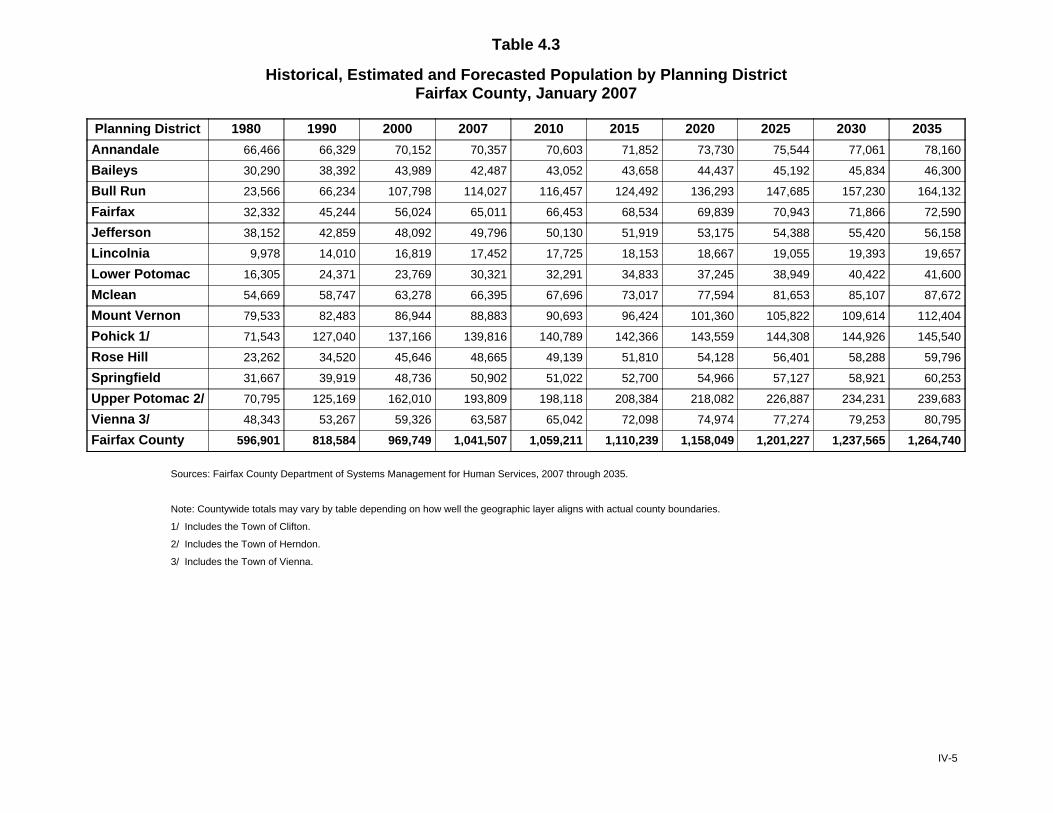
Table 4.3
Historical, Estimated and Forecasted Population by Planning DistrictFairfax County, January 2007
Planning District 1980 1990 2000 2007 2010 2015 2020 2025 2030 2035
Annandale 66,466 66,329 70,152 70,357 70,603 71,852 73,730 75,544 77,061 78,160
Baileys 30,290 38,392 43,989 42,487 43,052 43,658 44,437 45,192 45,834 46,300
Bull Run 23,566 66,234 107,798 114,027 116,457 124,492 136,293 147,685 157,230 164,132
Fairfax 32,332 45,244 56,024 65,011 66,453 68,534 69,839 70,943 71,866 72,590
Jefferson 38,152 42,859 48,092 49,796 50,130 51,919 53,175 54,388 55,420 56,158
Lincolnia 9,978 14,010 16,819 17,452 17,725 18,153 18,667 19,055 19,393 19,657
Lower Potomac 16,305 24,371 23,769 30,321 32,291 34,833 37,245 38,949 40,422 41,600
Mclean 54,669 58,747 63,278 66,395 67,696 73,017 77,594 81,653 85,107 87,672
Mount Vernon 79,533 82,483 86,944 88,883 90,693 96,424 101,360 105,822 109,614 112,404
Pohick 1/ 71,543 127,040 137,166 139,816 140,789 142,366 143,559 144,308 144,926 145,540
Rose Hill 23,262 34,520 45,646 48,665 49,139 51,810 54,128 56,401 58,288 59,796
Springfield 31,667 39,919 48,736 50,902 51,022 52,700 54,966 57,127 58,921 60,253
Upper Potomac 2/ 70,795 125,169 162,010 193,809 198,118 208,384 218,082 226,887 234,231 239,683
Vienna 3/ 48,343 53,267 59,326 63,587 65,042 72,098 74,974 77,274 79,253 80,795
Fairfax County 596,901 818,584 969,749 1,041,507 1,059,211 1,110,239 1,158,049 1,201,227 1,237,565 1,264,740
Sources: Fairfax County Department of Systems Management for Human Services, 2007 through 2035.
Note: Countywide totals may vary by table depending on how well the geographic layer aligns with actual county boundaries.
1/ Includes the Town of Clifton.
2/ Includes the Town of Herndon.
3/ Includes the Town of Vienna.
IV-5
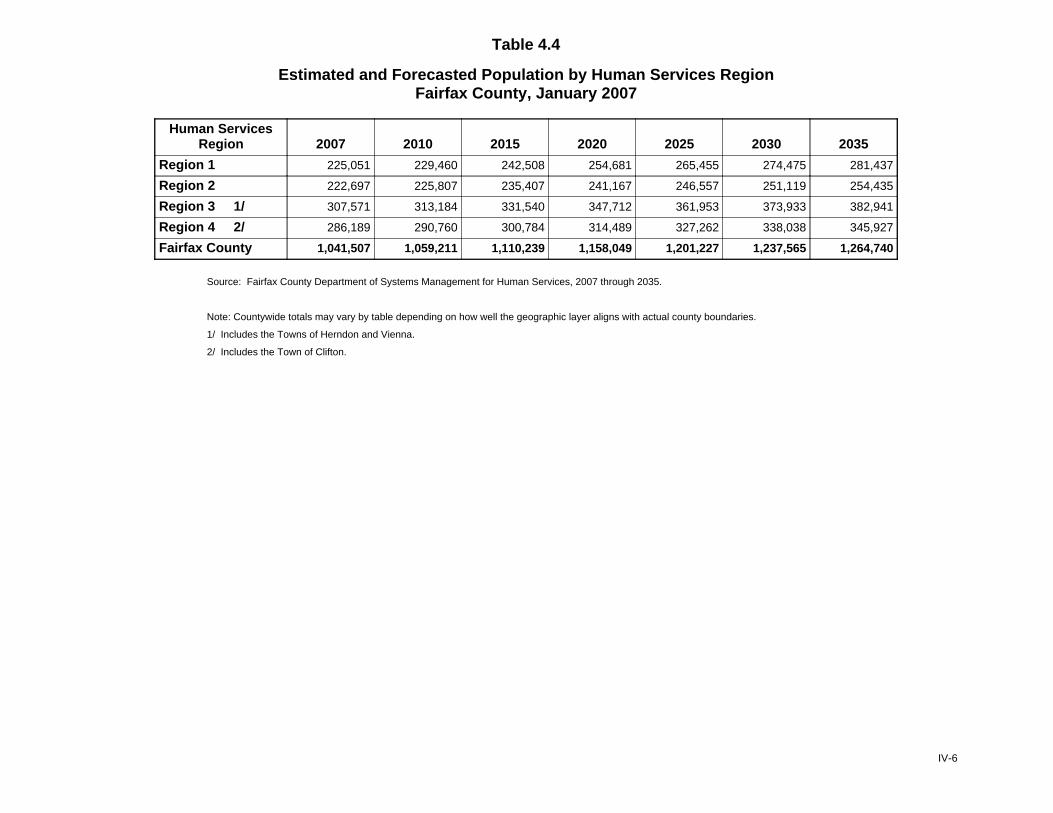
Table 4.4
Estimated and Forecasted Population by Human Services RegionFairfax County, January 2007
Human ServicesRegion 2007 2010 2015 2020 2025 2030 2035
Region 1 225,051 229,460 242,508 254,681 265,455 274,475 281,437
Region 2 222,697 225,807 235,407 241,167 246,557 251,119 254,435
Region 3 1/ 307,571 313,184 331,540 347,712 361,953 373,933 382,941
Region 4 2/ 286,189 290,760 300,784 314,489 327,262 338,038 345,927
Fairfax County 1,041,507 1,059,211 1,110,239 1,158,049 1,201,227 1,237,565 1,264,740
Source: Fairfax County Department of Systems Management for Human Services, 2007 through 2035.
Note: Countywide totals may vary by table depending on how well the geographic layer aligns with actual county boundaries.
1/ Includes the Towns of Herndon and Vienna.
2/ Includes the Town of Clifton.
IV-6
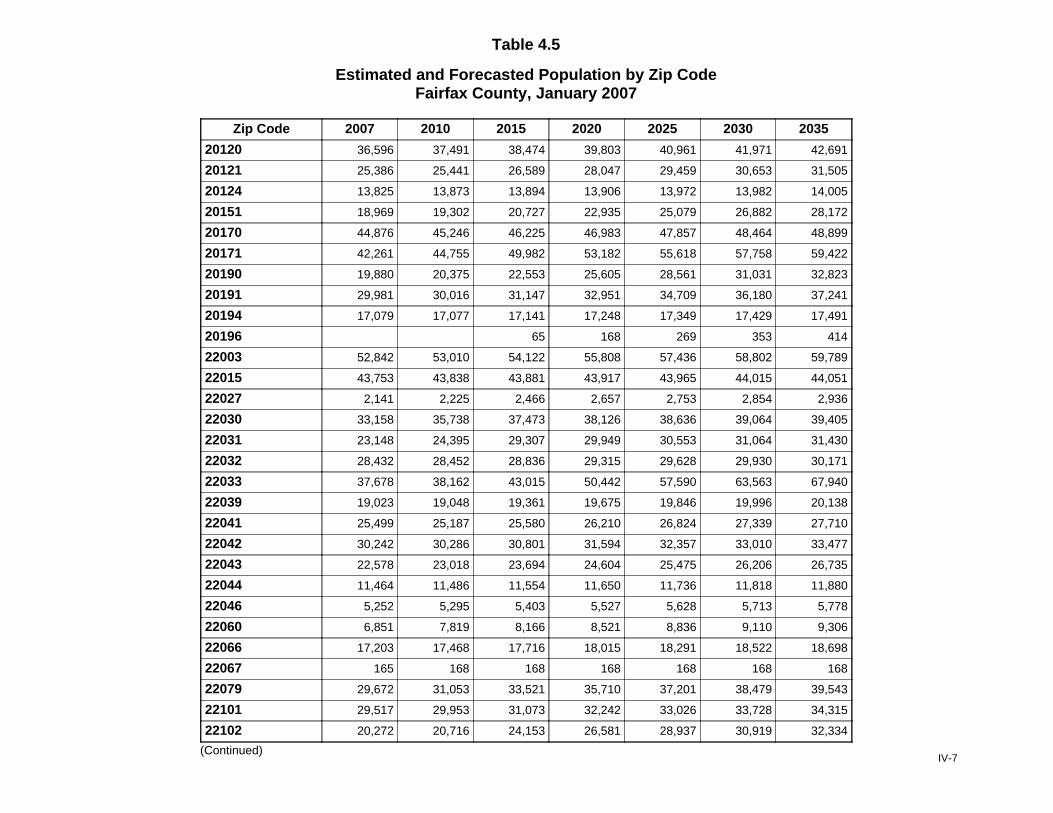
Table 4.5
Estimated and Forecasted Population by Zip CodeFairfax County, January 2007
Zip Code 2007 2010 2015 2020 2025 2030 2035
20120 36,596 37,491 38,474 39,803 40,961 41,971 42,691
20121 25,386 25,441 26,589 28,047 29,459 30,653 31,505
20124 13,825 13,873 13,894 13,906 13,972 13,982 14,005
20151 18,969 19,302 20,727 22,935 25,079 26,882 28,172
20170 44,876 45,246 46,225 46,983 47,857 48,464 48,899
20171 42,261 44,755 49,982 53,182 55,618 57,758 59,422
20190 19,880 20,375 22,553 25,605 28,561 31,031 32,823
20191 29,981 30,016 31,147 32,951 34,709 36,180 37,241
20194 17,079 17,077 17,141 17,248 17,349 17,429 17,491
20196 65 168 269 353 414
22003 52,842 53,010 54,122 55,808 57,436 58,802 59,789
22015 43,753 43,838 43,881 43,917 43,965 44,015 44,051
22027 2,141 2,225 2,466 2,657 2,753 2,854 2,936
22030 33,158 35,738 37,473 38,126 38,636 39,064 39,405
22031 23,148 24,395 29,307 29,949 30,553 31,064 31,430
22032 28,432 28,452 28,836 29,315 29,628 29,930 30,171
22033 37,678 38,162 43,015 50,442 57,590 63,563 67,940
22039 19,023 19,048 19,361 19,675 19,846 19,996 20,138
22041 25,499 25,187 25,580 26,210 26,824 27,339 27,710
22042 30,242 30,286 30,801 31,594 32,357 33,010 33,477
22043 22,578 23,018 23,694 24,604 25,475 26,206 26,735
22044 11,464 11,486 11,554 11,650 11,736 11,818 11,880
22046 5,252 5,295 5,403 5,527 5,628 5,713 5,778
22060 6,851 7,819 8,166 8,521 8,836 9,110 9,306
22066 17,203 17,468 17,716 18,015 18,291 18,522 18,698
22067 165 168 168 168 168 168 168
22079 29,672 31,053 33,521 35,710 37,201 38,479 39,543
22101 29,517 29,953 31,073 32,242 33,026 33,728 34,315
22102 20,272 20,716 24,153 26,581 28,937 30,919 32,334
(Continued)IV-7
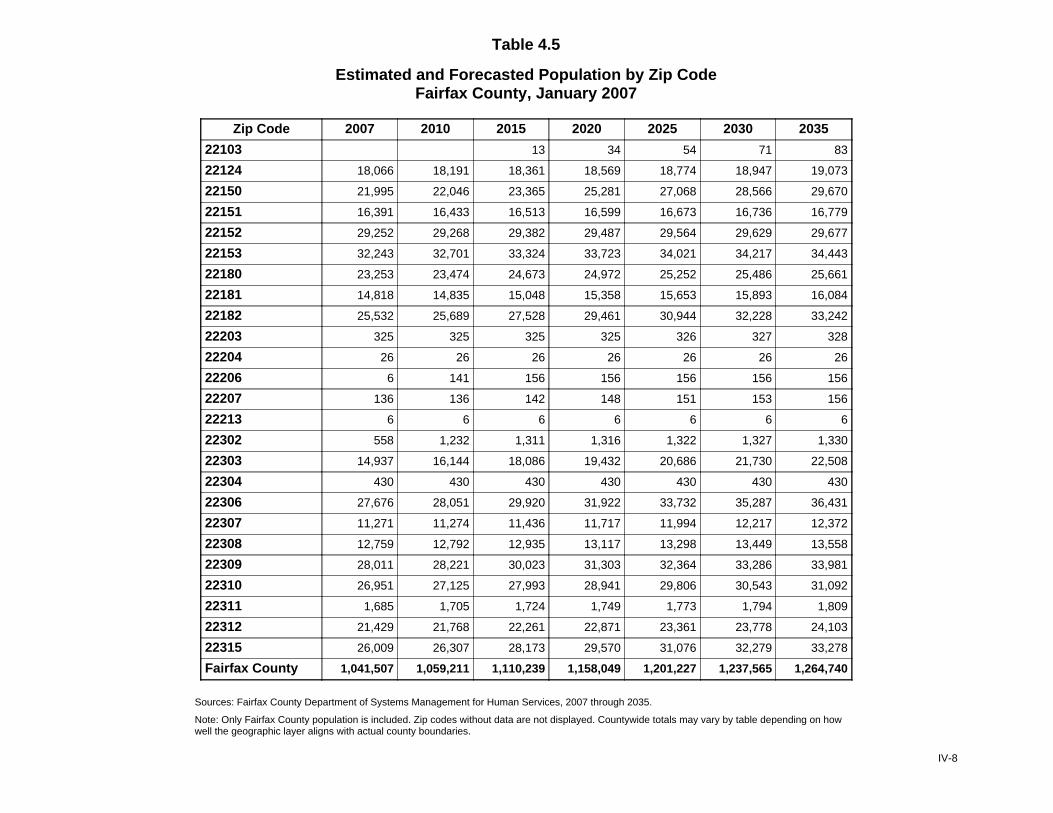
Table 4.5
Estimated and Forecasted Population by Zip CodeFairfax County, January 2007
Zip Code 2007 2010 2015 2020 2025 2030 2035
22103 13 34 54 71 83
22124 18,066 18,191 18,361 18,569 18,774 18,947 19,073
22150 21,995 22,046 23,365 25,281 27,068 28,566 29,670
22151 16,391 16,433 16,513 16,599 16,673 16,736 16,779
22152 29,252 29,268 29,382 29,487 29,564 29,629 29,677
22153 32,243 32,701 33,324 33,723 34,021 34,217 34,443
22180 23,253 23,474 24,673 24,972 25,252 25,486 25,661
22181 14,818 14,835 15,048 15,358 15,653 15,893 16,084
22182 25,532 25,689 27,528 29,461 30,944 32,228 33,242
22203 325 325 325 325 326 327 328
22204 26 26 26 26 26 26 26
22206 6 141 156 156 156 156 156
22207 136 136 142 148 151 153 156
22213 6 6 6 6 6 6 6
22302 558 1,232 1,311 1,316 1,322 1,327 1,330
22303 14,937 16,144 18,086 19,432 20,686 21,730 22,508
22304 430 430 430 430 430 430 430
22306 27,676 28,051 29,920 31,922 33,732 35,287 36,431
22307 11,271 11,274 11,436 11,717 11,994 12,217 12,372
22308 12,759 12,792 12,935 13,117 13,298 13,449 13,558
22309 28,011 28,221 30,023 31,303 32,364 33,286 33,981
22310 26,951 27,125 27,993 28,941 29,806 30,543 31,092
22311 1,685 1,705 1,724 1,749 1,773 1,794 1,809
22312 21,429 21,768 22,261 22,871 23,361 23,778 24,103
22315 26,009 26,307 28,173 29,570 31,076 32,279 33,278
Fairfax County 1,041,507 1,059,211 1,110,239 1,158,049 1,201,227 1,237,565 1,264,740
Sources: Fairfax County Department of Systems Management for Human Services, 2007 through 2035.
Note: Only Fairfax County population is included. Zip codes without data are not displayed. Countywide totals may vary by table depending on howwell the geographic layer aligns with actual county boundaries.
IV-8
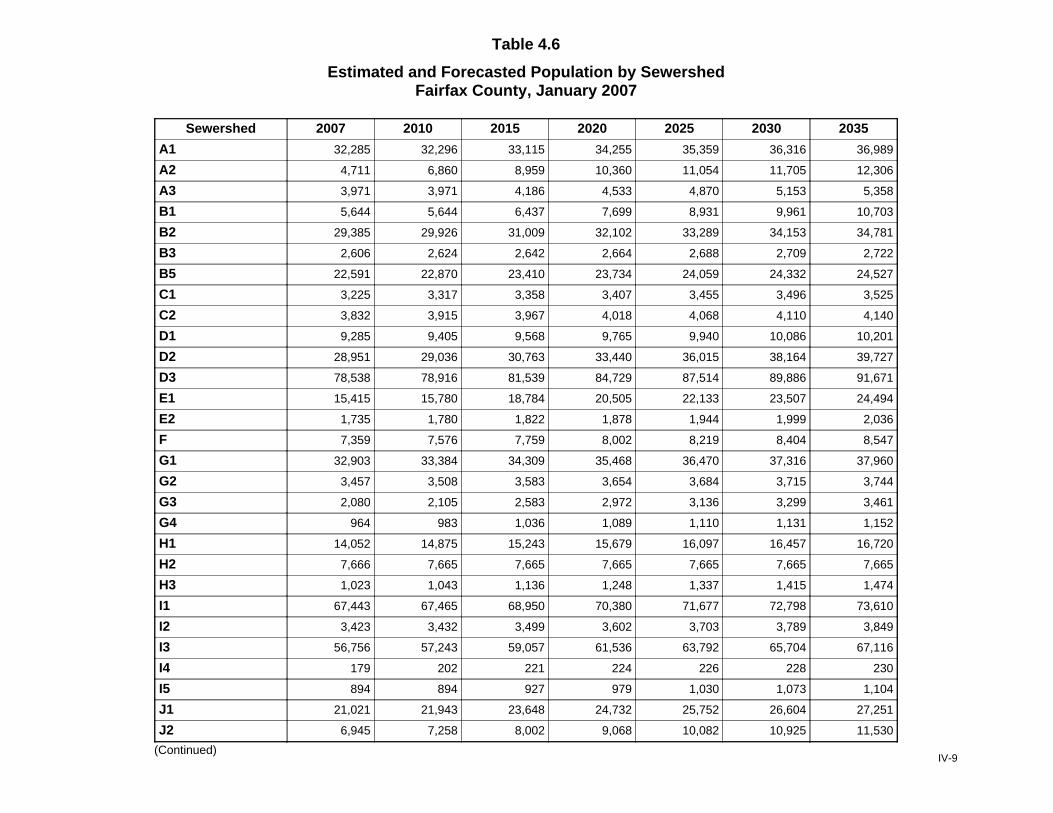
Table 4.6
Estimated and Forecasted Population by SewershedFairfax County, January 2007
Sewershed 2007 2010 2015 2020 2025 2030 2035
A1 32,285 32,296 33,115 34,255 35,359 36,316 36,989
A2 4,711 6,860 8,959 10,360 11,054 11,705 12,306
A3 3,971 3,971 4,186 4,533 4,870 5,153 5,358
B1 5,644 5,644 6,437 7,699 8,931 9,961 10,703
B2 29,385 29,926 31,009 32,102 33,289 34,153 34,781
B3 2,606 2,624 2,642 2,664 2,688 2,709 2,722
B5 22,591 22,870 23,410 23,734 24,059 24,332 24,527
C1 3,225 3,317 3,358 3,407 3,455 3,496 3,525
C2 3,832 3,915 3,967 4,018 4,068 4,110 4,140
D1 9,285 9,405 9,568 9,765 9,940 10,086 10,201
D2 28,951 29,036 30,763 33,440 36,015 38,164 39,727
D3 78,538 78,916 81,539 84,729 87,514 89,886 91,671
E1 15,415 15,780 18,784 20,505 22,133 23,507 24,494
E2 1,735 1,780 1,822 1,878 1,944 1,999 2,036
F 7,359 7,576 7,759 8,002 8,219 8,404 8,547
G1 32,903 33,384 34,309 35,468 36,470 37,316 37,960
G2 3,457 3,508 3,583 3,654 3,684 3,715 3,744
G3 2,080 2,105 2,583 2,972 3,136 3,299 3,461
G4 964 983 1,036 1,089 1,110 1,131 1,152
H1 14,052 14,875 15,243 15,679 16,097 16,457 16,720
H2 7,666 7,665 7,665 7,665 7,665 7,665 7,665
H3 1,023 1,043 1,136 1,248 1,337 1,415 1,474
I1 67,443 67,465 68,950 70,380 71,677 72,798 73,610
I2 3,423 3,432 3,499 3,602 3,703 3,789 3,849
I3 56,756 57,243 59,057 61,536 63,792 65,704 67,116
I4 179 202 221 224 226 228 230
I5 894 894 927 979 1,030 1,073 1,104
J1 21,021 21,943 23,648 24,732 25,752 26,604 27,251
J2 6,945 7,258 8,002 9,068 10,082 10,925 11,530
(Continued)IV-9
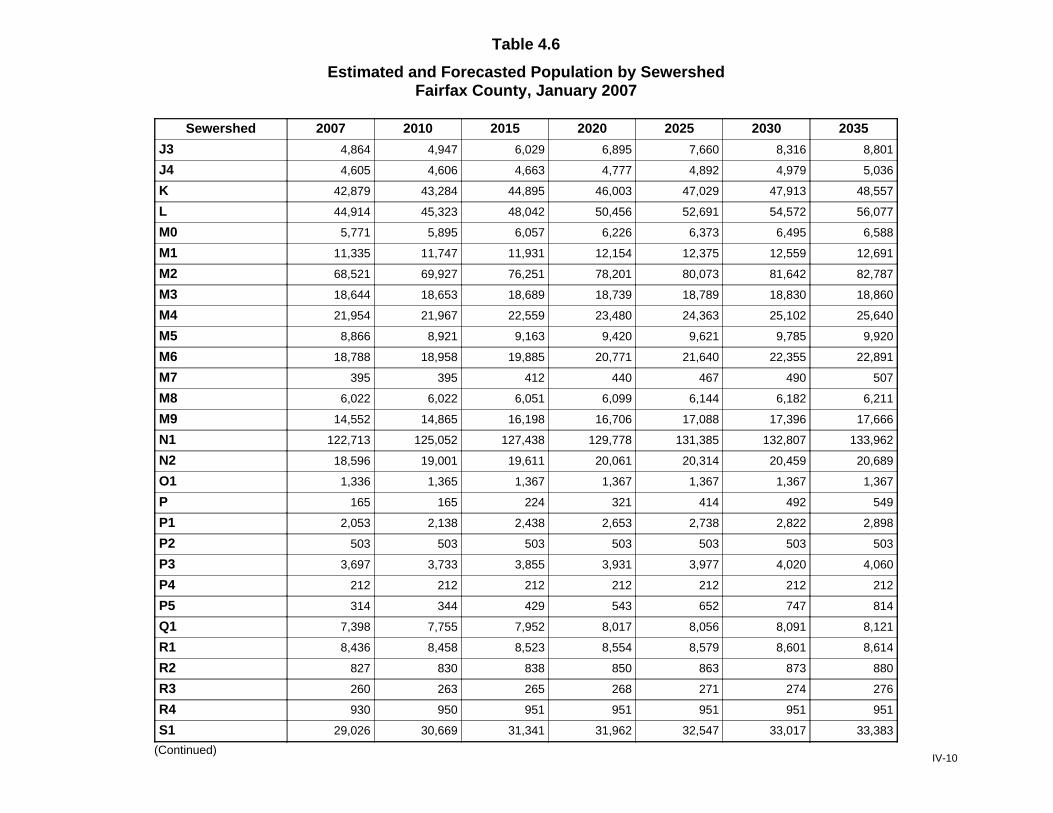
Table 4.6
Estimated and Forecasted Population by SewershedFairfax County, January 2007
Sewershed 2007 2010 2015 2020 2025 2030 2035
J3 4,864 4,947 6,029 6,895 7,660 8,316 8,801
J4 4,605 4,606 4,663 4,777 4,892 4,979 5,036
K 42,879 43,284 44,895 46,003 47,029 47,913 48,557
L 44,914 45,323 48,042 50,456 52,691 54,572 56,077
M0 5,771 5,895 6,057 6,226 6,373 6,495 6,588
M1 11,335 11,747 11,931 12,154 12,375 12,559 12,691
M2 68,521 69,927 76,251 78,201 80,073 81,642 82,787
M3 18,644 18,653 18,689 18,739 18,789 18,830 18,860
M4 21,954 21,967 22,559 23,480 24,363 25,102 25,640
M5 8,866 8,921 9,163 9,420 9,621 9,785 9,920
M6 18,788 18,958 19,885 20,771 21,640 22,355 22,891
M7 395 395 412 440 467 490 507
M8 6,022 6,022 6,051 6,099 6,144 6,182 6,211
M9 14,552 14,865 16,198 16,706 17,088 17,396 17,666
N1 122,713 125,052 127,438 129,778 131,385 132,807 133,962
N2 18,596 19,001 19,611 20,061 20,314 20,459 20,689
O1 1,336 1,365 1,367 1,367 1,367 1,367 1,367
P 165 165 224 321 414 492 549
P1 2,053 2,138 2,438 2,653 2,738 2,822 2,898
P2 503 503 503 503 503 503 503
P3 3,697 3,733 3,855 3,931 3,977 4,020 4,060
P4 212 212 212 212 212 212 212
P5 314 344 429 543 652 747 814
Q1 7,398 7,755 7,952 8,017 8,056 8,091 8,121
R1 8,436 8,458 8,523 8,554 8,579 8,601 8,614
R2 827 830 838 850 863 873 880
R3 260 263 265 268 271 274 276
R4 930 950 951 951 951 951 951
S1 29,026 30,669 31,341 31,962 32,547 33,017 33,383
(Continued)IV-10

Table 4.6
Estimated and Forecasted Population by SewershedFairfax County, January 2007
Sewershed 2007 2010 2015 2020 2025 2030 2035
S2 1,107 1,128 1,141 1,155 1,168 1,179 1,188
T1 5,597 5,954 8,185 8,710 9,220 9,653 9,964
T2 23,251 23,895 25,320 27,462 29,509 31,225 32,471
T3 16,318 16,332 16,342 16,368 16,378 16,387 16,393
T4 25,855 26,025 27,021 28,353 29,627 30,686 31,484
T5 25,505 26,033 31,197 39,029 46,621 53,003 57,586
T6 300 302 303 308 308 308 308
T7 6,647 6,667 6,774 6,930 7,051 7,162 7,237
Fairfax County 1,041,498 1,059,202 1,110,230 1,158,040 1,201,218 1,237,556 1,264,731
Source: Fairfax County Department of Systems Management for Human Services, 2007 through 2035.
Note: Countywide totals may vary by table depending on how well the geographic layer aligns with actual county boundaries.
1/ Includes the Town of Herndon.
2/ Comprises part of the Town of Vienna.
3/ Includes the Town of Clifton.
IV-11
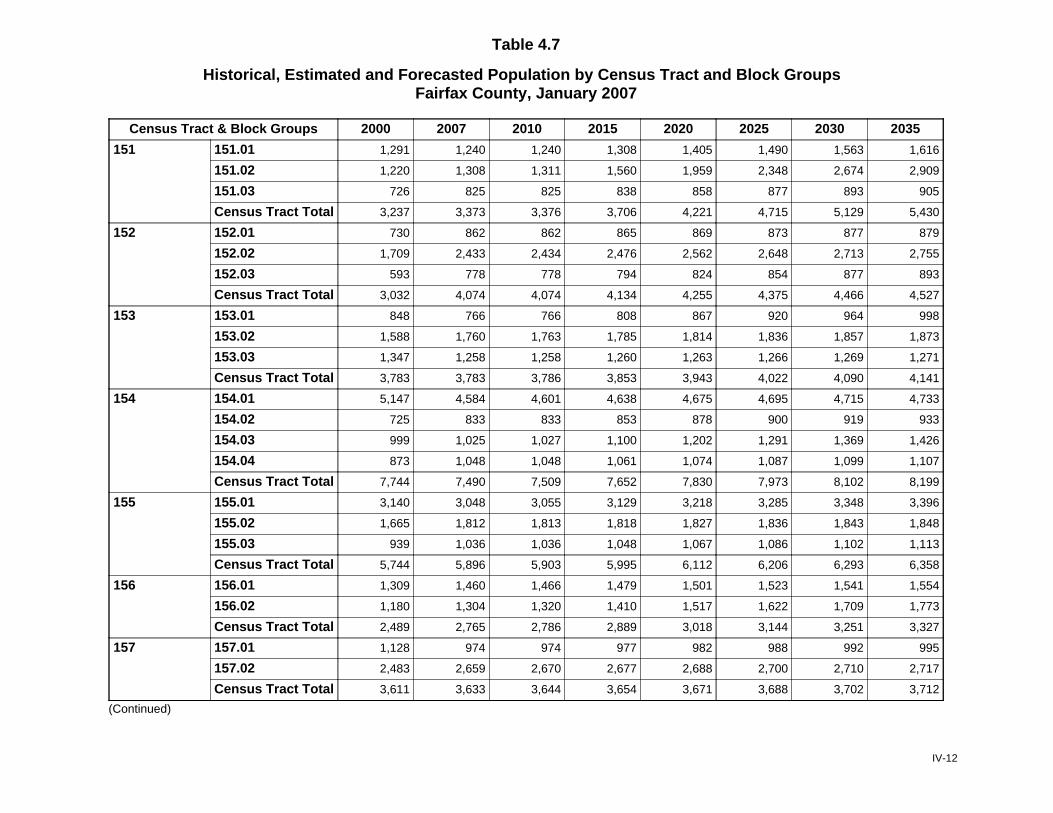
Table 4.7
Historical, Estimated and Forecasted Population by Census Tract and Block GroupsFairfax County, January 2007
Census Tract & Block Groups 2000 2007 2010 2015 2020 2025 2030 2035
151 151.01 1,291 1,240 1,240 1,308 1,405 1,490 1,563 1,616
151.02 1,220 1,308 1,311 1,560 1,959 2,348 2,674 2,909
151.03 726 825 825 838 858 877 893 905
Census Tract Total 3,237 3,373 3,376 3,706 4,221 4,715 5,129 5,430
152 152.01 730 862 862 865 869 873 877 879
152.02 1,709 2,433 2,434 2,476 2,562 2,648 2,713 2,755
152.03 593 778 778 794 824 854 877 893
Census Tract Total 3,032 4,074 4,074 4,134 4,255 4,375 4,466 4,527
153 153.01 848 766 766 808 867 920 964 998
153.02 1,588 1,760 1,763 1,785 1,814 1,836 1,857 1,873
153.03 1,347 1,258 1,258 1,260 1,263 1,266 1,269 1,271
Census Tract Total 3,783 3,783 3,786 3,853 3,943 4,022 4,090 4,141
154 154.01 5,147 4,584 4,601 4,638 4,675 4,695 4,715 4,733
154.02 725 833 833 853 878 900 919 933
154.03 999 1,025 1,027 1,100 1,202 1,291 1,369 1,426
154.04 873 1,048 1,048 1,061 1,074 1,087 1,099 1,107
Census Tract Total 7,744 7,490 7,509 7,652 7,830 7,973 8,102 8,199
155 155.01 3,140 3,048 3,055 3,129 3,218 3,285 3,348 3,396
155.02 1,665 1,812 1,813 1,818 1,827 1,836 1,843 1,848
155.03 939 1,036 1,036 1,048 1,067 1,086 1,102 1,113
Census Tract Total 5,744 5,896 5,903 5,995 6,112 6,206 6,293 6,358
156 156.01 1,309 1,460 1,466 1,479 1,501 1,523 1,541 1,554
156.02 1,180 1,304 1,320 1,410 1,517 1,622 1,709 1,773
Census Tract Total 2,489 2,765 2,786 2,889 3,018 3,144 3,251 3,327
157 157.01 1,128 974 974 977 982 988 992 995
157.02 2,483 2,659 2,670 2,677 2,688 2,700 2,710 2,717
Census Tract Total 3,611 3,633 3,644 3,654 3,671 3,688 3,702 3,712
(Continued)
IV-12

Table 4.7
Historical, Estimated and Forecasted Population by Census Tract and Block GroupsFairfax County, January 2007
Census Tract & Block Groups 2000 2007 2010 2015 2020 2025 2030 2035
158 158.01 1,638 1,754 1,754 1,755 1,756 1,757 1,757 1,758
158.02 1,531 1,463 1,464 1,479 1,496 1,512 1,525 1,535
158.03 1,265 1,326 1,326 1,333 1,345 1,357 1,367 1,374
Census Tract Total 4,434 4,543 4,544 4,567 4,597 4,625 4,650 4,667
159 159.01 2,101 2,246 2,268 2,303 2,323 2,342 2,357 2,369
159.02 933 900 900 905 912 921 928 933
Census Tract Total 3,034 3,146 3,167 3,207 3,236 3,262 3,285 3,302
160 160.01 921 1,415 1,466 1,583 1,771 1,955 2,110 2,221
160.02 2,400 2,665 2,665 2,725 2,823 2,917 2,998 3,057
160.03 759 770 771 784 801 819 833 844
Census Tract Total 4,080 4,850 4,901 5,092 5,395 5,691 5,942 6,121
161 161.01 2,273 2,517 2,539 2,621 2,735 2,843 2,935 3,001
161.02 1,188 1,315 1,353 1,411 1,489 1,570 1,638 1,685
Census Tract Total 3,461 3,832 3,892 4,032 4,224 4,413 4,572 4,686
162 162.01 4,178 5,617 5,617 5,617 5,617 5,617 5,617 5,617
Census Tract Total 4,178 5,617 5,617 5,617 5,617 5,617 5,617 5,617
163 163.01 701 998 1,024 1,046 1,078 1,110 1,136 1,155
163.02 1,072 1,235 1,238 1,253 1,278 1,302 1,322 1,336
Census Tract Total 1,773 2,233 2,262 2,299 2,356 2,412 2,458 2,492
201 201.01 1,252 1,025 1,024 1,024 1,024 1,024 1,024 1,024
201.02 2,014 2,488 2,488 2,511 2,547 2,579 2,611 2,631
Census Tract Total 3,266 3,512 3,512 3,536 3,571 3,604 3,635 3,655
202 202.01 1,222 1,199 1,205 1,227 1,252 1,265 1,285 1,301
202.02 2,477 3,381 3,391 3,458 3,530 3,582 3,628 3,666
202.03 2,241 2,657 2,678 2,914 3,235 3,547 3,812 3,999
202.04 1,006 895 895 904 913 930 939 947
Census Tract Total 6,946 8,131 8,169 8,503 8,929 9,324 9,663 9,914
(Continued)
IV-13
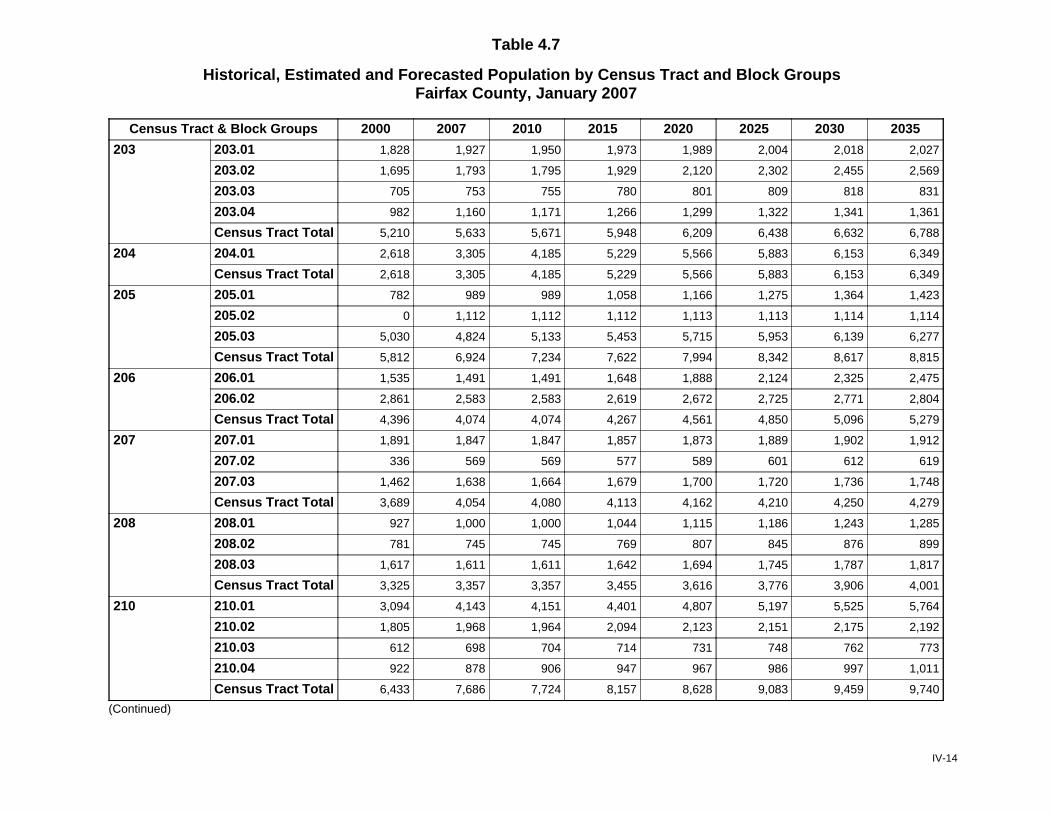
Table 4.7
Historical, Estimated and Forecasted Population by Census Tract and Block GroupsFairfax County, January 2007
Census Tract & Block Groups 2000 2007 2010 2015 2020 2025 2030 2035
203 203.01 1,828 1,927 1,950 1,973 1,989 2,004 2,018 2,027
203.02 1,695 1,793 1,795 1,929 2,120 2,302 2,455 2,569
203.03 705 753 755 780 801 809 818 831
203.04 982 1,160 1,171 1,266 1,299 1,322 1,341 1,361
Census Tract Total 5,210 5,633 5,671 5,948 6,209 6,438 6,632 6,788
204 204.01 2,618 3,305 4,185 5,229 5,566 5,883 6,153 6,349
Census Tract Total 2,618 3,305 4,185 5,229 5,566 5,883 6,153 6,349
205 205.01 782 989 989 1,058 1,166 1,275 1,364 1,423
205.02 0 1,112 1,112 1,112 1,113 1,113 1,114 1,114
205.03 5,030 4,824 5,133 5,453 5,715 5,953 6,139 6,277
Census Tract Total 5,812 6,924 7,234 7,622 7,994 8,342 8,617 8,815
206 206.01 1,535 1,491 1,491 1,648 1,888 2,124 2,325 2,475
206.02 2,861 2,583 2,583 2,619 2,672 2,725 2,771 2,804
Census Tract Total 4,396 4,074 4,074 4,267 4,561 4,850 5,096 5,279
207 207.01 1,891 1,847 1,847 1,857 1,873 1,889 1,902 1,912
207.02 336 569 569 577 589 601 612 619
207.03 1,462 1,638 1,664 1,679 1,700 1,720 1,736 1,748
Census Tract Total 3,689 4,054 4,080 4,113 4,162 4,210 4,250 4,279
208 208.01 927 1,000 1,000 1,044 1,115 1,186 1,243 1,285
208.02 781 745 745 769 807 845 876 899
208.03 1,617 1,611 1,611 1,642 1,694 1,745 1,787 1,817
Census Tract Total 3,325 3,357 3,357 3,455 3,616 3,776 3,906 4,001
210 210.01 3,094 4,143 4,151 4,401 4,807 5,197 5,525 5,764
210.02 1,805 1,968 1,964 2,094 2,123 2,151 2,175 2,192
210.03 612 698 704 714 731 748 762 773
210.04 922 878 906 947 967 986 997 1,011
Census Tract Total 6,433 7,686 7,724 8,157 8,628 9,083 9,459 9,740
(Continued)
IV-14
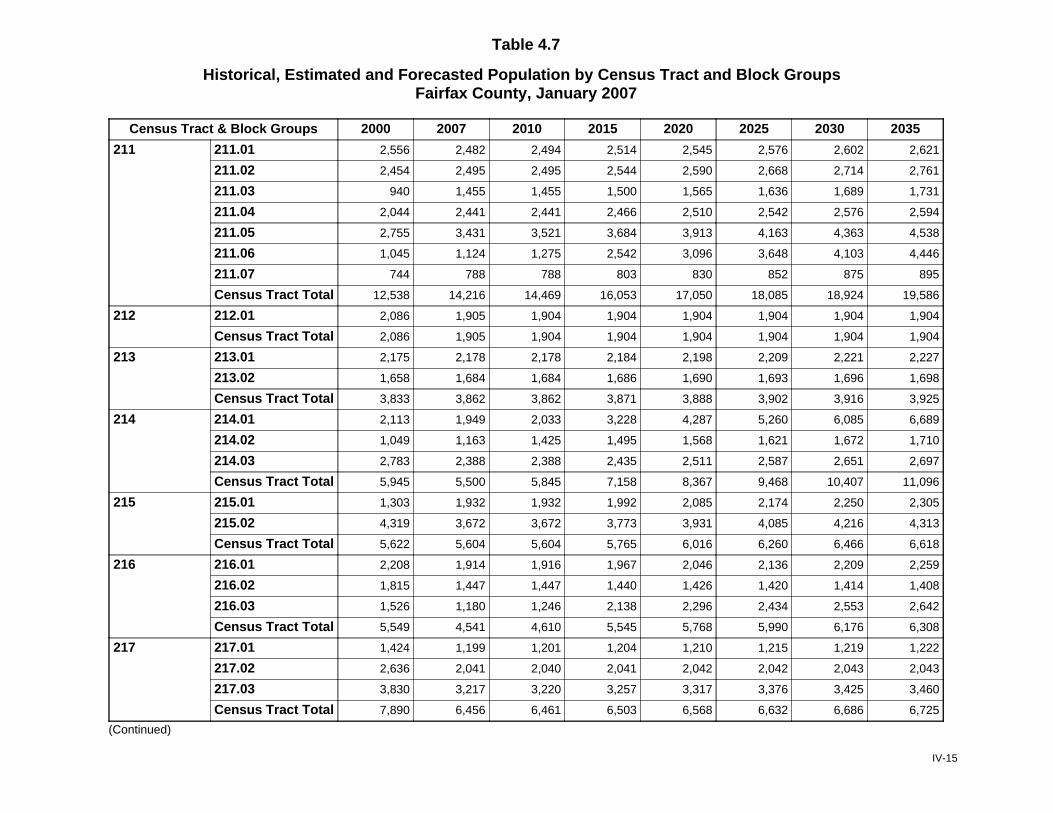
Table 4.7
Historical, Estimated and Forecasted Population by Census Tract and Block GroupsFairfax County, January 2007
Census Tract & Block Groups 2000 2007 2010 2015 2020 2025 2030 2035
211 211.01 2,556 2,482 2,494 2,514 2,545 2,576 2,602 2,621
211.02 2,454 2,495 2,495 2,544 2,590 2,668 2,714 2,761
211.03 940 1,455 1,455 1,500 1,565 1,636 1,689 1,731
211.04 2,044 2,441 2,441 2,466 2,510 2,542 2,576 2,594
211.05 2,755 3,431 3,521 3,684 3,913 4,163 4,363 4,538
211.06 1,045 1,124 1,275 2,542 3,096 3,648 4,103 4,446
211.07 744 788 788 803 830 852 875 895
Census Tract Total 12,538 14,216 14,469 16,053 17,050 18,085 18,924 19,586
212 212.01 2,086 1,905 1,904 1,904 1,904 1,904 1,904 1,904
Census Tract Total 2,086 1,905 1,904 1,904 1,904 1,904 1,904 1,904
213 213.01 2,175 2,178 2,178 2,184 2,198 2,209 2,221 2,227
213.02 1,658 1,684 1,684 1,686 1,690 1,693 1,696 1,698
Census Tract Total 3,833 3,862 3,862 3,871 3,888 3,902 3,916 3,925
214 214.01 2,113 1,949 2,033 3,228 4,287 5,260 6,085 6,689
214.02 1,049 1,163 1,425 1,495 1,568 1,621 1,672 1,710
214.03 2,783 2,388 2,388 2,435 2,511 2,587 2,651 2,697
Census Tract Total 5,945 5,500 5,845 7,158 8,367 9,468 10,407 11,096
215 215.01 1,303 1,932 1,932 1,992 2,085 2,174 2,250 2,305
215.02 4,319 3,672 3,672 3,773 3,931 4,085 4,216 4,313
Census Tract Total 5,622 5,604 5,604 5,765 6,016 6,260 6,466 6,618
216 216.01 2,208 1,914 1,916 1,967 2,046 2,136 2,209 2,259
216.02 1,815 1,447 1,447 1,440 1,426 1,420 1,414 1,408
216.03 1,526 1,180 1,246 2,138 2,296 2,434 2,553 2,642
Census Tract Total 5,549 4,541 4,610 5,545 5,768 5,990 6,176 6,308
217 217.01 1,424 1,199 1,201 1,204 1,210 1,215 1,219 1,222
217.02 2,636 2,041 2,040 2,041 2,042 2,042 2,043 2,043
217.03 3,830 3,217 3,220 3,257 3,317 3,376 3,425 3,460
Census Tract Total 7,890 6,456 6,461 6,503 6,568 6,632 6,686 6,725
(Continued)
IV-15
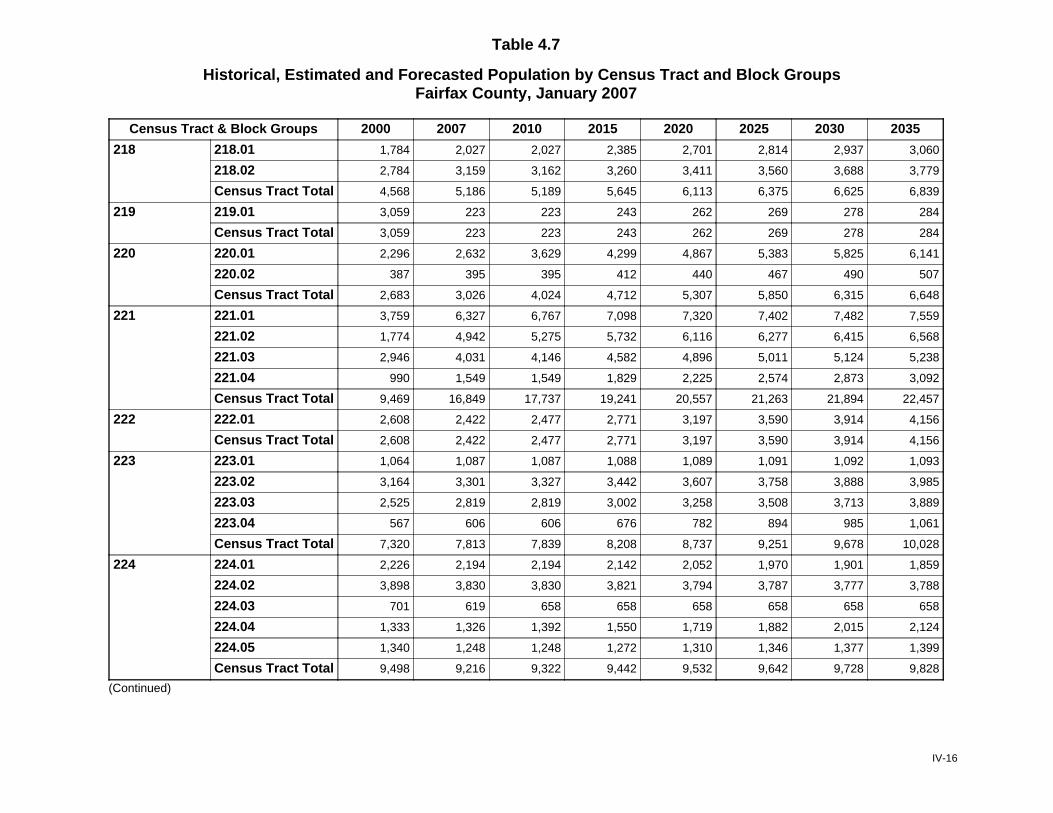
Table 4.7
Historical, Estimated and Forecasted Population by Census Tract and Block GroupsFairfax County, January 2007
Census Tract & Block Groups 2000 2007 2010 2015 2020 2025 2030 2035
218 218.01 1,784 2,027 2,027 2,385 2,701 2,814 2,937 3,060
218.02 2,784 3,159 3,162 3,260 3,411 3,560 3,688 3,779
Census Tract Total 4,568 5,186 5,189 5,645 6,113 6,375 6,625 6,839
219 219.01 3,059 223 223 243 262 269 278 284
Census Tract Total 3,059 223 223 243 262 269 278 284
220 220.01 2,296 2,632 3,629 4,299 4,867 5,383 5,825 6,141
220.02 387 395 395 412 440 467 490 507
Census Tract Total 2,683 3,026 4,024 4,712 5,307 5,850 6,315 6,648
221 221.01 3,759 6,327 6,767 7,098 7,320 7,402 7,482 7,559
221.02 1,774 4,942 5,275 5,732 6,116 6,277 6,415 6,568
221.03 2,946 4,031 4,146 4,582 4,896 5,011 5,124 5,238
221.04 990 1,549 1,549 1,829 2,225 2,574 2,873 3,092
Census Tract Total 9,469 16,849 17,737 19,241 20,557 21,263 21,894 22,457
222 222.01 2,608 2,422 2,477 2,771 3,197 3,590 3,914 4,156
Census Tract Total 2,608 2,422 2,477 2,771 3,197 3,590 3,914 4,156
223 223.01 1,064 1,087 1,087 1,088 1,089 1,091 1,092 1,093
223.02 3,164 3,301 3,327 3,442 3,607 3,758 3,888 3,985
223.03 2,525 2,819 2,819 3,002 3,258 3,508 3,713 3,889
223.04 567 606 606 676 782 894 985 1,061
Census Tract Total 7,320 7,813 7,839 8,208 8,737 9,251 9,678 10,028
224 224.01 2,226 2,194 2,194 2,142 2,052 1,970 1,901 1,859
224.02 3,898 3,830 3,830 3,821 3,794 3,787 3,777 3,788
224.03 701 619 658 658 658 658 658 658
224.04 1,333 1,326 1,392 1,550 1,719 1,882 2,015 2,124
224.05 1,340 1,248 1,248 1,272 1,310 1,346 1,377 1,399
Census Tract Total 9,498 9,216 9,322 9,442 9,532 9,642 9,728 9,828
(Continued)
IV-16
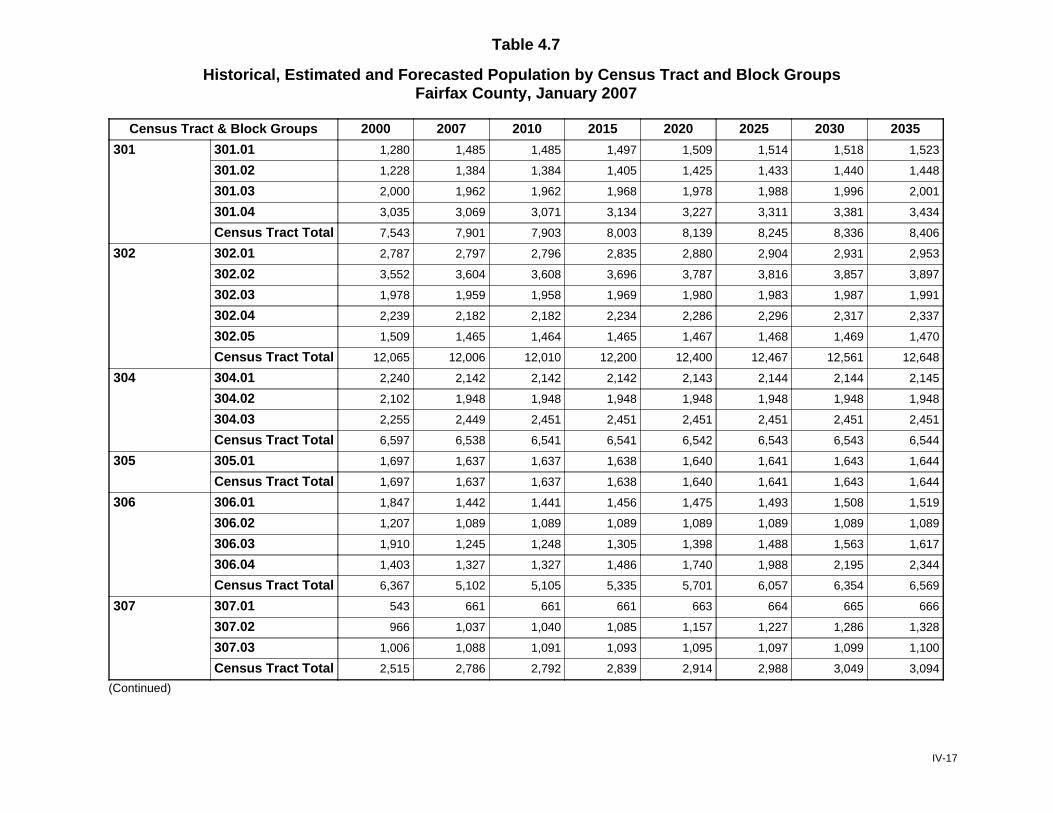
Table 4.7
Historical, Estimated and Forecasted Population by Census Tract and Block GroupsFairfax County, January 2007
Census Tract & Block Groups 2000 2007 2010 2015 2020 2025 2030 2035
301 301.01 1,280 1,485 1,485 1,497 1,509 1,514 1,518 1,523
301.02 1,228 1,384 1,384 1,405 1,425 1,433 1,440 1,448
301.03 2,000 1,962 1,962 1,968 1,978 1,988 1,996 2,001
301.04 3,035 3,069 3,071 3,134 3,227 3,311 3,381 3,434
Census Tract Total 7,543 7,901 7,903 8,003 8,139 8,245 8,336 8,406
302 302.01 2,787 2,797 2,796 2,835 2,880 2,904 2,931 2,953
302.02 3,552 3,604 3,608 3,696 3,787 3,816 3,857 3,897
302.03 1,978 1,959 1,958 1,969 1,980 1,983 1,987 1,991
302.04 2,239 2,182 2,182 2,234 2,286 2,296 2,317 2,337
302.05 1,509 1,465 1,464 1,465 1,467 1,468 1,469 1,470
Census Tract Total 12,065 12,006 12,010 12,200 12,400 12,467 12,561 12,648
304 304.01 2,240 2,142 2,142 2,142 2,143 2,144 2,144 2,145
304.02 2,102 1,948 1,948 1,948 1,948 1,948 1,948 1,948
304.03 2,255 2,449 2,451 2,451 2,451 2,451 2,451 2,451
Census Tract Total 6,597 6,538 6,541 6,541 6,542 6,543 6,543 6,544
305 305.01 1,697 1,637 1,637 1,638 1,640 1,641 1,643 1,644
Census Tract Total 1,697 1,637 1,637 1,638 1,640 1,641 1,643 1,644
306 306.01 1,847 1,442 1,441 1,456 1,475 1,493 1,508 1,519
306.02 1,207 1,089 1,089 1,089 1,089 1,089 1,089 1,089
306.03 1,910 1,245 1,248 1,305 1,398 1,488 1,563 1,617
306.04 1,403 1,327 1,327 1,486 1,740 1,988 2,195 2,344
Census Tract Total 6,367 5,102 5,105 5,335 5,701 6,057 6,354 6,569
307 307.01 543 661 661 661 663 664 665 666
307.02 966 1,037 1,040 1,085 1,157 1,227 1,286 1,328
307.03 1,006 1,088 1,091 1,093 1,095 1,097 1,099 1,100
Census Tract Total 2,515 2,786 2,792 2,839 2,914 2,988 3,049 3,094
(Continued)
IV-17
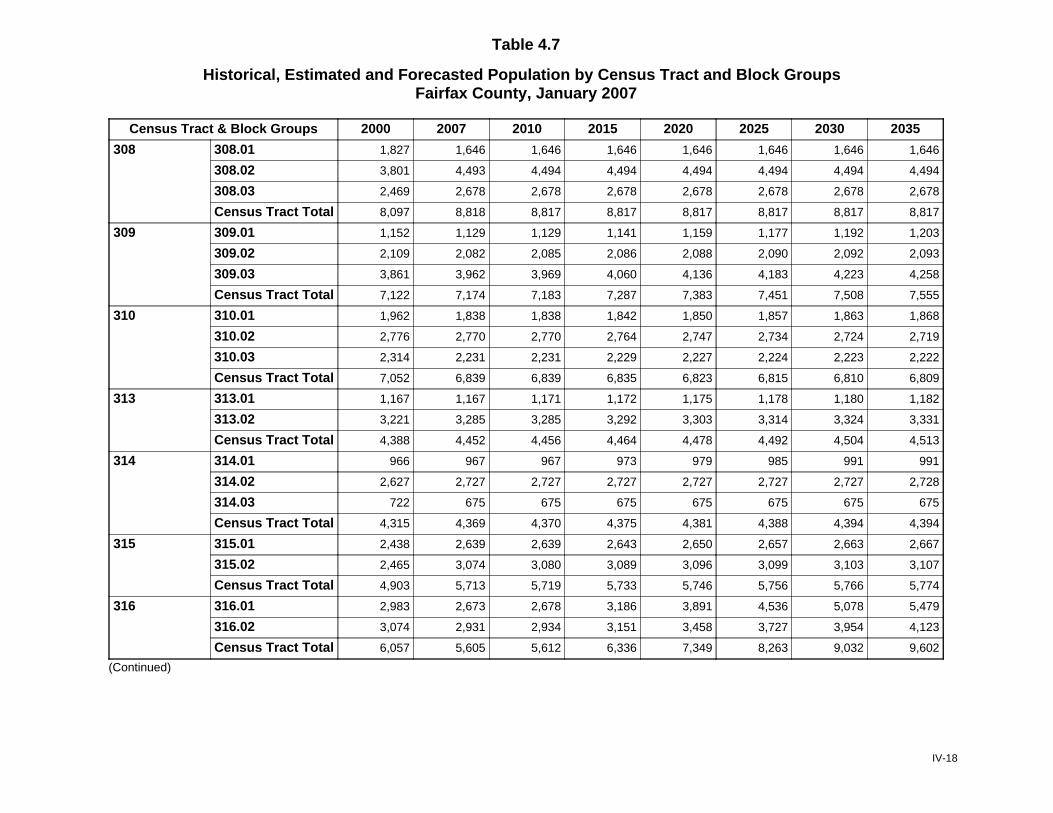
Table 4.7
Historical, Estimated and Forecasted Population by Census Tract and Block GroupsFairfax County, January 2007
Census Tract & Block Groups 2000 2007 2010 2015 2020 2025 2030 2035
308 308.01 1,827 1,646 1,646 1,646 1,646 1,646 1,646 1,646
308.02 3,801 4,493 4,494 4,494 4,494 4,494 4,494 4,494
308.03 2,469 2,678 2,678 2,678 2,678 2,678 2,678 2,678
Census Tract Total 8,097 8,818 8,817 8,817 8,817 8,817 8,817 8,817
309 309.01 1,152 1,129 1,129 1,141 1,159 1,177 1,192 1,203
309.02 2,109 2,082 2,085 2,086 2,088 2,090 2,092 2,093
309.03 3,861 3,962 3,969 4,060 4,136 4,183 4,223 4,258
Census Tract Total 7,122 7,174 7,183 7,287 7,383 7,451 7,508 7,555
310 310.01 1,962 1,838 1,838 1,842 1,850 1,857 1,863 1,868
310.02 2,776 2,770 2,770 2,764 2,747 2,734 2,724 2,719
310.03 2,314 2,231 2,231 2,229 2,227 2,224 2,223 2,222
Census Tract Total 7,052 6,839 6,839 6,835 6,823 6,815 6,810 6,809
313 313.01 1,167 1,167 1,171 1,172 1,175 1,178 1,180 1,182
313.02 3,221 3,285 3,285 3,292 3,303 3,314 3,324 3,331
Census Tract Total 4,388 4,452 4,456 4,464 4,478 4,492 4,504 4,513
314 314.01 966 967 967 973 979 985 991 991
314.02 2,627 2,727 2,727 2,727 2,727 2,727 2,727 2,728
314.03 722 675 675 675 675 675 675 675
Census Tract Total 4,315 4,369 4,370 4,375 4,381 4,388 4,394 4,394
315 315.01 2,438 2,639 2,639 2,643 2,650 2,657 2,663 2,667
315.02 2,465 3,074 3,080 3,089 3,096 3,099 3,103 3,107
Census Tract Total 4,903 5,713 5,719 5,733 5,746 5,756 5,766 5,774
316 316.01 2,983 2,673 2,678 3,186 3,891 4,536 5,078 5,479
316.02 3,074 2,931 2,934 3,151 3,458 3,727 3,954 4,123
Census Tract Total 6,057 5,605 5,612 6,336 7,349 8,263 9,032 9,602
(Continued)
IV-18
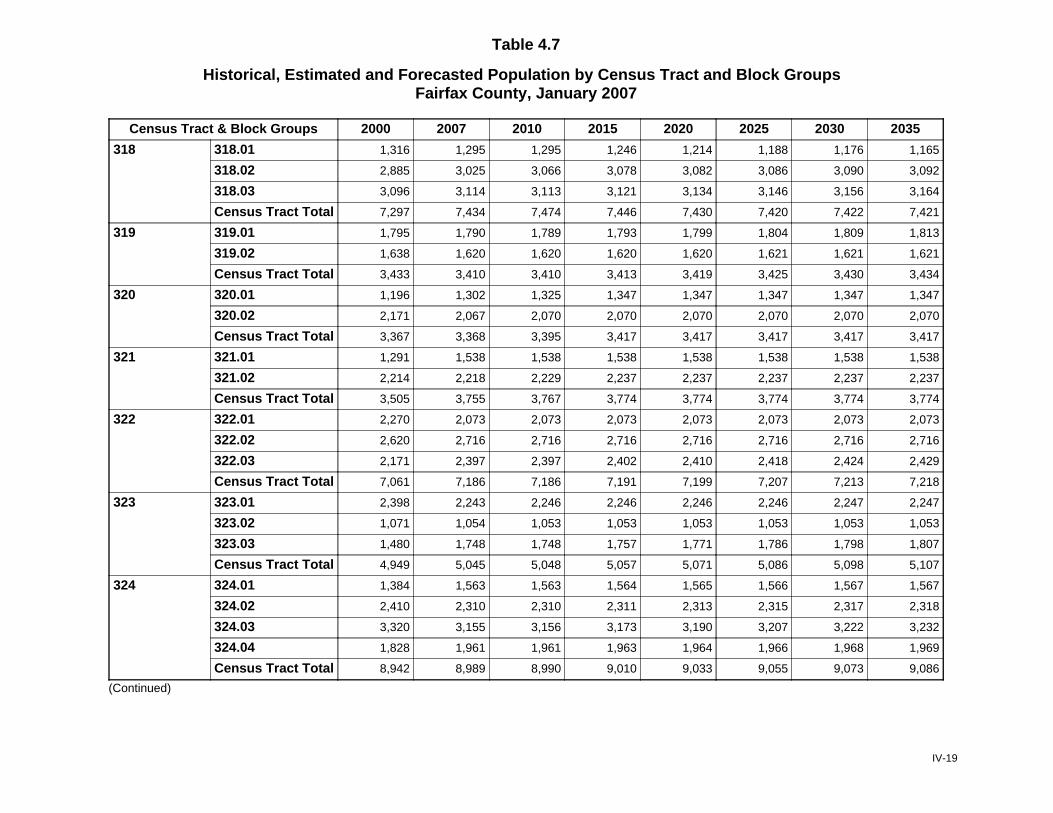
Table 4.7
Historical, Estimated and Forecasted Population by Census Tract and Block GroupsFairfax County, January 2007
Census Tract & Block Groups 2000 2007 2010 2015 2020 2025 2030 2035
318 318.01 1,316 1,295 1,295 1,246 1,214 1,188 1,176 1,165
318.02 2,885 3,025 3,066 3,078 3,082 3,086 3,090 3,092
318.03 3,096 3,114 3,113 3,121 3,134 3,146 3,156 3,164
Census Tract Total 7,297 7,434 7,474 7,446 7,430 7,420 7,422 7,421
319 319.01 1,795 1,790 1,789 1,793 1,799 1,804 1,809 1,813
319.02 1,638 1,620 1,620 1,620 1,620 1,621 1,621 1,621
Census Tract Total 3,433 3,410 3,410 3,413 3,419 3,425 3,430 3,434
320 320.01 1,196 1,302 1,325 1,347 1,347 1,347 1,347 1,347
320.02 2,171 2,067 2,070 2,070 2,070 2,070 2,070 2,070
Census Tract Total 3,367 3,368 3,395 3,417 3,417 3,417 3,417 3,417
321 321.01 1,291 1,538 1,538 1,538 1,538 1,538 1,538 1,538
321.02 2,214 2,218 2,229 2,237 2,237 2,237 2,237 2,237
Census Tract Total 3,505 3,755 3,767 3,774 3,774 3,774 3,774 3,774
322 322.01 2,270 2,073 2,073 2,073 2,073 2,073 2,073 2,073
322.02 2,620 2,716 2,716 2,716 2,716 2,716 2,716 2,716
322.03 2,171 2,397 2,397 2,402 2,410 2,418 2,424 2,429
Census Tract Total 7,061 7,186 7,186 7,191 7,199 7,207 7,213 7,218
323 323.01 2,398 2,243 2,246 2,246 2,246 2,246 2,247 2,247
323.02 1,071 1,054 1,053 1,053 1,053 1,053 1,053 1,053
323.03 1,480 1,748 1,748 1,757 1,771 1,786 1,798 1,807
Census Tract Total 4,949 5,045 5,048 5,057 5,071 5,086 5,098 5,107
324 324.01 1,384 1,563 1,563 1,564 1,565 1,566 1,567 1,567
324.02 2,410 2,310 2,310 2,311 2,313 2,315 2,317 2,318
324.03 3,320 3,155 3,156 3,173 3,190 3,207 3,222 3,232
324.04 1,828 1,961 1,961 1,963 1,964 1,966 1,968 1,969
Census Tract Total 8,942 8,989 8,990 9,010 9,033 9,055 9,073 9,086
(Continued)
IV-19
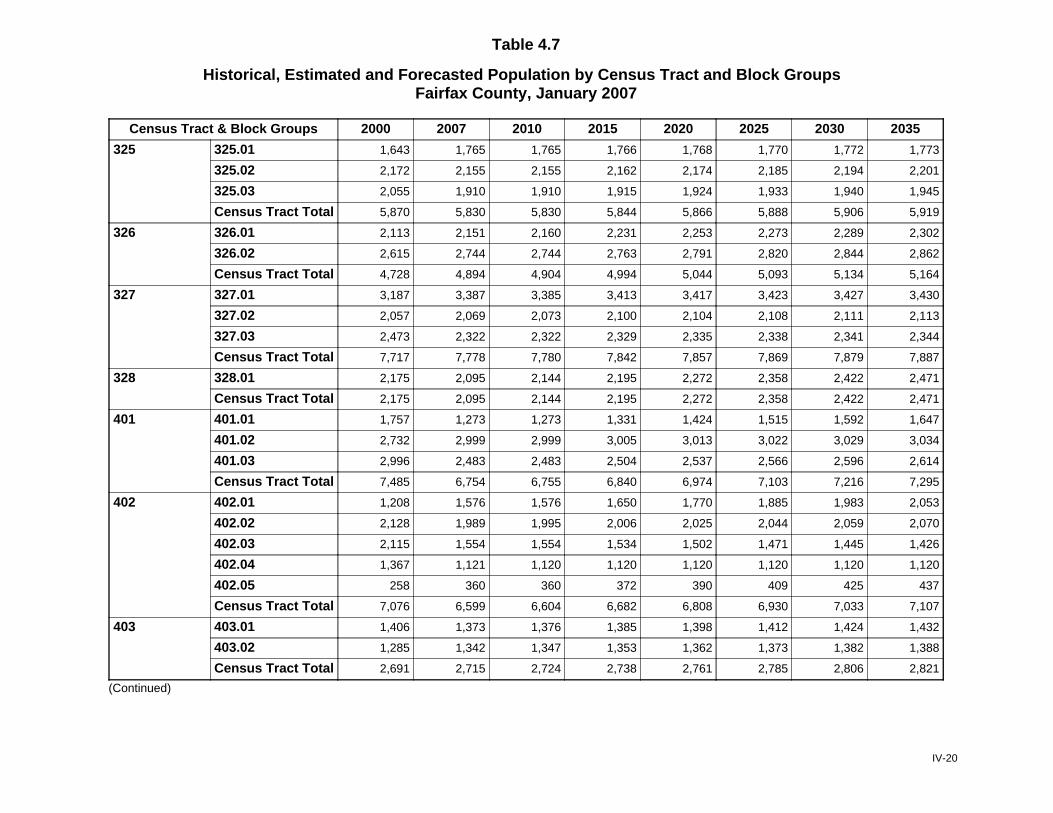
Table 4.7
Historical, Estimated and Forecasted Population by Census Tract and Block GroupsFairfax County, January 2007
Census Tract & Block Groups 2000 2007 2010 2015 2020 2025 2030 2035
325 325.01 1,643 1,765 1,765 1,766 1,768 1,770 1,772 1,773
325.02 2,172 2,155 2,155 2,162 2,174 2,185 2,194 2,201
325.03 2,055 1,910 1,910 1,915 1,924 1,933 1,940 1,945
Census Tract Total 5,870 5,830 5,830 5,844 5,866 5,888 5,906 5,919
326 326.01 2,113 2,151 2,160 2,231 2,253 2,273 2,289 2,302
326.02 2,615 2,744 2,744 2,763 2,791 2,820 2,844 2,862
Census Tract Total 4,728 4,894 4,904 4,994 5,044 5,093 5,134 5,164
327 327.01 3,187 3,387 3,385 3,413 3,417 3,423 3,427 3,430
327.02 2,057 2,069 2,073 2,100 2,104 2,108 2,111 2,113
327.03 2,473 2,322 2,322 2,329 2,335 2,338 2,341 2,344
Census Tract Total 7,717 7,778 7,780 7,842 7,857 7,869 7,879 7,887
328 328.01 2,175 2,095 2,144 2,195 2,272 2,358 2,422 2,471
Census Tract Total 2,175 2,095 2,144 2,195 2,272 2,358 2,422 2,471
401 401.01 1,757 1,273 1,273 1,331 1,424 1,515 1,592 1,647
401.02 2,732 2,999 2,999 3,005 3,013 3,022 3,029 3,034
401.03 2,996 2,483 2,483 2,504 2,537 2,566 2,596 2,614
Census Tract Total 7,485 6,754 6,755 6,840 6,974 7,103 7,216 7,295
402 402.01 1,208 1,576 1,576 1,650 1,770 1,885 1,983 2,053
402.02 2,128 1,989 1,995 2,006 2,025 2,044 2,059 2,070
402.03 2,115 1,554 1,554 1,534 1,502 1,471 1,445 1,426
402.04 1,367 1,121 1,120 1,120 1,120 1,120 1,120 1,120
402.05 258 360 360 372 390 409 425 437
Census Tract Total 7,076 6,599 6,604 6,682 6,808 6,930 7,033 7,107
403 403.01 1,406 1,373 1,376 1,385 1,398 1,412 1,424 1,432
403.02 1,285 1,342 1,347 1,353 1,362 1,373 1,382 1,388
Census Tract Total 2,691 2,715 2,724 2,738 2,761 2,785 2,806 2,821
(Continued)
IV-20
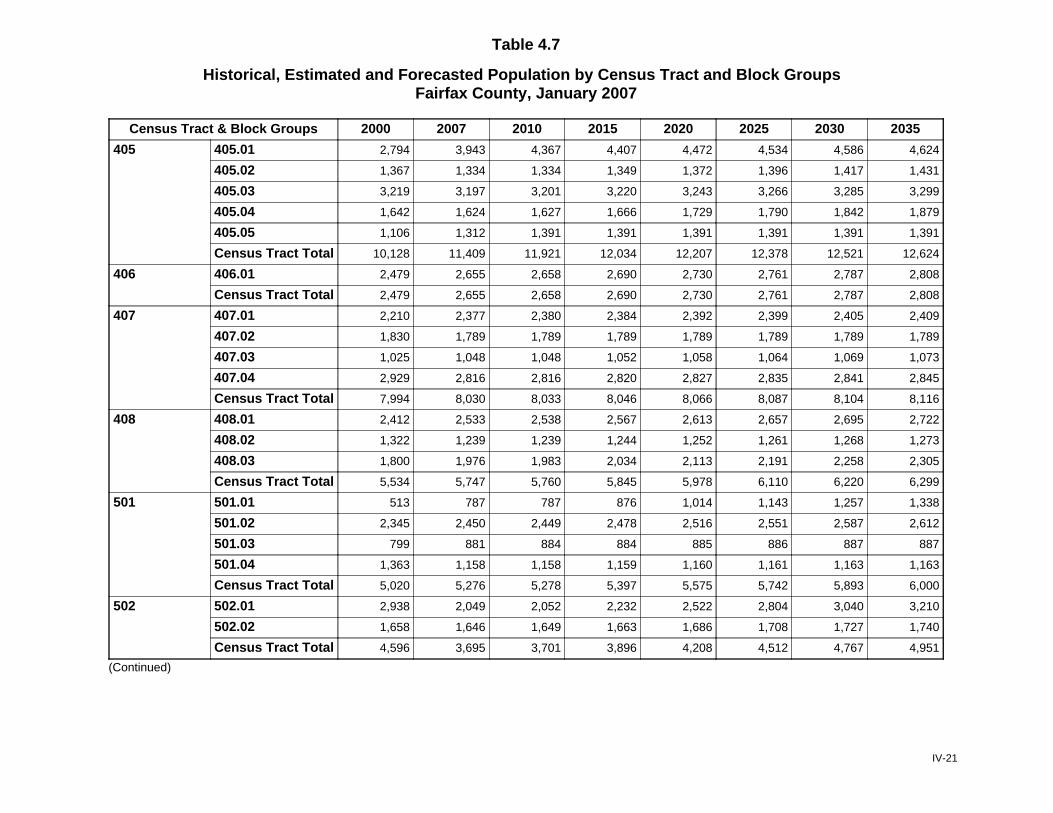
Table 4.7
Historical, Estimated and Forecasted Population by Census Tract and Block GroupsFairfax County, January 2007
Census Tract & Block Groups 2000 2007 2010 2015 2020 2025 2030 2035
405 405.01 2,794 3,943 4,367 4,407 4,472 4,534 4,586 4,624
405.02 1,367 1,334 1,334 1,349 1,372 1,396 1,417 1,431
405.03 3,219 3,197 3,201 3,220 3,243 3,266 3,285 3,299
405.04 1,642 1,624 1,627 1,666 1,729 1,790 1,842 1,879
405.05 1,106 1,312 1,391 1,391 1,391 1,391 1,391 1,391
Census Tract Total 10,128 11,409 11,921 12,034 12,207 12,378 12,521 12,624
406 406.01 2,479 2,655 2,658 2,690 2,730 2,761 2,787 2,808
Census Tract Total 2,479 2,655 2,658 2,690 2,730 2,761 2,787 2,808
407 407.01 2,210 2,377 2,380 2,384 2,392 2,399 2,405 2,409
407.02 1,830 1,789 1,789 1,789 1,789 1,789 1,789 1,789
407.03 1,025 1,048 1,048 1,052 1,058 1,064 1,069 1,073
407.04 2,929 2,816 2,816 2,820 2,827 2,835 2,841 2,845
Census Tract Total 7,994 8,030 8,033 8,046 8,066 8,087 8,104 8,116
408 408.01 2,412 2,533 2,538 2,567 2,613 2,657 2,695 2,722
408.02 1,322 1,239 1,239 1,244 1,252 1,261 1,268 1,273
408.03 1,800 1,976 1,983 2,034 2,113 2,191 2,258 2,305
Census Tract Total 5,534 5,747 5,760 5,845 5,978 6,110 6,220 6,299
501 501.01 513 787 787 876 1,014 1,143 1,257 1,338
501.02 2,345 2,450 2,449 2,478 2,516 2,551 2,587 2,612
501.03 799 881 884 884 885 886 887 887
501.04 1,363 1,158 1,158 1,159 1,160 1,161 1,163 1,163
Census Tract Total 5,020 5,276 5,278 5,397 5,575 5,742 5,893 6,000
502 502.01 2,938 2,049 2,052 2,232 2,522 2,804 3,040 3,210
502.02 1,658 1,646 1,649 1,663 1,686 1,708 1,727 1,740
Census Tract Total 4,596 3,695 3,701 3,896 4,208 4,512 4,767 4,951
(Continued)
IV-21
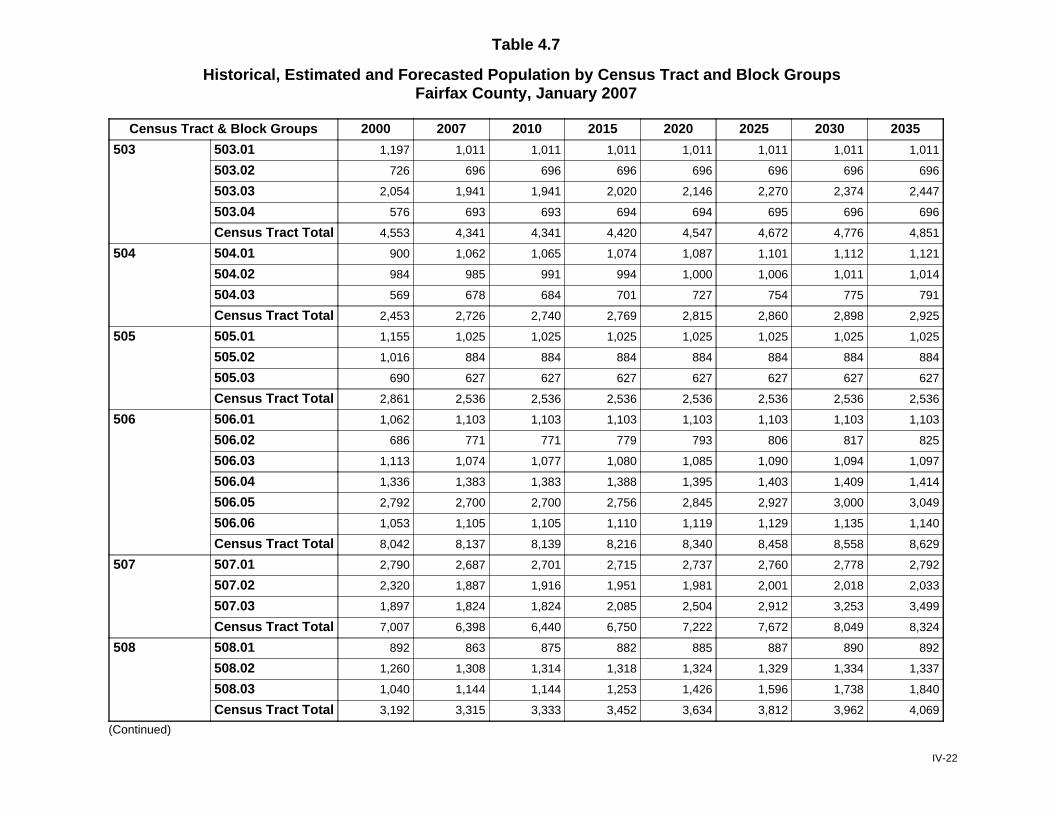
Table 4.7
Historical, Estimated and Forecasted Population by Census Tract and Block GroupsFairfax County, January 2007
Census Tract & Block Groups 2000 2007 2010 2015 2020 2025 2030 2035
503 503.01 1,197 1,011 1,011 1,011 1,011 1,011 1,011 1,011
503.02 726 696 696 696 696 696 696 696
503.03 2,054 1,941 1,941 2,020 2,146 2,270 2,374 2,447
503.04 576 693 693 694 694 695 696 696
Census Tract Total 4,553 4,341 4,341 4,420 4,547 4,672 4,776 4,851
504 504.01 900 1,062 1,065 1,074 1,087 1,101 1,112 1,121
504.02 984 985 991 994 1,000 1,006 1,011 1,014
504.03 569 678 684 701 727 754 775 791
Census Tract Total 2,453 2,726 2,740 2,769 2,815 2,860 2,898 2,925
505 505.01 1,155 1,025 1,025 1,025 1,025 1,025 1,025 1,025
505.02 1,016 884 884 884 884 884 884 884
505.03 690 627 627 627 627 627 627 627
Census Tract Total 2,861 2,536 2,536 2,536 2,536 2,536 2,536 2,536
506 506.01 1,062 1,103 1,103 1,103 1,103 1,103 1,103 1,103
506.02 686 771 771 779 793 806 817 825
506.03 1,113 1,074 1,077 1,080 1,085 1,090 1,094 1,097
506.04 1,336 1,383 1,383 1,388 1,395 1,403 1,409 1,414
506.05 2,792 2,700 2,700 2,756 2,845 2,927 3,000 3,049
506.06 1,053 1,105 1,105 1,110 1,119 1,129 1,135 1,140
Census Tract Total 8,042 8,137 8,139 8,216 8,340 8,458 8,558 8,629
507 507.01 2,790 2,687 2,701 2,715 2,737 2,760 2,778 2,792
507.02 2,320 1,887 1,916 1,951 1,981 2,001 2,018 2,033
507.03 1,897 1,824 1,824 2,085 2,504 2,912 3,253 3,499
Census Tract Total 7,007 6,398 6,440 6,750 7,222 7,672 8,049 8,324
508 508.01 892 863 875 882 885 887 890 892
508.02 1,260 1,308 1,314 1,318 1,324 1,329 1,334 1,337
508.03 1,040 1,144 1,144 1,253 1,426 1,596 1,738 1,840
Census Tract Total 3,192 3,315 3,333 3,452 3,634 3,812 3,962 4,069
(Continued)
IV-22

Table 4.7
Historical, Estimated and Forecasted Population by Census Tract and Block GroupsFairfax County, January 2007
Census Tract & Block Groups 2000 2007 2010 2015 2020 2025 2030 2035
509 509.01 868 875 881 882 883 885 886 887
509.02 694 861 877 892 895 898 901 903
Census Tract Total 1,562 1,736 1,758 1,773 1,778 1,783 1,787 1,790
510 510.01 1,214 1,136 1,136 1,137 1,138 1,138 1,139 1,139
510.02 1,534 1,614 1,614 1,617 1,622 1,627 1,631 1,634
Census Tract Total 2,748 2,750 2,751 2,754 2,760 2,765 2,770 2,773
511 511.01 938 1,030 1,036 1,039 1,043 1,048 1,052 1,055
511.02 1,281 1,334 1,354 1,355 1,357 1,358 1,360 1,361
Census Tract Total 2,219 2,364 2,390 2,394 2,400 2,407 2,412 2,416
512 512.01 796 981 982 991 1,006 1,020 1,032 1,041
512.02 757 834 836 841 850 858 866 871
Census Tract Total 1,553 1,815 1,817 1,832 1,855 1,878 1,898 1,912
513 513.01 1,010 1,210 1,216 1,235 1,264 1,294 1,319 1,337
513.02 1,044 1,336 1,348 1,357 1,362 1,367 1,372 1,375
Census Tract Total 2,054 2,546 2,564 2,591 2,626 2,661 2,691 2,712
514 514.01 2,515 2,282 2,282 2,282 2,282 2,282 2,282 2,282
514.02 676 643 643 643 643 645 645 646
Census Tract Total 3,191 2,926 2,926 2,926 2,926 2,927 2,928 2,928
515 515.01 2,715 2,164 2,164 2,191 2,230 2,259 2,292 2,320
515.02 2,966 3,186 3,186 3,214 3,258 3,303 3,340 3,367
515.03 2,207 2,171 2,171 2,181 2,196 2,211 2,224 2,233
515.04 2,254 2,201 3,010 3,176 3,297 3,416 3,515 3,586
Census Tract Total 10,142 9,722 10,532 10,762 10,981 11,189 11,371 11,507
516 516.01 1,727 1,846 1,846 1,847 1,849 1,851 1,852 1,853
516.02 3,638 1,894 1,894 1,923 1,970 2,016 2,055 2,083
516.03 2,761 1,590 1,590 1,605 1,630 1,654 1,674 1,688
516.04 991 963 963 976 998 1,019 1,036 1,049
Census Tract Total 9,117 6,292 6,292 6,352 6,447 6,539 6,618 6,674
(Continued)
IV-23
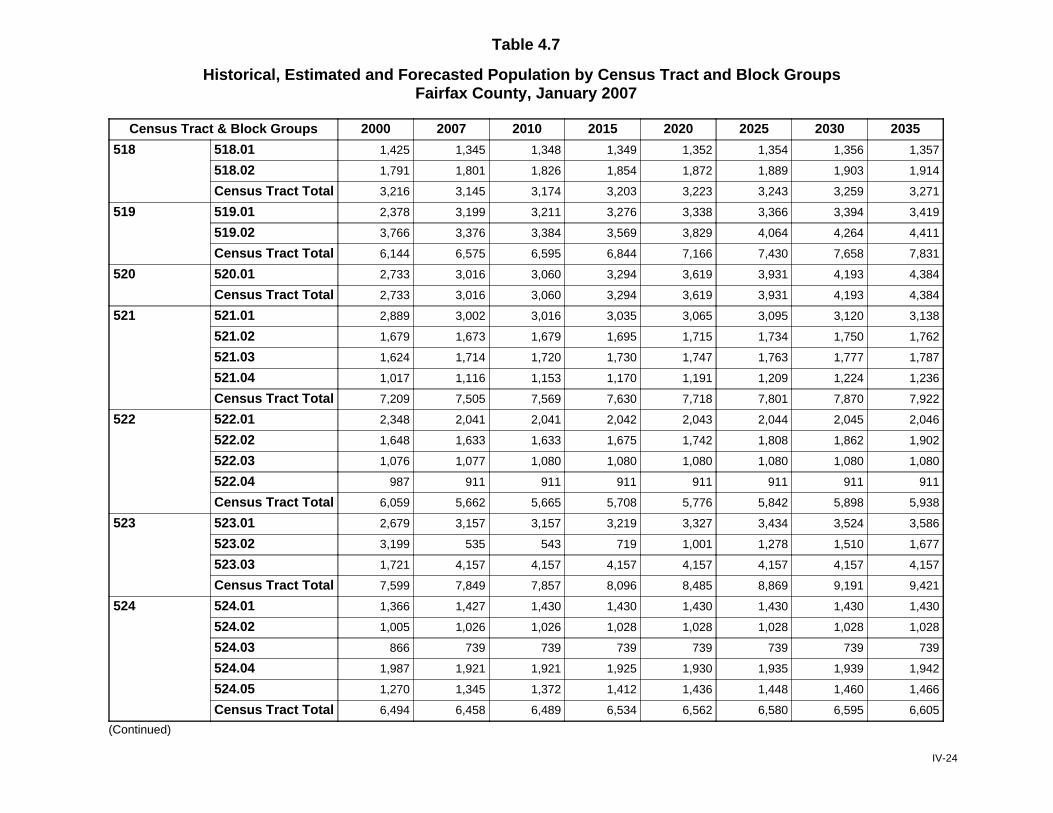
Table 4.7
Historical, Estimated and Forecasted Population by Census Tract and Block GroupsFairfax County, January 2007
Census Tract & Block Groups 2000 2007 2010 2015 2020 2025 2030 2035
518 518.01 1,425 1,345 1,348 1,349 1,352 1,354 1,356 1,357
518.02 1,791 1,801 1,826 1,854 1,872 1,889 1,903 1,914
Census Tract Total 3,216 3,145 3,174 3,203 3,223 3,243 3,259 3,271
519 519.01 2,378 3,199 3,211 3,276 3,338 3,366 3,394 3,419
519.02 3,766 3,376 3,384 3,569 3,829 4,064 4,264 4,411
Census Tract Total 6,144 6,575 6,595 6,844 7,166 7,430 7,658 7,831
520 520.01 2,733 3,016 3,060 3,294 3,619 3,931 4,193 4,384
Census Tract Total 2,733 3,016 3,060 3,294 3,619 3,931 4,193 4,384
521 521.01 2,889 3,002 3,016 3,035 3,065 3,095 3,120 3,138
521.02 1,679 1,673 1,679 1,695 1,715 1,734 1,750 1,762
521.03 1,624 1,714 1,720 1,730 1,747 1,763 1,777 1,787
521.04 1,017 1,116 1,153 1,170 1,191 1,209 1,224 1,236
Census Tract Total 7,209 7,505 7,569 7,630 7,718 7,801 7,870 7,922
522 522.01 2,348 2,041 2,041 2,042 2,043 2,044 2,045 2,046
522.02 1,648 1,633 1,633 1,675 1,742 1,808 1,862 1,902
522.03 1,076 1,077 1,080 1,080 1,080 1,080 1,080 1,080
522.04 987 911 911 911 911 911 911 911
Census Tract Total 6,059 5,662 5,665 5,708 5,776 5,842 5,898 5,938
523 523.01 2,679 3,157 3,157 3,219 3,327 3,434 3,524 3,586
523.02 3,199 535 543 719 1,001 1,278 1,510 1,677
523.03 1,721 4,157 4,157 4,157 4,157 4,157 4,157 4,157
Census Tract Total 7,599 7,849 7,857 8,096 8,485 8,869 9,191 9,421
524 524.01 1,366 1,427 1,430 1,430 1,430 1,430 1,430 1,430
524.02 1,005 1,026 1,026 1,028 1,028 1,028 1,028 1,028
524.03 866 739 739 739 739 739 739 739
524.04 1,987 1,921 1,921 1,925 1,930 1,935 1,939 1,942
524.05 1,270 1,345 1,372 1,412 1,436 1,448 1,460 1,466
Census Tract Total 6,494 6,458 6,489 6,534 6,562 6,580 6,595 6,605
(Continued)
IV-24
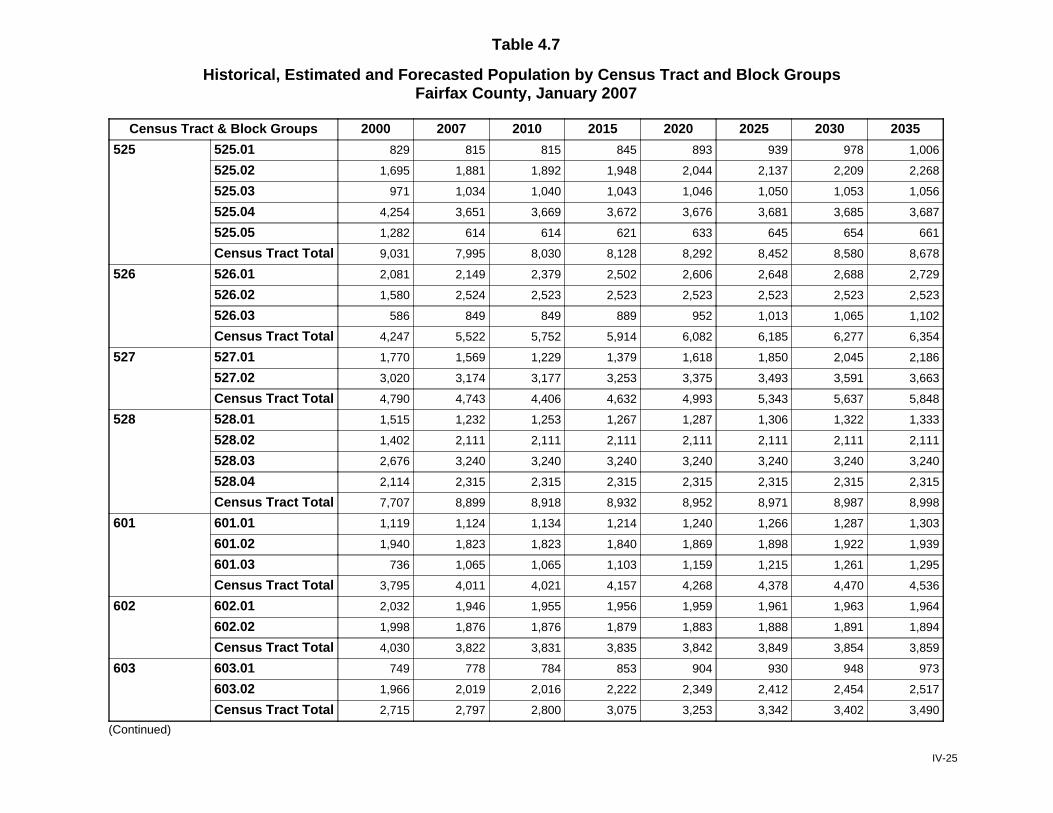
Table 4.7
Historical, Estimated and Forecasted Population by Census Tract and Block GroupsFairfax County, January 2007
Census Tract & Block Groups 2000 2007 2010 2015 2020 2025 2030 2035
525 525.01 829 815 815 845 893 939 978 1,006
525.02 1,695 1,881 1,892 1,948 2,044 2,137 2,209 2,268
525.03 971 1,034 1,040 1,043 1,046 1,050 1,053 1,056
525.04 4,254 3,651 3,669 3,672 3,676 3,681 3,685 3,687
525.05 1,282 614 614 621 633 645 654 661
Census Tract Total 9,031 7,995 8,030 8,128 8,292 8,452 8,580 8,678
526 526.01 2,081 2,149 2,379 2,502 2,606 2,648 2,688 2,729
526.02 1,580 2,524 2,523 2,523 2,523 2,523 2,523 2,523
526.03 586 849 849 889 952 1,013 1,065 1,102
Census Tract Total 4,247 5,522 5,752 5,914 6,082 6,185 6,277 6,354
527 527.01 1,770 1,569 1,229 1,379 1,618 1,850 2,045 2,186
527.02 3,020 3,174 3,177 3,253 3,375 3,493 3,591 3,663
Census Tract Total 4,790 4,743 4,406 4,632 4,993 5,343 5,637 5,848
528 528.01 1,515 1,232 1,253 1,267 1,287 1,306 1,322 1,333
528.02 1,402 2,111 2,111 2,111 2,111 2,111 2,111 2,111
528.03 2,676 3,240 3,240 3,240 3,240 3,240 3,240 3,240
528.04 2,114 2,315 2,315 2,315 2,315 2,315 2,315 2,315
Census Tract Total 7,707 8,899 8,918 8,932 8,952 8,971 8,987 8,998
601 601.01 1,119 1,124 1,134 1,214 1,240 1,266 1,287 1,303
601.02 1,940 1,823 1,823 1,840 1,869 1,898 1,922 1,939
601.03 736 1,065 1,065 1,103 1,159 1,215 1,261 1,295
Census Tract Total 3,795 4,011 4,021 4,157 4,268 4,378 4,470 4,536
602 602.01 2,032 1,946 1,955 1,956 1,959 1,961 1,963 1,964
602.02 1,998 1,876 1,876 1,879 1,883 1,888 1,891 1,894
Census Tract Total 4,030 3,822 3,831 3,835 3,842 3,849 3,854 3,859
603 603.01 749 778 784 853 904 930 948 973
603.02 1,966 2,019 2,016 2,222 2,349 2,412 2,454 2,517
Census Tract Total 2,715 2,797 2,800 3,075 3,253 3,342 3,402 3,490
(Continued)
IV-25
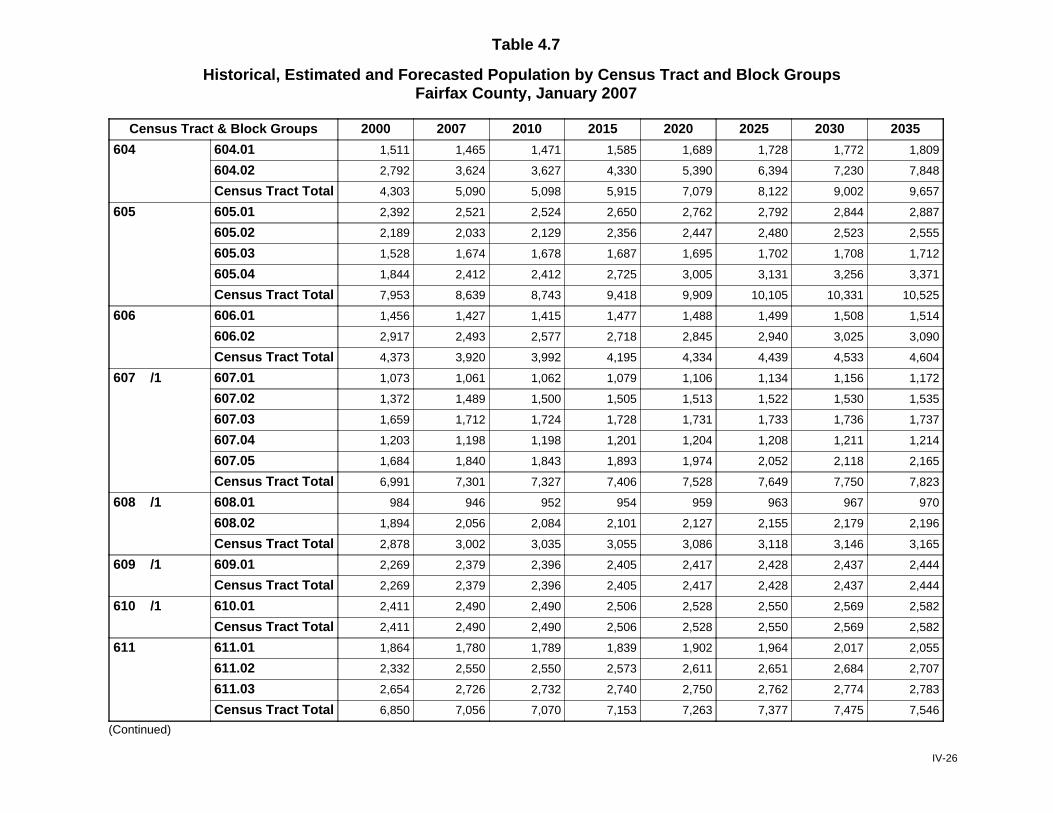
Table 4.7
Historical, Estimated and Forecasted Population by Census Tract and Block GroupsFairfax County, January 2007
Census Tract & Block Groups 2000 2007 2010 2015 2020 2025 2030 2035
604 604.01 1,511 1,465 1,471 1,585 1,689 1,728 1,772 1,809
604.02 2,792 3,624 3,627 4,330 5,390 6,394 7,230 7,848
Census Tract Total 4,303 5,090 5,098 5,915 7,079 8,122 9,002 9,657
605 605.01 2,392 2,521 2,524 2,650 2,762 2,792 2,844 2,887
605.02 2,189 2,033 2,129 2,356 2,447 2,480 2,523 2,555
605.03 1,528 1,674 1,678 1,687 1,695 1,702 1,708 1,712
605.04 1,844 2,412 2,412 2,725 3,005 3,131 3,256 3,371
Census Tract Total 7,953 8,639 8,743 9,418 9,909 10,105 10,331 10,525
606 606.01 1,456 1,427 1,415 1,477 1,488 1,499 1,508 1,514
606.02 2,917 2,493 2,577 2,718 2,845 2,940 3,025 3,090
Census Tract Total 4,373 3,920 3,992 4,195 4,334 4,439 4,533 4,604
607 /1 607.01 1,073 1,061 1,062 1,079 1,106 1,134 1,156 1,172
607.02 1,372 1,489 1,500 1,505 1,513 1,522 1,530 1,535
607.03 1,659 1,712 1,724 1,728 1,731 1,733 1,736 1,737
607.04 1,203 1,198 1,198 1,201 1,204 1,208 1,211 1,214
607.05 1,684 1,840 1,843 1,893 1,974 2,052 2,118 2,165
Census Tract Total 6,991 7,301 7,327 7,406 7,528 7,649 7,750 7,823
608 /1 608.01 984 946 952 954 959 963 967 970
608.02 1,894 2,056 2,084 2,101 2,127 2,155 2,179 2,196
Census Tract Total 2,878 3,002 3,035 3,055 3,086 3,118 3,146 3,165
609 /1 609.01 2,269 2,379 2,396 2,405 2,417 2,428 2,437 2,444
Census Tract Total 2,269 2,379 2,396 2,405 2,417 2,428 2,437 2,444
610 /1 610.01 2,411 2,490 2,490 2,506 2,528 2,550 2,569 2,582
Census Tract Total 2,411 2,490 2,490 2,506 2,528 2,550 2,569 2,582
611 611.01 1,864 1,780 1,789 1,839 1,902 1,964 2,017 2,055
611.02 2,332 2,550 2,550 2,573 2,611 2,651 2,684 2,707
611.03 2,654 2,726 2,732 2,740 2,750 2,762 2,774 2,783
Census Tract Total 6,850 7,056 7,070 7,153 7,263 7,377 7,475 7,546
(Continued)
IV-26
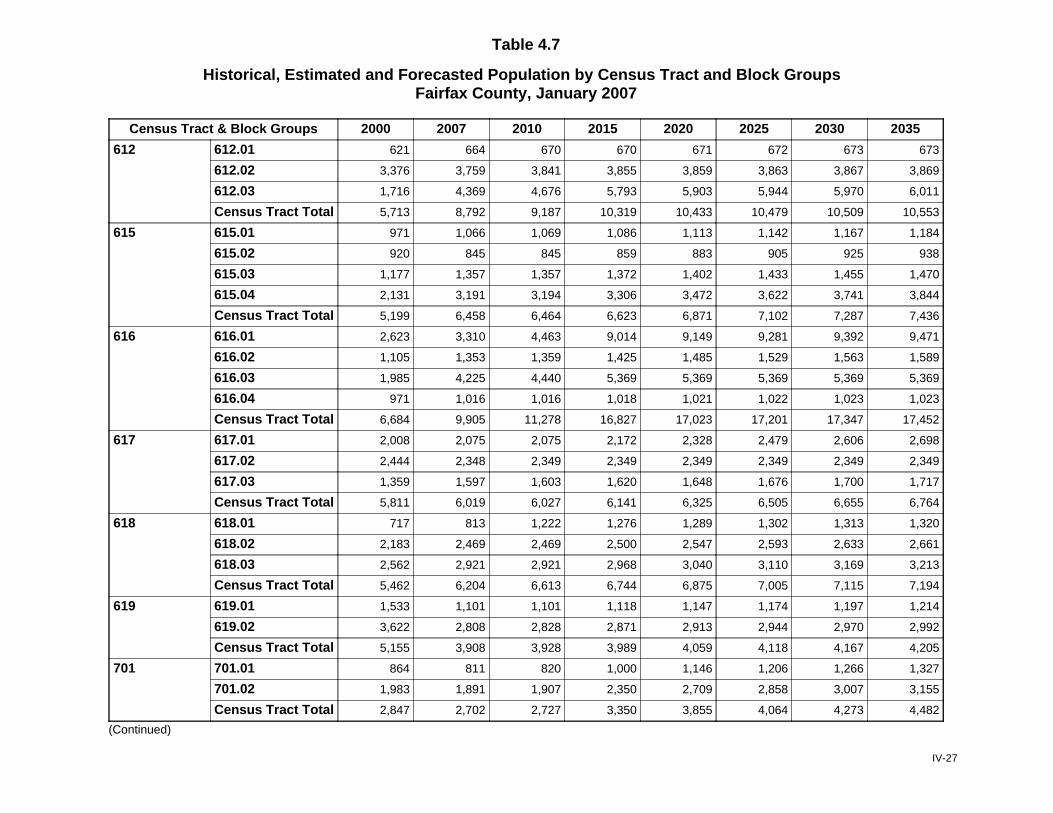
Table 4.7
Historical, Estimated and Forecasted Population by Census Tract and Block GroupsFairfax County, January 2007
Census Tract & Block Groups 2000 2007 2010 2015 2020 2025 2030 2035
612 612.01 621 664 670 670 671 672 673 673
612.02 3,376 3,759 3,841 3,855 3,859 3,863 3,867 3,869
612.03 1,716 4,369 4,676 5,793 5,903 5,944 5,970 6,011
Census Tract Total 5,713 8,792 9,187 10,319 10,433 10,479 10,509 10,553
615 615.01 971 1,066 1,069 1,086 1,113 1,142 1,167 1,184
615.02 920 845 845 859 883 905 925 938
615.03 1,177 1,357 1,357 1,372 1,402 1,433 1,455 1,470
615.04 2,131 3,191 3,194 3,306 3,472 3,622 3,741 3,844
Census Tract Total 5,199 6,458 6,464 6,623 6,871 7,102 7,287 7,436
616 616.01 2,623 3,310 4,463 9,014 9,149 9,281 9,392 9,471
616.02 1,105 1,353 1,359 1,425 1,485 1,529 1,563 1,589
616.03 1,985 4,225 4,440 5,369 5,369 5,369 5,369 5,369
616.04 971 1,016 1,016 1,018 1,021 1,022 1,023 1,023
Census Tract Total 6,684 9,905 11,278 16,827 17,023 17,201 17,347 17,452
617 617.01 2,008 2,075 2,075 2,172 2,328 2,479 2,606 2,698
617.02 2,444 2,348 2,349 2,349 2,349 2,349 2,349 2,349
617.03 1,359 1,597 1,603 1,620 1,648 1,676 1,700 1,717
Census Tract Total 5,811 6,019 6,027 6,141 6,325 6,505 6,655 6,764
618 618.01 717 813 1,222 1,276 1,289 1,302 1,313 1,320
618.02 2,183 2,469 2,469 2,500 2,547 2,593 2,633 2,661
618.03 2,562 2,921 2,921 2,968 3,040 3,110 3,169 3,213
Census Tract Total 5,462 6,204 6,613 6,744 6,875 7,005 7,115 7,194
619 619.01 1,533 1,101 1,101 1,118 1,147 1,174 1,197 1,214
619.02 3,622 2,808 2,828 2,871 2,913 2,944 2,970 2,992
Census Tract Total 5,155 3,908 3,928 3,989 4,059 4,118 4,167 4,205
701 701.01 864 811 820 1,000 1,146 1,206 1,266 1,327
701.02 1,983 1,891 1,907 2,350 2,709 2,858 3,007 3,155
Census Tract Total 2,847 2,702 2,727 3,350 3,855 4,064 4,273 4,482
(Continued)
IV-27
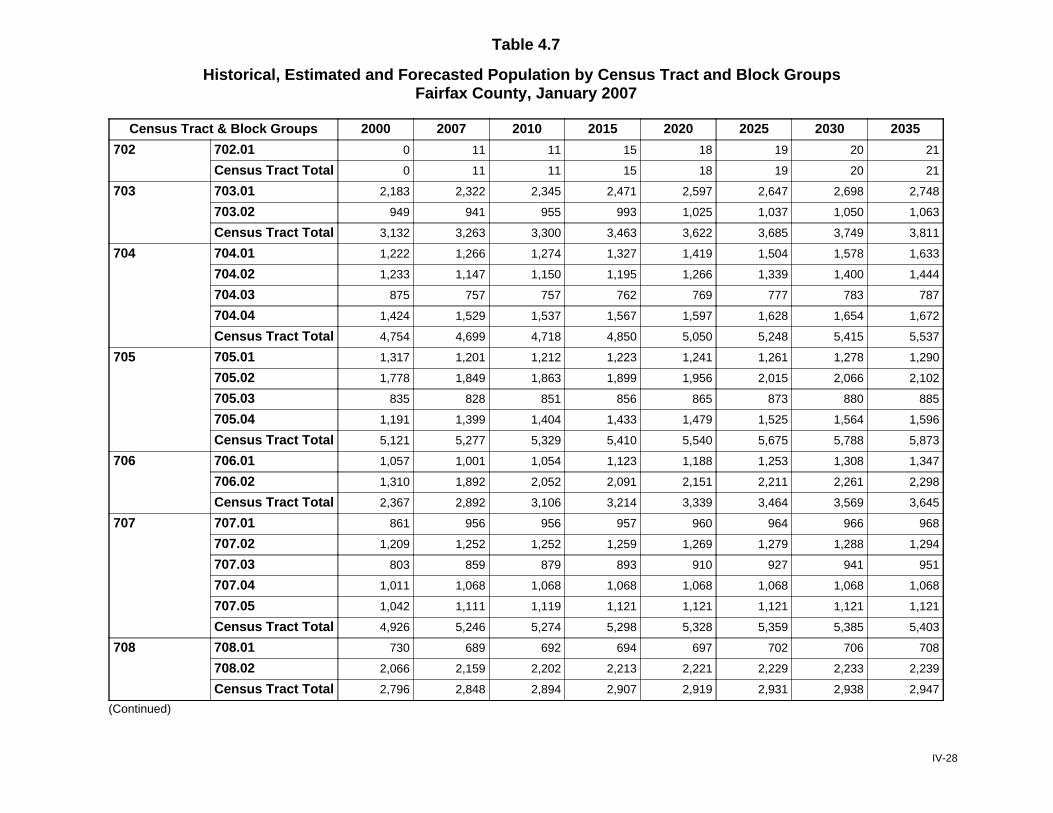
Table 4.7
Historical, Estimated and Forecasted Population by Census Tract and Block GroupsFairfax County, January 2007
Census Tract & Block Groups 2000 2007 2010 2015 2020 2025 2030 2035
702 702.01 0 11 11 15 18 19 20 21
Census Tract Total 0 11 11 15 18 19 20 21
703 703.01 2,183 2,322 2,345 2,471 2,597 2,647 2,698 2,748
703.02 949 941 955 993 1,025 1,037 1,050 1,063
Census Tract Total 3,132 3,263 3,300 3,463 3,622 3,685 3,749 3,811
704 704.01 1,222 1,266 1,274 1,327 1,419 1,504 1,578 1,633
704.02 1,233 1,147 1,150 1,195 1,266 1,339 1,400 1,444
704.03 875 757 757 762 769 777 783 787
704.04 1,424 1,529 1,537 1,567 1,597 1,628 1,654 1,672
Census Tract Total 4,754 4,699 4,718 4,850 5,050 5,248 5,415 5,537
705 705.01 1,317 1,201 1,212 1,223 1,241 1,261 1,278 1,290
705.02 1,778 1,849 1,863 1,899 1,956 2,015 2,066 2,102
705.03 835 828 851 856 865 873 880 885
705.04 1,191 1,399 1,404 1,433 1,479 1,525 1,564 1,596
Census Tract Total 5,121 5,277 5,329 5,410 5,540 5,675 5,788 5,873
706 706.01 1,057 1,001 1,054 1,123 1,188 1,253 1,308 1,347
706.02 1,310 1,892 2,052 2,091 2,151 2,211 2,261 2,298
Census Tract Total 2,367 2,892 3,106 3,214 3,339 3,464 3,569 3,645
707 707.01 861 956 956 957 960 964 966 968
707.02 1,209 1,252 1,252 1,259 1,269 1,279 1,288 1,294
707.03 803 859 879 893 910 927 941 951
707.04 1,011 1,068 1,068 1,068 1,068 1,068 1,068 1,068
707.05 1,042 1,111 1,119 1,121 1,121 1,121 1,121 1,121
Census Tract Total 4,926 5,246 5,274 5,298 5,328 5,359 5,385 5,403
708 708.01 730 689 692 694 697 702 706 708
708.02 2,066 2,159 2,202 2,213 2,221 2,229 2,233 2,239
Census Tract Total 2,796 2,848 2,894 2,907 2,919 2,931 2,938 2,947
(Continued)
IV-28

Table 4.7
Historical, Estimated and Forecasted Population by Census Tract and Block GroupsFairfax County, January 2007
Census Tract & Block Groups 2000 2007 2010 2015 2020 2025 2030 2035
709 709.01 1,659 2,133 2,169 2,170 2,172 2,174 2,175 2,176
709.02 2,023 2,030 2,046 2,058 2,077 2,096 2,111 2,122
709.03 650 656 664 665 667 669 670 671
709.04 932 852 1,167 1,229 1,253 1,265 1,274 1,283
709.05 1,095 1,211 1,235 1,259 1,289 1,319 1,344 1,362
Census Tract Total 6,359 6,881 7,281 7,381 7,458 7,522 7,574 7,614
710 710.01 1,758 2,015 2,029 2,392 2,927 3,425 3,844 4,150
Census Tract Total 1,758 2,015 2,029 2,392 2,927 3,425 3,844 4,150
711 711.01 1,114 1,015 1,026 1,026 1,026 1,026 1,026 1,026
711.02 1,446 1,619 1,633 1,636 1,641 1,646 1,650 1,653
711.03 679 755 755 755 755 755 755 755
711.04 1,699 1,437 1,439 1,462 1,498 1,534 1,563 1,585
711.05 1,541 1,659 1,663 1,680 1,700 1,720 1,737 1,749
Census Tract Total 6,479 6,484 6,516 6,559 6,620 6,680 6,731 6,767
712 712.01 609 508 516 517 518 518 519 519
712.02 650 956 956 956 956 956 956 956
712.03 2,454 2,330 2,330 2,590 3,006 3,411 3,750 3,995
712.04 2,527 2,511 2,511 2,598 2,735 2,869 2,983 3,063
Census Tract Total 6,240 6,305 6,312 6,661 7,214 7,754 8,208 8,533
713 713.01 3,400 3,495 3,499 3,527 3,529 3,530 3,531 3,532
713.02 1,235 1,456 1,456 1,542 1,680 1,815 1,927 2,009
713.03 2,296 2,378 2,379 2,398 2,419 2,441 2,460 2,473
713.04 1,735 1,841 1,890 1,963 2,047 2,127 2,196 2,244
Census Tract Total 8,666 9,170 9,224 9,429 9,676 9,913 10,114 10,257
714 714.01 1,347 1,415 1,421 1,431 1,446 1,462 1,476 1,486
714.02 3,526 3,007 3,017 3,072 3,154 3,234 3,302 3,350
714.03 2,094 1,992 1,995 1,995 1,995 1,995 1,995 1,995
Census Tract Total 6,967 6,414 6,433 6,498 6,595 6,692 6,773 6,831
(Continued)
IV-29
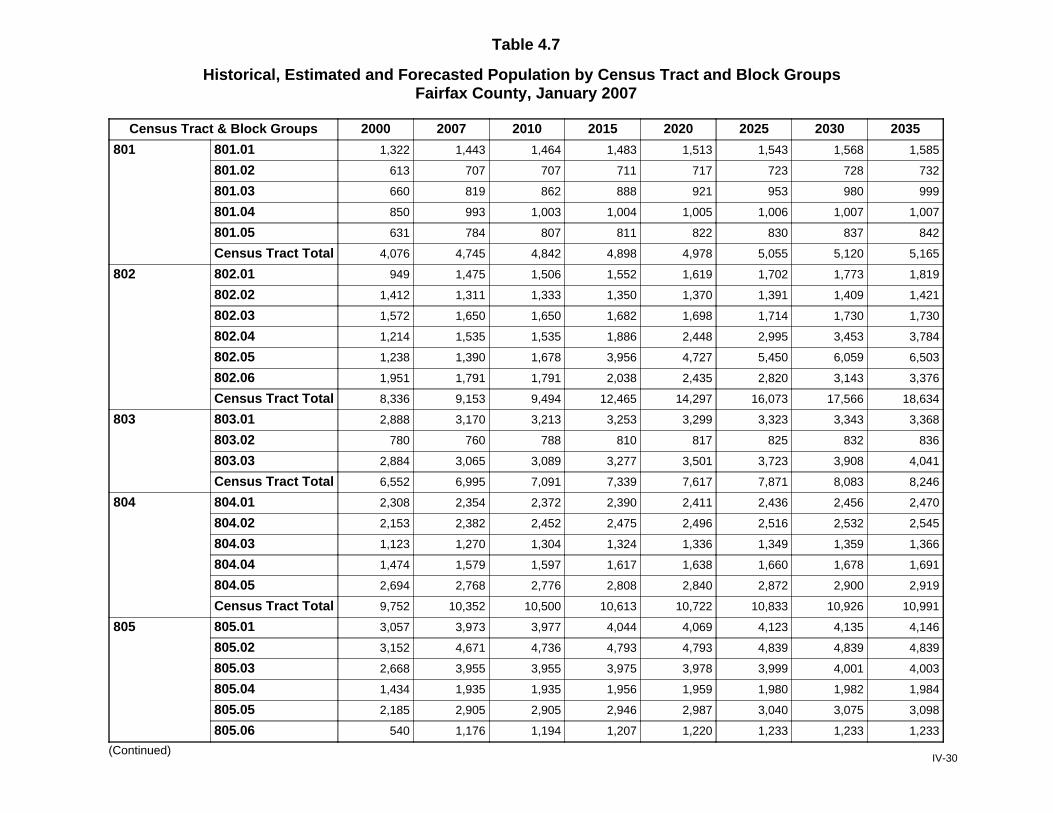
Table 4.7
Historical, Estimated and Forecasted Population by Census Tract and Block GroupsFairfax County, January 2007
Census Tract & Block Groups 2000 2007 2010 2015 2020 2025 2030 2035
801 801.01 1,322 1,443 1,464 1,483 1,513 1,543 1,568 1,585
801.02 613 707 707 711 717 723 728 732
801.03 660 819 862 888 921 953 980 999
801.04 850 993 1,003 1,004 1,005 1,006 1,007 1,007
801.05 631 784 807 811 822 830 837 842
Census Tract Total 4,076 4,745 4,842 4,898 4,978 5,055 5,120 5,165
802 802.01 949 1,475 1,506 1,552 1,619 1,702 1,773 1,819
802.02 1,412 1,311 1,333 1,350 1,370 1,391 1,409 1,421
802.03 1,572 1,650 1,650 1,682 1,698 1,714 1,730 1,730
802.04 1,214 1,535 1,535 1,886 2,448 2,995 3,453 3,784
802.05 1,238 1,390 1,678 3,956 4,727 5,450 6,059 6,503
802.06 1,951 1,791 1,791 2,038 2,435 2,820 3,143 3,376
Census Tract Total 8,336 9,153 9,494 12,465 14,297 16,073 17,566 18,634
803 803.01 2,888 3,170 3,213 3,253 3,299 3,323 3,343 3,368
803.02 780 760 788 810 817 825 832 836
803.03 2,884 3,065 3,089 3,277 3,501 3,723 3,908 4,041
Census Tract Total 6,552 6,995 7,091 7,339 7,617 7,871 8,083 8,246
804 804.01 2,308 2,354 2,372 2,390 2,411 2,436 2,456 2,470
804.02 2,153 2,382 2,452 2,475 2,496 2,516 2,532 2,545
804.03 1,123 1,270 1,304 1,324 1,336 1,349 1,359 1,366
804.04 1,474 1,579 1,597 1,617 1,638 1,660 1,678 1,691
804.05 2,694 2,768 2,776 2,808 2,840 2,872 2,900 2,919
Census Tract Total 9,752 10,352 10,500 10,613 10,722 10,833 10,926 10,991
805 805.01 3,057 3,973 3,977 4,044 4,069 4,123 4,135 4,146
805.02 3,152 4,671 4,736 4,793 4,793 4,839 4,839 4,839
805.03 2,668 3,955 3,955 3,975 3,978 3,999 4,001 4,003
805.04 1,434 1,935 1,935 1,956 1,959 1,980 1,982 1,984
805.05 2,185 2,905 2,905 2,946 2,987 3,040 3,075 3,098
805.06 540 1,176 1,194 1,207 1,220 1,233 1,233 1,233
(Continued)IV-30
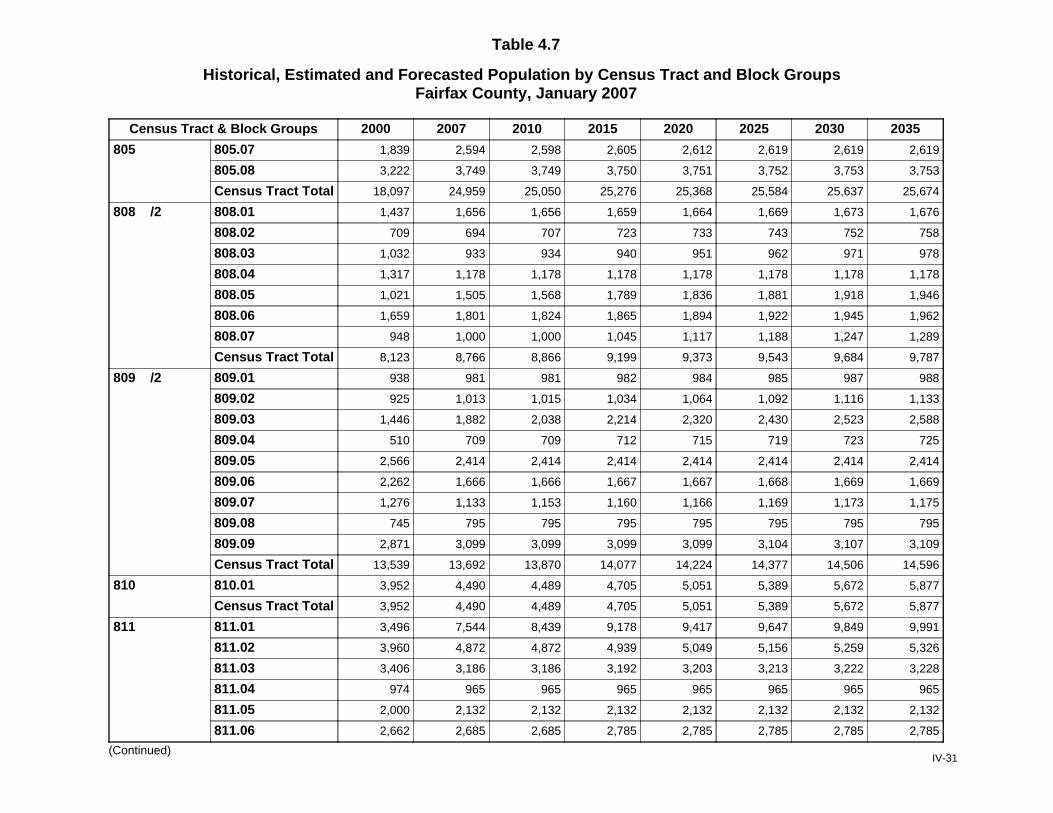
Table 4.7
Historical, Estimated and Forecasted Population by Census Tract and Block GroupsFairfax County, January 2007
Census Tract & Block Groups 2000 2007 2010 2015 2020 2025 2030 2035
805.07 1,839 2,594 2,598 2,605 2,612 2,619 2,619 2,619805
805.08 3,222 3,749 3,749 3,750 3,751 3,752 3,753 3,753
Census Tract Total 18,097 24,959 25,050 25,276 25,368 25,584 25,637 25,674
808 /2 808.01 1,437 1,656 1,656 1,659 1,664 1,669 1,673 1,676
808.02 709 694 707 723 733 743 752 758
808.03 1,032 933 934 940 951 962 971 978
808.04 1,317 1,178 1,178 1,178 1,178 1,178 1,178 1,178
808.05 1,021 1,505 1,568 1,789 1,836 1,881 1,918 1,946
808.06 1,659 1,801 1,824 1,865 1,894 1,922 1,945 1,962
808.07 948 1,000 1,000 1,045 1,117 1,188 1,247 1,289
Census Tract Total 8,123 8,766 8,866 9,199 9,373 9,543 9,684 9,787
809 /2 809.01 938 981 981 982 984 985 987 988
809.02 925 1,013 1,015 1,034 1,064 1,092 1,116 1,133
809.03 1,446 1,882 2,038 2,214 2,320 2,430 2,523 2,588
809.04 510 709 709 712 715 719 723 725
809.05 2,566 2,414 2,414 2,414 2,414 2,414 2,414 2,414
809.06 2,262 1,666 1,666 1,667 1,667 1,668 1,669 1,669
809.07 1,276 1,133 1,153 1,160 1,166 1,169 1,173 1,175
809.08 745 795 795 795 795 795 795 795
809.09 2,871 3,099 3,099 3,099 3,099 3,104 3,107 3,109
Census Tract Total 13,539 13,692 13,870 14,077 14,224 14,377 14,506 14,596
810 810.01 3,952 4,490 4,489 4,705 5,051 5,389 5,672 5,877
Census Tract Total 3,952 4,490 4,489 4,705 5,051 5,389 5,672 5,877
811 811.01 3,496 7,544 8,439 9,178 9,417 9,647 9,849 9,991
811.02 3,960 4,872 4,872 4,939 5,049 5,156 5,259 5,326
811.03 3,406 3,186 3,186 3,192 3,203 3,213 3,222 3,228
811.04 974 965 965 965 965 965 965 965
811.05 2,000 2,132 2,132 2,132 2,132 2,132 2,132 2,132
811.06 2,662 2,685 2,685 2,785 2,785 2,785 2,785 2,785
(Continued)IV-31

Table 4.7
Historical, Estimated and Forecasted Population by Census Tract and Block GroupsFairfax County, January 2007
Census Tract & Block Groups 2000 2007 2010 2015 2020 2025 2030 2035
Census Tract Total 16,498 21,384 22,279 23,191 23,550 23,899 24,212 24,427811
812 812.01 1,413 1,145 1,145 1,313 1,584 1,847 2,067 2,226
812.02 3,564 2,549 2,549 2,919 3,513 4,091 4,574 4,924
812.03 2,739 2,817 2,817 2,927 3,095 3,260 3,399 3,497
Census Tract Total 7,716 6,511 6,511 7,160 8,192 9,198 10,040 10,646
814 814.01 2,882 3,401 3,400 3,457 3,548 3,636 3,710 3,764
814.02 1,577 1,882 1,882 1,883 1,885 1,888 1,889 1,891
814.03 1,835 2,156 2,156 2,157 2,160 2,163 2,165 2,167
Census Tract Total 6,294 7,438 7,438 7,497 7,594 7,687 7,765 7,822
815 815.01 2,112 2,660 2,660 2,660 2,660 2,660 2,660 2,660
Census Tract Total 2,112 2,660 2,660 2,660 2,660 2,660 2,660 2,660
816 816.01 1,377 1,807 1,807 1,809 1,811 1,813 1,815 1,816
816.02 1,706 1,709 1,717 1,721 1,722 1,723 1,723 1,724
Census Tract Total 3,083 3,516 3,524 3,530 3,533 3,536 3,538 3,540
817 817.01 1,687 2,071 2,071 2,091 2,122 2,154 2,182 2,201
817.02 2,219 2,379 2,395 2,405 2,405 2,405 2,405 2,405
817.03 1,840 1,905 1,908 1,911 1,911 1,911 1,911 1,911
817.04 3,289 3,411 3,417 3,553 3,766 3,948 4,099 4,222
817.05 687 917 917 907 897 885 874 873
Census Tract Total 9,722 10,683 10,708 10,866 11,101 11,303 11,470 11,610
819 819.01 2,723 2,302 2,302 2,302 2,302 2,302 2,302 2,302
819.02 1,061 1,525 1,530 1,818 2,240 2,624 2,943 3,179
819.03 1,734 2,867 2,886 2,898 2,902 2,907 2,910 2,913
Census Tract Total 5,518 6,695 6,718 7,018 7,444 7,832 8,155 8,394
820 820.01 1,062 1,333 1,333 1,334 1,335 1,336 1,336 1,336
820.02 1,454 1,403 1,403 1,403 1,403 1,403 1,403 1,403
820.03 1,971 3,668 3,668 3,668 3,668 3,668 3,668 3,668
820.04 2,592 3,654 3,653 3,716 3,824 3,925 4,008 4,072
820.05 1,185 1,416 1,415 1,415 1,415 1,415 1,415 1,415
(Continued)IV-32
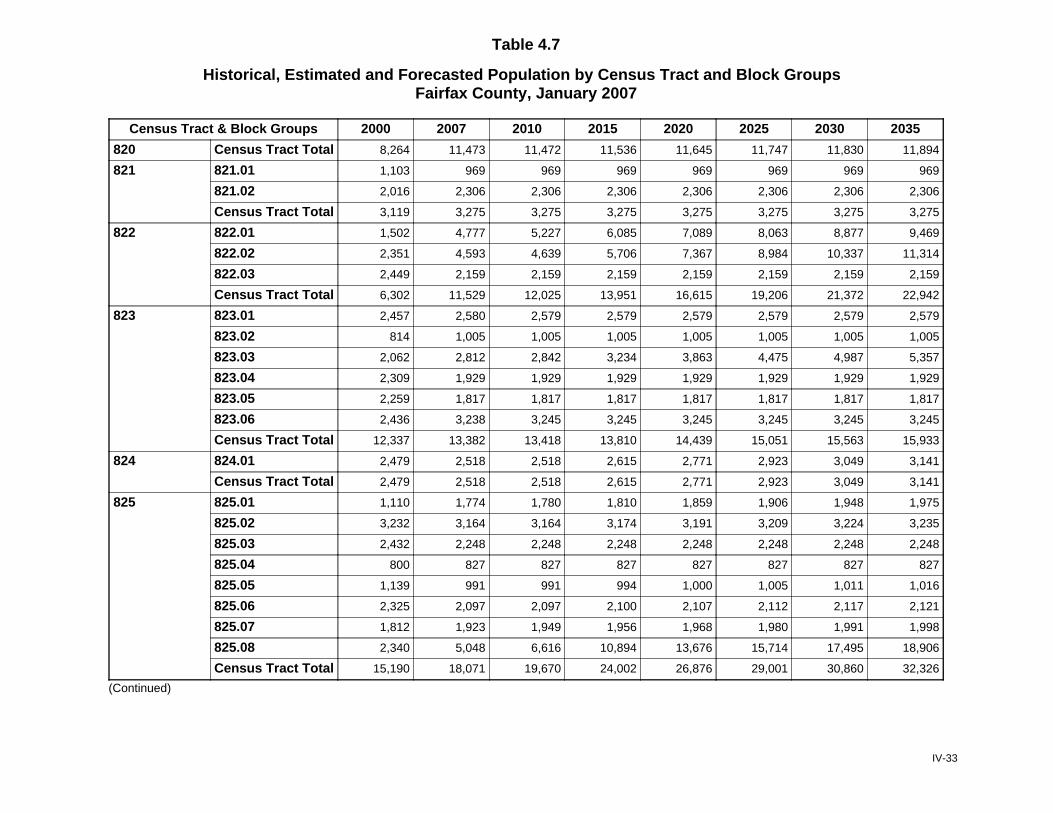
Table 4.7
Historical, Estimated and Forecasted Population by Census Tract and Block GroupsFairfax County, January 2007
Census Tract & Block Groups 2000 2007 2010 2015 2020 2025 2030 2035
Census Tract Total 8,264 11,473 11,472 11,536 11,645 11,747 11,830 11,894820
821 821.01 1,103 969 969 969 969 969 969 969
821.02 2,016 2,306 2,306 2,306 2,306 2,306 2,306 2,306
Census Tract Total 3,119 3,275 3,275 3,275 3,275 3,275 3,275 3,275
822 822.01 1,502 4,777 5,227 6,085 7,089 8,063 8,877 9,469
822.02 2,351 4,593 4,639 5,706 7,367 8,984 10,337 11,314
822.03 2,449 2,159 2,159 2,159 2,159 2,159 2,159 2,159
Census Tract Total 6,302 11,529 12,025 13,951 16,615 19,206 21,372 22,942
823 823.01 2,457 2,580 2,579 2,579 2,579 2,579 2,579 2,579
823.02 814 1,005 1,005 1,005 1,005 1,005 1,005 1,005
823.03 2,062 2,812 2,842 3,234 3,863 4,475 4,987 5,357
823.04 2,309 1,929 1,929 1,929 1,929 1,929 1,929 1,929
823.05 2,259 1,817 1,817 1,817 1,817 1,817 1,817 1,817
823.06 2,436 3,238 3,245 3,245 3,245 3,245 3,245 3,245
Census Tract Total 12,337 13,382 13,418 13,810 14,439 15,051 15,563 15,933
824 824.01 2,479 2,518 2,518 2,615 2,771 2,923 3,049 3,141
Census Tract Total 2,479 2,518 2,518 2,615 2,771 2,923 3,049 3,141
825 825.01 1,110 1,774 1,780 1,810 1,859 1,906 1,948 1,975
825.02 3,232 3,164 3,164 3,174 3,191 3,209 3,224 3,235
825.03 2,432 2,248 2,248 2,248 2,248 2,248 2,248 2,248
825.04 800 827 827 827 827 827 827 827
825.05 1,139 991 991 994 1,000 1,005 1,011 1,016
825.06 2,325 2,097 2,097 2,100 2,107 2,112 2,117 2,121
825.07 1,812 1,923 1,949 1,956 1,968 1,980 1,991 1,998
825.08 2,340 5,048 6,616 10,894 13,676 15,714 17,495 18,906
Census Tract Total 15,190 18,071 19,670 24,002 26,876 29,001 30,860 32,326
(Continued)
IV-33
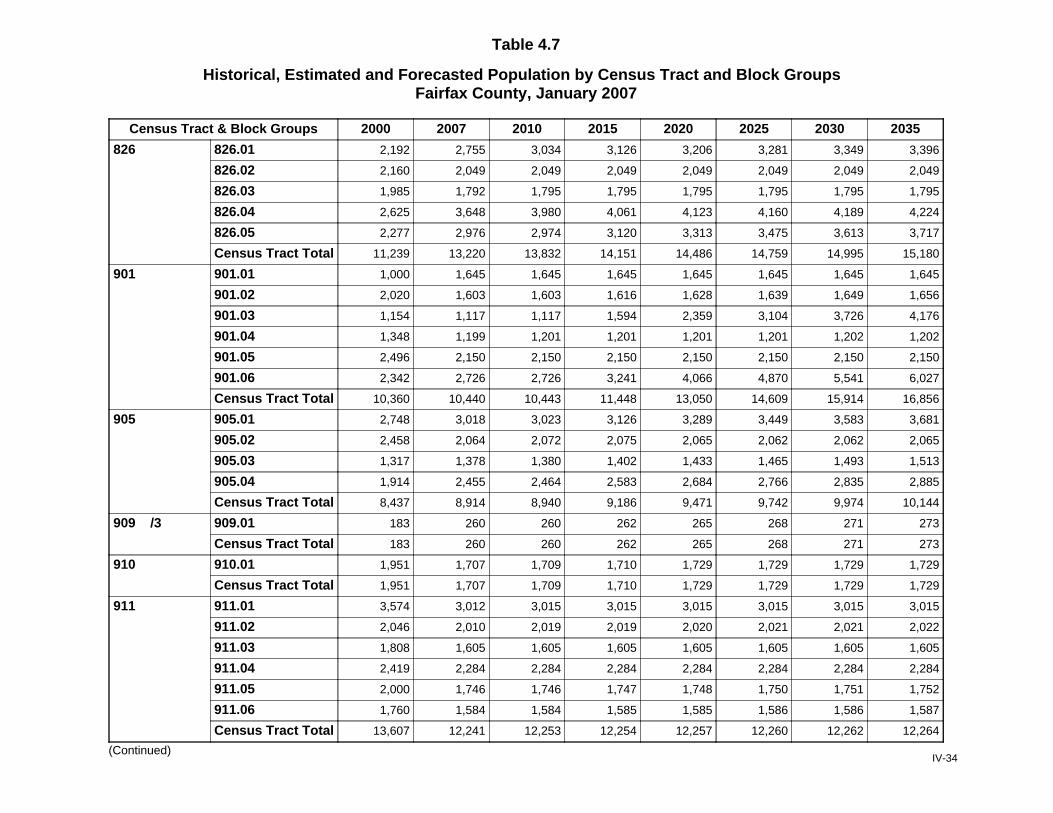
Table 4.7
Historical, Estimated and Forecasted Population by Census Tract and Block GroupsFairfax County, January 2007
Census Tract & Block Groups 2000 2007 2010 2015 2020 2025 2030 2035
826 826.01 2,192 2,755 3,034 3,126 3,206 3,281 3,349 3,396
826.02 2,160 2,049 2,049 2,049 2,049 2,049 2,049 2,049
826.03 1,985 1,792 1,795 1,795 1,795 1,795 1,795 1,795
826.04 2,625 3,648 3,980 4,061 4,123 4,160 4,189 4,224
826.05 2,277 2,976 2,974 3,120 3,313 3,475 3,613 3,717
Census Tract Total 11,239 13,220 13,832 14,151 14,486 14,759 14,995 15,180
901 901.01 1,000 1,645 1,645 1,645 1,645 1,645 1,645 1,645
901.02 2,020 1,603 1,603 1,616 1,628 1,639 1,649 1,656
901.03 1,154 1,117 1,117 1,594 2,359 3,104 3,726 4,176
901.04 1,348 1,199 1,201 1,201 1,201 1,201 1,202 1,202
901.05 2,496 2,150 2,150 2,150 2,150 2,150 2,150 2,150
901.06 2,342 2,726 2,726 3,241 4,066 4,870 5,541 6,027
Census Tract Total 10,360 10,440 10,443 11,448 13,050 14,609 15,914 16,856
905 905.01 2,748 3,018 3,023 3,126 3,289 3,449 3,583 3,681
905.02 2,458 2,064 2,072 2,075 2,065 2,062 2,062 2,065
905.03 1,317 1,378 1,380 1,402 1,433 1,465 1,493 1,513
905.04 1,914 2,455 2,464 2,583 2,684 2,766 2,835 2,885
Census Tract Total 8,437 8,914 8,940 9,186 9,471 9,742 9,974 10,144
909 /3 909.01 183 260 260 262 265 268 271 273
Census Tract Total 183 260 260 262 265 268 271 273
910 910.01 1,951 1,707 1,709 1,710 1,729 1,729 1,729 1,729
Census Tract Total 1,951 1,707 1,709 1,710 1,729 1,729 1,729 1,729
911 911.01 3,574 3,012 3,015 3,015 3,015 3,015 3,015 3,015
911.02 2,046 2,010 2,019 2,019 2,020 2,021 2,021 2,022
911.03 1,808 1,605 1,605 1,605 1,605 1,605 1,605 1,605
911.04 2,419 2,284 2,284 2,284 2,284 2,284 2,284 2,284
911.05 2,000 1,746 1,746 1,747 1,748 1,750 1,751 1,752
911.06 1,760 1,584 1,584 1,585 1,585 1,586 1,586 1,587
Census Tract Total 13,607 12,241 12,253 12,254 12,257 12,260 12,262 12,264
(Continued)IV-34
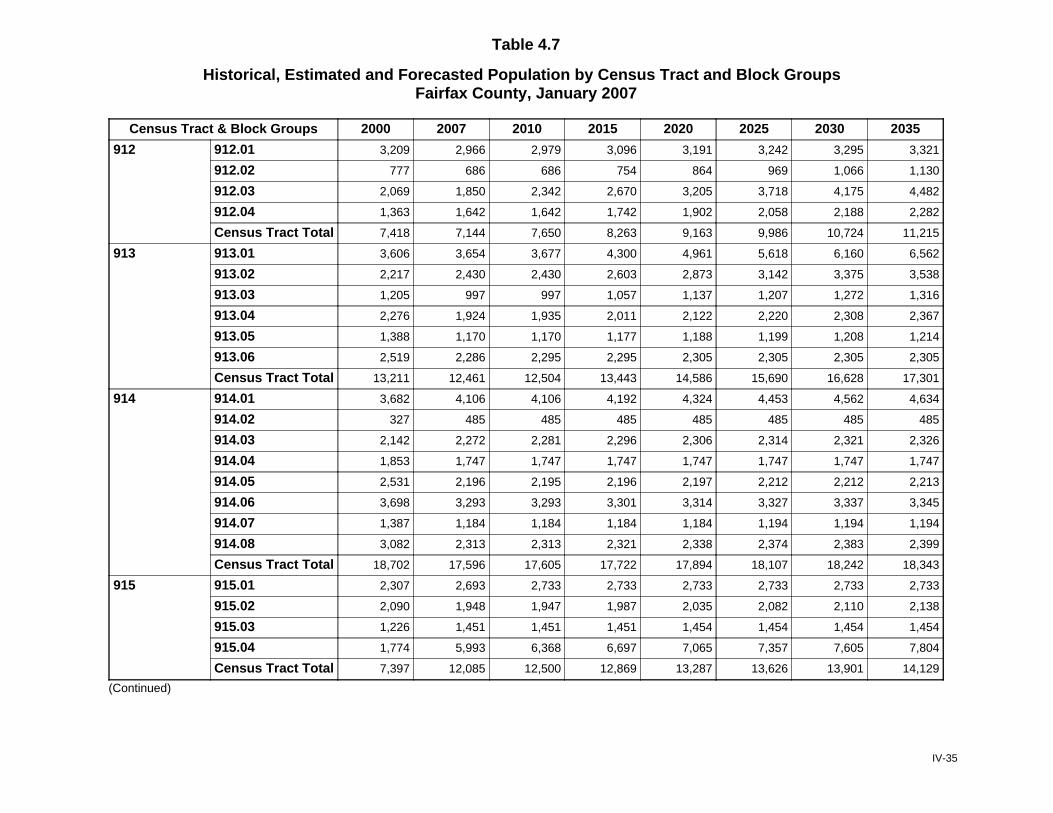
Table 4.7
Historical, Estimated and Forecasted Population by Census Tract and Block GroupsFairfax County, January 2007
Census Tract & Block Groups 2000 2007 2010 2015 2020 2025 2030 2035
912 912.01 3,209 2,966 2,979 3,096 3,191 3,242 3,295 3,321
912.02 777 686 686 754 864 969 1,066 1,130
912.03 2,069 1,850 2,342 2,670 3,205 3,718 4,175 4,482
912.04 1,363 1,642 1,642 1,742 1,902 2,058 2,188 2,282
Census Tract Total 7,418 7,144 7,650 8,263 9,163 9,986 10,724 11,215
913 913.01 3,606 3,654 3,677 4,300 4,961 5,618 6,160 6,562
913.02 2,217 2,430 2,430 2,603 2,873 3,142 3,375 3,538
913.03 1,205 997 997 1,057 1,137 1,207 1,272 1,316
913.04 2,276 1,924 1,935 2,011 2,122 2,220 2,308 2,367
913.05 1,388 1,170 1,170 1,177 1,188 1,199 1,208 1,214
913.06 2,519 2,286 2,295 2,295 2,305 2,305 2,305 2,305
Census Tract Total 13,211 12,461 12,504 13,443 14,586 15,690 16,628 17,301
914 914.01 3,682 4,106 4,106 4,192 4,324 4,453 4,562 4,634
914.02 327 485 485 485 485 485 485 485
914.03 2,142 2,272 2,281 2,296 2,306 2,314 2,321 2,326
914.04 1,853 1,747 1,747 1,747 1,747 1,747 1,747 1,747
914.05 2,531 2,196 2,195 2,196 2,197 2,212 2,212 2,213
914.06 3,698 3,293 3,293 3,301 3,314 3,327 3,337 3,345
914.07 1,387 1,184 1,184 1,184 1,184 1,194 1,194 1,194
914.08 3,082 2,313 2,313 2,321 2,338 2,374 2,383 2,399
Census Tract Total 18,702 17,596 17,605 17,722 17,894 18,107 18,242 18,343
915 915.01 2,307 2,693 2,733 2,733 2,733 2,733 2,733 2,733
915.02 2,090 1,948 1,947 1,987 2,035 2,082 2,110 2,138
915.03 1,226 1,451 1,451 1,451 1,454 1,454 1,454 1,454
915.04 1,774 5,993 6,368 6,697 7,065 7,357 7,605 7,804
Census Tract Total 7,397 12,085 12,500 12,869 13,287 13,626 13,901 14,129
(Continued)
IV-35
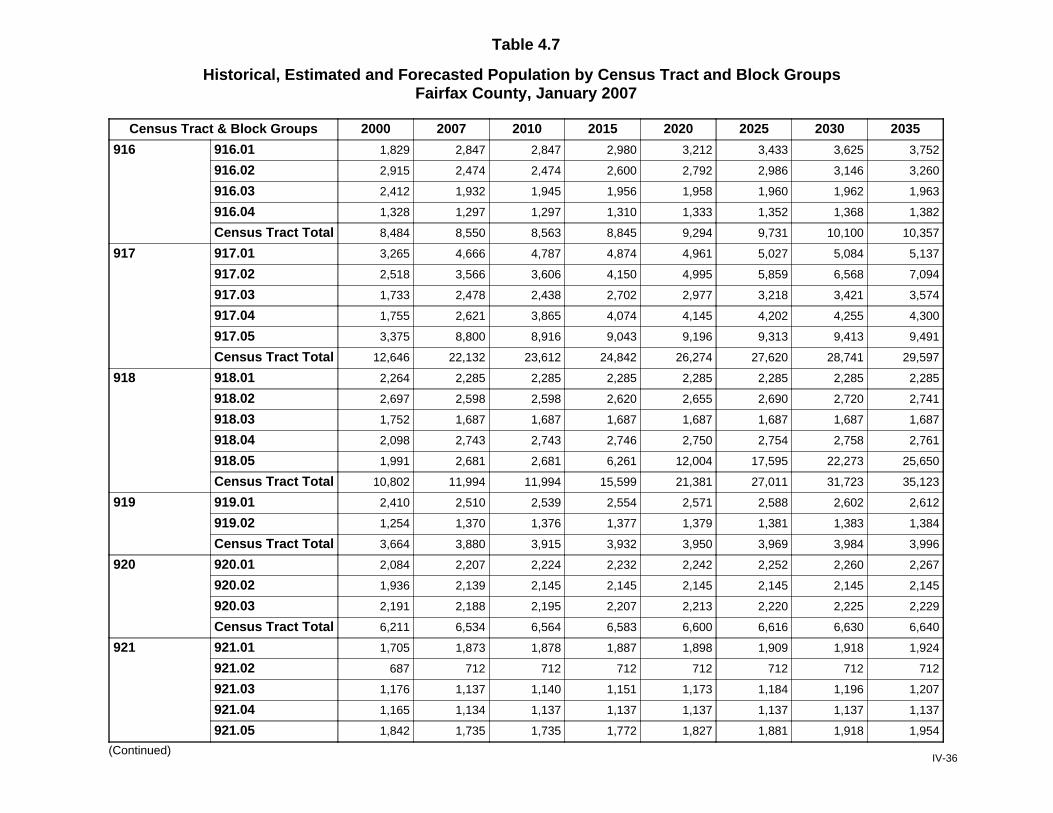
Table 4.7
Historical, Estimated and Forecasted Population by Census Tract and Block GroupsFairfax County, January 2007
Census Tract & Block Groups 2000 2007 2010 2015 2020 2025 2030 2035
916 916.01 1,829 2,847 2,847 2,980 3,212 3,433 3,625 3,752
916.02 2,915 2,474 2,474 2,600 2,792 2,986 3,146 3,260
916.03 2,412 1,932 1,945 1,956 1,958 1,960 1,962 1,963
916.04 1,328 1,297 1,297 1,310 1,333 1,352 1,368 1,382
Census Tract Total 8,484 8,550 8,563 8,845 9,294 9,731 10,100 10,357
917 917.01 3,265 4,666 4,787 4,874 4,961 5,027 5,084 5,137
917.02 2,518 3,566 3,606 4,150 4,995 5,859 6,568 7,094
917.03 1,733 2,478 2,438 2,702 2,977 3,218 3,421 3,574
917.04 1,755 2,621 3,865 4,074 4,145 4,202 4,255 4,300
917.05 3,375 8,800 8,916 9,043 9,196 9,313 9,413 9,491
Census Tract Total 12,646 22,132 23,612 24,842 26,274 27,620 28,741 29,597
918 918.01 2,264 2,285 2,285 2,285 2,285 2,285 2,285 2,285
918.02 2,697 2,598 2,598 2,620 2,655 2,690 2,720 2,741
918.03 1,752 1,687 1,687 1,687 1,687 1,687 1,687 1,687
918.04 2,098 2,743 2,743 2,746 2,750 2,754 2,758 2,761
918.05 1,991 2,681 2,681 6,261 12,004 17,595 22,273 25,650
Census Tract Total 10,802 11,994 11,994 15,599 21,381 27,011 31,723 35,123
919 919.01 2,410 2,510 2,539 2,554 2,571 2,588 2,602 2,612
919.02 1,254 1,370 1,376 1,377 1,379 1,381 1,383 1,384
Census Tract Total 3,664 3,880 3,915 3,932 3,950 3,969 3,984 3,996
920 920.01 2,084 2,207 2,224 2,232 2,242 2,252 2,260 2,267
920.02 1,936 2,139 2,145 2,145 2,145 2,145 2,145 2,145
920.03 2,191 2,188 2,195 2,207 2,213 2,220 2,225 2,229
Census Tract Total 6,211 6,534 6,564 6,583 6,600 6,616 6,630 6,640
921 921.01 1,705 1,873 1,878 1,887 1,898 1,909 1,918 1,924
921.02 687 712 712 712 712 712 712 712
921.03 1,176 1,137 1,140 1,151 1,173 1,184 1,196 1,207
921.04 1,165 1,134 1,137 1,137 1,137 1,137 1,137 1,137
921.05 1,842 1,735 1,735 1,772 1,827 1,881 1,918 1,954
(Continued)IV-36
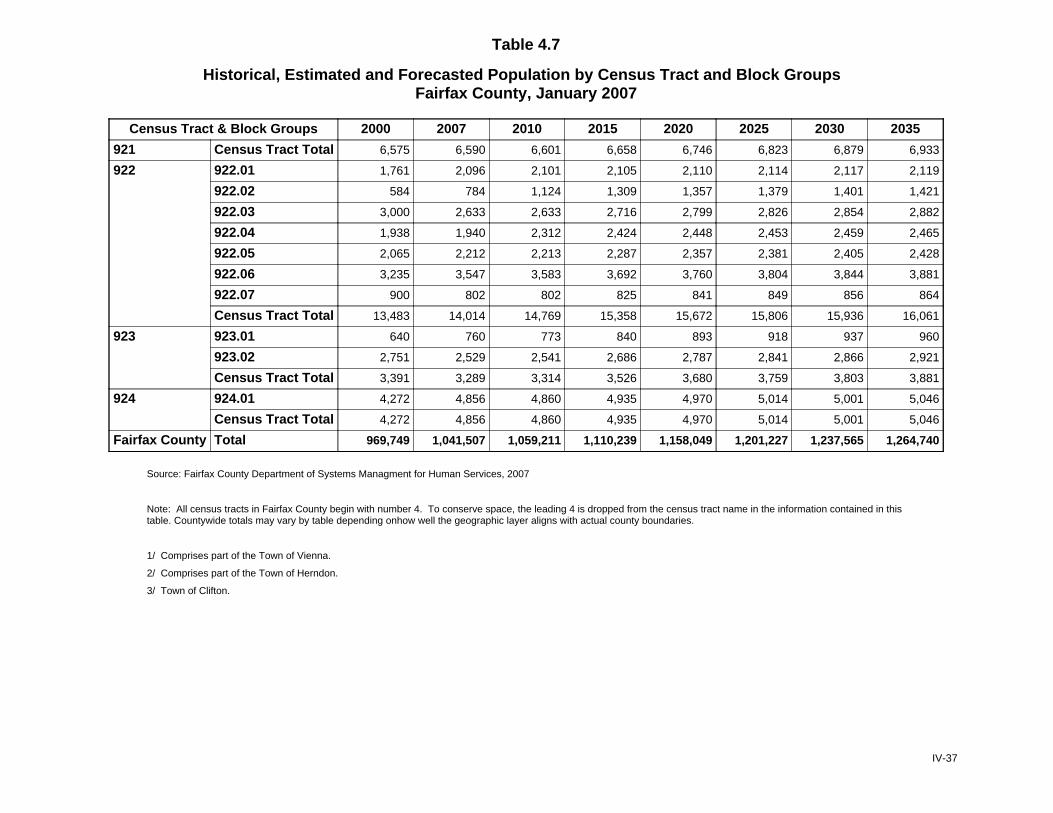
Table 4.7
Historical, Estimated and Forecasted Population by Census Tract and Block GroupsFairfax County, January 2007
Census Tract & Block Groups 2000 2007 2010 2015 2020 2025 2030 2035
Census Tract Total 6,575 6,590 6,601 6,658 6,746 6,823 6,879 6,933921
922 922.01 1,761 2,096 2,101 2,105 2,110 2,114 2,117 2,119
922.02 584 784 1,124 1,309 1,357 1,379 1,401 1,421
922.03 3,000 2,633 2,633 2,716 2,799 2,826 2,854 2,882
922.04 1,938 1,940 2,312 2,424 2,448 2,453 2,459 2,465
922.05 2,065 2,212 2,213 2,287 2,357 2,381 2,405 2,428
922.06 3,235 3,547 3,583 3,692 3,760 3,804 3,844 3,881
922.07 900 802 802 825 841 849 856 864
Census Tract Total 13,483 14,014 14,769 15,358 15,672 15,806 15,936 16,061
923 923.01 640 760 773 840 893 918 937 960
923.02 2,751 2,529 2,541 2,686 2,787 2,841 2,866 2,921
Census Tract Total 3,391 3,289 3,314 3,526 3,680 3,759 3,803 3,881
924 924.01 4,272 4,856 4,860 4,935 4,970 5,014 5,001 5,046
Census Tract Total 4,272 4,856 4,860 4,935 4,970 5,014 5,001 5,046
Fairfax County Total 969,749 1,041,507 1,059,211 1,110,239 1,158,049 1,201,227 1,237,565 1,264,740
Source: Fairfax County Department of Systems Managment for Human Services, 2007
Note: All census tracts in Fairfax County begin with number 4. To conserve space, the leading 4 is dropped from the census tract name in the information contained in thistable. Countywide totals may vary by table depending onhow well the geographic layer aligns with actual county boundaries.
1/ Comprises part of the Town of Vienna.
2/ Comprises part of the Town of Herndon.
3/ Town of Clifton.
IV-37

FORECAST HOUSEHOLDS Household forecasts are derived from forecast housing units and calculated similarly to the current household estimates for each geographic area considered. Thus, household forecasts reflect projections as of January 1 of each year. Forecast households are calculated using the forecast number of housing units by type. Vacancy rates are applied based on estimates of vacancies by geographical area.
Vacancy rates are developed by the Fairfax County Department of Systems Management for Human Services. An overall vacancy rate of 2.53 percent (and thus, an occupancy rate of 97.47 percent) is assumed for all forecast years in Fairfax County. This is based on trends in the overall occupancy rate, which has remained in the 95 to 98 percent range for the last 20 years.
V-1
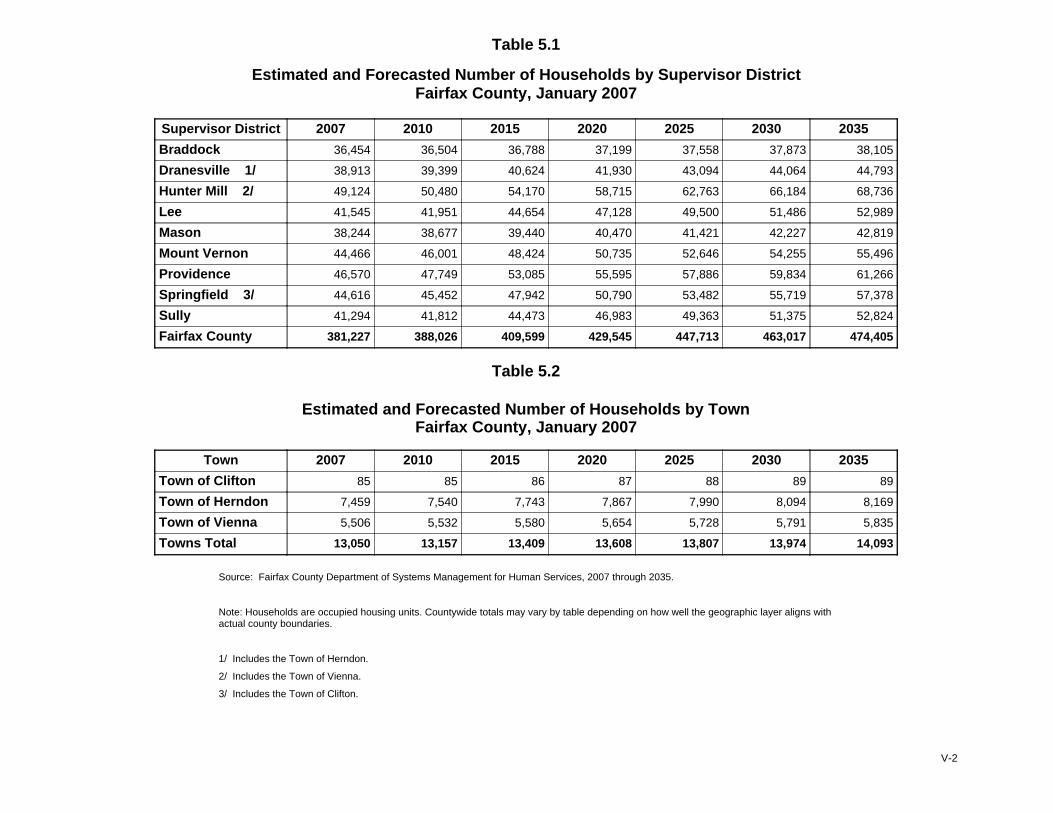
Table 5.1
Estimated and Forecasted Number of Households by Supervisor DistrictFairfax County, January 2007
Supervisor District 2007 2010 2015 2020 2025 2030 2035
Braddock 36,454 36,504 36,788 37,199 37,558 37,873 38,105
Dranesville 1/ 38,913 39,399 40,624 41,930 43,094 44,064 44,793
Hunter Mill 2/ 49,124 50,480 54,170 58,715 62,763 66,184 68,736
Lee 41,545 41,951 44,654 47,128 49,500 51,486 52,989
Mason 38,244 38,677 39,440 40,470 41,421 42,227 42,819
Mount Vernon 44,466 46,001 48,424 50,735 52,646 54,255 55,496
Providence 46,570 47,749 53,085 55,595 57,886 59,834 61,266
Springfield 3/ 44,616 45,452 47,942 50,790 53,482 55,719 57,378
Sully 41,294 41,812 44,473 46,983 49,363 51,375 52,824
Fairfax County 381,227 388,026 409,599 429,545 447,713 463,017 474,405
Table 5.2
Estimated and Forecasted Number of Households by TownFairfax County, January 2007
Town 2007 2010 2015 2020 2025 2030 2035
Town of Clifton 85 85 86 87 88 89 89
Town of Herndon 7,459 7,540 7,743 7,867 7,990 8,094 8,169
Town of Vienna 5,506 5,532 5,580 5,654 5,728 5,791 5,835
Towns Total 13,050 13,157 13,409 13,608 13,807 13,974 14,093
Source: Fairfax County Department of Systems Management for Human Services, 2007 through 2035.
Note: Households are occupied housing units. Countywide totals may vary by table depending on how well the geographic layer aligns withactual county boundaries.
1/ Includes the Town of Herndon.
2/ Includes the Town of Vienna.
3/ Includes the Town of Clifton.
V-2
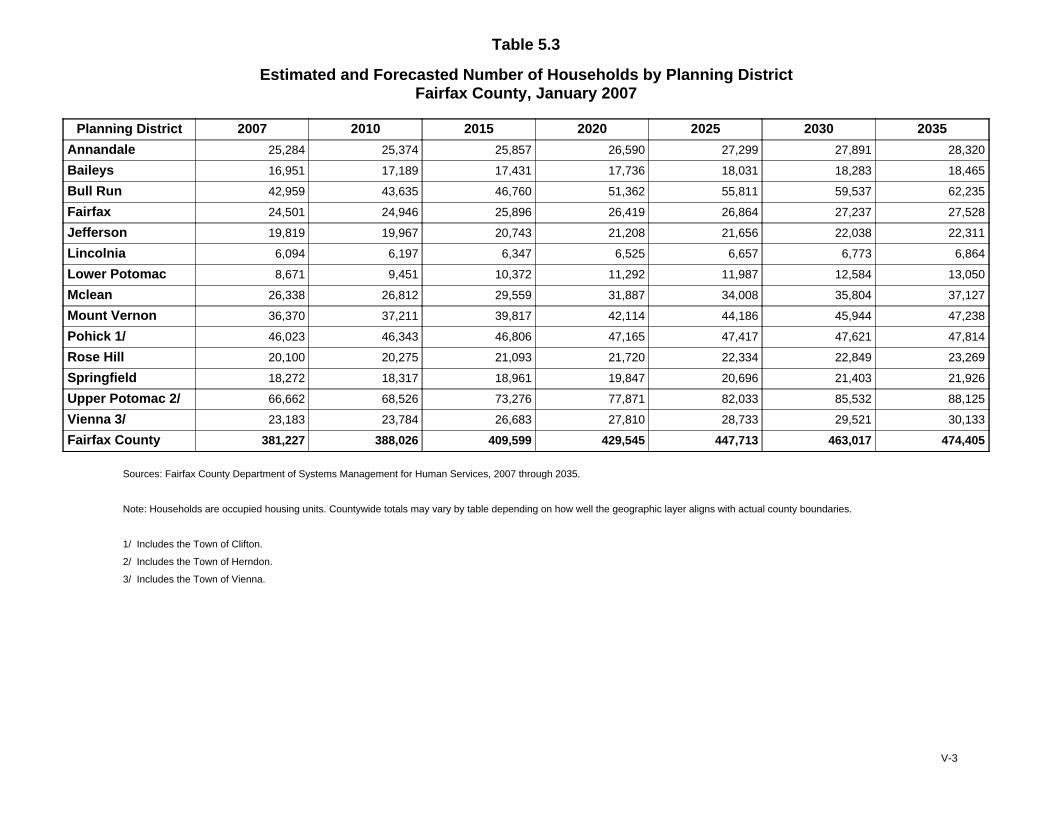
Table 5.3
Estimated and Forecasted Number of Households by Planning DistrictFairfax County, January 2007
Planning District 2007 2010 2015 2020 2025 2030 2035
Annandale 25,284 25,374 25,857 26,590 27,299 27,891 28,320
Baileys 16,951 17,189 17,431 17,736 18,031 18,283 18,465
Bull Run 42,959 43,635 46,760 51,362 55,811 59,537 62,235
Fairfax 24,501 24,946 25,896 26,419 26,864 27,237 27,528
Jefferson 19,819 19,967 20,743 21,208 21,656 22,038 22,311
Lincolnia 6,094 6,197 6,347 6,525 6,657 6,773 6,864
Lower Potomac 8,671 9,451 10,372 11,292 11,987 12,584 13,050
Mclean 26,338 26,812 29,559 31,887 34,008 35,804 37,127
Mount Vernon 36,370 37,211 39,817 42,114 44,186 45,944 47,238
Pohick 1/ 46,023 46,343 46,806 47,165 47,417 47,621 47,814
Rose Hill 20,100 20,275 21,093 21,720 22,334 22,849 23,269
Springfield 18,272 18,317 18,961 19,847 20,696 21,403 21,926
Upper Potomac 2/ 66,662 68,526 73,276 77,871 82,033 85,532 88,125
Vienna 3/ 23,183 23,784 26,683 27,810 28,733 29,521 30,133
Fairfax County 381,227 388,026 409,599 429,545 447,713 463,017 474,405
Sources: Fairfax County Department of Systems Management for Human Services, 2007 through 2035.
Note: Households are occupied housing units. Countywide totals may vary by table depending on how well the geographic layer aligns with actual county boundaries.
1/ Includes the Town of Clifton.
2/ Includes the Town of Herndon.
3/ Includes the Town of Vienna.
V-3
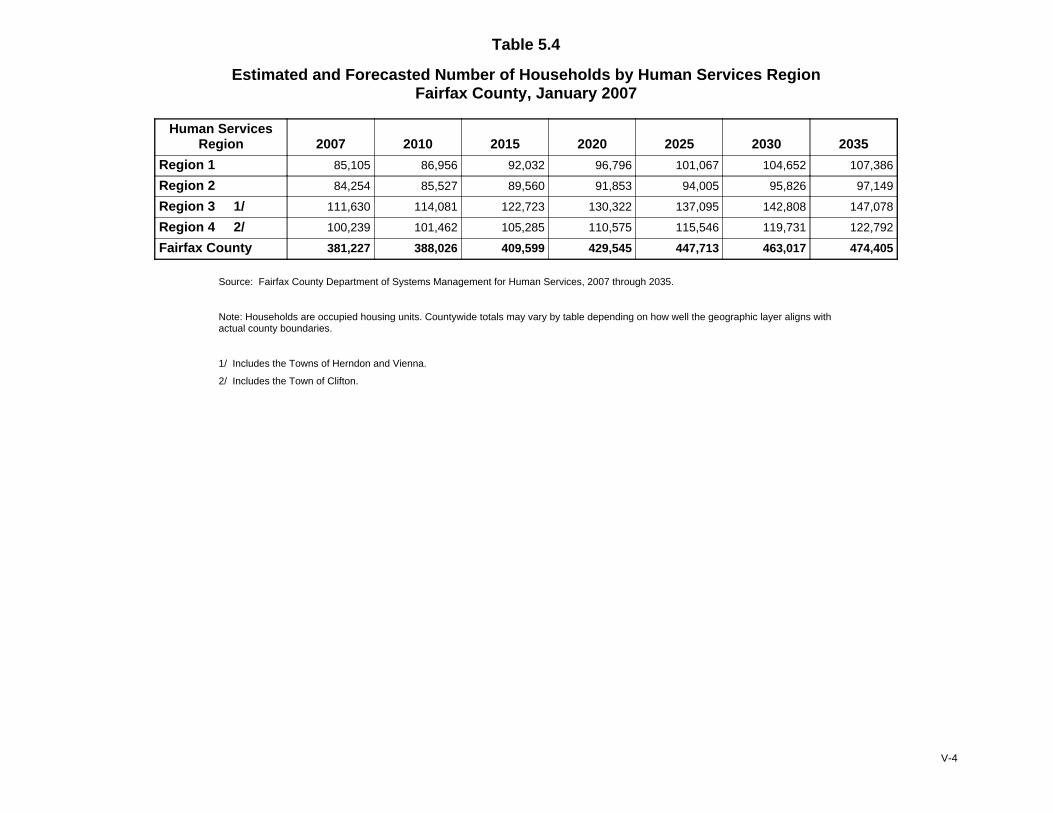
Table 5.4
Estimated and Forecasted Number of Households by Human Services RegionFairfax County, January 2007
Human ServicesRegion 2007 2010 2015 2020 2025 2030 2035
Region 1 85,105 86,956 92,032 96,796 101,067 104,652 107,386
Region 2 84,254 85,527 89,560 91,853 94,005 95,826 97,149
Region 3 1/ 111,630 114,081 122,723 130,322 137,095 142,808 147,078
Region 4 2/ 100,239 101,462 105,285 110,575 115,546 119,731 122,792
Fairfax County 381,227 388,026 409,599 429,545 447,713 463,017 474,405
Source: Fairfax County Department of Systems Management for Human Services, 2007 through 2035.
Note: Households are occupied housing units. Countywide totals may vary by table depending on how well the geographic layer aligns withactual county boundaries.
1/ Includes the Towns of Herndon and Vienna.
2/ Includes the Town of Clifton.
V-4
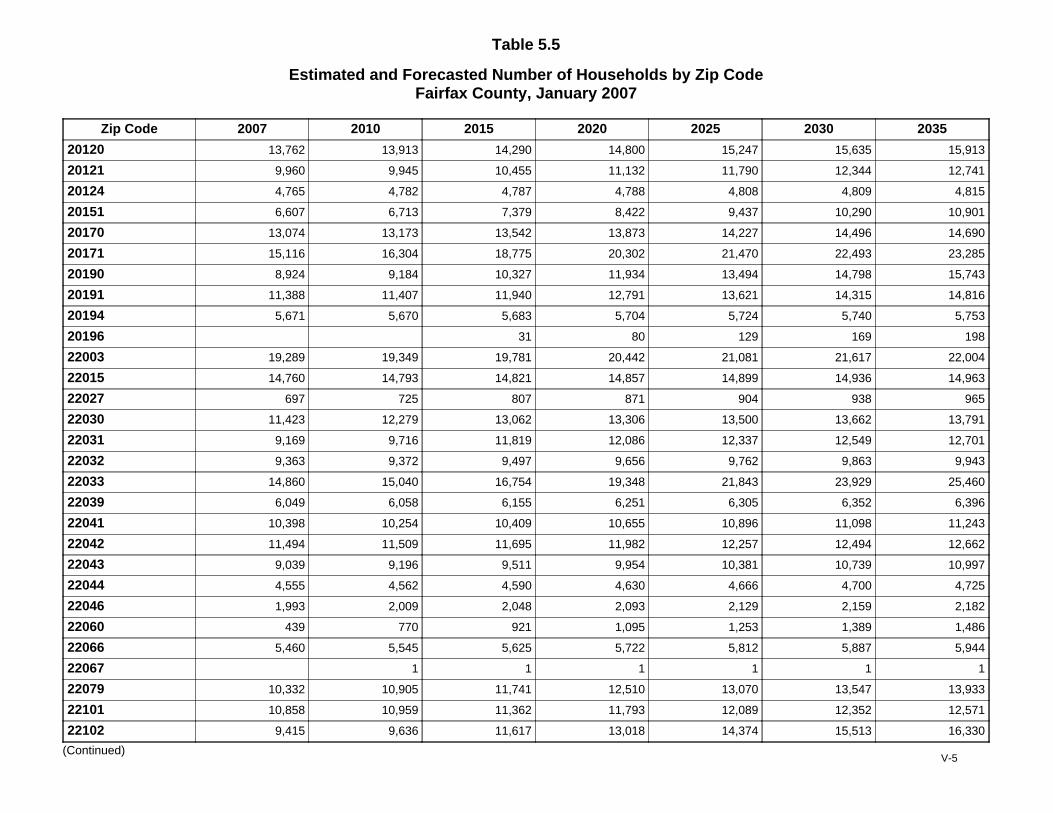
Table 5.5
Estimated and Forecasted Number of Households by Zip CodeFairfax County, January 2007
Zip Code 2007 2010 2015 2020 2025 2030 2035
20120 13,762 13,913 14,290 14,800 15,247 15,635 15,913
20121 9,960 9,945 10,455 11,132 11,790 12,344 12,741
20124 4,765 4,782 4,787 4,788 4,808 4,809 4,815
20151 6,607 6,713 7,379 8,422 9,437 10,290 10,901
20170 13,074 13,173 13,542 13,873 14,227 14,496 14,690
20171 15,116 16,304 18,775 20,302 21,470 22,493 23,285
20190 8,924 9,184 10,327 11,934 13,494 14,798 15,743
20191 11,388 11,407 11,940 12,791 13,621 14,315 14,816
20194 5,671 5,670 5,683 5,704 5,724 5,740 5,753
20196 31 80 129 169 198
22003 19,289 19,349 19,781 20,442 21,081 21,617 22,004
22015 14,760 14,793 14,821 14,857 14,899 14,936 14,963
22027 697 725 807 871 904 938 965
22030 11,423 12,279 13,062 13,306 13,500 13,662 13,791
22031 9,169 9,716 11,819 12,086 12,337 12,549 12,701
22032 9,363 9,372 9,497 9,656 9,762 9,863 9,943
22033 14,860 15,040 16,754 19,348 21,843 23,929 25,460
22039 6,049 6,058 6,155 6,251 6,305 6,352 6,396
22041 10,398 10,254 10,409 10,655 10,896 11,098 11,243
22042 11,494 11,509 11,695 11,982 12,257 12,494 12,662
22043 9,039 9,196 9,511 9,954 10,381 10,739 10,997
22044 4,555 4,562 4,590 4,630 4,666 4,700 4,725
22046 1,993 2,009 2,048 2,093 2,129 2,159 2,182
22060 439 770 921 1,095 1,253 1,389 1,486
22066 5,460 5,545 5,625 5,722 5,812 5,887 5,944
22067 1 1 1 1 1 1
22079 10,332 10,905 11,741 12,510 13,070 13,547 13,933
22101 10,858 10,959 11,362 11,793 12,089 12,352 12,571
22102 9,415 9,636 11,617 13,018 14,374 15,513 16,330
(Continued)V-5

Table 5.5
Estimated and Forecasted Number of Households by Zip CodeFairfax County, January 2007
Zip Code 2007 2010 2015 2020 2025 2030 2035
22103 8 20 32 42 49
22124 6,545 6,586 6,654 6,740 6,825 6,897 6,949
22150 7,770 7,789 8,332 9,138 9,898 10,536 11,003
22151 5,741 5,757 5,786 5,819 5,847 5,871 5,888
22152 10,189 10,197 10,234 10,269 10,294 10,316 10,332
22153 10,582 10,724 10,878 10,962 11,035 11,077 11,130
22180 8,778 8,878 9,437 9,551 9,658 9,748 9,814
22181 5,347 5,352 5,435 5,557 5,675 5,769 5,845
22182 8,535 8,580 9,291 10,080 10,710 11,249 11,671
22203 144 144 144 144 145 145 145
22204 9 9 9 9 9 9 9
22206 2 62 69 69 69 69 69
22207 47 47 49 51 52 53 54
22213 2 2 2 2 2 2 2
22302 229 529 564 567 569 571 573
22303 6,529 7,105 7,923 8,529 9,096 9,568 9,918
22304 145 145 145 145 145 145 145
22306 11,500 11,674 12,552 13,487 14,340 15,069 15,604
22307 4,571 4,571 4,639 4,760 4,879 4,975 5,041
22308 4,676 4,687 4,740 4,807 4,873 4,929 4,970
22309 11,228 11,315 12,166 12,784 13,289 13,728 14,060
22310 10,831 10,895 11,244 11,643 12,012 12,324 12,556
22311 600 607 613 621 630 636 641
22312 7,508 7,635 7,808 8,022 8,193 8,338 8,452
22315 10,856 10,967 11,450 11,670 11,933 12,140 12,332
Fairfax County 381,227 388,026 409,599 429,545 447,713 463,017 474,405
Sources: Fairfax County Department of Systems Management for Human Services, 2007 through 2035.
Note: Only Fairfax County households are included. Zip codes without data are not displayed. Countywide totals may vary by table depending on how well the geographic layer alignswith actual county boundaries.
V-6
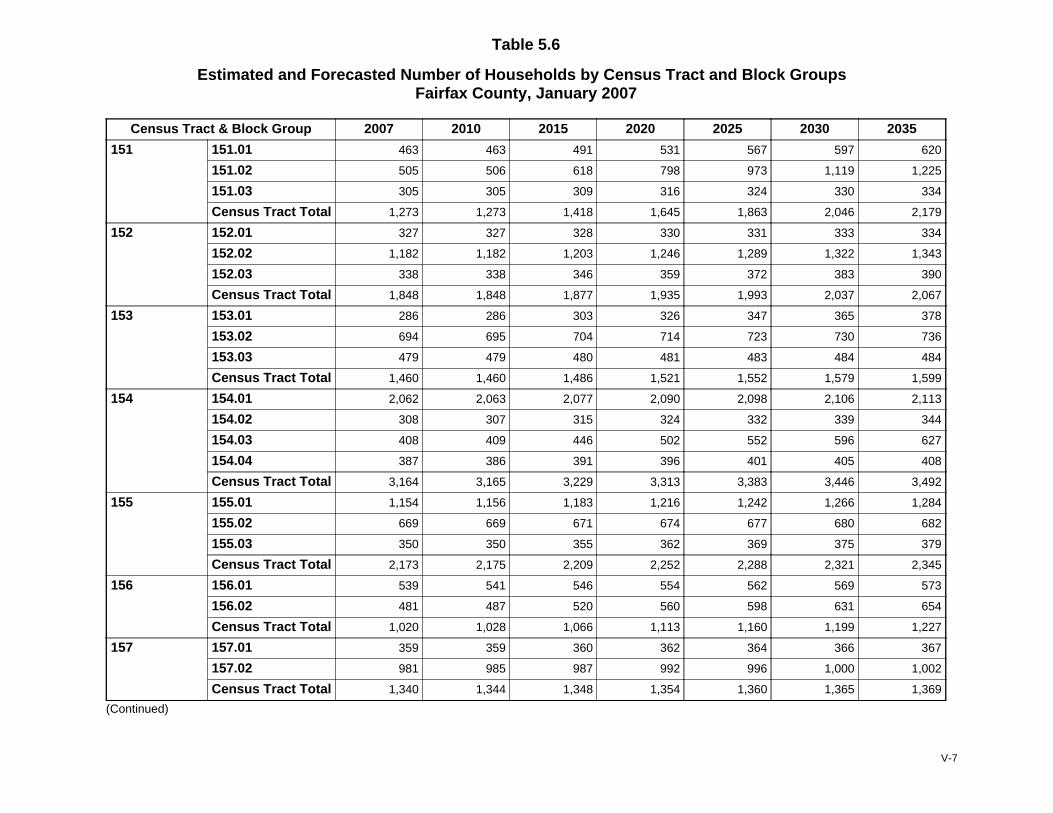
Table 5.6
Estimated and Forecasted Number of Households by Census Tract and Block GroupsFairfax County, January 2007
Census Tract & Block Group 2007 2010 2015 2020 2025 2030 2035
151 151.01 463 463 491 531 567 597 620
151.02 505 506 618 798 973 1,119 1,225
151.03 305 305 309 316 324 330 334
Census Tract Total 1,273 1,273 1,418 1,645 1,863 2,046 2,179
152 152.01 327 327 328 330 331 333 334
152.02 1,182 1,182 1,203 1,246 1,289 1,322 1,343
152.03 338 338 346 359 372 383 390
Census Tract Total 1,848 1,848 1,877 1,935 1,993 2,037 2,067
153 153.01 286 286 303 326 347 365 378
153.02 694 695 704 714 723 730 736
153.03 479 479 480 481 483 484 484
Census Tract Total 1,460 1,460 1,486 1,521 1,552 1,579 1,599
154 154.01 2,062 2,063 2,077 2,090 2,098 2,106 2,113
154.02 308 307 315 324 332 339 344
154.03 408 409 446 502 552 596 627
154.04 387 386 391 396 401 405 408
Census Tract Total 3,164 3,165 3,229 3,313 3,383 3,446 3,492
155 155.01 1,154 1,156 1,183 1,216 1,242 1,266 1,284
155.02 669 669 671 674 677 680 682
155.03 350 350 355 362 369 375 379
Census Tract Total 2,173 2,175 2,209 2,252 2,288 2,321 2,345
156 156.01 539 541 546 554 562 569 573
156.02 481 487 520 560 598 631 654
Census Tract Total 1,020 1,028 1,066 1,113 1,160 1,199 1,227
157 157.01 359 359 360 362 364 366 367
157.02 981 985 987 992 996 1,000 1,002
Census Tract Total 1,340 1,344 1,348 1,354 1,360 1,365 1,369
(Continued)
V-7
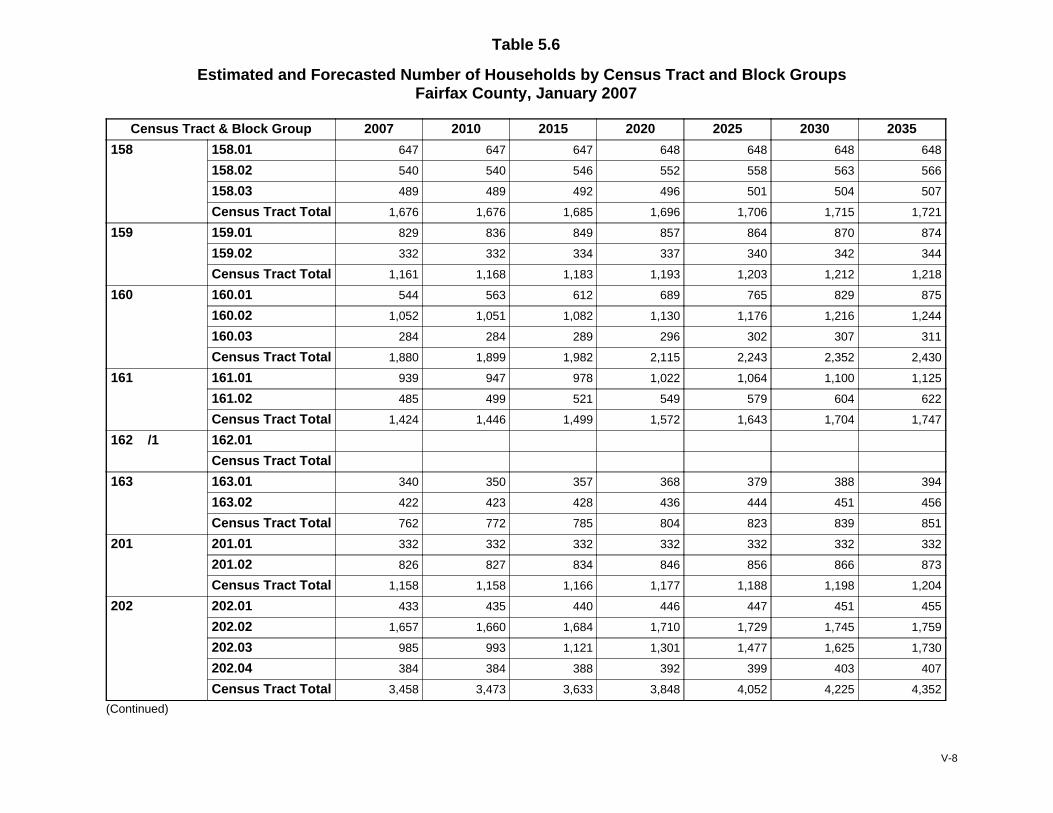
Table 5.6
Estimated and Forecasted Number of Households by Census Tract and Block GroupsFairfax County, January 2007
Census Tract & Block Group 2007 2010 2015 2020 2025 2030 2035
158 158.01 647 647 647 648 648 648 648
158.02 540 540 546 552 558 563 566
158.03 489 489 492 496 501 504 507
Census Tract Total 1,676 1,676 1,685 1,696 1,706 1,715 1,721
159 159.01 829 836 849 857 864 870 874
159.02 332 332 334 337 340 342 344
Census Tract Total 1,161 1,168 1,183 1,193 1,203 1,212 1,218
160 160.01 544 563 612 689 765 829 875
160.02 1,052 1,051 1,082 1,130 1,176 1,216 1,244
160.03 284 284 289 296 302 307 311
Census Tract Total 1,880 1,899 1,982 2,115 2,243 2,352 2,430
161 161.01 939 947 978 1,022 1,064 1,100 1,125
161.02 485 499 521 549 579 604 622
Census Tract Total 1,424 1,446 1,499 1,572 1,643 1,704 1,747
162 /1 162.01
Census Tract Total
163 163.01 340 350 357 368 379 388 394
163.02 422 423 428 436 444 451 456
Census Tract Total 762 772 785 804 823 839 851
201 201.01 332 332 332 332 332 332 332
201.02 826 827 834 846 856 866 873
Census Tract Total 1,158 1,158 1,166 1,177 1,188 1,198 1,204
202 202.01 433 435 440 446 447 451 455
202.02 1,657 1,660 1,684 1,710 1,729 1,745 1,759
202.03 985 993 1,121 1,301 1,477 1,625 1,730
202.04 384 384 388 392 399 403 407
Census Tract Total 3,458 3,473 3,633 3,848 4,052 4,225 4,352
(Continued)
V-8
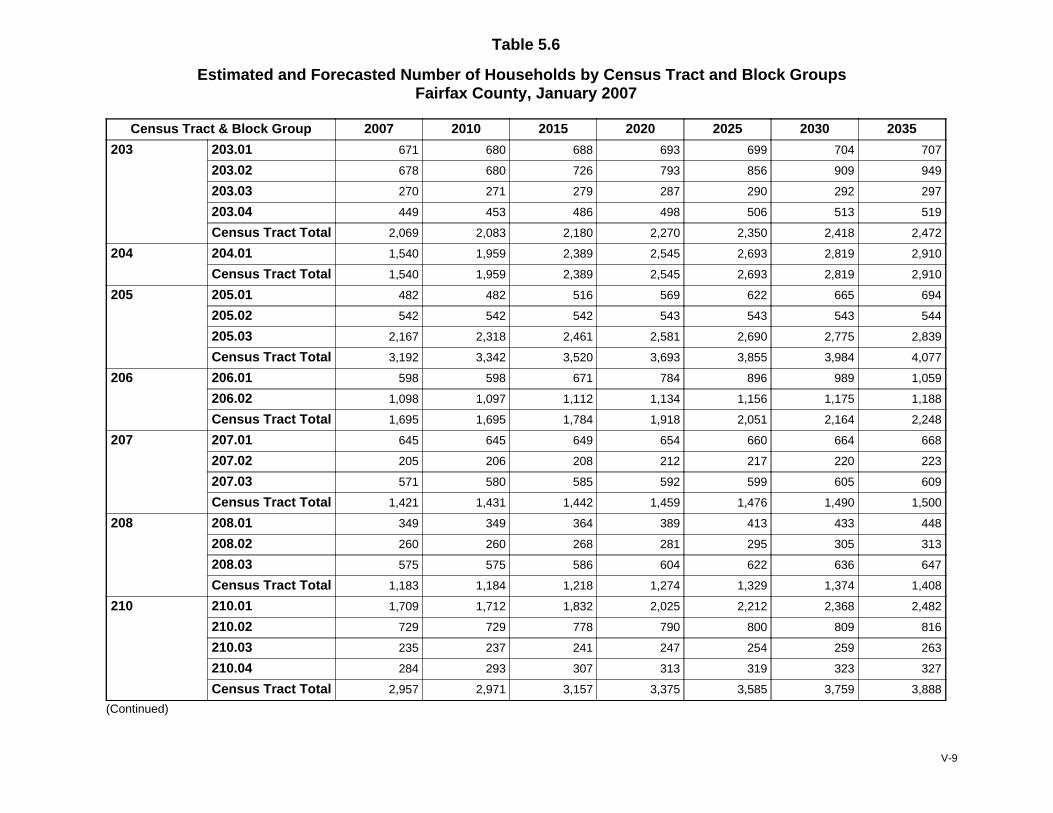
Table 5.6
Estimated and Forecasted Number of Households by Census Tract and Block GroupsFairfax County, January 2007
Census Tract & Block Group 2007 2010 2015 2020 2025 2030 2035
203 203.01 671 680 688 693 699 704 707
203.02 678 680 726 793 856 909 949
203.03 270 271 279 287 290 292 297
203.04 449 453 486 498 506 513 519
Census Tract Total 2,069 2,083 2,180 2,270 2,350 2,418 2,472
204 204.01 1,540 1,959 2,389 2,545 2,693 2,819 2,910
Census Tract Total 1,540 1,959 2,389 2,545 2,693 2,819 2,910
205 205.01 482 482 516 569 622 665 694
205.02 542 542 542 543 543 543 544
205.03 2,167 2,318 2,461 2,581 2,690 2,775 2,839
Census Tract Total 3,192 3,342 3,520 3,693 3,855 3,984 4,077
206 206.01 598 598 671 784 896 989 1,059
206.02 1,098 1,097 1,112 1,134 1,156 1,175 1,188
Census Tract Total 1,695 1,695 1,784 1,918 2,051 2,164 2,248
207 207.01 645 645 649 654 660 664 668
207.02 205 206 208 212 217 220 223
207.03 571 580 585 592 599 605 609
Census Tract Total 1,421 1,431 1,442 1,459 1,476 1,490 1,500
208 208.01 349 349 364 389 413 433 448
208.02 260 260 268 281 295 305 313
208.03 575 575 586 604 622 636 647
Census Tract Total 1,183 1,184 1,218 1,274 1,329 1,374 1,408
210 210.01 1,709 1,712 1,832 2,025 2,212 2,368 2,482
210.02 729 729 778 790 800 809 816
210.03 235 237 241 247 254 259 263
210.04 284 293 307 313 319 323 327
Census Tract Total 2,957 2,971 3,157 3,375 3,585 3,759 3,888
(Continued)
V-9
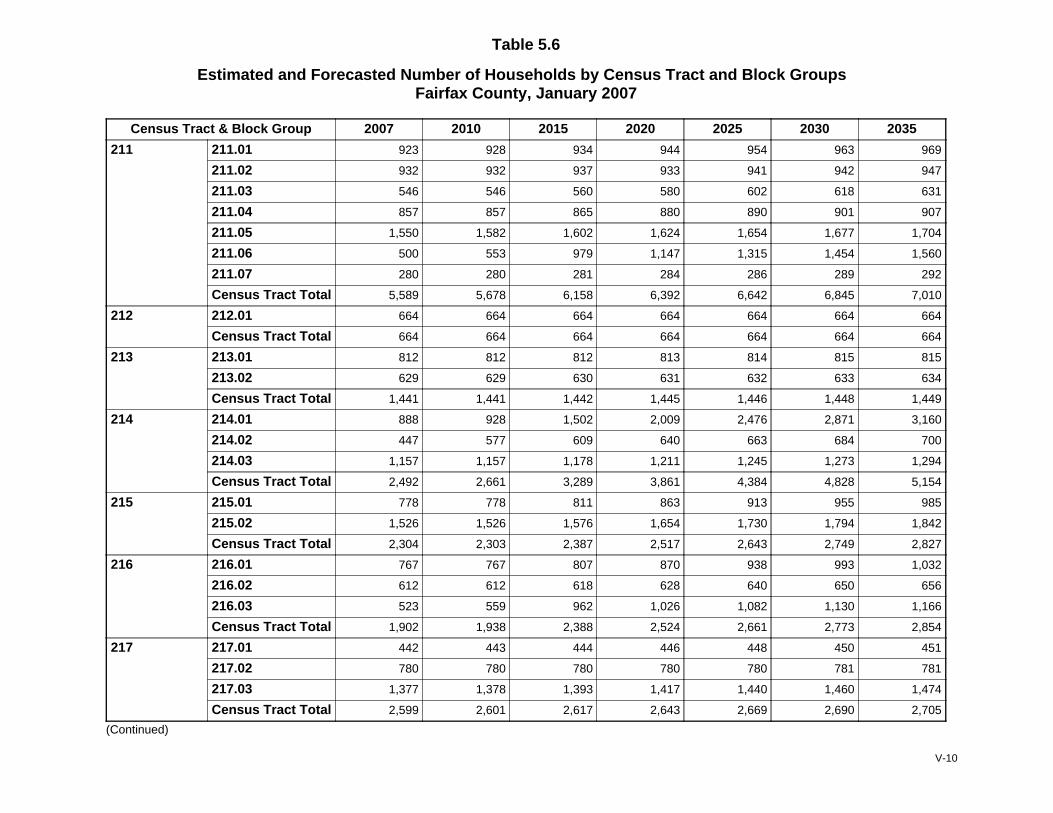
Table 5.6
Estimated and Forecasted Number of Households by Census Tract and Block GroupsFairfax County, January 2007
Census Tract & Block Group 2007 2010 2015 2020 2025 2030 2035
211 211.01 923 928 934 944 954 963 969
211.02 932 932 937 933 941 942 947
211.03 546 546 560 580 602 618 631
211.04 857 857 865 880 890 901 907
211.05 1,550 1,582 1,602 1,624 1,654 1,677 1,704
211.06 500 553 979 1,147 1,315 1,454 1,560
211.07 280 280 281 284 286 289 292
Census Tract Total 5,589 5,678 6,158 6,392 6,642 6,845 7,010
212 212.01 664 664 664 664 664 664 664
Census Tract Total 664 664 664 664 664 664 664
213 213.01 812 812 812 813 814 815 815
213.02 629 629 630 631 632 633 634
Census Tract Total 1,441 1,441 1,442 1,445 1,446 1,448 1,449
214 214.01 888 928 1,502 2,009 2,476 2,871 3,160
214.02 447 577 609 640 663 684 700
214.03 1,157 1,157 1,178 1,211 1,245 1,273 1,294
Census Tract Total 2,492 2,661 3,289 3,861 4,384 4,828 5,154
215 215.01 778 778 811 863 913 955 985
215.02 1,526 1,526 1,576 1,654 1,730 1,794 1,842
Census Tract Total 2,304 2,303 2,387 2,517 2,643 2,749 2,827
216 216.01 767 767 807 870 938 993 1,032
216.02 612 612 618 628 640 650 656
216.03 523 559 962 1,026 1,082 1,130 1,166
Census Tract Total 1,902 1,938 2,388 2,524 2,661 2,773 2,854
217 217.01 442 443 444 446 448 450 451
217.02 780 780 780 780 780 781 781
217.03 1,377 1,378 1,393 1,417 1,440 1,460 1,474
Census Tract Total 2,599 2,601 2,617 2,643 2,669 2,690 2,705
(Continued)
V-10
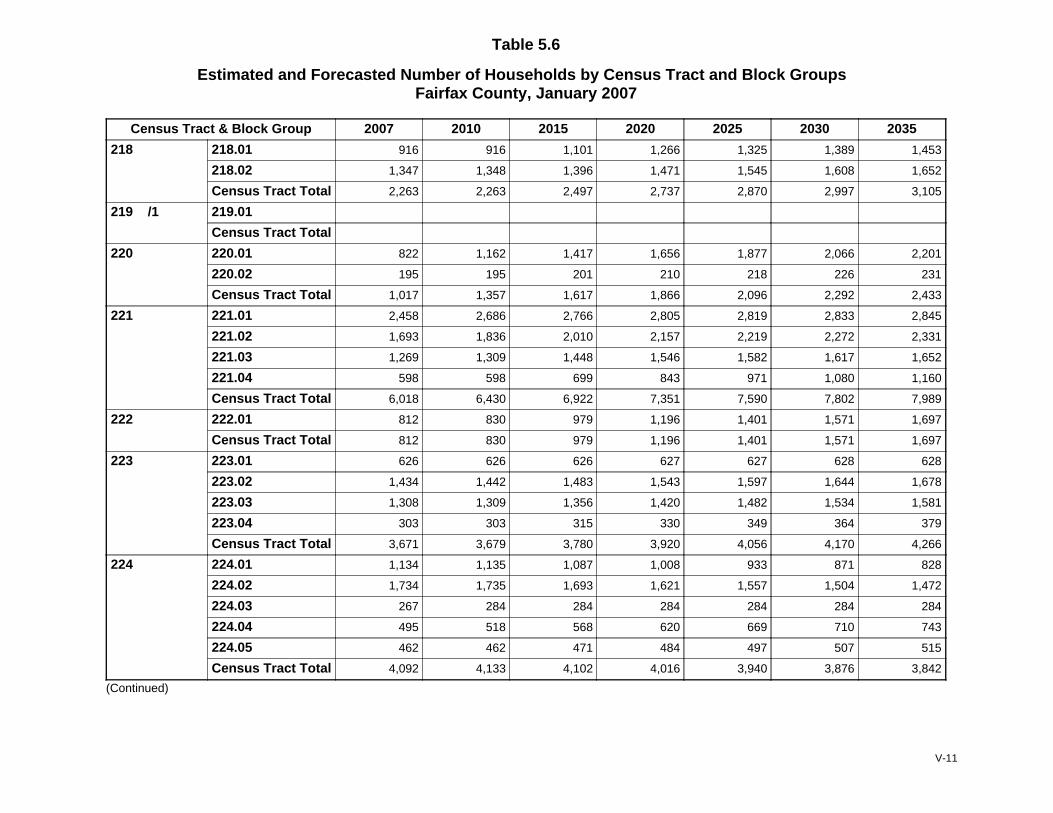
Table 5.6
Estimated and Forecasted Number of Households by Census Tract and Block GroupsFairfax County, January 2007
Census Tract & Block Group 2007 2010 2015 2020 2025 2030 2035
218 218.01 916 916 1,101 1,266 1,325 1,389 1,453
218.02 1,347 1,348 1,396 1,471 1,545 1,608 1,652
Census Tract Total 2,263 2,263 2,497 2,737 2,870 2,997 3,105
219 /1 219.01
Census Tract Total
220 220.01 822 1,162 1,417 1,656 1,877 2,066 2,201
220.02 195 195 201 210 218 226 231
Census Tract Total 1,017 1,357 1,617 1,866 2,096 2,292 2,433
221 221.01 2,458 2,686 2,766 2,805 2,819 2,833 2,845
221.02 1,693 1,836 2,010 2,157 2,219 2,272 2,331
221.03 1,269 1,309 1,448 1,546 1,582 1,617 1,652
221.04 598 598 699 843 971 1,080 1,160
Census Tract Total 6,018 6,430 6,922 7,351 7,590 7,802 7,989
222 222.01 812 830 979 1,196 1,401 1,571 1,697
Census Tract Total 812 830 979 1,196 1,401 1,571 1,697
223 223.01 626 626 626 627 627 628 628
223.02 1,434 1,442 1,483 1,543 1,597 1,644 1,678
223.03 1,308 1,309 1,356 1,420 1,482 1,534 1,581
223.04 303 303 315 330 349 364 379
Census Tract Total 3,671 3,679 3,780 3,920 4,056 4,170 4,266
224 224.01 1,134 1,135 1,087 1,008 933 871 828
224.02 1,734 1,735 1,693 1,621 1,557 1,504 1,472
224.03 267 284 284 284 284 284 284
224.04 495 518 568 620 669 710 743
224.05 462 462 471 484 497 507 515
Census Tract Total 4,092 4,133 4,102 4,016 3,940 3,876 3,842
(Continued)
V-11
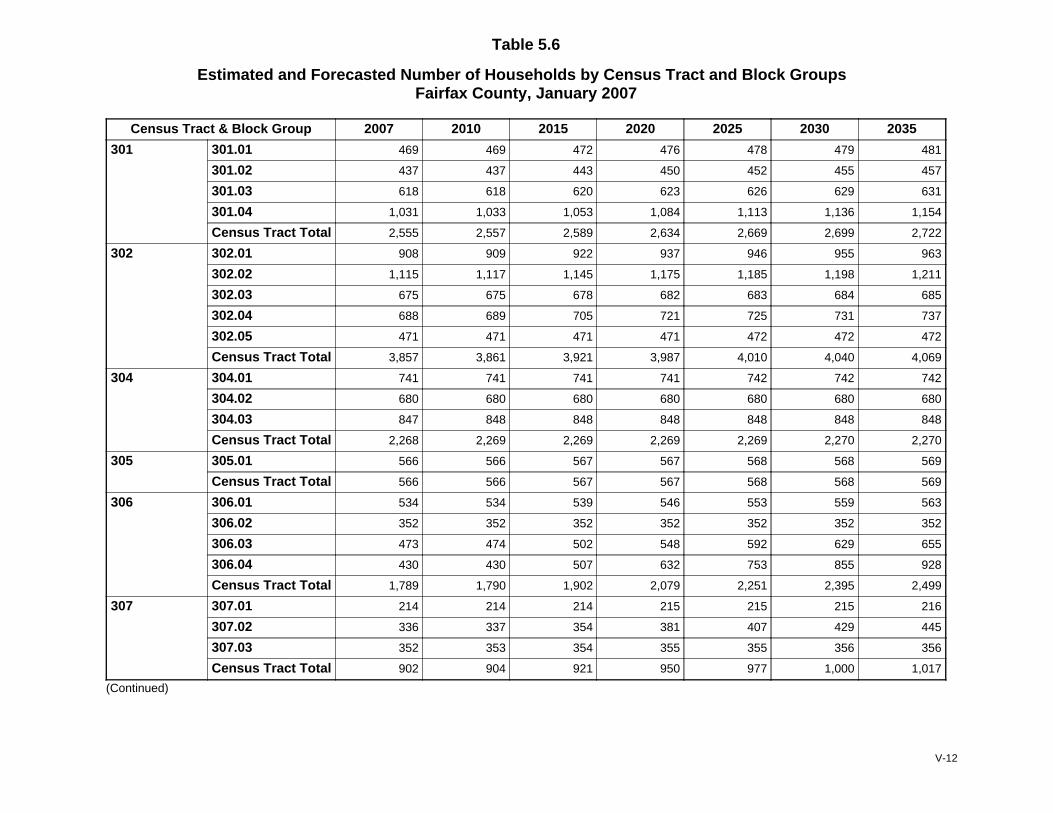
Table 5.6
Estimated and Forecasted Number of Households by Census Tract and Block GroupsFairfax County, January 2007
Census Tract & Block Group 2007 2010 2015 2020 2025 2030 2035
301 301.01 469 469 472 476 478 479 481
301.02 437 437 443 450 452 455 457
301.03 618 618 620 623 626 629 631
301.04 1,031 1,033 1,053 1,084 1,113 1,136 1,154
Census Tract Total 2,555 2,557 2,589 2,634 2,669 2,699 2,722
302 302.01 908 909 922 937 946 955 963
302.02 1,115 1,117 1,145 1,175 1,185 1,198 1,211
302.03 675 675 678 682 683 684 685
302.04 688 689 705 721 725 731 737
302.05 471 471 471 471 472 472 472
Census Tract Total 3,857 3,861 3,921 3,987 4,010 4,040 4,069
304 304.01 741 741 741 741 742 742 742
304.02 680 680 680 680 680 680 680
304.03 847 848 848 848 848 848 848
Census Tract Total 2,268 2,269 2,269 2,269 2,269 2,270 2,270
305 305.01 566 566 567 567 568 568 569
Census Tract Total 566 566 567 567 568 568 569
306 306.01 534 534 539 546 553 559 563
306.02 352 352 352 352 352 352 352
306.03 473 474 502 548 592 629 655
306.04 430 430 507 632 753 855 928
Census Tract Total 1,789 1,790 1,902 2,079 2,251 2,395 2,499
307 307.01 214 214 214 215 215 215 216
307.02 336 337 354 381 407 429 445
307.03 352 353 354 355 355 356 356
Census Tract Total 902 904 921 950 977 1,000 1,017
(Continued)
V-12
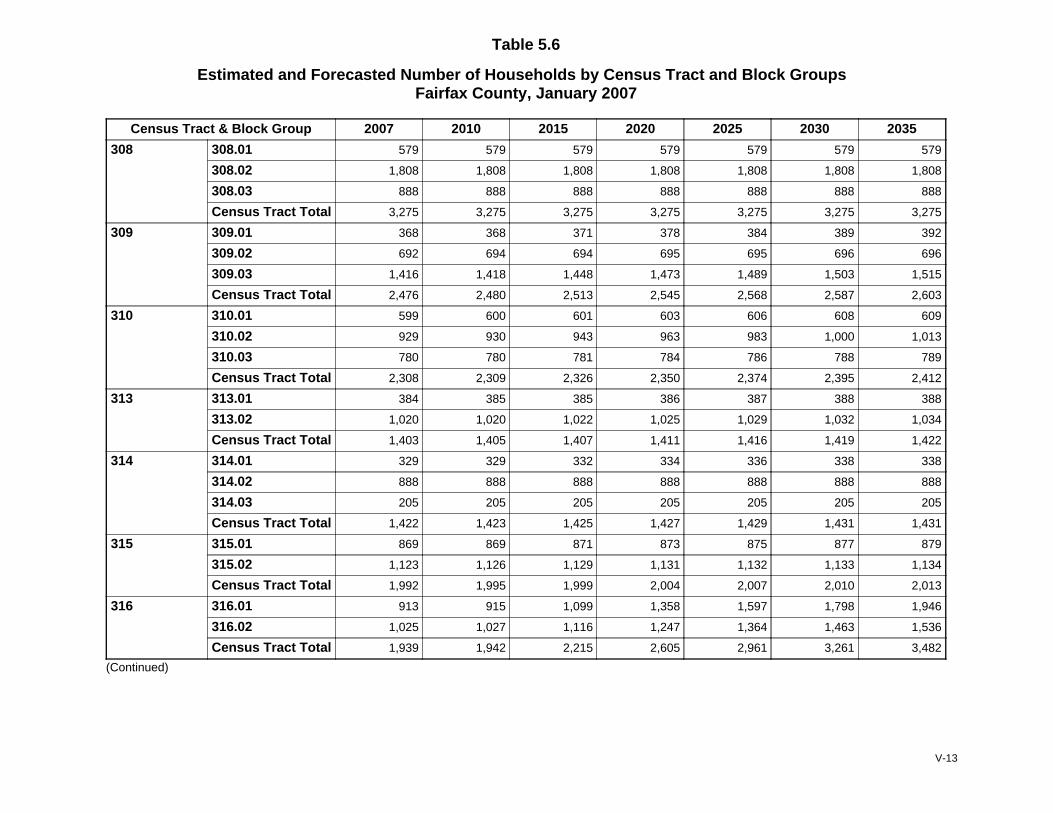
Table 5.6
Estimated and Forecasted Number of Households by Census Tract and Block GroupsFairfax County, January 2007
Census Tract & Block Group 2007 2010 2015 2020 2025 2030 2035
308 308.01 579 579 579 579 579 579 579
308.02 1,808 1,808 1,808 1,808 1,808 1,808 1,808
308.03 888 888 888 888 888 888 888
Census Tract Total 3,275 3,275 3,275 3,275 3,275 3,275 3,275
309 309.01 368 368 371 378 384 389 392
309.02 692 694 694 695 695 696 696
309.03 1,416 1,418 1,448 1,473 1,489 1,503 1,515
Census Tract Total 2,476 2,480 2,513 2,545 2,568 2,587 2,603
310 310.01 599 600 601 603 606 608 609
310.02 929 930 943 963 983 1,000 1,013
310.03 780 780 781 784 786 788 789
Census Tract Total 2,308 2,309 2,326 2,350 2,374 2,395 2,412
313 313.01 384 385 385 386 387 388 388
313.02 1,020 1,020 1,022 1,025 1,029 1,032 1,034
Census Tract Total 1,403 1,405 1,407 1,411 1,416 1,419 1,422
314 314.01 329 329 332 334 336 338 338
314.02 888 888 888 888 888 888 888
314.03 205 205 205 205 205 205 205
Census Tract Total 1,422 1,423 1,425 1,427 1,429 1,431 1,431
315 315.01 869 869 871 873 875 877 879
315.02 1,123 1,126 1,129 1,131 1,132 1,133 1,134
Census Tract Total 1,992 1,995 1,999 2,004 2,007 2,010 2,013
316 316.01 913 915 1,099 1,358 1,597 1,798 1,946
316.02 1,025 1,027 1,116 1,247 1,364 1,463 1,536
Census Tract Total 1,939 1,942 2,215 2,605 2,961 3,261 3,482
(Continued)
V-13
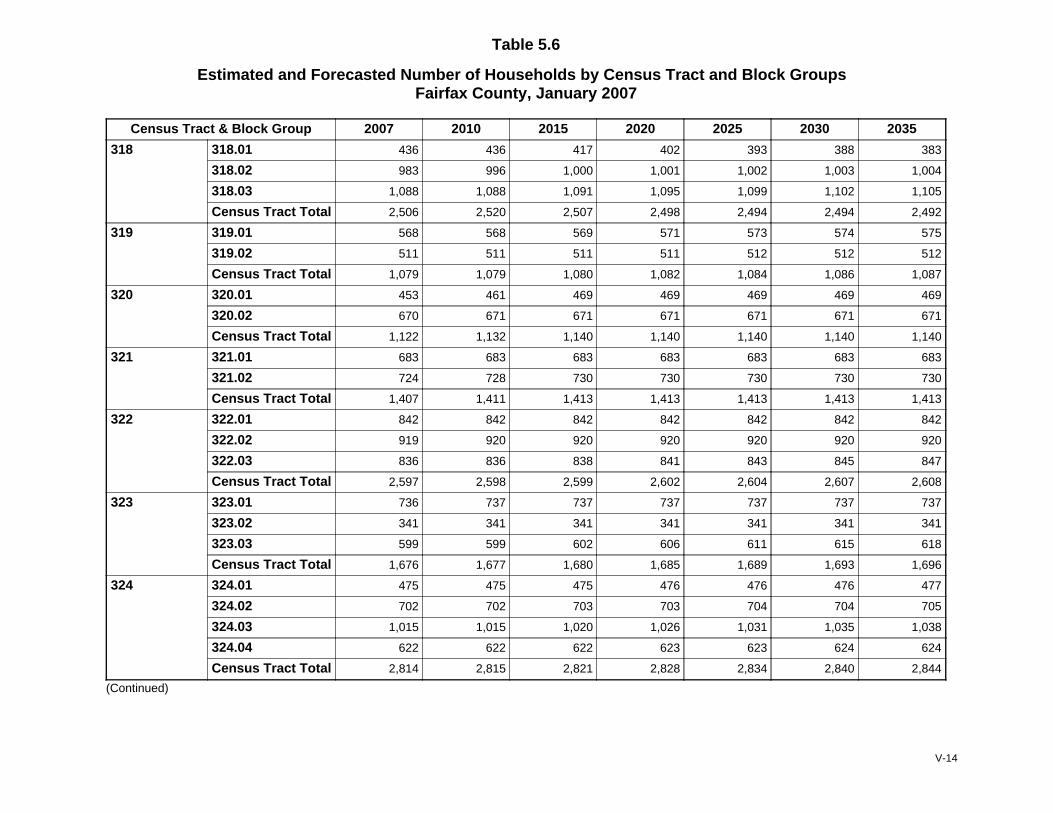
Table 5.6
Estimated and Forecasted Number of Households by Census Tract and Block GroupsFairfax County, January 2007
Census Tract & Block Group 2007 2010 2015 2020 2025 2030 2035
318 318.01 436 436 417 402 393 388 383
318.02 983 996 1,000 1,001 1,002 1,003 1,004
318.03 1,088 1,088 1,091 1,095 1,099 1,102 1,105
Census Tract Total 2,506 2,520 2,507 2,498 2,494 2,494 2,492
319 319.01 568 568 569 571 573 574 575
319.02 511 511 511 511 512 512 512
Census Tract Total 1,079 1,079 1,080 1,082 1,084 1,086 1,087
320 320.01 453 461 469 469 469 469 469
320.02 670 671 671 671 671 671 671
Census Tract Total 1,122 1,132 1,140 1,140 1,140 1,140 1,140
321 321.01 683 683 683 683 683 683 683
321.02 724 728 730 730 730 730 730
Census Tract Total 1,407 1,411 1,413 1,413 1,413 1,413 1,413
322 322.01 842 842 842 842 842 842 842
322.02 919 920 920 920 920 920 920
322.03 836 836 838 841 843 845 847
Census Tract Total 2,597 2,598 2,599 2,602 2,604 2,607 2,608
323 323.01 736 737 737 737 737 737 737
323.02 341 341 341 341 341 341 341
323.03 599 599 602 606 611 615 618
Census Tract Total 1,676 1,677 1,680 1,685 1,689 1,693 1,696
324 324.01 475 475 475 476 476 476 477
324.02 702 702 703 703 704 704 705
324.03 1,015 1,015 1,020 1,026 1,031 1,035 1,038
324.04 622 622 622 623 623 624 624
Census Tract Total 2,814 2,815 2,821 2,828 2,834 2,840 2,844
(Continued)
V-14
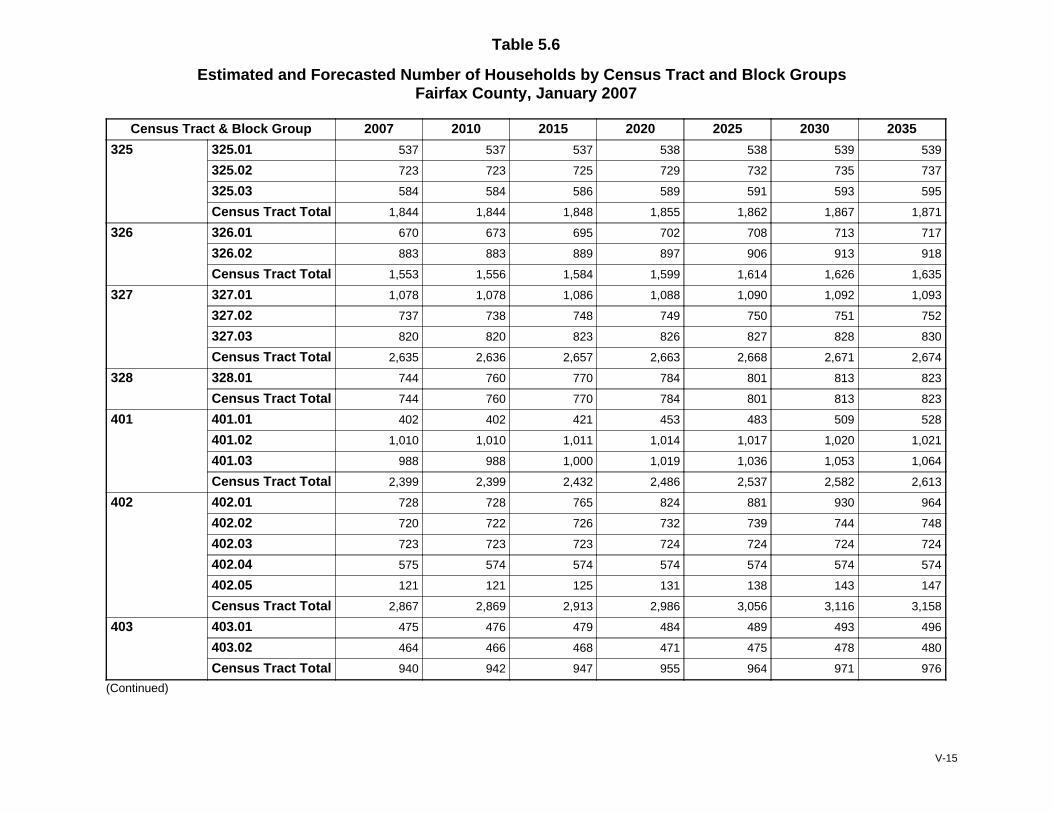
Table 5.6
Estimated and Forecasted Number of Households by Census Tract and Block GroupsFairfax County, January 2007
Census Tract & Block Group 2007 2010 2015 2020 2025 2030 2035
325 325.01 537 537 537 538 538 539 539
325.02 723 723 725 729 732 735 737
325.03 584 584 586 589 591 593 595
Census Tract Total 1,844 1,844 1,848 1,855 1,862 1,867 1,871
326 326.01 670 673 695 702 708 713 717
326.02 883 883 889 897 906 913 918
Census Tract Total 1,553 1,556 1,584 1,599 1,614 1,626 1,635
327 327.01 1,078 1,078 1,086 1,088 1,090 1,092 1,093
327.02 737 738 748 749 750 751 752
327.03 820 820 823 826 827 828 830
Census Tract Total 2,635 2,636 2,657 2,663 2,668 2,671 2,674
328 328.01 744 760 770 784 801 813 823
Census Tract Total 744 760 770 784 801 813 823
401 401.01 402 402 421 453 483 509 528
401.02 1,010 1,010 1,011 1,014 1,017 1,020 1,021
401.03 988 988 1,000 1,019 1,036 1,053 1,064
Census Tract Total 2,399 2,399 2,432 2,486 2,537 2,582 2,613
402 402.01 728 728 765 824 881 930 964
402.02 720 722 726 732 739 744 748
402.03 723 723 723 724 724 724 724
402.04 575 574 574 574 574 574 574
402.05 121 121 125 131 138 143 147
Census Tract Total 2,867 2,869 2,913 2,986 3,056 3,116 3,158
403 403.01 475 476 479 484 489 493 496
403.02 464 466 468 471 475 478 480
Census Tract Total 940 942 947 955 964 971 976
(Continued)
V-15
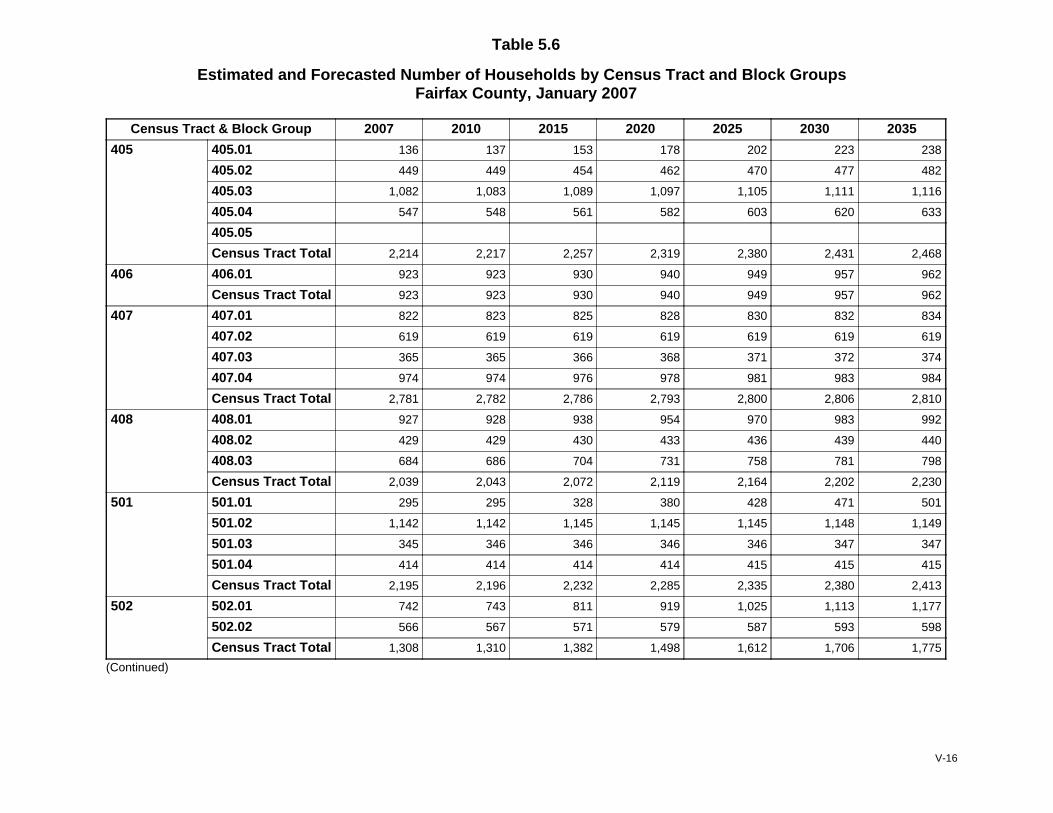
Table 5.6
Estimated and Forecasted Number of Households by Census Tract and Block GroupsFairfax County, January 2007
Census Tract & Block Group 2007 2010 2015 2020 2025 2030 2035
405 405.01 136 137 153 178 202 223 238
405.02 449 449 454 462 470 477 482
405.03 1,082 1,083 1,089 1,097 1,105 1,111 1,116
405.04 547 548 561 582 603 620 633
405.05
Census Tract Total 2,214 2,217 2,257 2,319 2,380 2,431 2,468
406 406.01 923 923 930 940 949 957 962
Census Tract Total 923 923 930 940 949 957 962
407 407.01 822 823 825 828 830 832 834
407.02 619 619 619 619 619 619 619
407.03 365 365 366 368 371 372 374
407.04 974 974 976 978 981 983 984
Census Tract Total 2,781 2,782 2,786 2,793 2,800 2,806 2,810
408 408.01 927 928 938 954 970 983 992
408.02 429 429 430 433 436 439 440
408.03 684 686 704 731 758 781 798
Census Tract Total 2,039 2,043 2,072 2,119 2,164 2,202 2,230
501 501.01 295 295 328 380 428 471 501
501.02 1,142 1,142 1,145 1,145 1,145 1,148 1,149
501.03 345 346 346 346 346 347 347
501.04 414 414 414 414 415 415 415
Census Tract Total 2,195 2,196 2,232 2,285 2,335 2,380 2,413
502 502.01 742 743 811 919 1,025 1,113 1,177
502.02 566 567 571 579 587 593 598
Census Tract Total 1,308 1,310 1,382 1,498 1,612 1,706 1,775
(Continued)
V-16
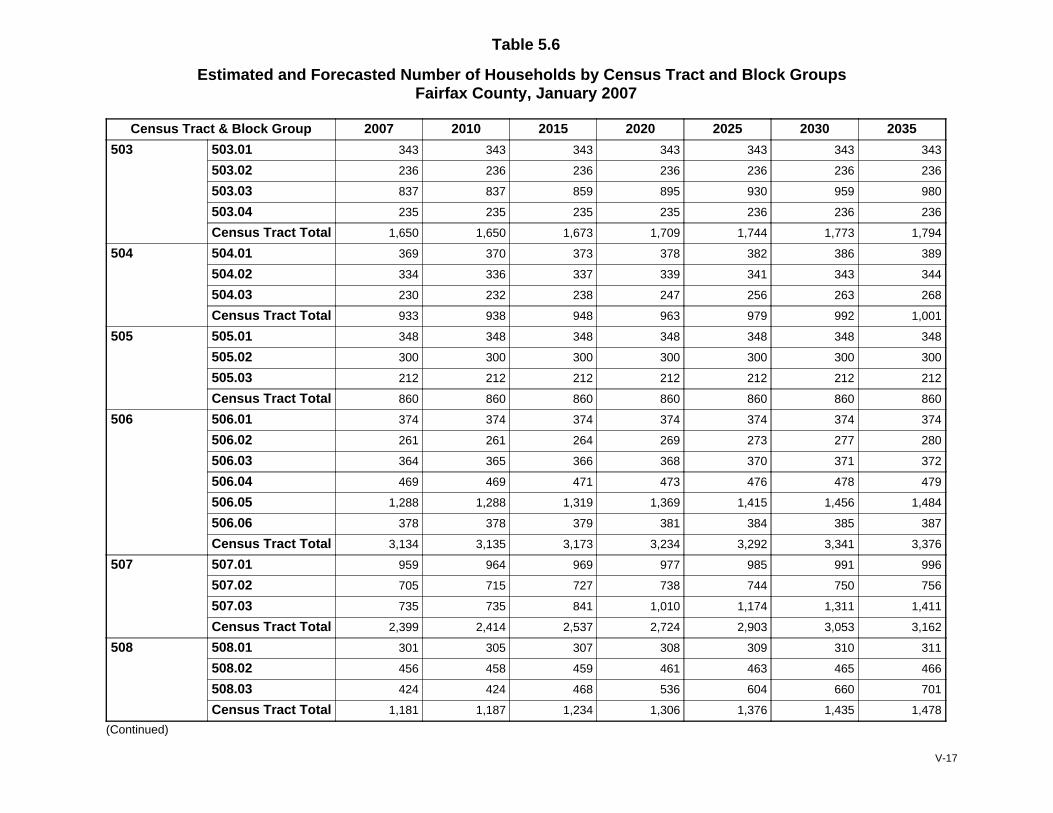
Table 5.6
Estimated and Forecasted Number of Households by Census Tract and Block GroupsFairfax County, January 2007
Census Tract & Block Group 2007 2010 2015 2020 2025 2030 2035
503 503.01 343 343 343 343 343 343 343
503.02 236 236 236 236 236 236 236
503.03 837 837 859 895 930 959 980
503.04 235 235 235 235 236 236 236
Census Tract Total 1,650 1,650 1,673 1,709 1,744 1,773 1,794
504 504.01 369 370 373 378 382 386 389
504.02 334 336 337 339 341 343 344
504.03 230 232 238 247 256 263 268
Census Tract Total 933 938 948 963 979 992 1,001
505 505.01 348 348 348 348 348 348 348
505.02 300 300 300 300 300 300 300
505.03 212 212 212 212 212 212 212
Census Tract Total 860 860 860 860 860 860 860
506 506.01 374 374 374 374 374 374 374
506.02 261 261 264 269 273 277 280
506.03 364 365 366 368 370 371 372
506.04 469 469 471 473 476 478 479
506.05 1,288 1,288 1,319 1,369 1,415 1,456 1,484
506.06 378 378 379 381 384 385 387
Census Tract Total 3,134 3,135 3,173 3,234 3,292 3,341 3,376
507 507.01 959 964 969 977 985 991 996
507.02 705 715 727 738 744 750 756
507.03 735 735 841 1,010 1,174 1,311 1,411
Census Tract Total 2,399 2,414 2,537 2,724 2,903 3,053 3,162
508 508.01 301 305 307 308 309 310 311
508.02 456 458 459 461 463 465 466
508.03 424 424 468 536 604 660 701
Census Tract Total 1,181 1,187 1,234 1,306 1,376 1,435 1,478
(Continued)
V-17
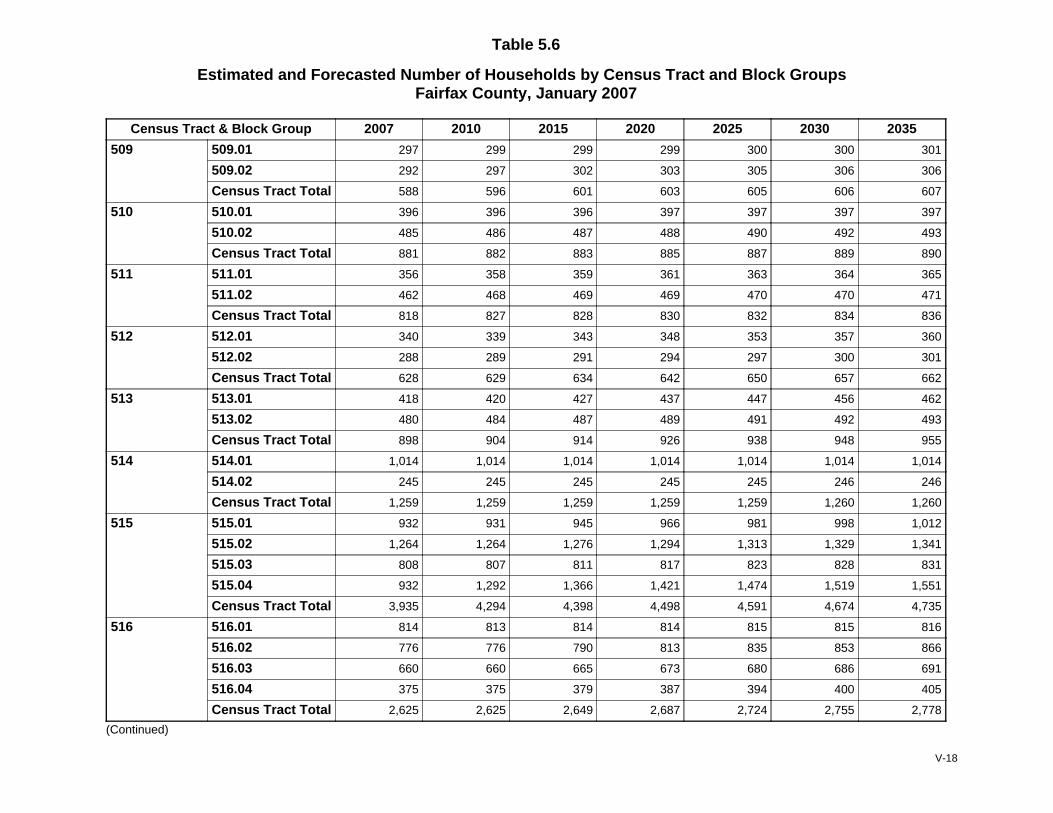
Table 5.6
Estimated and Forecasted Number of Households by Census Tract and Block GroupsFairfax County, January 2007
Census Tract & Block Group 2007 2010 2015 2020 2025 2030 2035
509 509.01 297 299 299 299 300 300 301
509.02 292 297 302 303 305 306 306
Census Tract Total 588 596 601 603 605 606 607
510 510.01 396 396 396 397 397 397 397
510.02 485 486 487 488 490 492 493
Census Tract Total 881 882 883 885 887 889 890
511 511.01 356 358 359 361 363 364 365
511.02 462 468 469 469 470 470 471
Census Tract Total 818 827 828 830 832 834 836
512 512.01 340 339 343 348 353 357 360
512.02 288 289 291 294 297 300 301
Census Tract Total 628 629 634 642 650 657 662
513 513.01 418 420 427 437 447 456 462
513.02 480 484 487 489 491 492 493
Census Tract Total 898 904 914 926 938 948 955
514 514.01 1,014 1,014 1,014 1,014 1,014 1,014 1,014
514.02 245 245 245 245 245 246 246
Census Tract Total 1,259 1,259 1,259 1,259 1,259 1,260 1,260
515 515.01 932 931 945 966 981 998 1,012
515.02 1,264 1,264 1,276 1,294 1,313 1,329 1,341
515.03 808 807 811 817 823 828 831
515.04 932 1,292 1,366 1,421 1,474 1,519 1,551
Census Tract Total 3,935 4,294 4,398 4,498 4,591 4,674 4,735
516 516.01 814 813 814 814 815 815 816
516.02 776 776 790 813 835 853 866
516.03 660 660 665 673 680 686 691
516.04 375 375 379 387 394 400 405
Census Tract Total 2,625 2,625 2,649 2,687 2,724 2,755 2,778
(Continued)
V-18
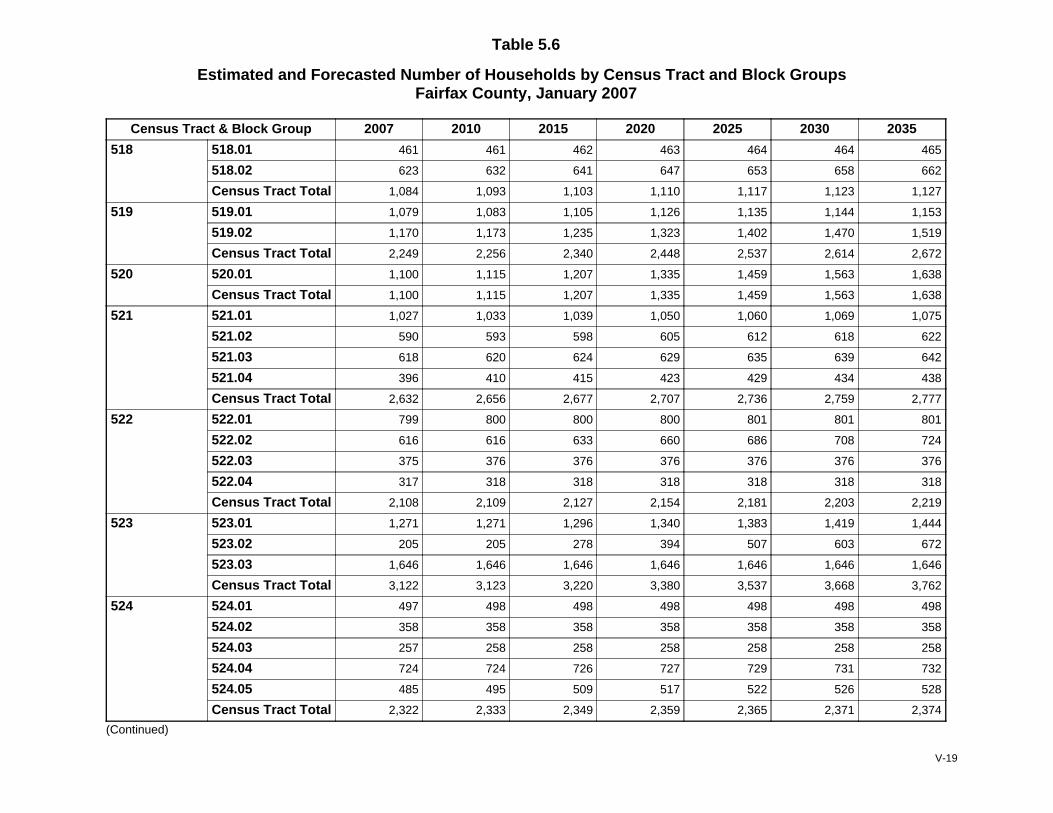
Table 5.6
Estimated and Forecasted Number of Households by Census Tract and Block GroupsFairfax County, January 2007
Census Tract & Block Group 2007 2010 2015 2020 2025 2030 2035
518 518.01 461 461 462 463 464 464 465
518.02 623 632 641 647 653 658 662
Census Tract Total 1,084 1,093 1,103 1,110 1,117 1,123 1,127
519 519.01 1,079 1,083 1,105 1,126 1,135 1,144 1,153
519.02 1,170 1,173 1,235 1,323 1,402 1,470 1,519
Census Tract Total 2,249 2,256 2,340 2,448 2,537 2,614 2,672
520 520.01 1,100 1,115 1,207 1,335 1,459 1,563 1,638
Census Tract Total 1,100 1,115 1,207 1,335 1,459 1,563 1,638
521 521.01 1,027 1,033 1,039 1,050 1,060 1,069 1,075
521.02 590 593 598 605 612 618 622
521.03 618 620 624 629 635 639 642
521.04 396 410 415 423 429 434 438
Census Tract Total 2,632 2,656 2,677 2,707 2,736 2,759 2,777
522 522.01 799 800 800 800 801 801 801
522.02 616 616 633 660 686 708 724
522.03 375 376 376 376 376 376 376
522.04 317 318 318 318 318 318 318
Census Tract Total 2,108 2,109 2,127 2,154 2,181 2,203 2,219
523 523.01 1,271 1,271 1,296 1,340 1,383 1,419 1,444
523.02 205 205 278 394 507 603 672
523.03 1,646 1,646 1,646 1,646 1,646 1,646 1,646
Census Tract Total 3,122 3,123 3,220 3,380 3,537 3,668 3,762
524 524.01 497 498 498 498 498 498 498
524.02 358 358 358 358 358 358 358
524.03 257 258 258 258 258 258 258
524.04 724 724 726 727 729 731 732
524.05 485 495 509 517 522 526 528
Census Tract Total 2,322 2,333 2,349 2,359 2,365 2,371 2,374
(Continued)
V-19

Table 5.6
Estimated and Forecasted Number of Households by Census Tract and Block GroupsFairfax County, January 2007
Census Tract & Block Group 2007 2010 2015 2020 2025 2030 2035
525 525.01 284 284 296 315 334 350 361
525.02 648 653 673 709 744 771 793
525.03 347 349 350 351 353 354 354
525.04 1,336 1,342 1,343 1,345 1,346 1,347 1,348
525.05 212 212 214 218 222 225 228
Census Tract Total 2,827 2,840 2,876 2,939 2,999 3,047 3,085
526 526.01 761 849 896 936 952 967 983
526.02 884 884 884 884 884 884 884
526.03 286 286 300 321 342 359 372
Census Tract Total 1,931 2,019 2,079 2,141 2,178 2,210 2,239
527 527.01 627 476 534 627 718 794 849
527.02 1,217 1,218 1,242 1,281 1,318 1,349 1,372
Census Tract Total 1,844 1,693 1,776 1,908 2,036 2,143 2,221
528 528.01 440 447 452 459 465 471 475
528.02 938 938 938 938 938 938 938
528.03 1,440 1,440 1,440 1,440 1,440 1,440 1,440
528.04 1,029 1,029 1,029 1,029 1,029 1,029 1,029
Census Tract Total 3,847 3,853 3,858 3,865 3,872 3,877 3,881
601 601.01 388 392 419 428 437 445 450
601.02 631 631 637 647 657 665 671
601.03 371 371 384 403 423 439 450
Census Tract Total 1,390 1,393 1,440 1,479 1,517 1,549 1,572
602 602.01 657 660 661 662 662 663 664
602.02 634 634 635 636 638 639 640
Census Tract Total 1,291 1,294 1,295 1,298 1,300 1,302 1,303
603 603.01 263 265 288 306 314 320 329
603.02 682 681 751 793 815 829 851
Census Tract Total 945 946 1,039 1,099 1,130 1,149 1,180
(Continued)
V-20
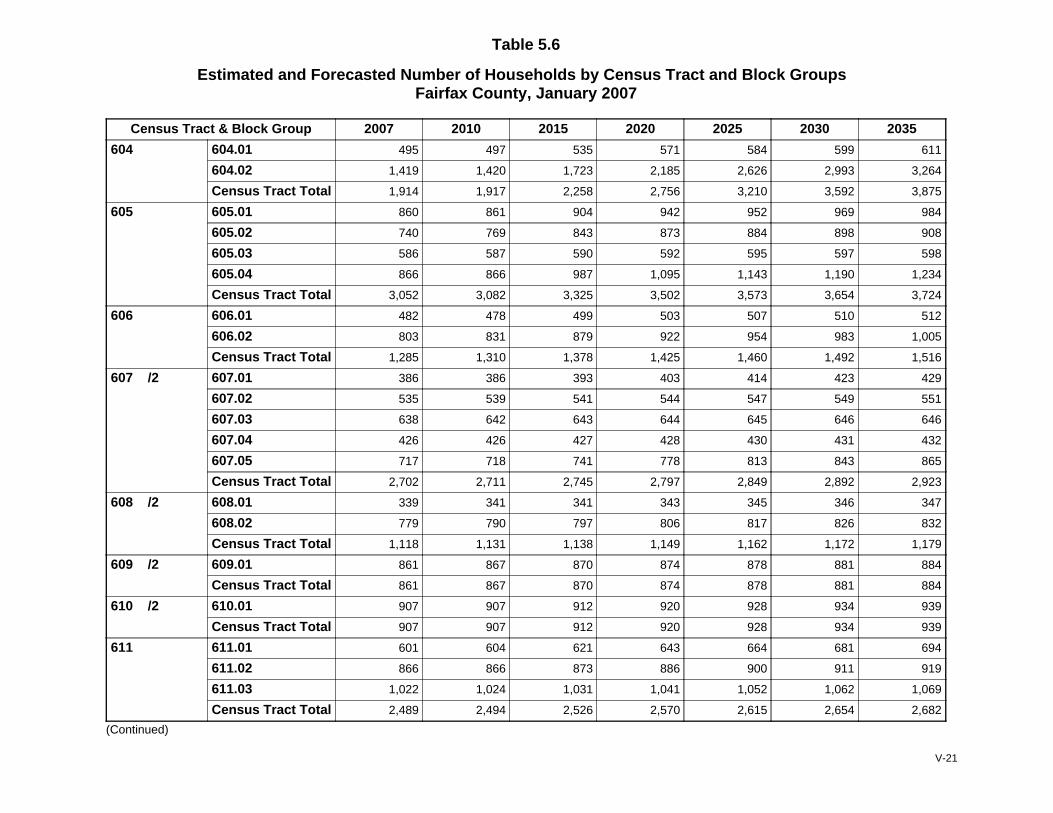
Table 5.6
Estimated and Forecasted Number of Households by Census Tract and Block GroupsFairfax County, January 2007
Census Tract & Block Group 2007 2010 2015 2020 2025 2030 2035
604 604.01 495 497 535 571 584 599 611
604.02 1,419 1,420 1,723 2,185 2,626 2,993 3,264
Census Tract Total 1,914 1,917 2,258 2,756 3,210 3,592 3,875
605 605.01 860 861 904 942 952 969 984
605.02 740 769 843 873 884 898 908
605.03 586 587 590 592 595 597 598
605.04 866 866 987 1,095 1,143 1,190 1,234
Census Tract Total 3,052 3,082 3,325 3,502 3,573 3,654 3,724
606 606.01 482 478 499 503 507 510 512
606.02 803 831 879 922 954 983 1,005
Census Tract Total 1,285 1,310 1,378 1,425 1,460 1,492 1,516
607 /2 607.01 386 386 393 403 414 423 429
607.02 535 539 541 544 547 549 551
607.03 638 642 643 644 645 646 646
607.04 426 426 427 428 430 431 432
607.05 717 718 741 778 813 843 865
Census Tract Total 2,702 2,711 2,745 2,797 2,849 2,892 2,923
608 /2 608.01 339 341 341 343 345 346 347
608.02 779 790 797 806 817 826 832
Census Tract Total 1,118 1,131 1,138 1,149 1,162 1,172 1,179
609 /2 609.01 861 867 870 874 878 881 884
Census Tract Total 861 867 870 874 878 881 884
610 /2 610.01 907 907 912 920 928 934 939
Census Tract Total 907 907 912 920 928 934 939
611 611.01 601 604 621 643 664 681 694
611.02 866 866 873 886 900 911 919
611.03 1,022 1,024 1,031 1,041 1,052 1,062 1,069
Census Tract Total 2,489 2,494 2,526 2,570 2,615 2,654 2,682
(Continued)
V-21
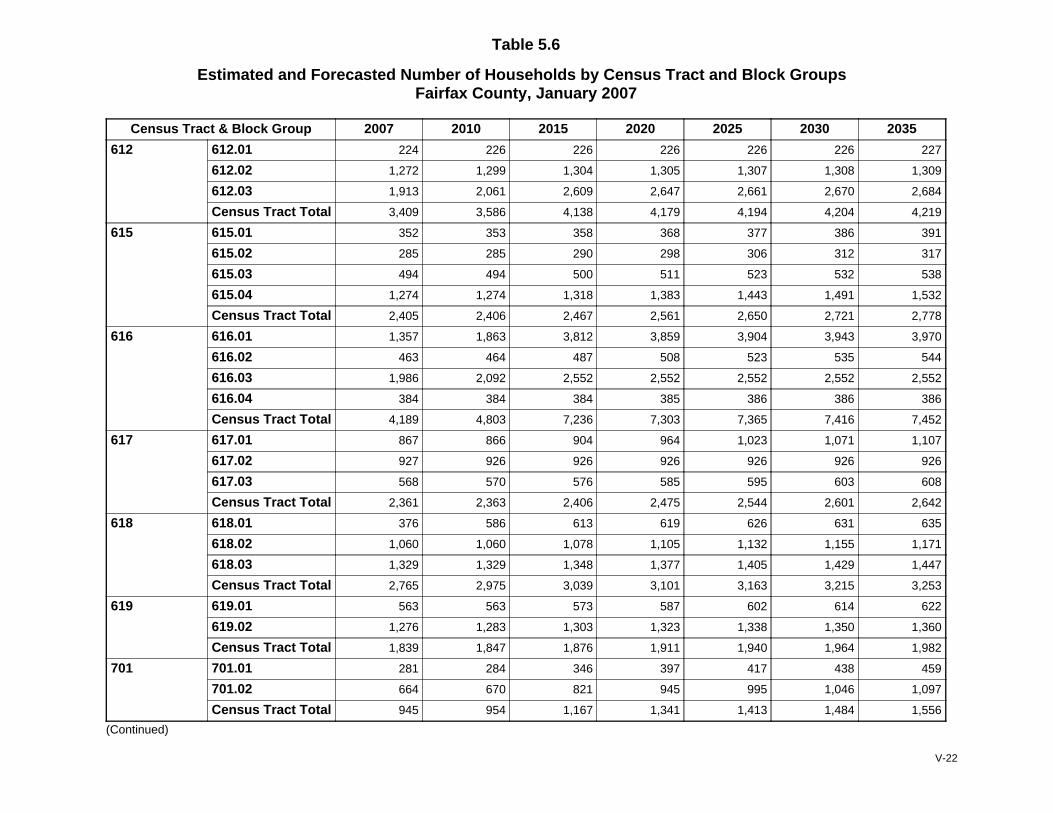
Table 5.6
Estimated and Forecasted Number of Households by Census Tract and Block GroupsFairfax County, January 2007
Census Tract & Block Group 2007 2010 2015 2020 2025 2030 2035
612 612.01 224 226 226 226 226 226 227
612.02 1,272 1,299 1,304 1,305 1,307 1,308 1,309
612.03 1,913 2,061 2,609 2,647 2,661 2,670 2,684
Census Tract Total 3,409 3,586 4,138 4,179 4,194 4,204 4,219
615 615.01 352 353 358 368 377 386 391
615.02 285 285 290 298 306 312 317
615.03 494 494 500 511 523 532 538
615.04 1,274 1,274 1,318 1,383 1,443 1,491 1,532
Census Tract Total 2,405 2,406 2,467 2,561 2,650 2,721 2,778
616 616.01 1,357 1,863 3,812 3,859 3,904 3,943 3,970
616.02 463 464 487 508 523 535 544
616.03 1,986 2,092 2,552 2,552 2,552 2,552 2,552
616.04 384 384 384 385 386 386 386
Census Tract Total 4,189 4,803 7,236 7,303 7,365 7,416 7,452
617 617.01 867 866 904 964 1,023 1,071 1,107
617.02 927 926 926 926 926 926 926
617.03 568 570 576 585 595 603 608
Census Tract Total 2,361 2,363 2,406 2,475 2,544 2,601 2,642
618 618.01 376 586 613 619 626 631 635
618.02 1,060 1,060 1,078 1,105 1,132 1,155 1,171
618.03 1,329 1,329 1,348 1,377 1,405 1,429 1,447
Census Tract Total 2,765 2,975 3,039 3,101 3,163 3,215 3,253
619 619.01 563 563 573 587 602 614 622
619.02 1,276 1,283 1,303 1,323 1,338 1,350 1,360
Census Tract Total 1,839 1,847 1,876 1,911 1,940 1,964 1,982
701 701.01 281 284 346 397 417 438 459
701.02 664 670 821 945 995 1,046 1,097
Census Tract Total 945 954 1,167 1,341 1,413 1,484 1,556
(Continued)
V-22
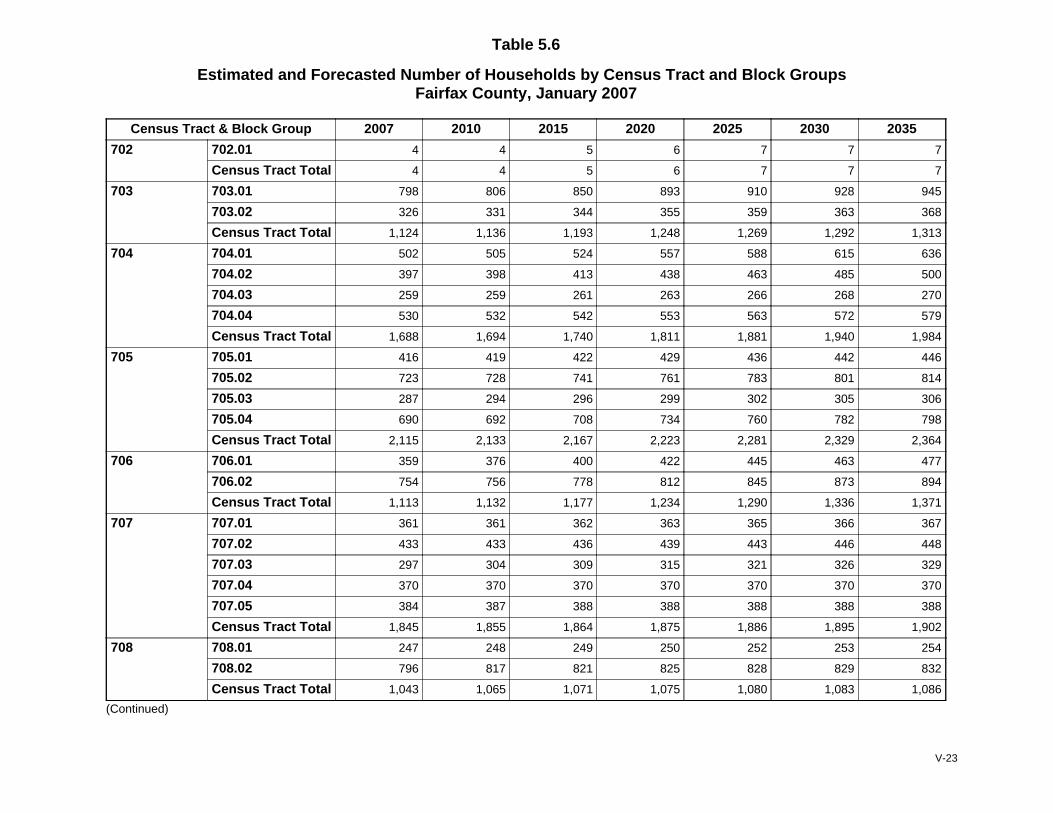
Table 5.6
Estimated and Forecasted Number of Households by Census Tract and Block GroupsFairfax County, January 2007
Census Tract & Block Group 2007 2010 2015 2020 2025 2030 2035
702 702.01 4 4 5 6 7 7 7
Census Tract Total 4 4 5 6 7 7 7
703 703.01 798 806 850 893 910 928 945
703.02 326 331 344 355 359 363 368
Census Tract Total 1,124 1,136 1,193 1,248 1,269 1,292 1,313
704 704.01 502 505 524 557 588 615 636
704.02 397 398 413 438 463 485 500
704.03 259 259 261 263 266 268 270
704.04 530 532 542 553 563 572 579
Census Tract Total 1,688 1,694 1,740 1,811 1,881 1,940 1,984
705 705.01 416 419 422 429 436 442 446
705.02 723 728 741 761 783 801 814
705.03 287 294 296 299 302 305 306
705.04 690 692 708 734 760 782 798
Census Tract Total 2,115 2,133 2,167 2,223 2,281 2,329 2,364
706 706.01 359 376 400 422 445 463 477
706.02 754 756 778 812 845 873 894
Census Tract Total 1,113 1,132 1,177 1,234 1,290 1,336 1,371
707 707.01 361 361 362 363 365 366 367
707.02 433 433 436 439 443 446 448
707.03 297 304 309 315 321 326 329
707.04 370 370 370 370 370 370 370
707.05 384 387 388 388 388 388 388
Census Tract Total 1,845 1,855 1,864 1,875 1,886 1,895 1,902
708 708.01 247 248 249 250 252 253 254
708.02 796 817 821 825 828 829 832
Census Tract Total 1,043 1,065 1,071 1,075 1,080 1,083 1,086
(Continued)
V-23

Table 5.6
Estimated and Forecasted Number of Households by Census Tract and Block GroupsFairfax County, January 2007
Census Tract & Block Group 2007 2010 2015 2020 2025 2030 2035
709 709.01 827 840 841 841 842 842 843
709.02 749 755 759 766 772 778 782
709.03 227 230 230 231 231 232 232
709.04 367 480 501 508 512 514 517
709.05 417 425 433 444 454 463 469
Census Tract Total 2,587 2,730 2,764 2,789 2,811 2,829 2,842
710 710.01 814 819 1,024 1,334 1,626 1,871 2,050
Census Tract Total 814 819 1,024 1,334 1,626 1,871 2,050
711 711.01 356 360 360 360 360 360 360
711.02 560 565 566 568 570 571 572
711.03 261 261 261 261 261 261 261
711.04 625 626 637 653 670 683 693
711.05 574 575 581 588 595 601 605
Census Tract Total 2,376 2,388 2,405 2,430 2,455 2,476 2,491
712 712.01 226 228 229 229 229 230 230
712.02 566 566 566 566 566 566 566
712.03 1,276 1,276 1,430 1,677 1,917 2,118 2,263
712.04 1,441 1,441 1,493 1,573 1,653 1,721 1,768
Census Tract Total 3,508 3,512 3,718 4,045 4,365 4,635 4,827
713 713.01 1,582 1,583 1,594 1,595 1,595 1,595 1,596
713.02 701 701 730 778 824 863 890
713.03 992 992 999 1,006 1,014 1,020 1,025
713.04 629 645 672 703 732 758 776
Census Tract Total 3,903 3,922 3,994 4,082 4,165 4,236 4,287
714 714.01 480 482 485 490 496 500 504
714.02 1,195 1,198 1,218 1,248 1,277 1,301 1,318
714.03 871 872 872 872 872 872 872
Census Tract Total 2,546 2,552 2,575 2,610 2,645 2,674 2,695
(Continued)
V-24
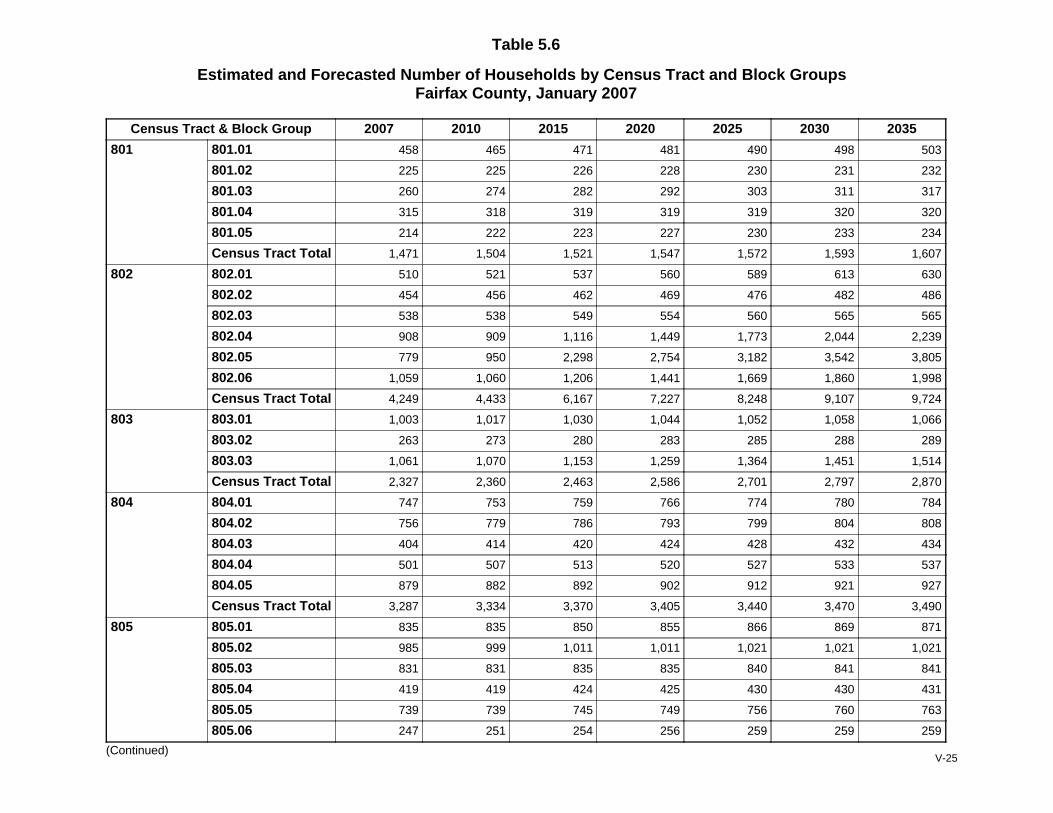
Table 5.6
Estimated and Forecasted Number of Households by Census Tract and Block GroupsFairfax County, January 2007
Census Tract & Block Group 2007 2010 2015 2020 2025 2030 2035
801 801.01 458 465 471 481 490 498 503
801.02 225 225 226 228 230 231 232
801.03 260 274 282 292 303 311 317
801.04 315 318 319 319 319 320 320
801.05 214 222 223 227 230 233 234
Census Tract Total 1,471 1,504 1,521 1,547 1,572 1,593 1,607
802 802.01 510 521 537 560 589 613 630
802.02 454 456 462 469 476 482 486
802.03 538 538 549 554 560 565 565
802.04 908 909 1,116 1,449 1,773 2,044 2,239
802.05 779 950 2,298 2,754 3,182 3,542 3,805
802.06 1,059 1,060 1,206 1,441 1,669 1,860 1,998
Census Tract Total 4,249 4,433 6,167 7,227 8,248 9,107 9,724
803 803.01 1,003 1,017 1,030 1,044 1,052 1,058 1,066
803.02 263 273 280 283 285 288 289
803.03 1,061 1,070 1,153 1,259 1,364 1,451 1,514
Census Tract Total 2,327 2,360 2,463 2,586 2,701 2,797 2,870
804 804.01 747 753 759 766 774 780 784
804.02 756 779 786 793 799 804 808
804.03 404 414 420 424 428 432 434
804.04 501 507 513 520 527 533 537
804.05 879 882 892 902 912 921 927
Census Tract Total 3,287 3,334 3,370 3,405 3,440 3,470 3,490
805 805.01 835 835 850 855 866 869 871
805.02 985 999 1,011 1,011 1,021 1,021 1,021
805.03 831 831 835 835 840 841 841
805.04 419 419 424 425 430 430 431
805.05 739 739 745 749 756 760 763
805.06 247 251 254 256 259 259 259
(Continued)V-25

Table 5.6
Estimated and Forecasted Number of Households by Census Tract and Block GroupsFairfax County, January 2007
Census Tract & Block Group 2007 2010 2015 2020 2025 2030 2035
805.07 780 781 782 784 785 785 785805
805.08 1,568 1,568 1,568 1,568 1,568 1,568 1,568
Census Tract Total 6,404 6,422 6,468 6,483 6,525 6,533 6,539
808 /3 808.01 457 457 458 459 461 462 463
808.02 218 222 227 231 234 236 238
808.03 294 294 296 299 303 305 308
808.04 323 323 323 323 323 324 324
808.05 493 511 604 618 632 644 652
808.06 535 542 555 564 573 580 585
808.07 438 438 458 490 521 547 566
Census Tract Total 2,758 2,788 2,921 2,984 3,047 3,098 3,136
809 /3 809.01 308 309 309 309 310 310 311
809.02 338 339 346 356 366 375 381
809.03 577 622 680 724 770 808 835
809.04 220 220 221 222 223 224 225
809.05 699 699 699 699 699 699 699
809.06 558 558 558 558 558 559 559
809.07 492 497 500 503 504 505 506
809.08 247 247 247 247 247 247 247
809.09 1,217 1,217 1,217 1,217 1,219 1,220 1,220
Census Tract Total 4,657 4,708 4,777 4,836 4,897 4,948 4,984
810 810.01 1,857 1,857 1,978 2,171 2,360 2,519 2,633
Census Tract Total 1,857 1,857 1,978 2,171 2,360 2,519 2,633
811 811.01 3,341 3,771 4,135 4,270 4,402 4,516 4,596
811.02 1,951 1,952 1,988 2,048 2,107 2,162 2,198
811.03 980 980 982 985 988 991 993
811.04 296 296 296 296 296 296 296
811.05 654 654 654 654 654 654 654
811.06 828 828 859 859 859 859 859
(Continued)V-26
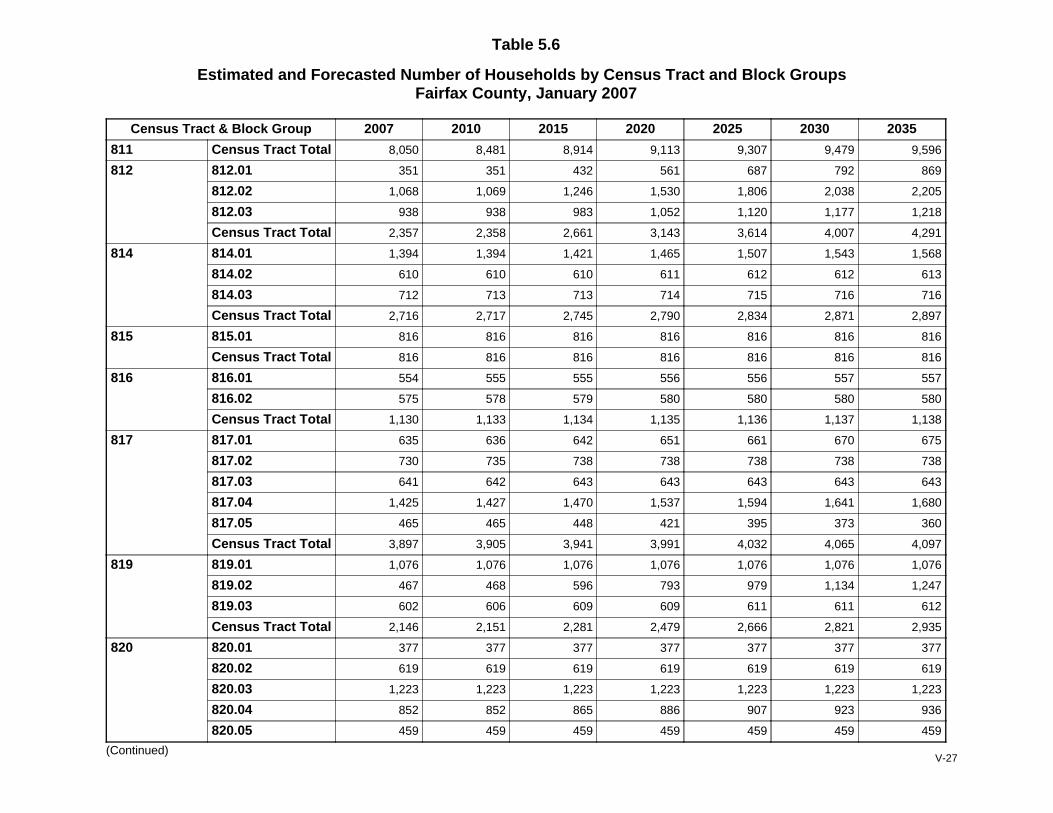
Table 5.6
Estimated and Forecasted Number of Households by Census Tract and Block GroupsFairfax County, January 2007
Census Tract & Block Group 2007 2010 2015 2020 2025 2030 2035
Census Tract Total 8,050 8,481 8,914 9,113 9,307 9,479 9,596811
812 812.01 351 351 432 561 687 792 869
812.02 1,068 1,069 1,246 1,530 1,806 2,038 2,205
812.03 938 938 983 1,052 1,120 1,177 1,218
Census Tract Total 2,357 2,358 2,661 3,143 3,614 4,007 4,291
814 814.01 1,394 1,394 1,421 1,465 1,507 1,543 1,568
814.02 610 610 610 611 612 612 613
814.03 712 713 713 714 715 716 716
Census Tract Total 2,716 2,717 2,745 2,790 2,834 2,871 2,897
815 815.01 816 816 816 816 816 816 816
Census Tract Total 816 816 816 816 816 816 816
816 816.01 554 555 555 556 556 557 557
816.02 575 578 579 580 580 580 580
Census Tract Total 1,130 1,133 1,134 1,135 1,136 1,137 1,138
817 817.01 635 636 642 651 661 670 675
817.02 730 735 738 738 738 738 738
817.03 641 642 643 643 643 643 643
817.04 1,425 1,427 1,470 1,537 1,594 1,641 1,680
817.05 465 465 448 421 395 373 360
Census Tract Total 3,897 3,905 3,941 3,991 4,032 4,065 4,097
819 819.01 1,076 1,076 1,076 1,076 1,076 1,076 1,076
819.02 467 468 596 793 979 1,134 1,247
819.03 602 606 609 609 611 611 612
Census Tract Total 2,146 2,151 2,281 2,479 2,666 2,821 2,935
820 820.01 377 377 377 377 377 377 377
820.02 619 619 619 619 619 619 619
820.03 1,223 1,223 1,223 1,223 1,223 1,223 1,223
820.04 852 852 865 886 907 923 936
820.05 459 459 459 459 459 459 459
(Continued)V-27
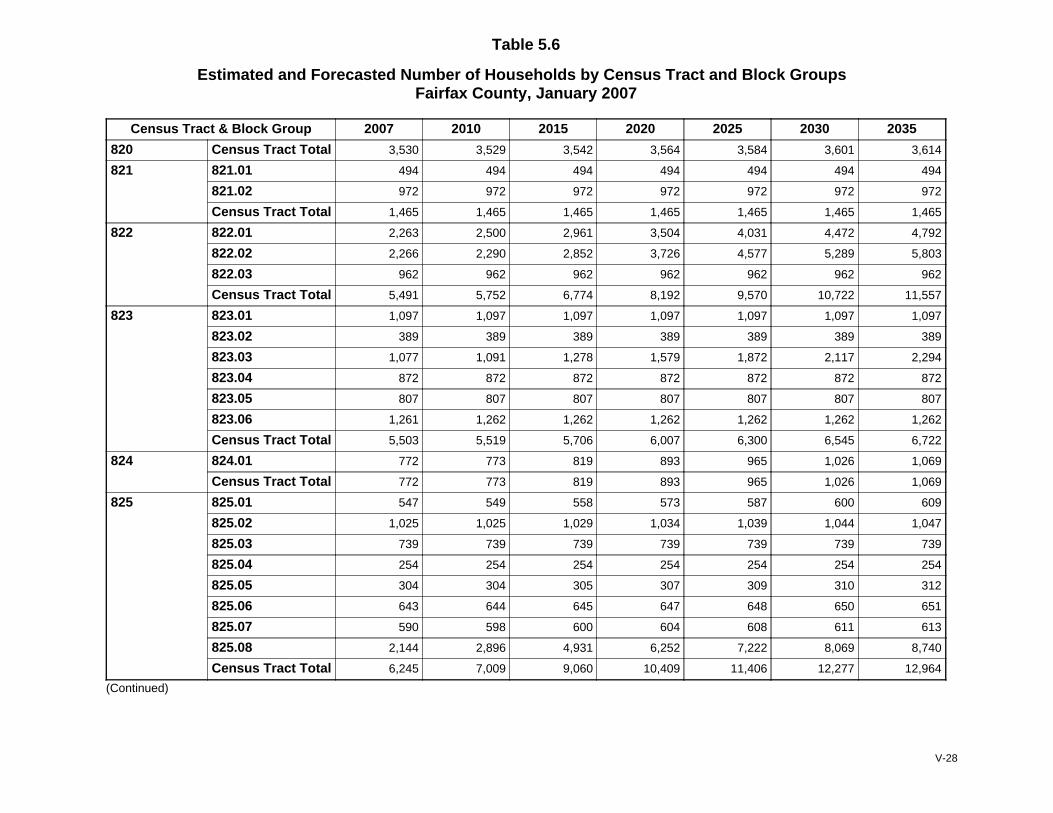
Table 5.6
Estimated and Forecasted Number of Households by Census Tract and Block GroupsFairfax County, January 2007
Census Tract & Block Group 2007 2010 2015 2020 2025 2030 2035
Census Tract Total 3,530 3,529 3,542 3,564 3,584 3,601 3,614820
821 821.01 494 494 494 494 494 494 494
821.02 972 972 972 972 972 972 972
Census Tract Total 1,465 1,465 1,465 1,465 1,465 1,465 1,465
822 822.01 2,263 2,500 2,961 3,504 4,031 4,472 4,792
822.02 2,266 2,290 2,852 3,726 4,577 5,289 5,803
822.03 962 962 962 962 962 962 962
Census Tract Total 5,491 5,752 6,774 8,192 9,570 10,722 11,557
823 823.01 1,097 1,097 1,097 1,097 1,097 1,097 1,097
823.02 389 389 389 389 389 389 389
823.03 1,077 1,091 1,278 1,579 1,872 2,117 2,294
823.04 872 872 872 872 872 872 872
823.05 807 807 807 807 807 807 807
823.06 1,261 1,262 1,262 1,262 1,262 1,262 1,262
Census Tract Total 5,503 5,519 5,706 6,007 6,300 6,545 6,722
824 824.01 772 773 819 893 965 1,026 1,069
Census Tract Total 772 773 819 893 965 1,026 1,069
825 825.01 547 549 558 573 587 600 609
825.02 1,025 1,025 1,029 1,034 1,039 1,044 1,047
825.03 739 739 739 739 739 739 739
825.04 254 254 254 254 254 254 254
825.05 304 304 305 307 309 310 312
825.06 643 644 645 647 648 650 651
825.07 590 598 600 604 608 611 613
825.08 2,144 2,896 4,931 6,252 7,222 8,069 8,740
Census Tract Total 6,245 7,009 9,060 10,409 11,406 12,277 12,964
(Continued)
V-28
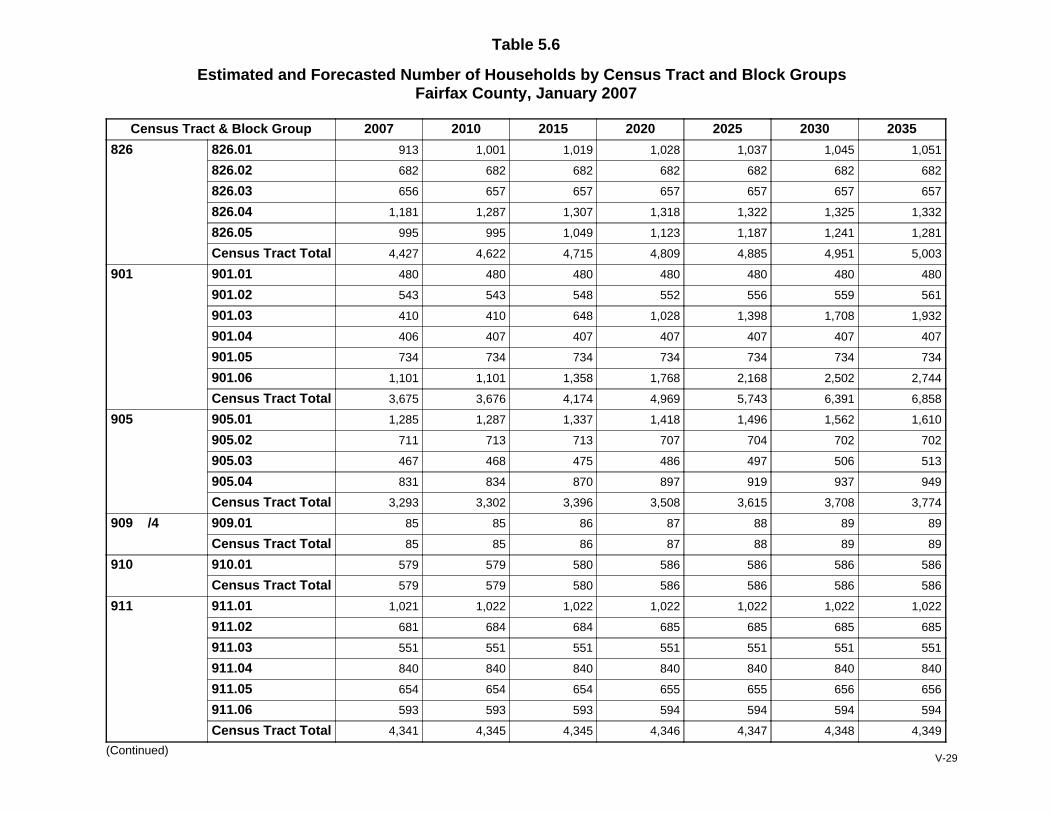
Table 5.6
Estimated and Forecasted Number of Households by Census Tract and Block GroupsFairfax County, January 2007
Census Tract & Block Group 2007 2010 2015 2020 2025 2030 2035
826 826.01 913 1,001 1,019 1,028 1,037 1,045 1,051
826.02 682 682 682 682 682 682 682
826.03 656 657 657 657 657 657 657
826.04 1,181 1,287 1,307 1,318 1,322 1,325 1,332
826.05 995 995 1,049 1,123 1,187 1,241 1,281
Census Tract Total 4,427 4,622 4,715 4,809 4,885 4,951 5,003
901 901.01 480 480 480 480 480 480 480
901.02 543 543 548 552 556 559 561
901.03 410 410 648 1,028 1,398 1,708 1,932
901.04 406 407 407 407 407 407 407
901.05 734 734 734 734 734 734 734
901.06 1,101 1,101 1,358 1,768 2,168 2,502 2,744
Census Tract Total 3,675 3,676 4,174 4,969 5,743 6,391 6,858
905 905.01 1,285 1,287 1,337 1,418 1,496 1,562 1,610
905.02 711 713 713 707 704 702 702
905.03 467 468 475 486 497 506 513
905.04 831 834 870 897 919 937 949
Census Tract Total 3,293 3,302 3,396 3,508 3,615 3,708 3,774
909 /4 909.01 85 85 86 87 88 89 89
Census Tract Total 85 85 86 87 88 89 89
910 910.01 579 579 580 586 586 586 586
Census Tract Total 579 579 580 586 586 586 586
911 911.01 1,021 1,022 1,022 1,022 1,022 1,022 1,022
911.02 681 684 684 685 685 685 685
911.03 551 551 551 551 551 551 551
911.04 840 840 840 840 840 840 840
911.05 654 654 654 655 655 656 656
911.06 593 593 593 594 594 594 594
Census Tract Total 4,341 4,345 4,345 4,346 4,347 4,348 4,349
(Continued)V-29
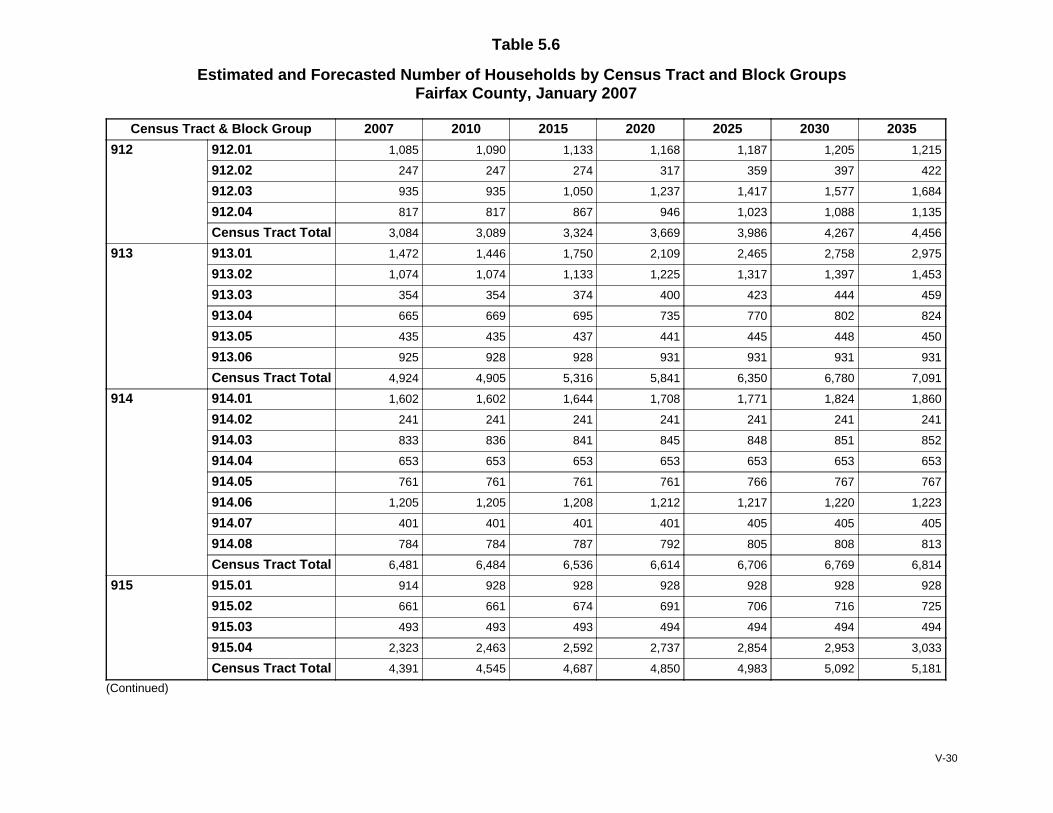
Table 5.6
Estimated and Forecasted Number of Households by Census Tract and Block GroupsFairfax County, January 2007
Census Tract & Block Group 2007 2010 2015 2020 2025 2030 2035
912 912.01 1,085 1,090 1,133 1,168 1,187 1,205 1,215
912.02 247 247 274 317 359 397 422
912.03 935 935 1,050 1,237 1,417 1,577 1,684
912.04 817 817 867 946 1,023 1,088 1,135
Census Tract Total 3,084 3,089 3,324 3,669 3,986 4,267 4,456
913 913.01 1,472 1,446 1,750 2,109 2,465 2,758 2,975
913.02 1,074 1,074 1,133 1,225 1,317 1,397 1,453
913.03 354 354 374 400 423 444 459
913.04 665 669 695 735 770 802 824
913.05 435 435 437 441 445 448 450
913.06 925 928 928 931 931 931 931
Census Tract Total 4,924 4,905 5,316 5,841 6,350 6,780 7,091
914 914.01 1,602 1,602 1,644 1,708 1,771 1,824 1,860
914.02 241 241 241 241 241 241 241
914.03 833 836 841 845 848 851 852
914.04 653 653 653 653 653 653 653
914.05 761 761 761 761 766 767 767
914.06 1,205 1,205 1,208 1,212 1,217 1,220 1,223
914.07 401 401 401 401 405 405 405
914.08 784 784 787 792 805 808 813
Census Tract Total 6,481 6,484 6,536 6,614 6,706 6,769 6,814
915 915.01 914 928 928 928 928 928 928
915.02 661 661 674 691 706 716 725
915.03 493 493 493 494 494 494 494
915.04 2,323 2,463 2,592 2,737 2,854 2,953 3,033
Census Tract Total 4,391 4,545 4,687 4,850 4,983 5,092 5,181
(Continued)
V-30

Table 5.6
Estimated and Forecasted Number of Households by Census Tract and Block GroupsFairfax County, January 2007
Census Tract & Block Group 2007 2010 2015 2020 2025 2030 2035
916 916.01 1,147 1,147 1,219 1,340 1,458 1,559 1,627
916.02 878 878 927 1,000 1,075 1,137 1,180
916.03 655 659 663 664 664 665 665
916.04 444 444 448 456 462 467 472
Census Tract Total 3,125 3,129 3,257 3,460 3,660 3,828 3,945
917 917.01 1,925 1,984 2,018 2,050 2,074 2,096 2,115
917.02 1,519 1,539 1,770 2,125 2,487 2,783 3,004
917.03 1,270 1,246 1,377 1,509 1,625 1,722 1,796
917.04 909 1,344 1,418 1,442 1,461 1,479 1,495
917.05 4,092 4,154 4,212 4,284 4,341 4,390 4,428
Census Tract Total 9,714 10,267 10,794 11,411 11,989 12,470 12,837
918 918.01 973 973 973 973 973 973 973
918.02 1,009 1,009 1,015 1,025 1,034 1,042 1,048
918.03 572 572 572 572 572 572 572
918.04 975 975 976 978 979 980 981
918.05 1,171 1,172 2,383 4,326 6,218 7,801 8,944
Census Tract Total 4,700 4,701 5,919 7,873 9,776 11,369 12,518
919 919.01 823 833 838 843 849 853 857
919.02 449 451 452 452 453 453 454
Census Tract Total 1,272 1,284 1,290 1,296 1,302 1,307 1,310
920 920.01 724 729 732 735 739 741 743
920.02 701 703 703 703 703 703 703
920.03 717 720 723 726 728 730 731
Census Tract Total 2,142 2,153 2,159 2,164 2,170 2,174 2,178
921 921.01 614 616 619 622 626 629 631
921.02 233 233 233 233 233 233 233
921.03 374 374 377 385 388 392 396
921.04 372 373 373 373 373 373 373
921.05 569 569 581 599 617 629 640
(Continued)V-31
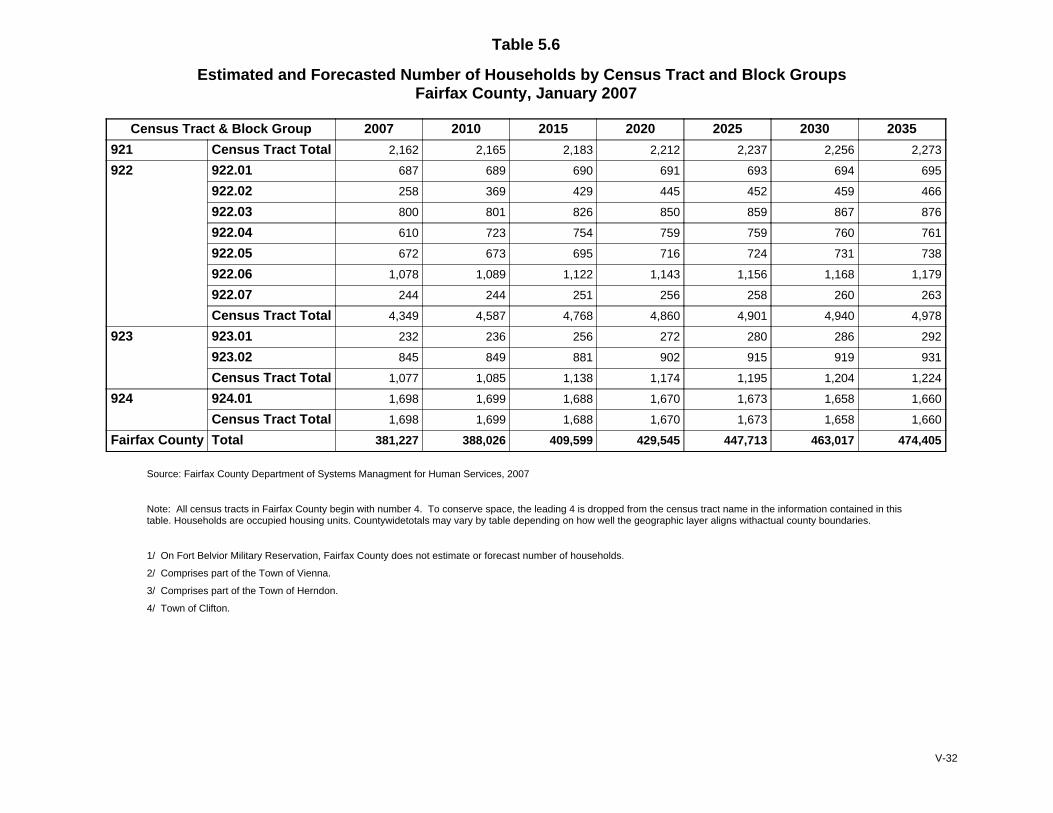
Table 5.6
Estimated and Forecasted Number of Households by Census Tract and Block GroupsFairfax County, January 2007
Census Tract & Block Group 2007 2010 2015 2020 2025 2030 2035
Census Tract Total 2,162 2,165 2,183 2,212 2,237 2,256 2,273921
922 922.01 687 689 690 691 693 694 695
922.02 258 369 429 445 452 459 466
922.03 800 801 826 850 859 867 876
922.04 610 723 754 759 759 760 761
922.05 672 673 695 716 724 731 738
922.06 1,078 1,089 1,122 1,143 1,156 1,168 1,179
922.07 244 244 251 256 258 260 263
Census Tract Total 4,349 4,587 4,768 4,860 4,901 4,940 4,978
923 923.01 232 236 256 272 280 286 292
923.02 845 849 881 902 915 919 931
Census Tract Total 1,077 1,085 1,138 1,174 1,195 1,204 1,224
924 924.01 1,698 1,699 1,688 1,670 1,673 1,658 1,660
Census Tract Total 1,698 1,699 1,688 1,670 1,673 1,658 1,660
Fairfax County Total 381,227 388,026 409,599 429,545 447,713 463,017 474,405
Source: Fairfax County Department of Systems Managment for Human Services, 2007
Note: All census tracts in Fairfax County begin with number 4. To conserve space, the leading 4 is dropped from the census tract name in the information contained in thistable. Households are occupied housing units. Countywidetotals may vary by table depending on how well the geographic layer aligns withactual county boundaries.
1/ On Fort Belvior Military Reservation, Fairfax County does not estimate or forecast number of households.
2/ Comprises part of the Town of Vienna.
3/ Comprises part of the Town of Herndon.
4/ Town of Clifton.
V-32
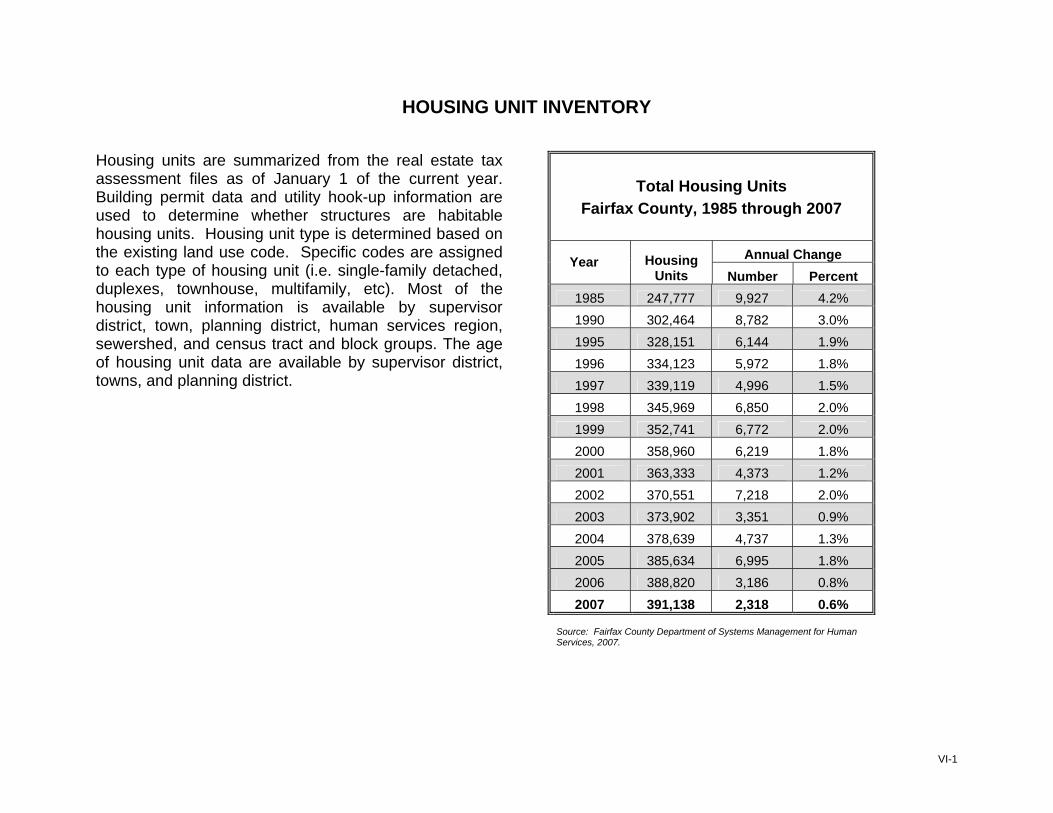
HOUSING UNIT INVENTORY Housing units are summarized from the real estate tax assessment files as of January 1 of the current year. Building permit data and utility hook-up information are used to determine whether structures are habitable housing units. Housing unit type is determined based on the existing land use code. Specific codes are assigned to each type of housing unit (i.e. single-family detached, duplexes, townhouse, multifamily, etc). Most of the housing unit information is available by supervisor district, town, planning district, human services region, sewershed, and census tract and block groups. The age of housing unit data are available by supervisor district, towns, and planning district.
Total Housing Units Fairfax County, 1985 through 2007
Annual Change Year Housing Units Number Percent
1985 247,777 9,927 4.2% 1990 302,464 8,782 3.0% 1995 328,151 6,144 1.9% 1996 334,123 5,972 1.8% 1997 339,119 4,996 1.5% 1998 345,969 6,850 2.0% 1999 352,741 6,772 2.0% 2000 358,960 6,219 1.8% 2001 363,333 4,373 1.2% 2002 370,551 7,218 2.0% 2003 373,902 3,351 0.9% 2004 378,639 4,737 1.3% 2005 385,634 6,995 1.8% 2006 388,820 3,186 0.8% 2007 391,138 2,318 0.6%
Source: Fairfax County Department of Systems Management for Human Services, 2007.
VI-1
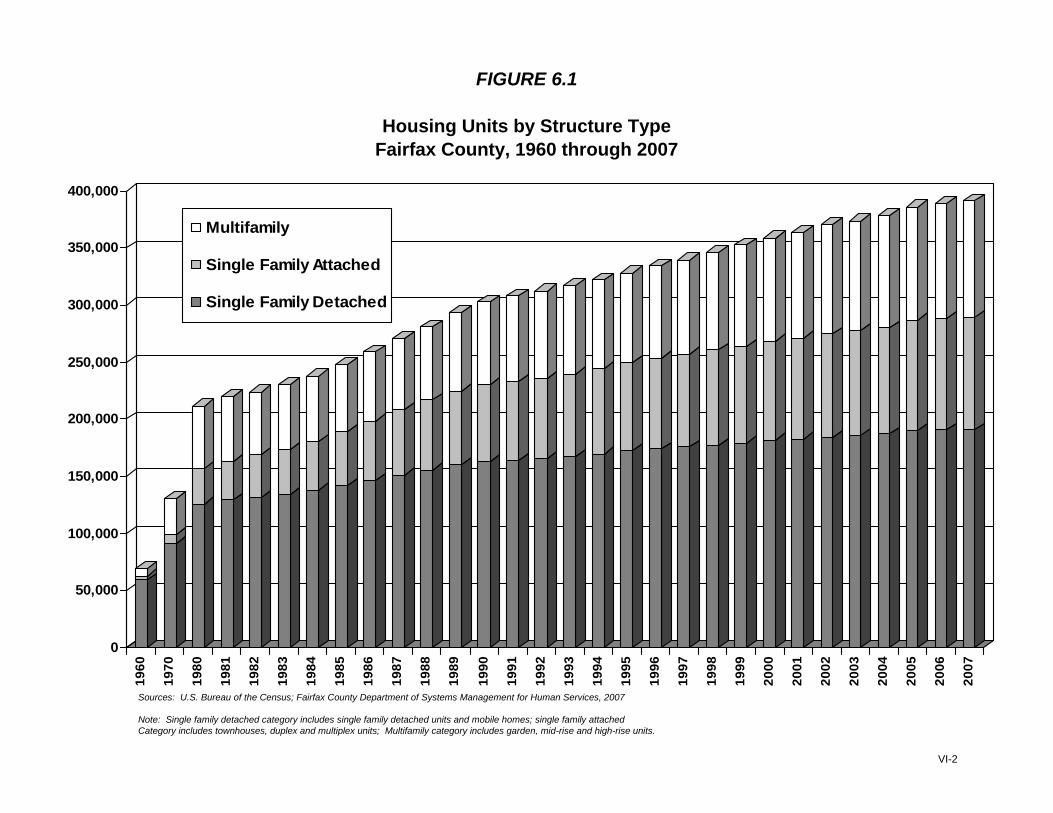
FIGURE 6.1
Housing Units by Structure TypeFairfax County, 1960 through 2007
0
50,000
100,000
150,000
200,000
250,000
300,000
350,000
400,000
1960
1970
1980
1981
1982
1983
1984
1985
1986
1987
1988
1989
1990
1991
1992
1993
1994
1995
1996
1997
1998
1999
2000
2001
2002
2003
2004
2005
2006
2007
Multifamily
Single Family Attached
Single Family Detached
Sources: U.S. Bureau of the Census; Fairfax County Department of Systems Management for Human Services, 2007
Note: Single family detached category includes single family detached units and mobile homes; single family attached Category includes townhouses, duplex and multiplex units; Multifamily category includes garden, mid-rise and high-rise units.
VI-2
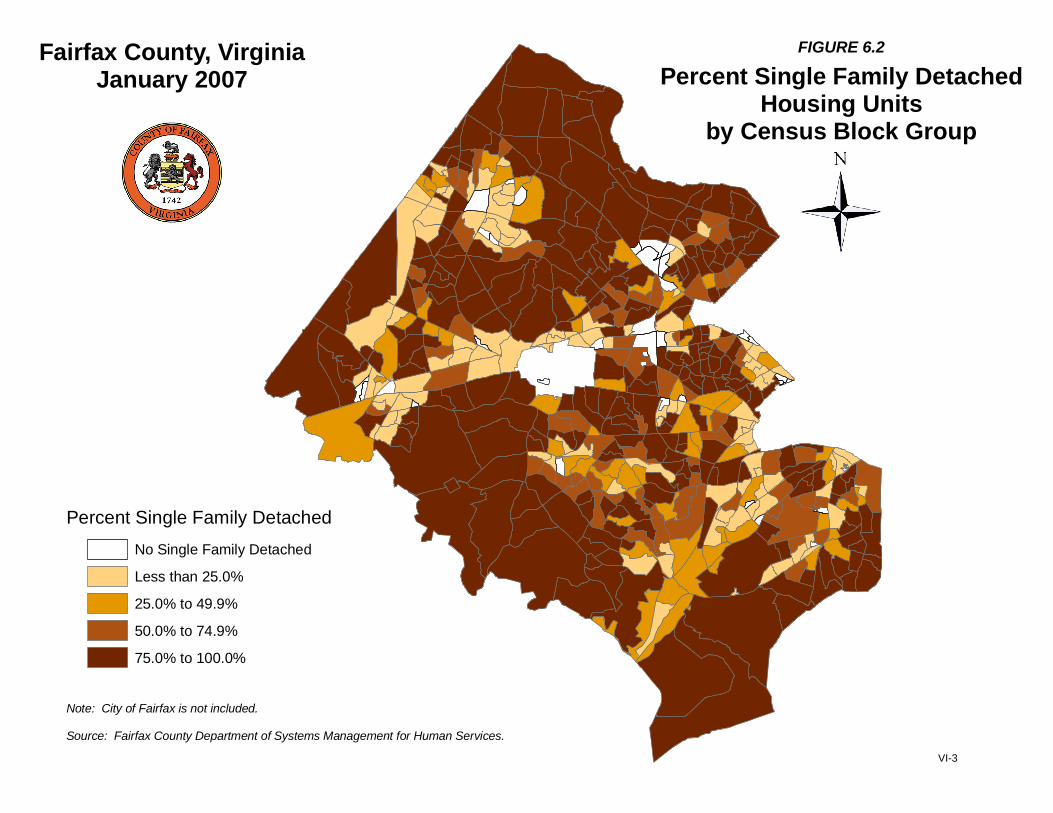
FIGURE 6.2
Percent Single Family DetachedHousing Units
by Census Block Group
Fairfax County, VirginiaJanuary 2007
Percent Single Family DetachedNo Single Family Detached
Less than 25.0%
25.0% to 49.9%
50.0% to 74.9%
75.0% to 100.0%
Note: City of Fairfax is not included.
Source: Fairfax County Department of Systems Management for Human Services.
VI-3
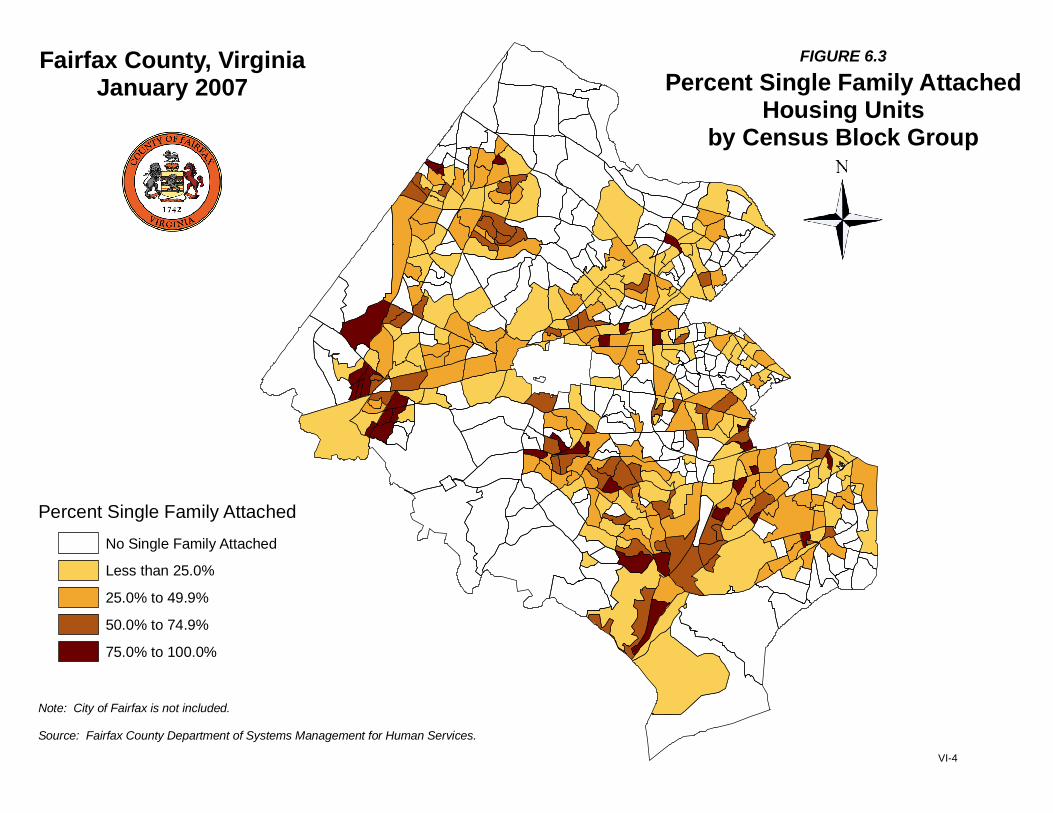
Fairfax County, VirginiaJanuary 2007
FIGURE 6.3
Percent Single Family AttachedHousing Units
by Census Block Group
Percent Single Family AttachedNo Single Family Attached
Less than 25.0%
25.0% to 49.9%
50.0% to 74.9%
75.0% to 100.0%
Note: City of Fairfax is not included.
Source: Fairfax County Department of Systems Management for Human Services.
VI-4
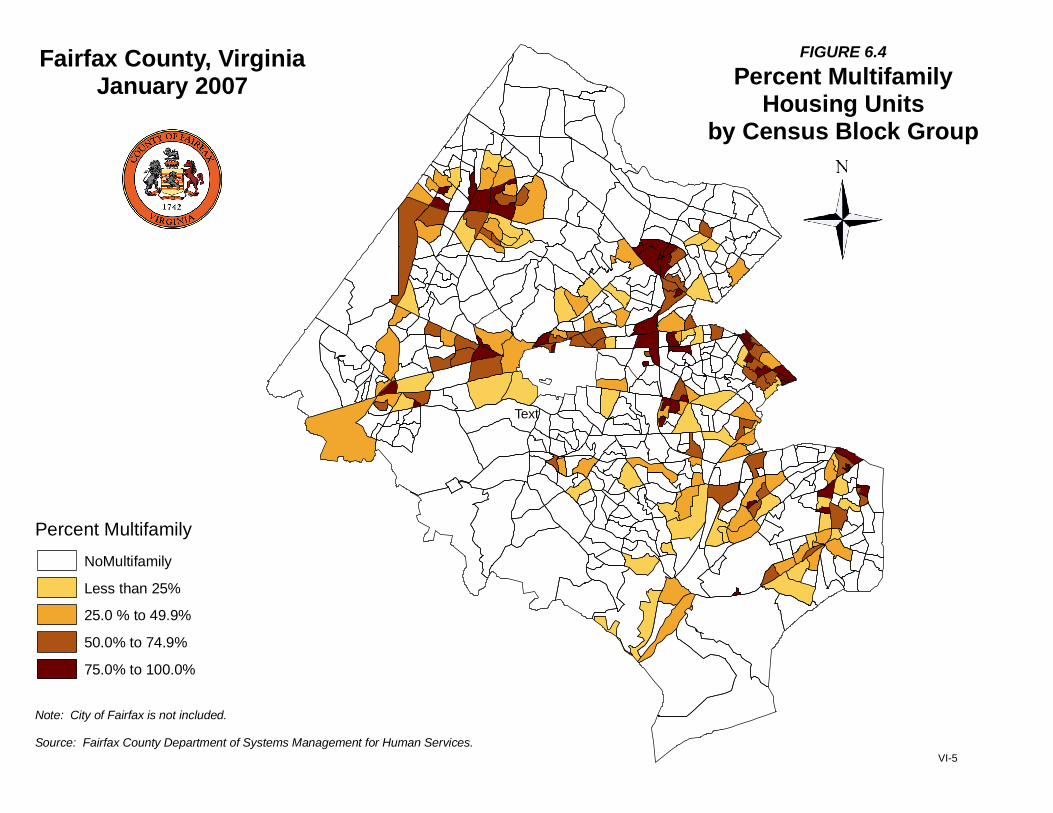
Text
Fairfax County, VirginiaJanuary 2007
FIGURE 6.4Percent Multifamily
Housing Unitsby Census Block Group
Percent Multifamily NoMultifamily
Less than 25%
25.0 % to 49.9%
50.0% to 74.9%
75.0% to 100.0%
Note: City of Fairfax is not included.
Source: Fairfax County Department of Systems Management for Human Services.VI-5
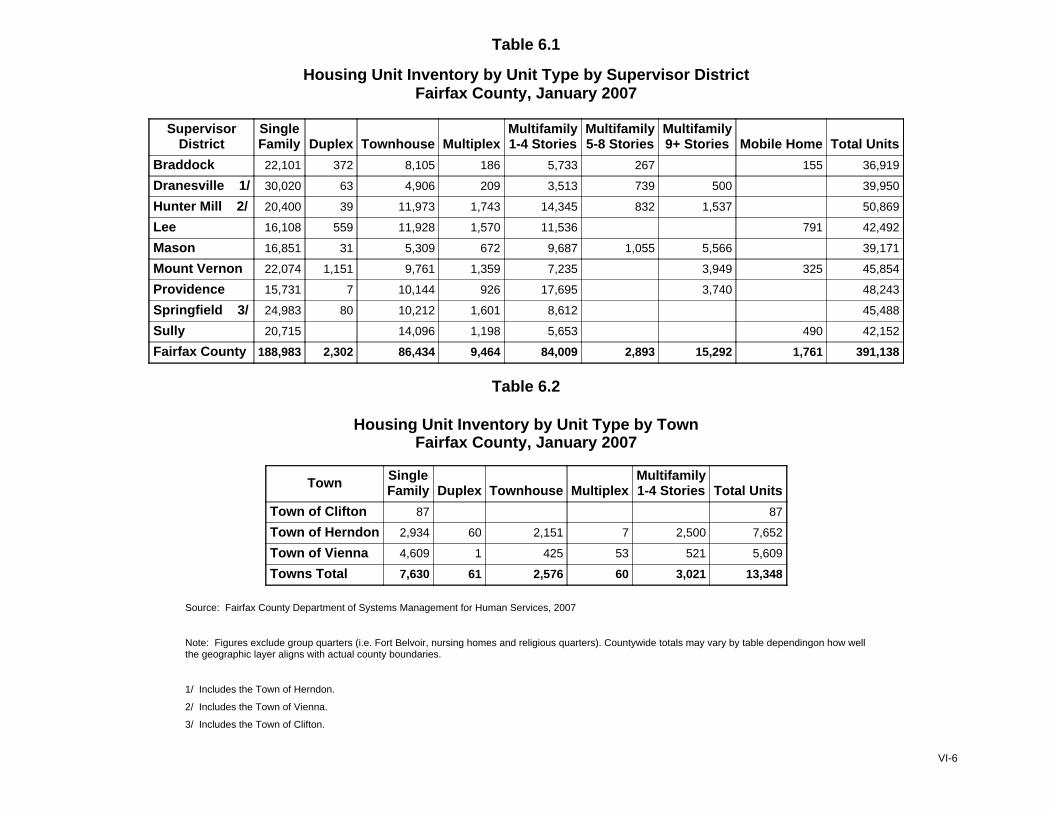
Table 6.1
Housing Unit Inventory by Unit Type by Supervisor DistrictFairfax County, January 2007
SupervisorDistrict
SingleFamily Duplex Townhouse Multiplex
Multifamily1-4 Stories
Multifamily5-8 Stories
Multifamily9+ Stories Mobile Home Total Units
Braddock 22,101 372 8,105 186 5,733 267 155 36,919
Dranesville 1/ 30,020 63 4,906 209 3,513 739 500 39,950
Hunter Mill 2/ 20,400 39 11,973 1,743 14,345 832 1,537 50,869
Lee 16,108 559 11,928 1,570 11,536 791 42,492
Mason 16,851 31 5,309 672 9,687 1,055 5,566 39,171
Mount Vernon 22,074 1,151 9,761 1,359 7,235 3,949 325 45,854
Providence 15,731 7 10,144 926 17,695 3,740 48,243
Springfield 3/ 24,983 80 10,212 1,601 8,612 45,488
Sully 20,715 14,096 1,198 5,653 490 42,152
Fairfax County 188,983 2,302 86,434 9,464 84,009 2,893 15,292 1,761 391,138
Table 6.2
Housing Unit Inventory by Unit Type by TownFairfax County, January 2007
Town SingleFamily Duplex Townhouse Multiplex
Multifamily1-4 Stories Total Units
Town of Clifton 87 87
Town of Herndon 2,934 60 2,151 7 2,500 7,652
Town of Vienna 4,609 1 425 53 521 5,609
Towns Total 7,630 61 2,576 60 3,021 13,348
Source: Fairfax County Department of Systems Management for Human Services, 2007
Note: Figures exclude group quarters (i.e. Fort Belvoir, nursing homes and religious quarters). Countywide totals may vary by table dependingon how wellthe geographic layer aligns with actual county boundaries.
1/ Includes the Town of Herndon.
2/ Includes the Town of Vienna.
3/ Includes the Town of Clifton.
VI-6
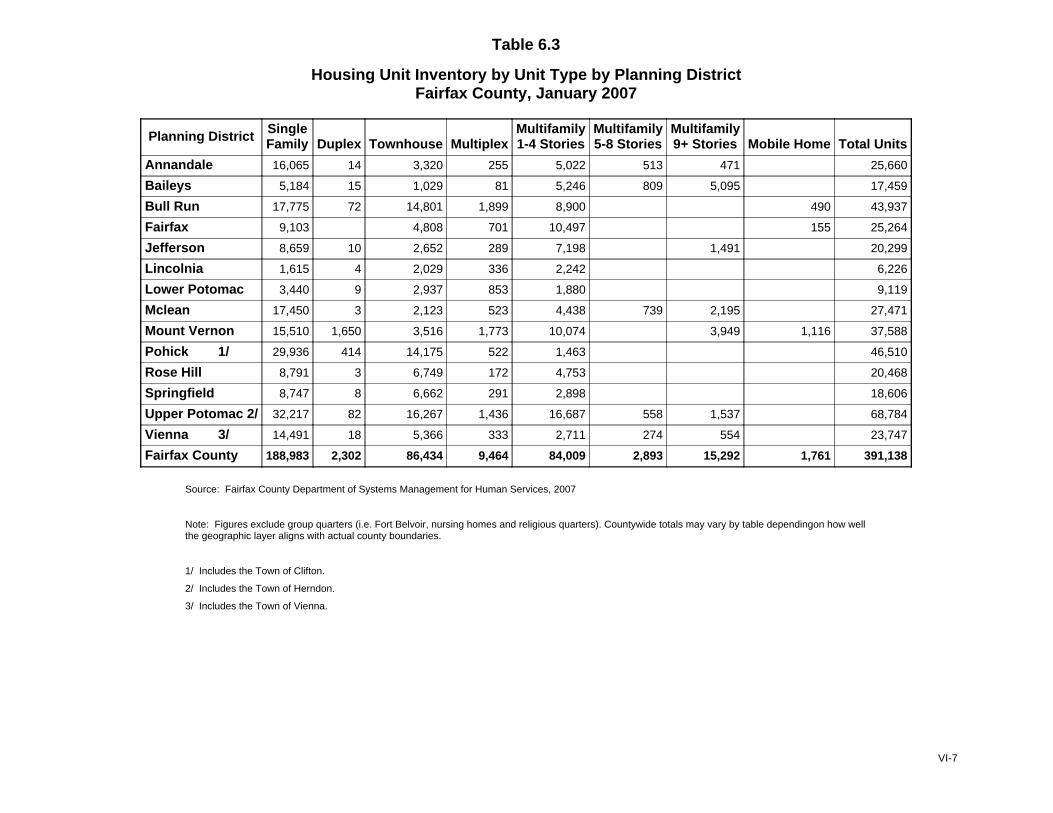
Table 6.3
Housing Unit Inventory by Unit Type by Planning DistrictFairfax County, January 2007
Planning District SingleFamily Duplex Townhouse Multiplex
Multifamily1-4 Stories
Multifamily5-8 Stories
Multifamily9+ Stories Mobile Home Total Units
Annandale 16,065 14 3,320 255 5,022 513 471 25,660
Baileys 5,184 15 1,029 81 5,246 809 5,095 17,459
Bull Run 17,775 72 14,801 1,899 8,900 490 43,937
Fairfax 9,103 4,808 701 10,497 155 25,264
Jefferson 8,659 10 2,652 289 7,198 1,491 20,299
Lincolnia 1,615 4 2,029 336 2,242 6,226
Lower Potomac 3,440 9 2,937 853 1,880 9,119
Mclean 17,450 3 2,123 523 4,438 739 2,195 27,471
Mount Vernon 15,510 1,650 3,516 1,773 10,074 3,949 1,116 37,588
Pohick 1/ 29,936 414 14,175 522 1,463 46,510
Rose Hill 8,791 3 6,749 172 4,753 20,468
Springfield 8,747 8 6,662 291 2,898 18,606
Upper Potomac 2/ 32,217 82 16,267 1,436 16,687 558 1,537 68,784
Vienna 3/ 14,491 18 5,366 333 2,711 274 554 23,747
Fairfax County 188,983 2,302 86,434 9,464 84,009 2,893 15,292 1,761 391,138
Source: Fairfax County Department of Systems Management for Human Services, 2007
Note: Figures exclude group quarters (i.e. Fort Belvoir, nursing homes and religious quarters). Countywide totals may vary by table dependingon how wellthe geographic layer aligns with actual county boundaries.
1/ Includes the Town of Clifton.
2/ Includes the Town of Herndon.
3/ Includes the Town of Vienna.
VI-7
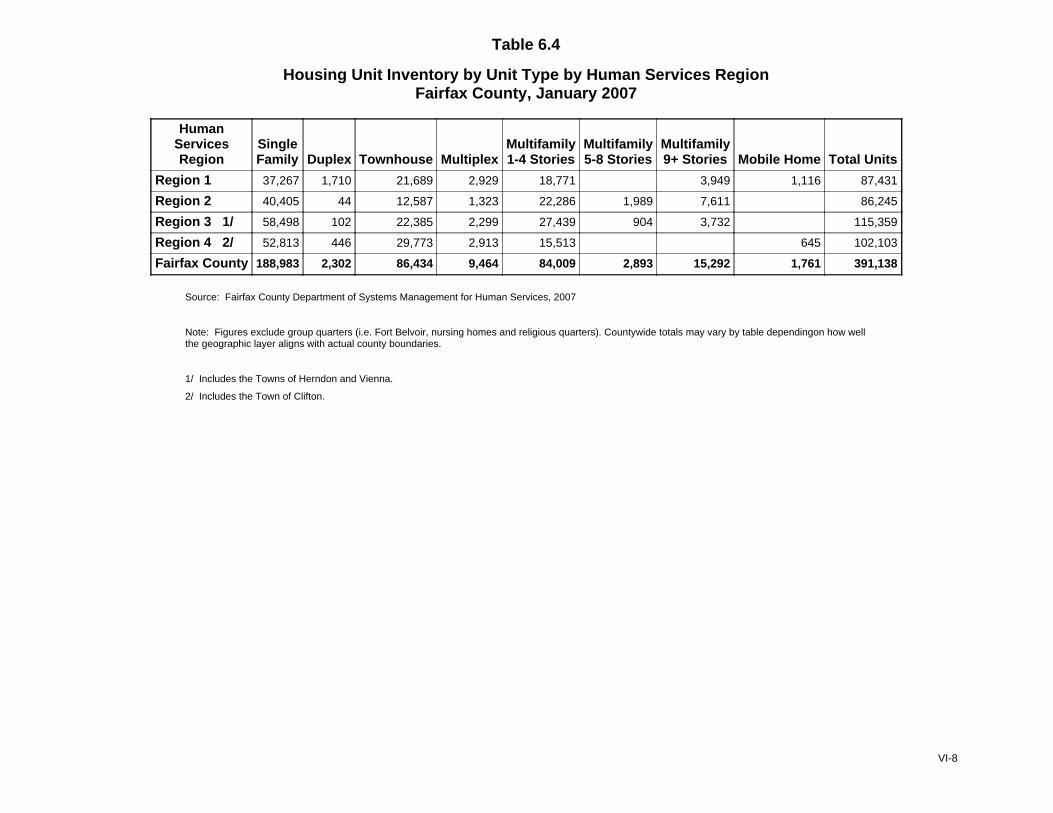
Table 6.4
Housing Unit Inventory by Unit Type by Human Services RegionFairfax County, January 2007
HumanServicesRegion
SingleFamily Duplex Townhouse Multiplex
Multifamily1-4 Stories
Multifamily5-8 Stories
Multifamily9+ Stories Mobile Home Total Units
Region 1 37,267 1,710 21,689 2,929 18,771 3,949 1,116 87,431
Region 2 40,405 44 12,587 1,323 22,286 1,989 7,611 86,245
Region 3 1/ 58,498 102 22,385 2,299 27,439 904 3,732 115,359
Region 4 2/ 52,813 446 29,773 2,913 15,513 645 102,103
Fairfax County 188,983 2,302 86,434 9,464 84,009 2,893 15,292 1,761 391,138
Source: Fairfax County Department of Systems Management for Human Services, 2007
Note: Figures exclude group quarters (i.e. Fort Belvoir, nursing homes and religious quarters). Countywide totals may vary by table dependingon how wellthe geographic layer aligns with actual county boundaries.
1/ Includes the Towns of Herndon and Vienna.
2/ Includes the Town of Clifton.
VI-8
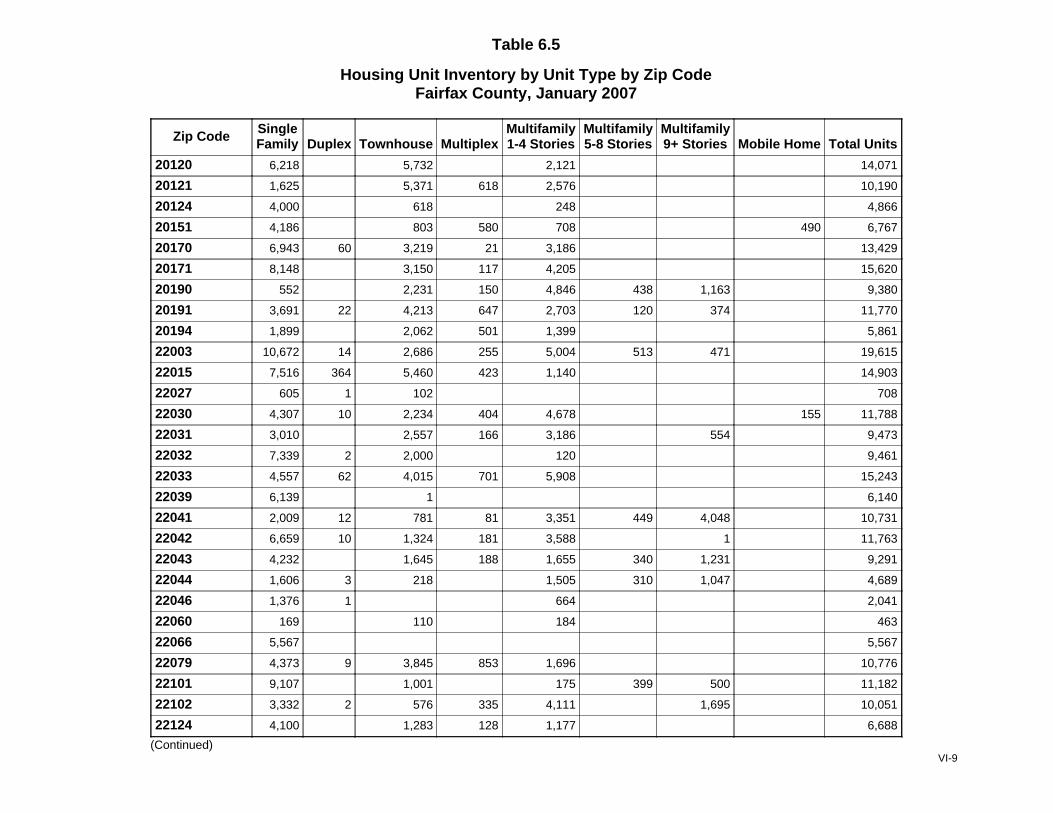
Table 6.5
Housing Unit Inventory by Unit Type by Zip CodeFairfax County, January 2007
Zip Code SingleFamily Duplex Townhouse Multiplex
Multifamily1-4 Stories
Multifamily5-8 Stories
Multifamily9+ Stories Mobile Home Total Units
20120 6,218 5,732 2,121 14,071
20121 1,625 5,371 618 2,576 10,190
20124 4,000 618 248 4,866
20151 4,186 803 580 708 490 6,767
20170 6,943 60 3,219 21 3,186 13,429
20171 8,148 3,150 117 4,205 15,620
20190 552 2,231 150 4,846 438 1,163 9,380
20191 3,691 22 4,213 647 2,703 120 374 11,770
20194 1,899 2,062 501 1,399 5,861
22003 10,672 14 2,686 255 5,004 513 471 19,615
22015 7,516 364 5,460 423 1,140 14,903
22027 605 1 102 708
22030 4,307 10 2,234 404 4,678 155 11,788
22031 3,010 2,557 166 3,186 554 9,473
22032 7,339 2 2,000 120 9,461
22033 4,557 62 4,015 701 5,908 15,243
22039 6,139 1 6,140
22041 2,009 12 781 81 3,351 449 4,048 10,731
22042 6,659 10 1,324 181 3,588 1 11,763
22043 4,232 1,645 188 1,655 340 1,231 9,291
22044 1,606 3 218 1,505 310 1,047 4,689
22046 1,376 1 664 2,041
22060 169 110 184 463
22066 5,567 5,567
22079 4,373 9 3,845 853 1,696 10,776
22101 9,107 1,001 175 399 500 11,182
22102 3,332 2 576 335 4,111 1,695 10,051
22124 4,100 1,283 128 1,177 6,688
(Continued)VI-9
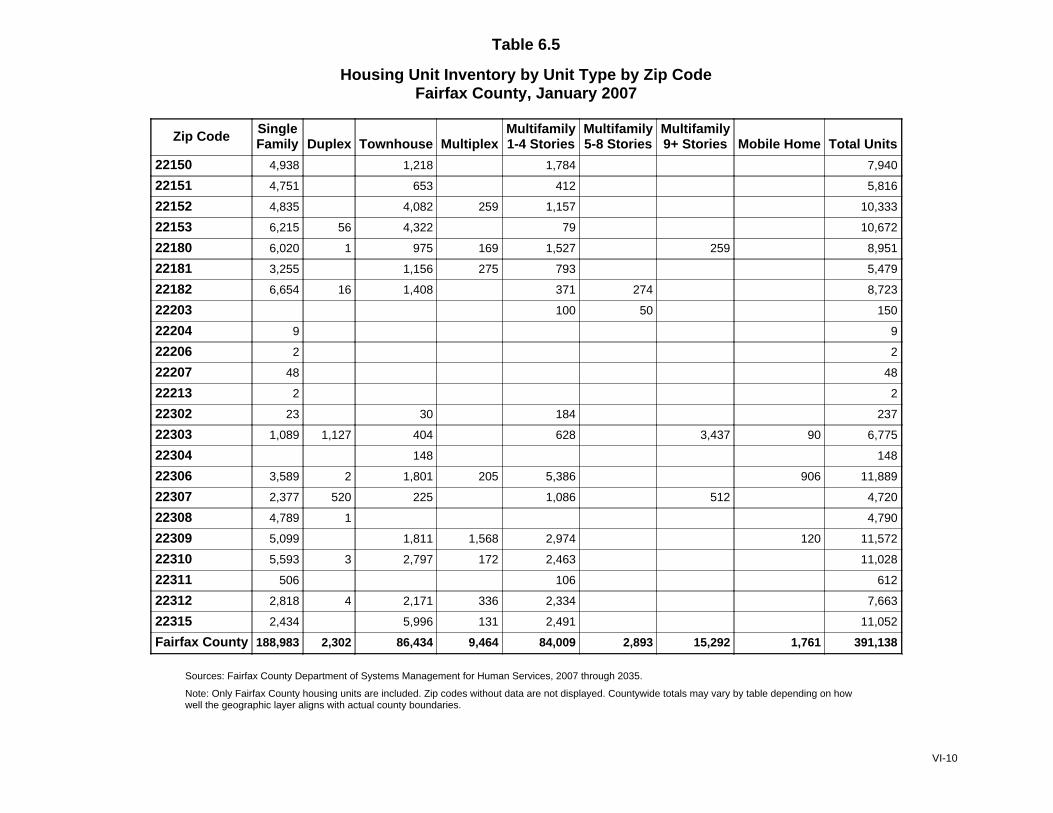
Table 6.5
Housing Unit Inventory by Unit Type by Zip CodeFairfax County, January 2007
Zip Code SingleFamily Duplex Townhouse Multiplex
Multifamily1-4 Stories
Multifamily5-8 Stories
Multifamily9+ Stories Mobile Home Total Units
22150 4,938 1,218 1,784 7,940
22151 4,751 653 412 5,816
22152 4,835 4,082 259 1,157 10,333
22153 6,215 56 4,322 79 10,672
22180 6,020 1 975 169 1,527 259 8,951
22181 3,255 1,156 275 793 5,479
22182 6,654 16 1,408 371 274 8,723
22203 100 50 150
22204 9 9
22206 2 2
22207 48 48
22213 2 2
22302 23 30 184 237
22303 1,089 1,127 404 628 3,437 90 6,775
22304 148 148
22306 3,589 2 1,801 205 5,386 906 11,889
22307 2,377 520 225 1,086 512 4,720
22308 4,789 1 4,790
22309 5,099 1,811 1,568 2,974 120 11,572
22310 5,593 3 2,797 172 2,463 11,028
22311 506 106 612
22312 2,818 4 2,171 336 2,334 7,663
22315 2,434 5,996 131 2,491 11,052
Fairfax County 188,983 2,302 86,434 9,464 84,009 2,893 15,292 1,761 391,138
Sources: Fairfax County Department of Systems Management for Human Services, 2007 through 2035.
Note: Only Fairfax County housing units are included. Zip codes without data are not displayed. Countywide totals may vary by table depending on howwell the geographic layer aligns with actual county boundaries.
VI-10
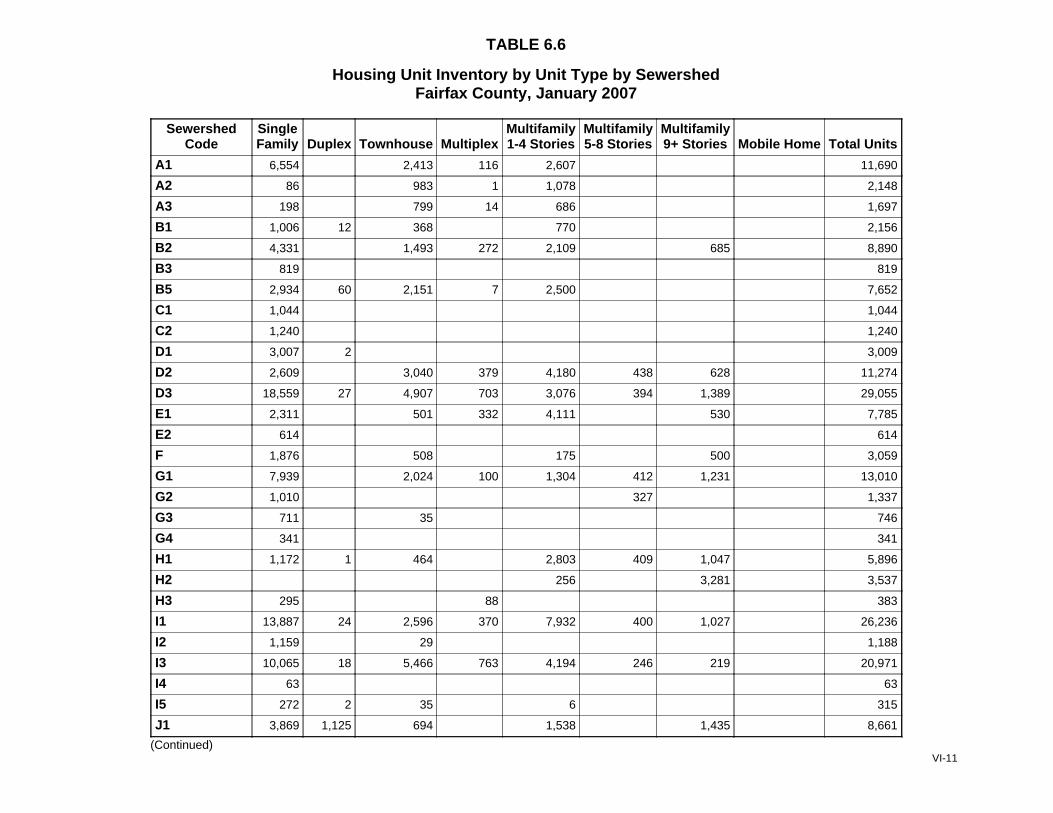
TABLE 6.6
Housing Unit Inventory by Unit Type by SewershedFairfax County, January 2007
SewershedCode
SingleFamily Duplex Townhouse Multiplex
Multifamily1-4 Stories
Multifamily5-8 Stories
Multifamily9+ Stories Mobile Home Total Units
A1 6,554 2,413 116 2,607 11,690
A2 86 983 1 1,078 2,148
A3 198 799 14 686 1,697
B1 1,006 12 368 770 2,156
B2 4,331 1,493 272 2,109 685 8,890
B3 819 819
B5 2,934 60 2,151 7 2,500 7,652
C1 1,044 1,044
C2 1,240 1,240
D1 3,007 2 3,009
D2 2,609 3,040 379 4,180 438 628 11,274
D3 18,559 27 4,907 703 3,076 394 1,389 29,055
E1 2,311 501 332 4,111 530 7,785
E2 614 614
F 1,876 508 175 500 3,059
G1 7,939 2,024 100 1,304 412 1,231 13,010
G2 1,010 327 1,337
G3 711 35 746
G4 341 341
H1 1,172 1 464 2,803 409 1,047 5,896
H2 256 3,281 3,537
H3 295 88 383
I1 13,887 24 2,596 370 7,932 400 1,027 26,236
I2 1,159 29 1,188
I3 10,065 18 5,466 763 4,194 246 219 20,971
I4 63 63
I5 272 2 35 6 315
J1 3,869 1,125 694 1,538 1,435 8,661
(Continued)VI-11
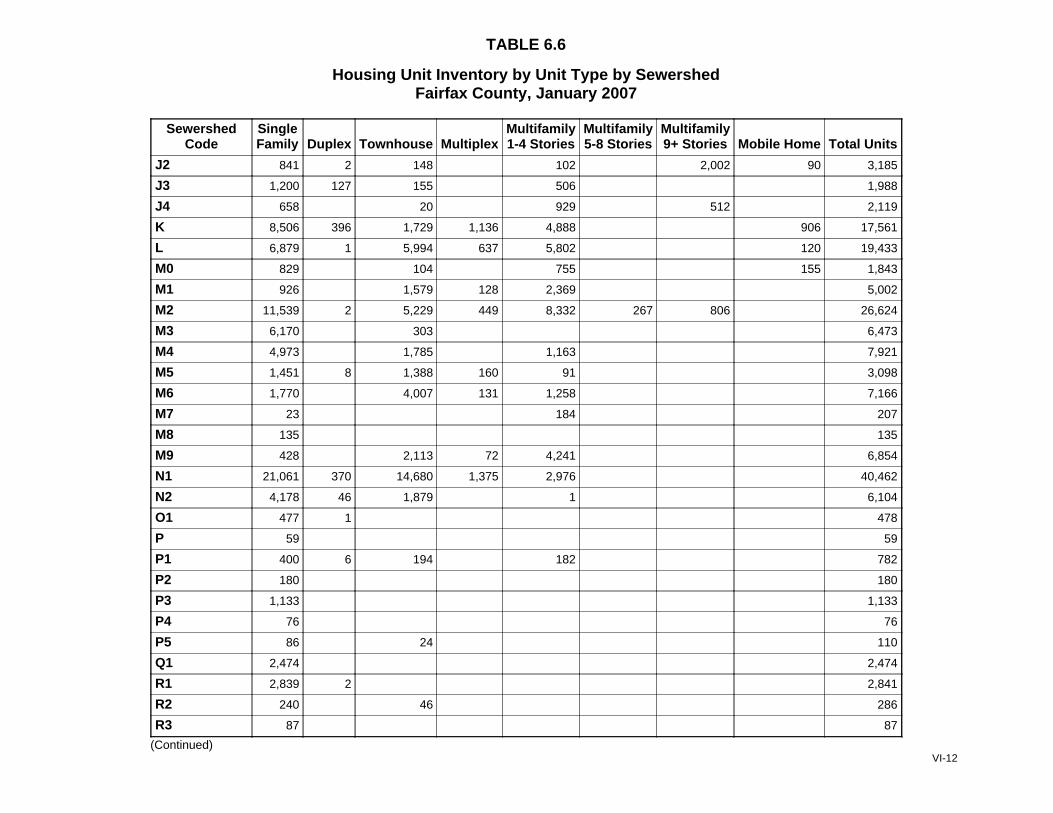
TABLE 6.6
Housing Unit Inventory by Unit Type by SewershedFairfax County, January 2007
SewershedCode
SingleFamily Duplex Townhouse Multiplex
Multifamily1-4 Stories
Multifamily5-8 Stories
Multifamily9+ Stories Mobile Home Total Units
J2 841 2 148 102 2,002 90 3,185
J3 1,200 127 155 506 1,988
J4 658 20 929 512 2,119
K 8,506 396 1,729 1,136 4,888 906 17,561
L 6,879 1 5,994 637 5,802 120 19,433
M0 829 104 755 155 1,843
M1 926 1,579 128 2,369 5,002
M2 11,539 2 5,229 449 8,332 267 806 26,624
M3 6,170 303 6,473
M4 4,973 1,785 1,163 7,921
M5 1,451 8 1,388 160 91 3,098
M6 1,770 4,007 131 1,258 7,166
M7 23 184 207
M8 135 135
M9 428 2,113 72 4,241 6,854
N1 21,061 370 14,680 1,375 2,976 40,462
N2 4,178 46 1,879 1 6,104
O1 477 1 478
P 59 59
P1 400 6 194 182 782
P2 180 180
P3 1,133 1,133
P4 76 76
P5 86 24 110
Q1 2,474 2,474
R1 2,839 2 2,841
R2 240 46 286
R3 87 87
(Continued)VI-12

TABLE 6.6
Housing Unit Inventory by Unit Type by SewershedFairfax County, January 2007
SewershedCode
SingleFamily Duplex Townhouse Multiplex
Multifamily1-4 Stories
Multifamily5-8 Stories
Multifamily9+ Stories Mobile Home Total Units
R4 313 313
S1 4,662 8 4,894 1,395 10,959
S2 370 370
T1 1,077 348 490 1,915
T2 4,692 2,253 580 826 8,351
T3 3,697 2,158 5,855
T4 2,549 62 2,542 1,033 4,556 10,742
T5 2,895 3,610 618 3,368 10,491
T6 104 104
T7 1,033 1,093 412 2,538
Fairfax County 188,981 2,302 86,433 9,464 84,009 2,893 15,292 1,761 391,135
Source: Fairfax County Department of Systems Management for Human Services, 2007
Note: Figures exclude group quarters (i.e. Fort Belvoir, nursing homes and religious quarters). Countywide totals may vary by table dependingon how wellthe geographic layer aligns with actual county boundaries.
1/ Includes the Town of Herndon.
2/ Comprises part of the Town of Vienna.
3/ Includes the Town of Clifton.
VI-13
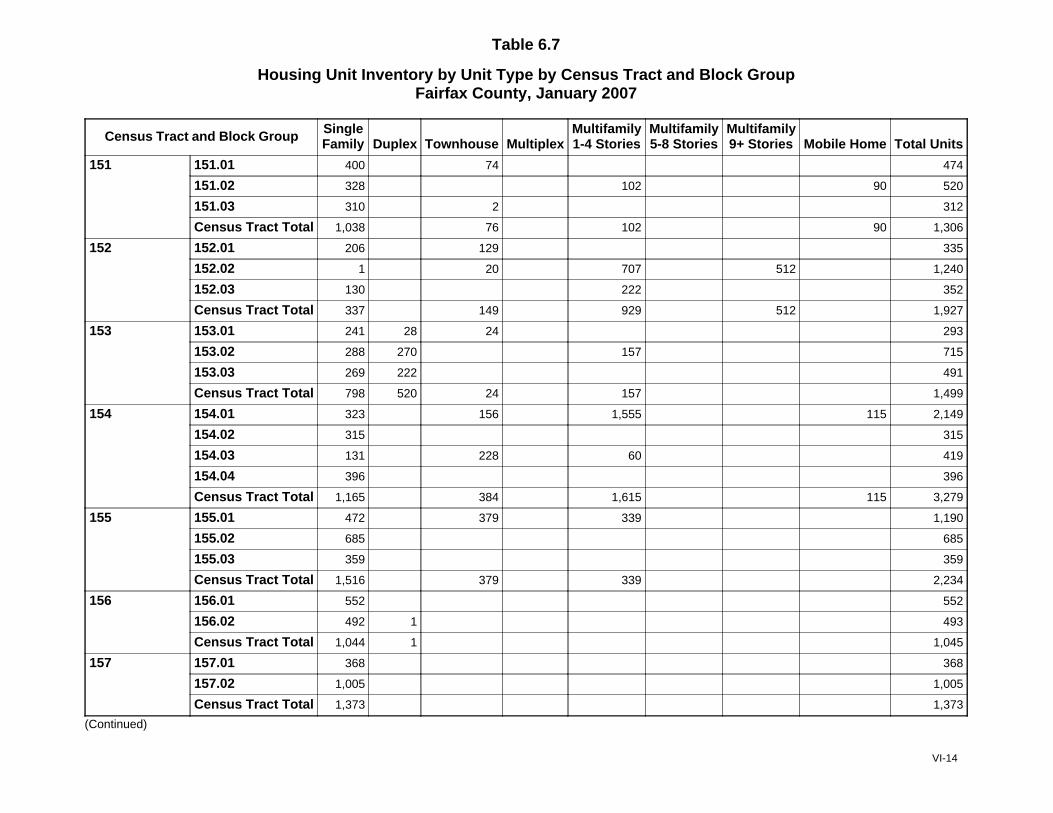
Table 6.7
Housing Unit Inventory by Unit Type by Census Tract and Block GroupFairfax County, January 2007
Census Tract and Block Group SingleFamily Duplex Townhouse Multiplex
Multifamily1-4 Stories
Multifamily5-8 Stories
Multifamily9+ Stories Mobile Home Total Units
151 151.01 400 74 474
151.02 328 102 90 520
151.03 310 2 312
Census Tract Total 1,038 76 102 90 1,306
152 152.01 206 129 335
152.02 1 20 707 512 1,240
152.03 130 222 352
Census Tract Total 337 149 929 512 1,927
153 153.01 241 28 24 293
153.02 288 270 157 715
153.03 269 222 491
Census Tract Total 798 520 24 157 1,499
154 154.01 323 156 1,555 115 2,149
154.02 315 315
154.03 131 228 60 419
154.04 396 396
Census Tract Total 1,165 384 1,615 115 3,279
155 155.01 472 379 339 1,190
155.02 685 685
155.03 359 359
Census Tract Total 1,516 379 339 2,234
156 156.01 552 552
156.02 492 1 493
Census Tract Total 1,044 1 1,045
157 157.01 368 368
157.02 1,005 1,005
Census Tract Total 1,373 1,373
(Continued)
VI-14
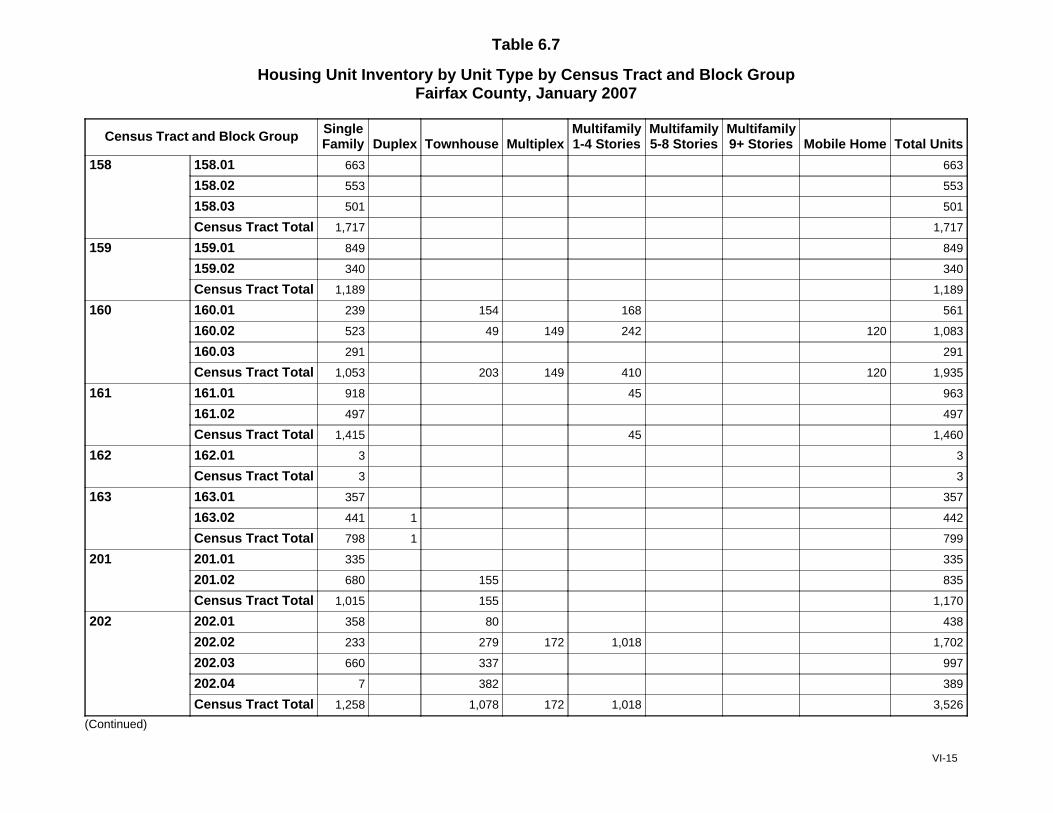
Table 6.7
Housing Unit Inventory by Unit Type by Census Tract and Block GroupFairfax County, January 2007
Census Tract and Block Group SingleFamily Duplex Townhouse Multiplex
Multifamily1-4 Stories
Multifamily5-8 Stories
Multifamily9+ Stories Mobile Home Total Units
158 158.01 663 663
158.02 553 553
158.03 501 501
Census Tract Total 1,717 1,717
159 159.01 849 849
159.02 340 340
Census Tract Total 1,189 1,189
160 160.01 239 154 168 561
160.02 523 49 149 242 120 1,083
160.03 291 291
Census Tract Total 1,053 203 149 410 120 1,935
161 161.01 918 45 963
161.02 497 497
Census Tract Total 1,415 45 1,460
162 162.01 3 3
Census Tract Total 3 3
163 163.01 357 357
163.02 441 1 442
Census Tract Total 798 1 799
201 201.01 335 335
201.02 680 155 835
Census Tract Total 1,015 155 1,170
202 202.01 358 80 438
202.02 233 279 172 1,018 1,702
202.03 660 337 997
202.04 7 382 389
Census Tract Total 1,258 1,078 172 1,018 3,526
(Continued)
VI-15
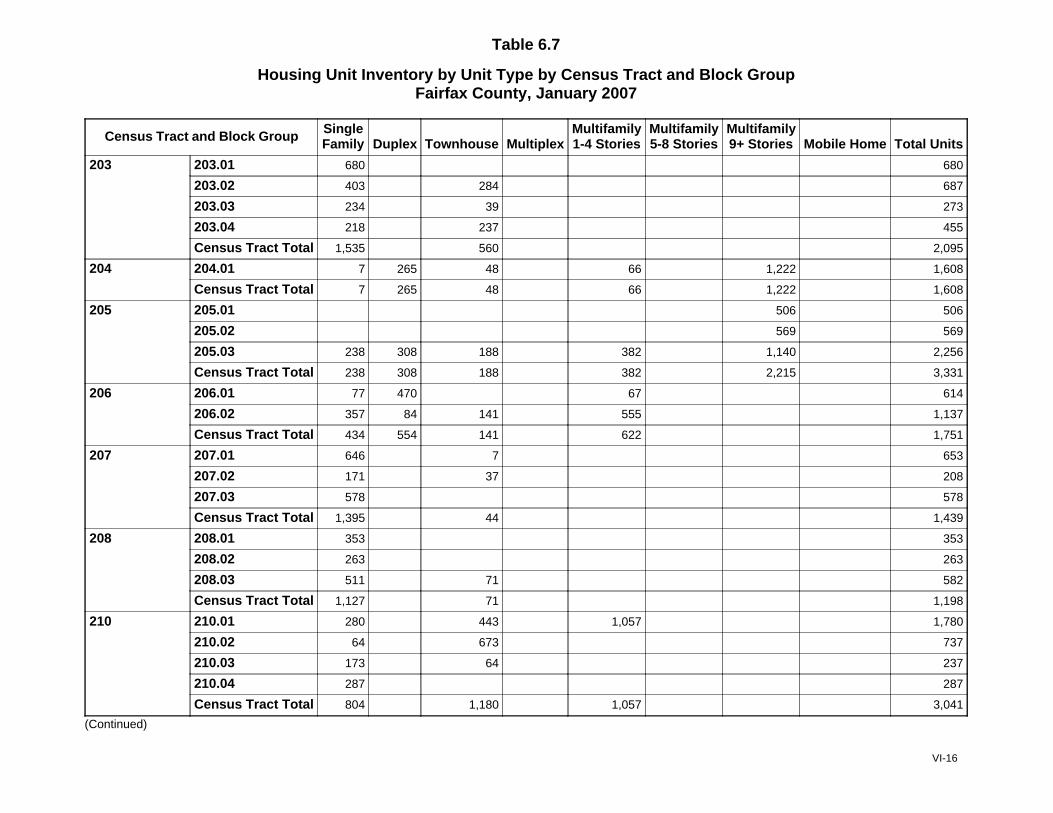
Table 6.7
Housing Unit Inventory by Unit Type by Census Tract and Block GroupFairfax County, January 2007
Census Tract and Block Group SingleFamily Duplex Townhouse Multiplex
Multifamily1-4 Stories
Multifamily5-8 Stories
Multifamily9+ Stories Mobile Home Total Units
203 203.01 680 680
203.02 403 284 687
203.03 234 39 273
203.04 218 237 455
Census Tract Total 1,535 560 2,095
204 204.01 7 265 48 66 1,222 1,608
Census Tract Total 7 265 48 66 1,222 1,608
205 205.01 506 506
205.02 569 569
205.03 238 308 188 382 1,140 2,256
Census Tract Total 238 308 188 382 2,215 3,331
206 206.01 77 470 67 614
206.02 357 84 141 555 1,137
Census Tract Total 434 554 141 622 1,751
207 207.01 646 7 653
207.02 171 37 208
207.03 578 578
Census Tract Total 1,395 44 1,439
208 208.01 353 353
208.02 263 263
208.03 511 71 582
Census Tract Total 1,127 71 1,198
210 210.01 280 443 1,057 1,780
210.02 64 673 737
210.03 173 64 237
210.04 287 287
Census Tract Total 804 1,180 1,057 3,041
(Continued)
VI-16
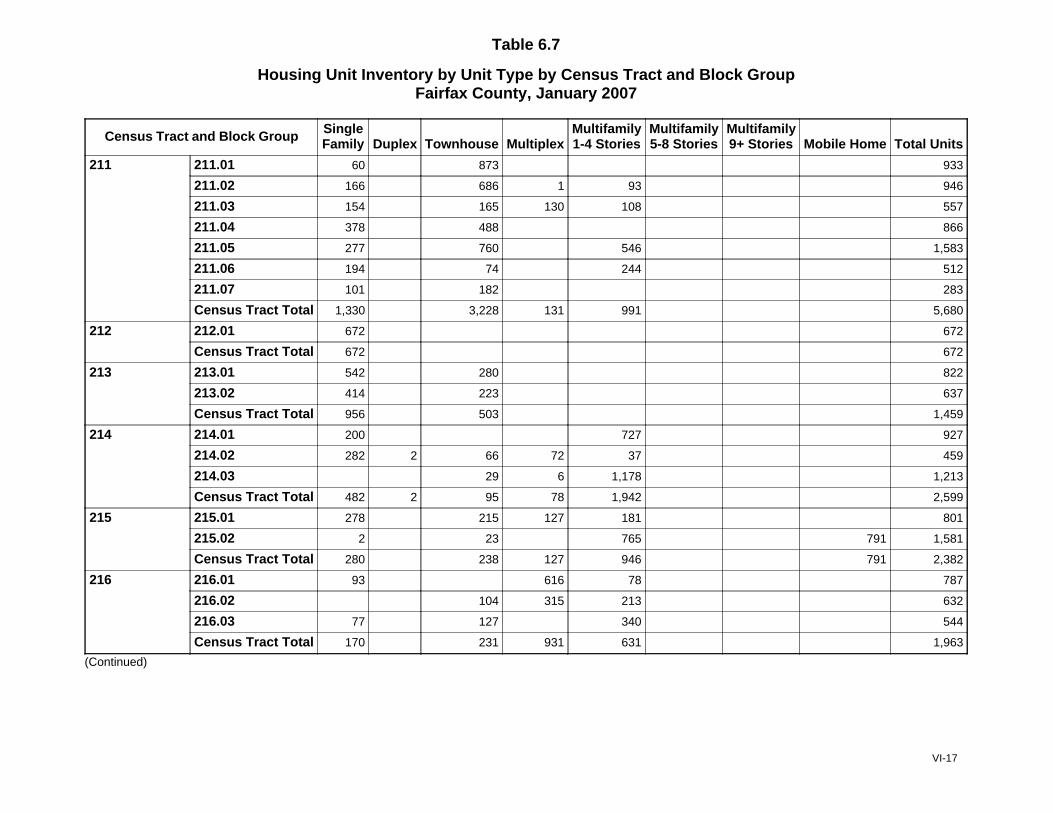
Table 6.7
Housing Unit Inventory by Unit Type by Census Tract and Block GroupFairfax County, January 2007
Census Tract and Block Group SingleFamily Duplex Townhouse Multiplex
Multifamily1-4 Stories
Multifamily5-8 Stories
Multifamily9+ Stories Mobile Home Total Units
211 211.01 60 873 933
211.02 166 686 1 93 946
211.03 154 165 130 108 557
211.04 378 488 866
211.05 277 760 546 1,583
211.06 194 74 244 512
211.07 101 182 283
Census Tract Total 1,330 3,228 131 991 5,680
212 212.01 672 672
Census Tract Total 672 672
213 213.01 542 280 822
213.02 414 223 637
Census Tract Total 956 503 1,459
214 214.01 200 727 927
214.02 282 2 66 72 37 459
214.03 29 6 1,178 1,213
Census Tract Total 482 2 95 78 1,942 2,599
215 215.01 278 215 127 181 801
215.02 2 23 765 791 1,581
Census Tract Total 280 238 127 946 791 2,382
216 216.01 93 616 78 787
216.02 104 315 213 632
216.03 77 127 340 544
Census Tract Total 170 231 931 631 1,963
(Continued)
VI-17

Table 6.7
Housing Unit Inventory by Unit Type by Census Tract and Block GroupFairfax County, January 2007
Census Tract and Block Group SingleFamily Duplex Townhouse Multiplex
Multifamily1-4 Stories
Multifamily5-8 Stories
Multifamily9+ Stories Mobile Home Total Units
217 217.01 453 453
217.02 403 396 799
217.03 224 414 131 657 1,426
Census Tract Total 1,080 810 131 657 2,678
218 218.01 1 310 15 627 953
218.02 191 257 342 604 1,394
Census Tract Total 192 567 357 1,231 2,347
219 219.01 73 6 79
Census Tract Total 73 6 79
220 220.01 386 476 862
220.02 23 184 207
Census Tract Total 409 476 184 1,069
221 221.01 656 652 112 1,174 2,594
221.02 539 6 503 461 270 1,779
221.03 74 2 975 280 1,331
221.04 226 153 252 631
Census Tract Total 1,495 8 2,283 853 1,696 6,335
222 222.01 679 172 851
Census Tract Total 679 172 851
223 223.01 17 632 649
223.02 395 3 658 406 1,462
223.03 194 589 555 1,338
223.04 2 139 170 311
Census Tract Total 591 3 1,403 1,763 3,760
(Continued)
VI-18
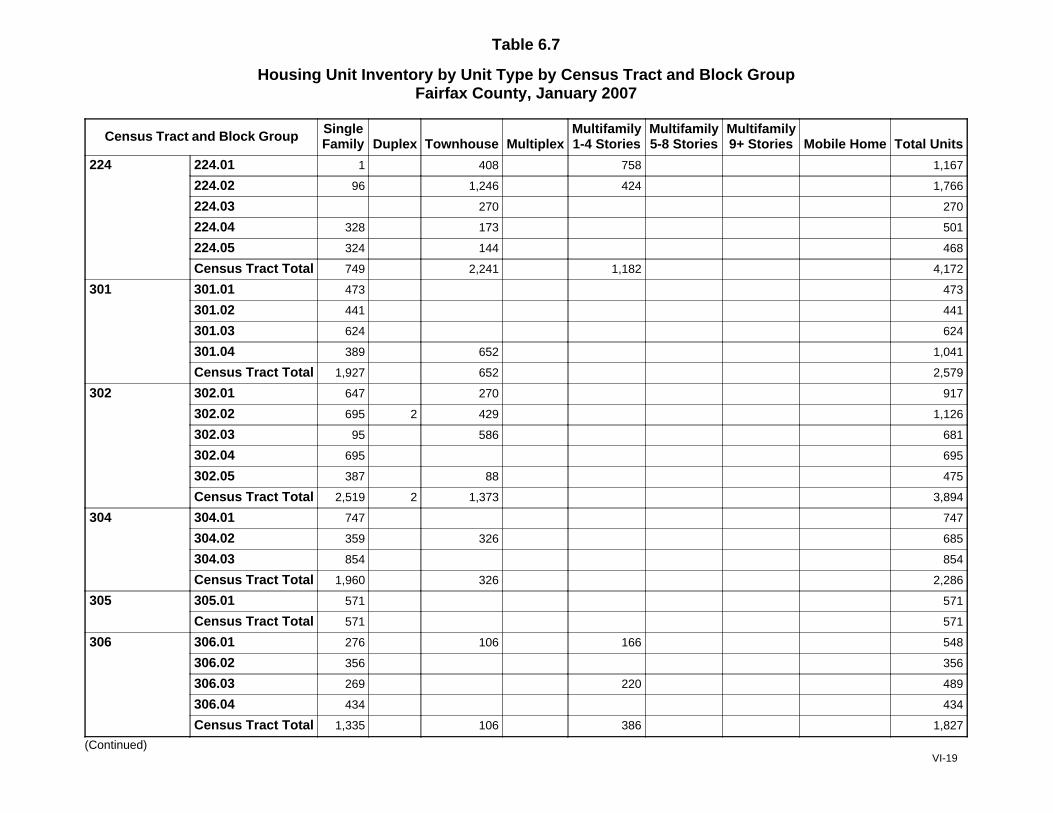
Table 6.7
Housing Unit Inventory by Unit Type by Census Tract and Block GroupFairfax County, January 2007
Census Tract and Block Group SingleFamily Duplex Townhouse Multiplex
Multifamily1-4 Stories
Multifamily5-8 Stories
Multifamily9+ Stories Mobile Home Total Units
224 224.01 1 408 758 1,167
224.02 96 1,246 424 1,766
224.03 270 270
224.04 328 173 501
224.05 324 144 468
Census Tract Total 749 2,241 1,182 4,172
301 301.01 473 473
301.02 441 441
301.03 624 624
301.04 389 652 1,041
Census Tract Total 1,927 652 2,579
302 302.01 647 270 917
302.02 695 2 429 1,126
302.03 95 586 681
302.04 695 695
302.05 387 88 475
Census Tract Total 2,519 2 1,373 3,894
304 304.01 747 747
304.02 359 326 685
304.03 854 854
Census Tract Total 1,960 326 2,286
305 305.01 571 571
Census Tract Total 571 571
306 306.01 276 106 166 548
306.02 356 356
306.03 269 220 489
306.04 434 434
Census Tract Total 1,335 106 386 1,827
(Continued)VI-19
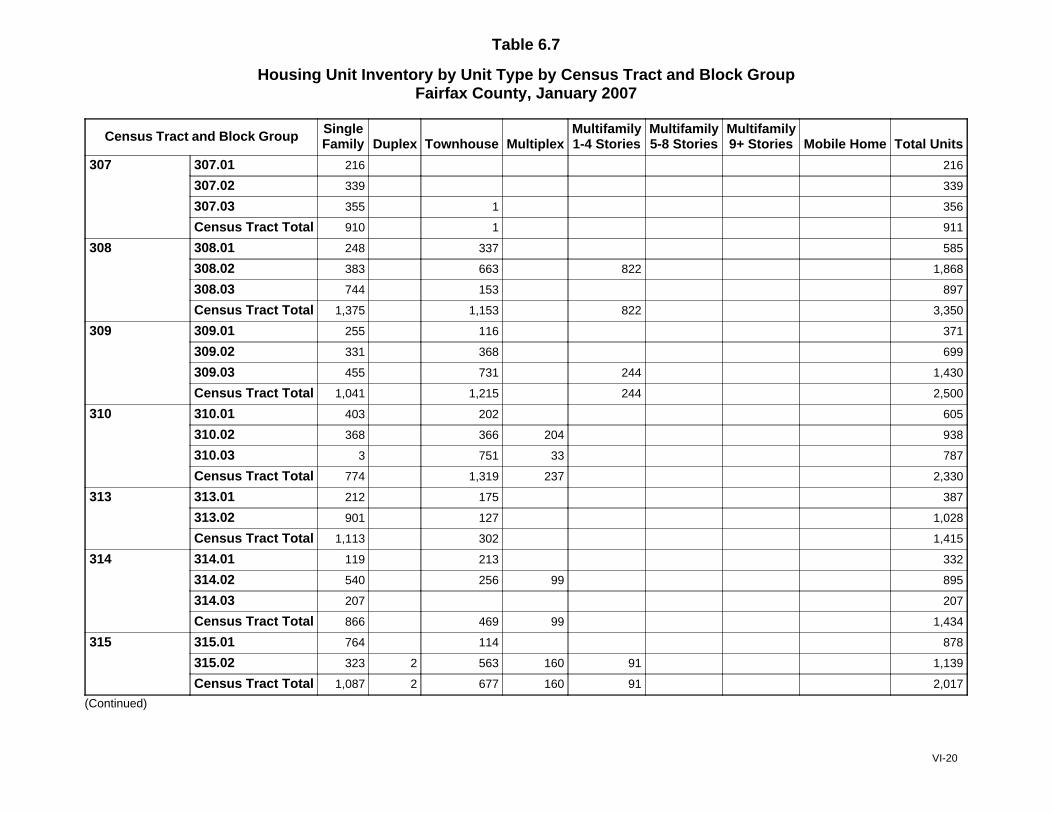
Table 6.7
Housing Unit Inventory by Unit Type by Census Tract and Block GroupFairfax County, January 2007
Census Tract and Block Group SingleFamily Duplex Townhouse Multiplex
Multifamily1-4 Stories
Multifamily5-8 Stories
Multifamily9+ Stories Mobile Home Total Units
307 307.01 216 216
307.02 339 339
307.03 355 1 356
Census Tract Total 910 1 911
308 308.01 248 337 585
308.02 383 663 822 1,868
308.03 744 153 897
Census Tract Total 1,375 1,153 822 3,350
309 309.01 255 116 371
309.02 331 368 699
309.03 455 731 244 1,430
Census Tract Total 1,041 1,215 244 2,500
310 310.01 403 202 605
310.02 368 366 204 938
310.03 3 751 33 787
Census Tract Total 774 1,319 237 2,330
313 313.01 212 175 387
313.02 901 127 1,028
Census Tract Total 1,113 302 1,415
314 314.01 119 213 332
314.02 540 256 99 895
314.03 207 207
Census Tract Total 866 469 99 1,434
315 315.01 764 114 878
315.02 323 2 563 160 91 1,139
Census Tract Total 1,087 2 677 160 91 2,017
(Continued)
VI-20
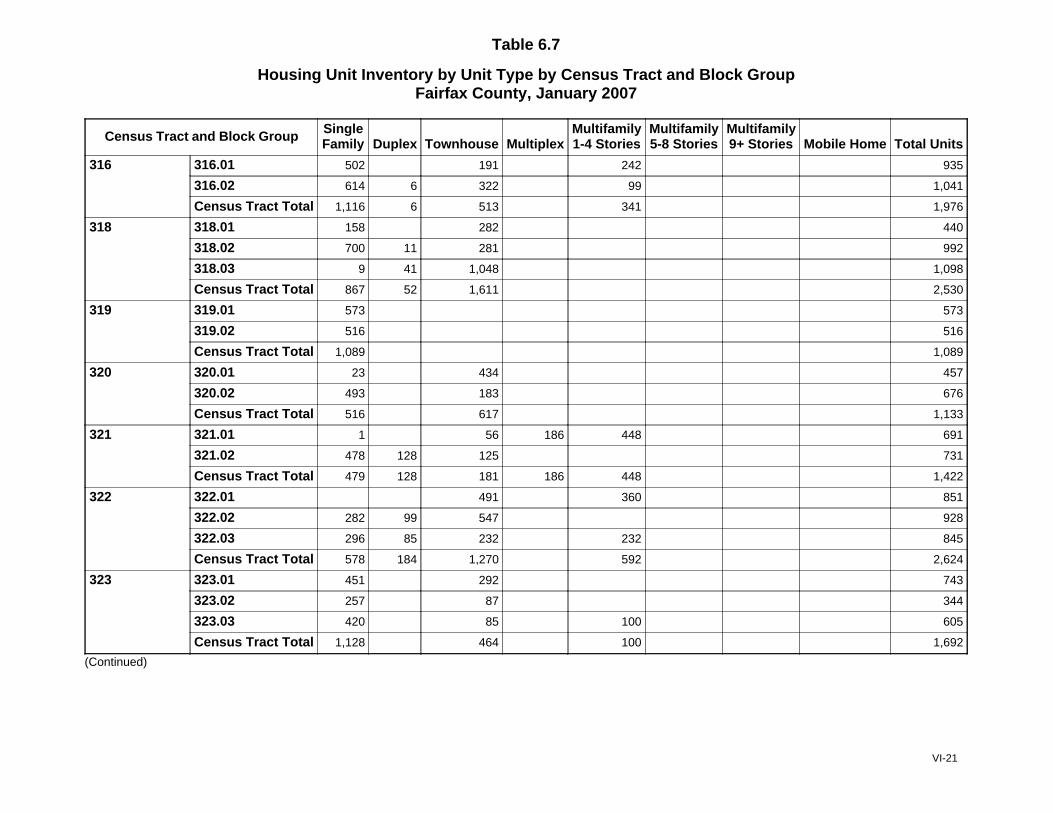
Table 6.7
Housing Unit Inventory by Unit Type by Census Tract and Block GroupFairfax County, January 2007
Census Tract and Block Group SingleFamily Duplex Townhouse Multiplex
Multifamily1-4 Stories
Multifamily5-8 Stories
Multifamily9+ Stories Mobile Home Total Units
316 316.01 502 191 242 935
316.02 614 6 322 99 1,041
Census Tract Total 1,116 6 513 341 1,976
318 318.01 158 282 440
318.02 700 11 281 992
318.03 9 41 1,048 1,098
Census Tract Total 867 52 1,611 2,530
319 319.01 573 573
319.02 516 516
Census Tract Total 1,089 1,089
320 320.01 23 434 457
320.02 493 183 676
Census Tract Total 516 617 1,133
321 321.01 1 56 186 448 691
321.02 478 128 125 731
Census Tract Total 479 128 181 186 448 1,422
322 322.01 491 360 851
322.02 282 99 547 928
322.03 296 85 232 232 845
Census Tract Total 578 184 1,270 592 2,624
323 323.01 451 292 743
323.02 257 87 344
323.03 420 85 100 605
Census Tract Total 1,128 464 100 1,692
(Continued)
VI-21
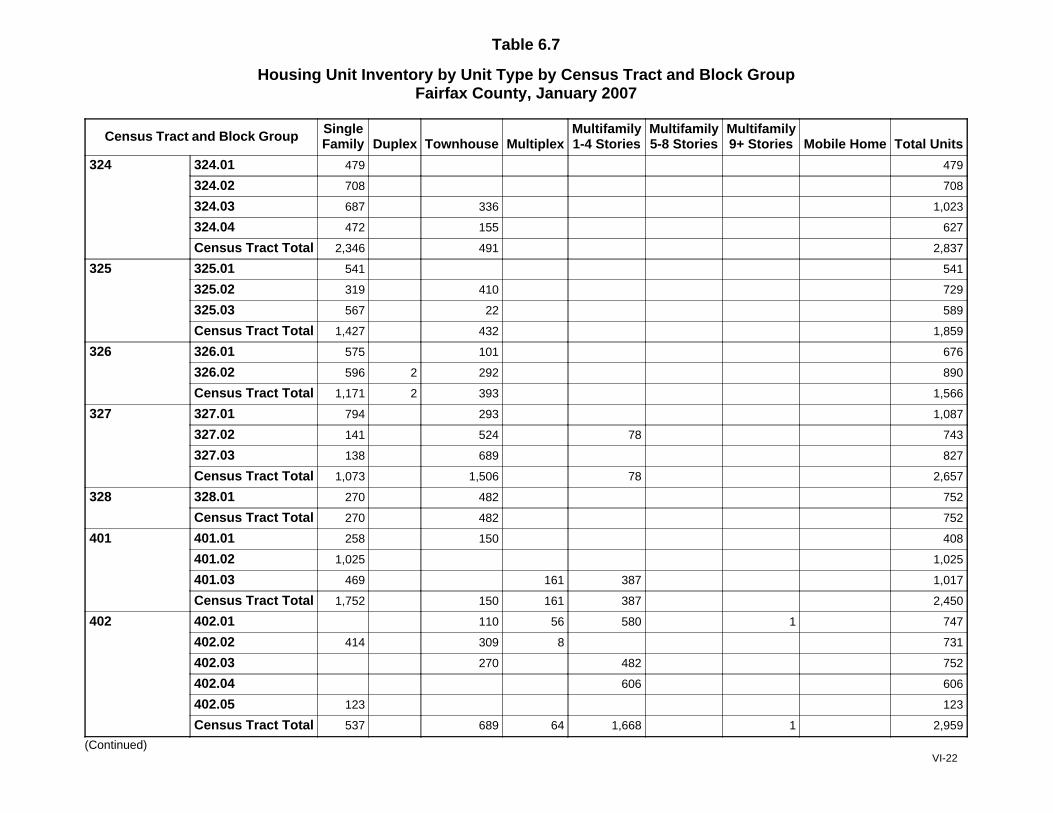
Table 6.7
Housing Unit Inventory by Unit Type by Census Tract and Block GroupFairfax County, January 2007
Census Tract and Block Group SingleFamily Duplex Townhouse Multiplex
Multifamily1-4 Stories
Multifamily5-8 Stories
Multifamily9+ Stories Mobile Home Total Units
324 324.01 479 479
324.02 708 708
324.03 687 336 1,023
324.04 472 155 627
Census Tract Total 2,346 491 2,837
325 325.01 541 541
325.02 319 410 729
325.03 567 22 589
Census Tract Total 1,427 432 1,859
326 326.01 575 101 676
326.02 596 2 292 890
Census Tract Total 1,171 2 393 1,566
327 327.01 794 293 1,087
327.02 141 524 78 743
327.03 138 689 827
Census Tract Total 1,073 1,506 78 2,657
328 328.01 270 482 752
Census Tract Total 270 482 752
401 401.01 258 150 408
401.02 1,025 1,025
401.03 469 161 387 1,017
Census Tract Total 1,752 150 161 387 2,450
402 402.01 110 56 580 1 747
402.02 414 309 8 731
402.03 270 482 752
402.04 606 606
402.05 123 123
Census Tract Total 537 689 64 1,668 1 2,959
(Continued)VI-22
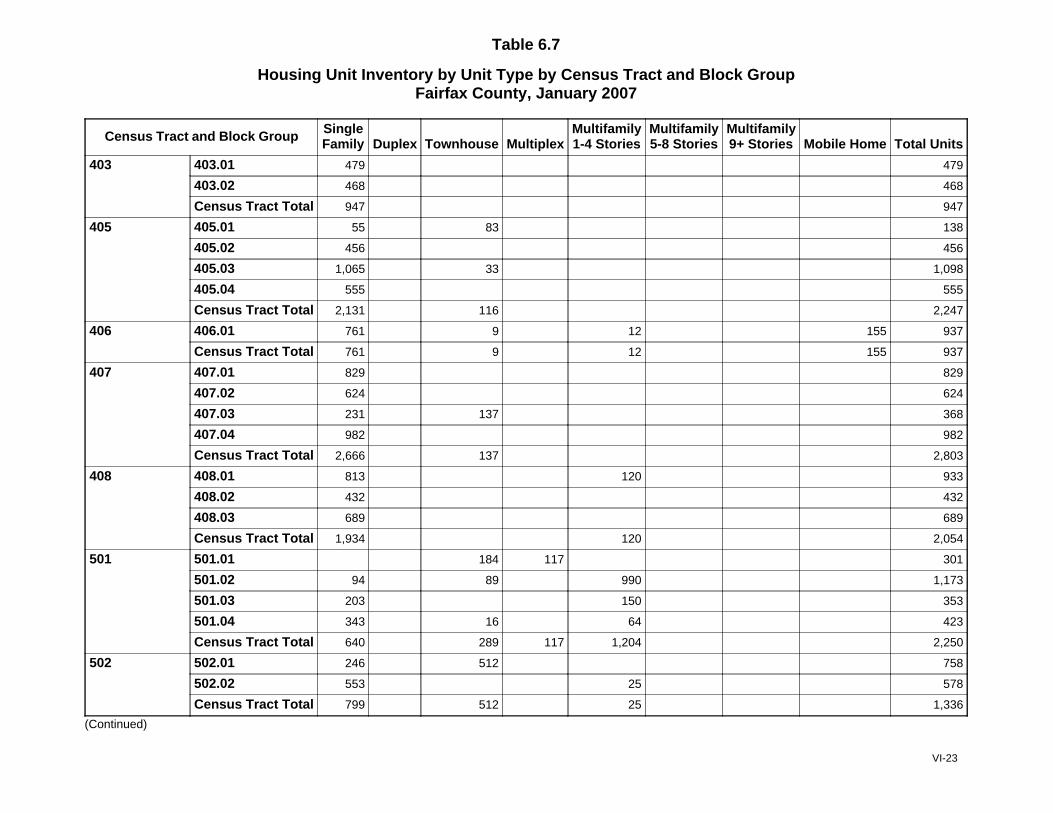
Table 6.7
Housing Unit Inventory by Unit Type by Census Tract and Block GroupFairfax County, January 2007
Census Tract and Block Group SingleFamily Duplex Townhouse Multiplex
Multifamily1-4 Stories
Multifamily5-8 Stories
Multifamily9+ Stories Mobile Home Total Units
403 403.01 479 479
403.02 468 468
Census Tract Total 947 947
405 405.01 55 83 138
405.02 456 456
405.03 1,065 33 1,098
405.04 555 555
Census Tract Total 2,131 116 2,247
406 406.01 761 9 12 155 937
Census Tract Total 761 9 12 155 937
407 407.01 829 829
407.02 624 624
407.03 231 137 368
407.04 982 982
Census Tract Total 2,666 137 2,803
408 408.01 813 120 933
408.02 432 432
408.03 689 689
Census Tract Total 1,934 120 2,054
501 501.01 184 117 301
501.02 94 89 990 1,173
501.03 203 150 353
501.04 343 16 64 423
Census Tract Total 640 289 117 1,204 2,250
502 502.01 246 512 758
502.02 553 25 578
Census Tract Total 799 512 25 1,336
(Continued)
VI-23
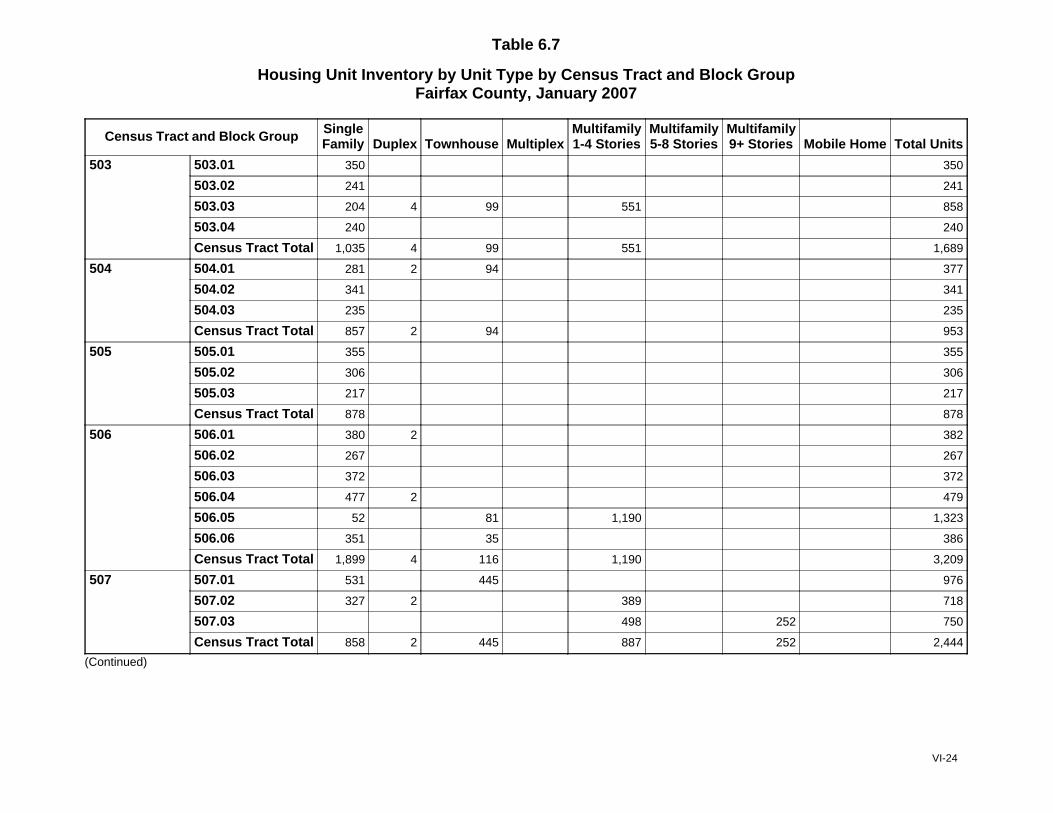
Table 6.7
Housing Unit Inventory by Unit Type by Census Tract and Block GroupFairfax County, January 2007
Census Tract and Block Group SingleFamily Duplex Townhouse Multiplex
Multifamily1-4 Stories
Multifamily5-8 Stories
Multifamily9+ Stories Mobile Home Total Units
503 503.01 350 350
503.02 241 241
503.03 204 4 99 551 858
503.04 240 240
Census Tract Total 1,035 4 99 551 1,689
504 504.01 281 2 94 377
504.02 341 341
504.03 235 235
Census Tract Total 857 2 94 953
505 505.01 355 355
505.02 306 306
505.03 217 217
Census Tract Total 878 878
506 506.01 380 2 382
506.02 267 267
506.03 372 372
506.04 477 2 479
506.05 52 81 1,190 1,323
506.06 351 35 386
Census Tract Total 1,899 4 116 1,190 3,209
507 507.01 531 445 976
507.02 327 2 389 718
507.03 498 252 750
Census Tract Total 858 2 445 887 252 2,444
(Continued)
VI-24

Table 6.7
Housing Unit Inventory by Unit Type by Census Tract and Block GroupFairfax County, January 2007
Census Tract and Block Group SingleFamily Duplex Townhouse Multiplex
Multifamily1-4 Stories
Multifamily5-8 Stories
Multifamily9+ Stories Mobile Home Total Units
508 508.01 306 306
508.02 464 464
508.03 228 20 184 432
Census Tract Total 998 20 184 1,202
509 509.01 303 303
509.02 298 298
Census Tract Total 601 601
510 510.01 403 403
510.02 494 494
Census Tract Total 897 897
511 511.01 362 362
511.02 469 469
Census Tract Total 831 831
512 512.01 345 345
512.02 293 293
Census Tract Total 638 638
513 513.01 421 2 2 425
513.02 326 1 55 108 490
Census Tract Total 747 3 57 108 915
514 514.01 833 220 1,053
514.02 102 100 50 252
Census Tract Total 102 933 50 220 1,305
515 515.01 57 36 562 310 965
515.02 315 77 81 2 827 1,302
515.03 256 213 310 49 828
515.04 48 30 888 966
Census Tract Total 676 356 81 1,762 359 827 4,061
(Continued)
VI-25
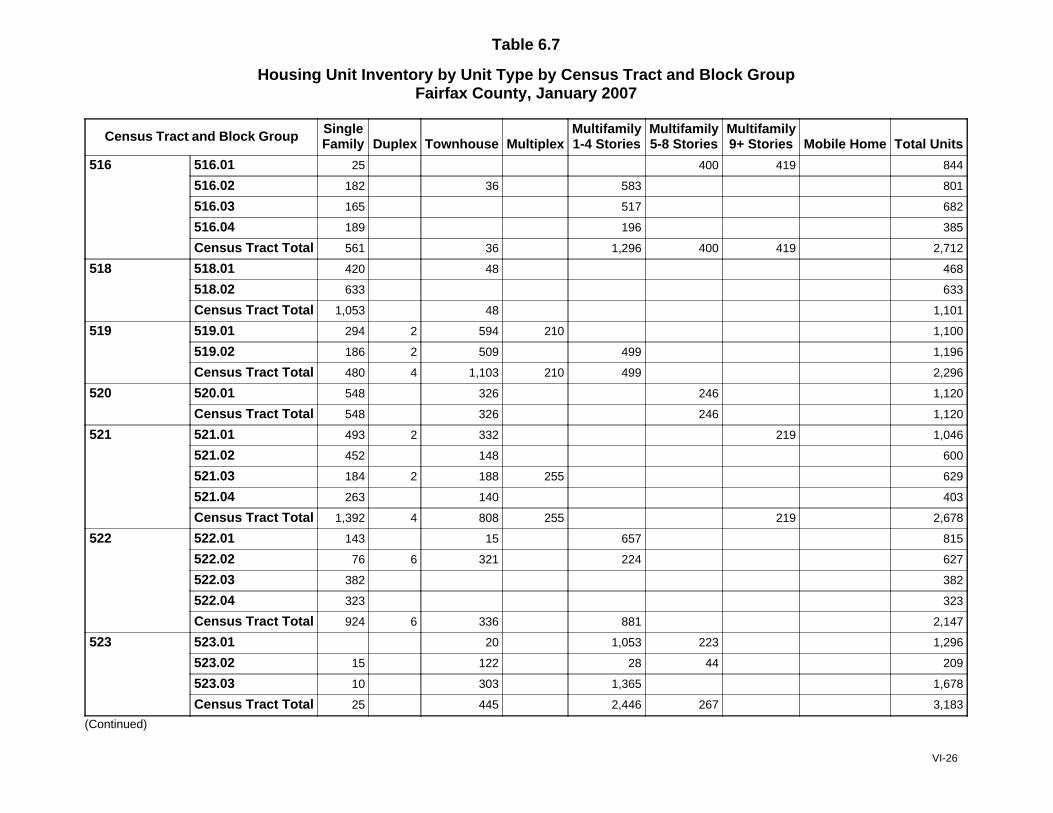
Table 6.7
Housing Unit Inventory by Unit Type by Census Tract and Block GroupFairfax County, January 2007
Census Tract and Block Group SingleFamily Duplex Townhouse Multiplex
Multifamily1-4 Stories
Multifamily5-8 Stories
Multifamily9+ Stories Mobile Home Total Units
516 516.01 25 400 419 844
516.02 182 36 583 801
516.03 165 517 682
516.04 189 196 385
Census Tract Total 561 36 1,296 400 419 2,712
518 518.01 420 48 468
518.02 633 633
Census Tract Total 1,053 48 1,101
519 519.01 294 2 594 210 1,100
519.02 186 2 509 499 1,196
Census Tract Total 480 4 1,103 210 499 2,296
520 520.01 548 326 246 1,120
Census Tract Total 548 326 246 1,120
521 521.01 493 2 332 219 1,046
521.02 452 148 600
521.03 184 2 188 255 629
521.04 263 140 403
Census Tract Total 1,392 4 808 255 219 2,678
522 522.01 143 15 657 815
522.02 76 6 321 224 627
522.03 382 382
522.04 323 323
Census Tract Total 924 6 336 881 2,147
523 523.01 20 1,053 223 1,296
523.02 15 122 28 44 209
523.03 10 303 1,365 1,678
Census Tract Total 25 445 2,446 267 3,183
(Continued)
VI-26
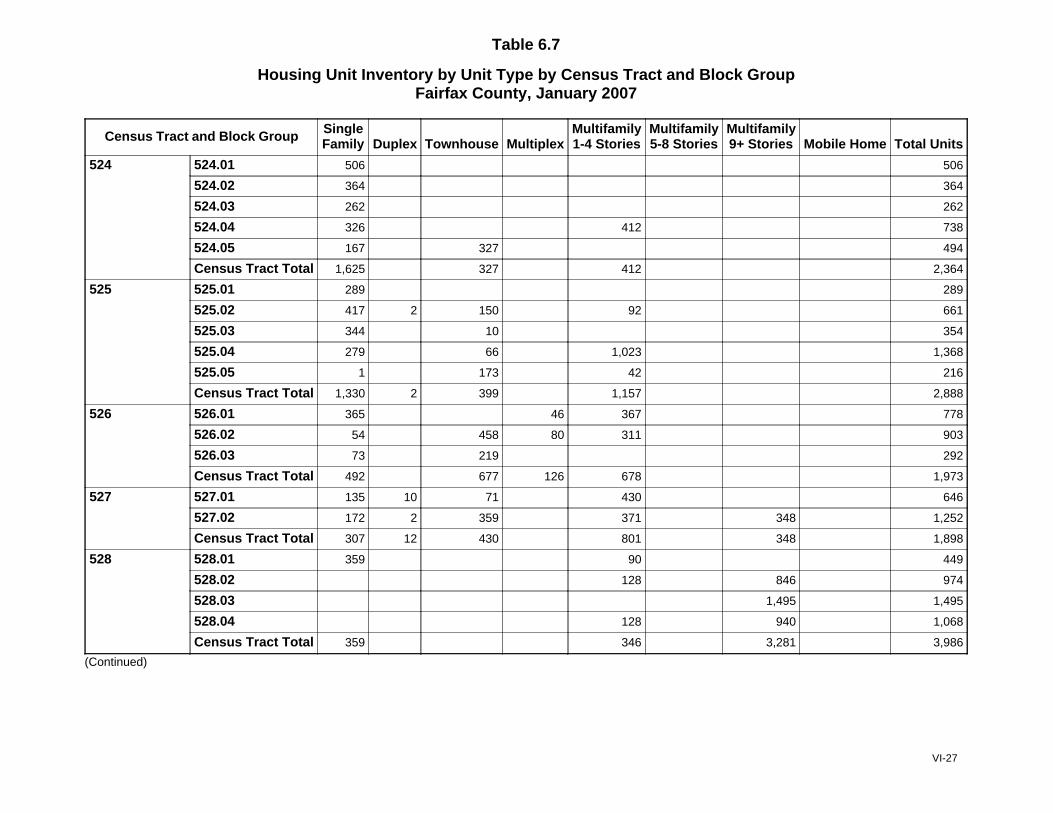
Table 6.7
Housing Unit Inventory by Unit Type by Census Tract and Block GroupFairfax County, January 2007
Census Tract and Block Group SingleFamily Duplex Townhouse Multiplex
Multifamily1-4 Stories
Multifamily5-8 Stories
Multifamily9+ Stories Mobile Home Total Units
524 524.01 506 506
524.02 364 364
524.03 262 262
524.04 326 412 738
524.05 167 327 494
Census Tract Total 1,625 327 412 2,364
525 525.01 289 289
525.02 417 2 150 92 661
525.03 344 10 354
525.04 279 66 1,023 1,368
525.05 1 173 42 216
Census Tract Total 1,330 2 399 1,157 2,888
526 526.01 365 46 367 778
526.02 54 458 80 311 903
526.03 73 219 292
Census Tract Total 492 677 126 678 1,973
527 527.01 135 10 71 430 646
527.02 172 2 359 371 348 1,252
Census Tract Total 307 12 430 801 348 1,898
528 528.01 359 90 449
528.02 128 846 974
528.03 1,495 1,495
528.04 128 940 1,068
Census Tract Total 359 346 3,281 3,986
(Continued)
VI-27
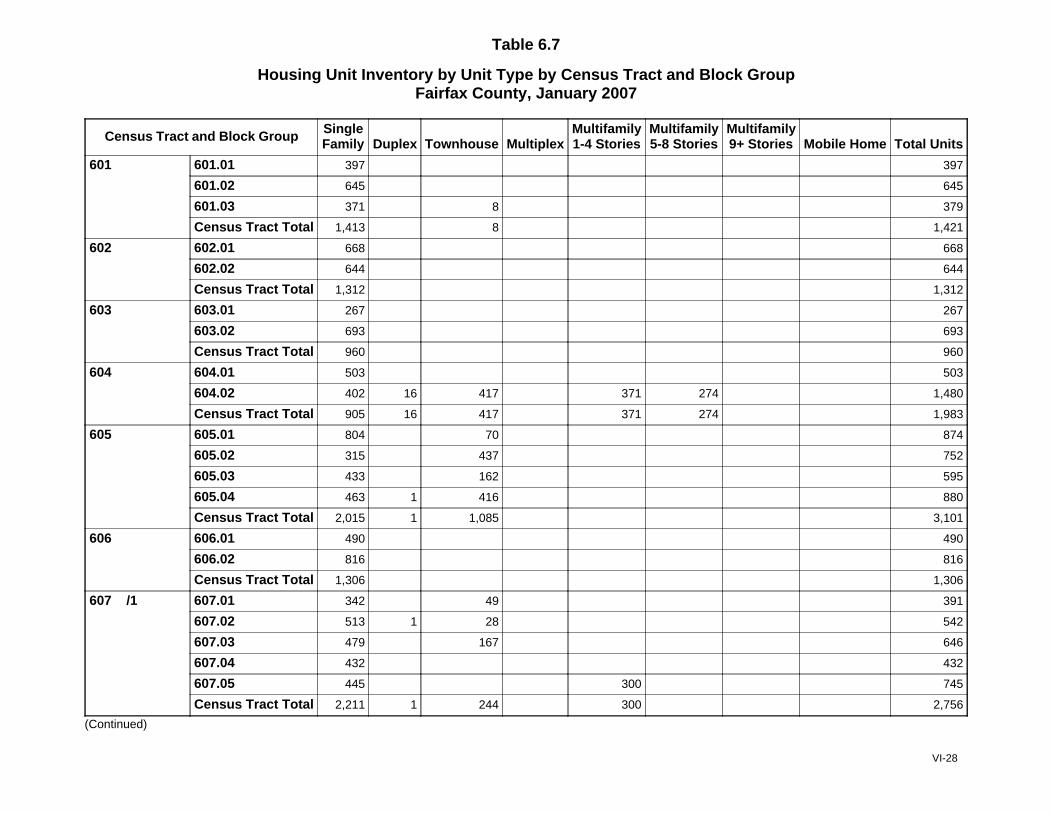
Table 6.7
Housing Unit Inventory by Unit Type by Census Tract and Block GroupFairfax County, January 2007
Census Tract and Block Group SingleFamily Duplex Townhouse Multiplex
Multifamily1-4 Stories
Multifamily5-8 Stories
Multifamily9+ Stories Mobile Home Total Units
601 601.01 397 397
601.02 645 645
601.03 371 8 379
Census Tract Total 1,413 8 1,421
602 602.01 668 668
602.02 644 644
Census Tract Total 1,312 1,312
603 603.01 267 267
603.02 693 693
Census Tract Total 960 960
604 604.01 503 503
604.02 402 16 417 371 274 1,480
Census Tract Total 905 16 417 371 274 1,983
605 605.01 804 70 874
605.02 315 437 752
605.03 433 162 595
605.04 463 1 416 880
Census Tract Total 2,015 1 1,085 3,101
606 606.01 490 490
606.02 816 816
Census Tract Total 1,306 1,306
607 /1 607.01 342 49 391
607.02 513 1 28 542
607.03 479 167 646
607.04 432 432
607.05 445 300 745
Census Tract Total 2,211 1 244 300 2,756
(Continued)
VI-28
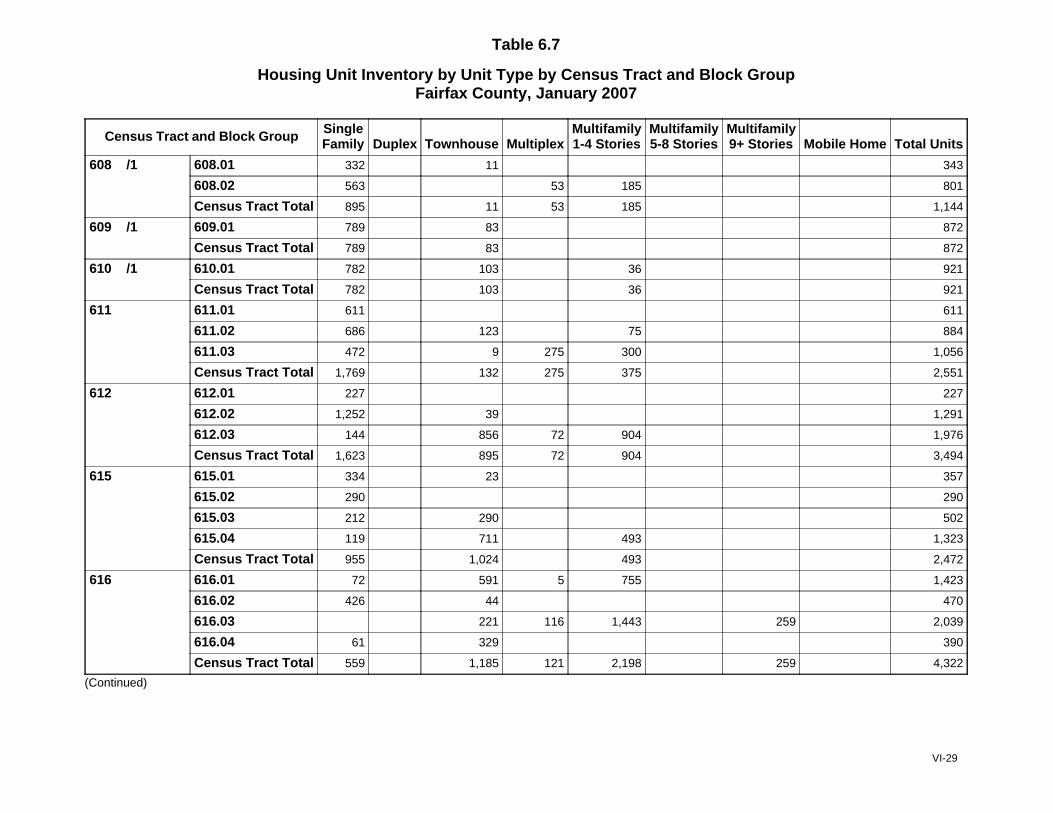
Table 6.7
Housing Unit Inventory by Unit Type by Census Tract and Block GroupFairfax County, January 2007
Census Tract and Block Group SingleFamily Duplex Townhouse Multiplex
Multifamily1-4 Stories
Multifamily5-8 Stories
Multifamily9+ Stories Mobile Home Total Units
608 /1 608.01 332 11 343
608.02 563 53 185 801
Census Tract Total 895 11 53 185 1,144
609 /1 609.01 789 83 872
Census Tract Total 789 83 872
610 /1 610.01 782 103 36 921
Census Tract Total 782 103 36 921
611 611.01 611 611
611.02 686 123 75 884
611.03 472 9 275 300 1,056
Census Tract Total 1,769 132 275 375 2,551
612 612.01 227 227
612.02 1,252 39 1,291
612.03 144 856 72 904 1,976
Census Tract Total 1,623 895 72 904 3,494
615 615.01 334 23 357
615.02 290 290
615.03 212 290 502
615.04 119 711 493 1,323
Census Tract Total 955 1,024 493 2,472
616 616.01 72 591 5 755 1,423
616.02 426 44 470
616.03 221 116 1,443 259 2,039
616.04 61 329 390
Census Tract Total 559 1,185 121 2,198 259 4,322
(Continued)
VI-29
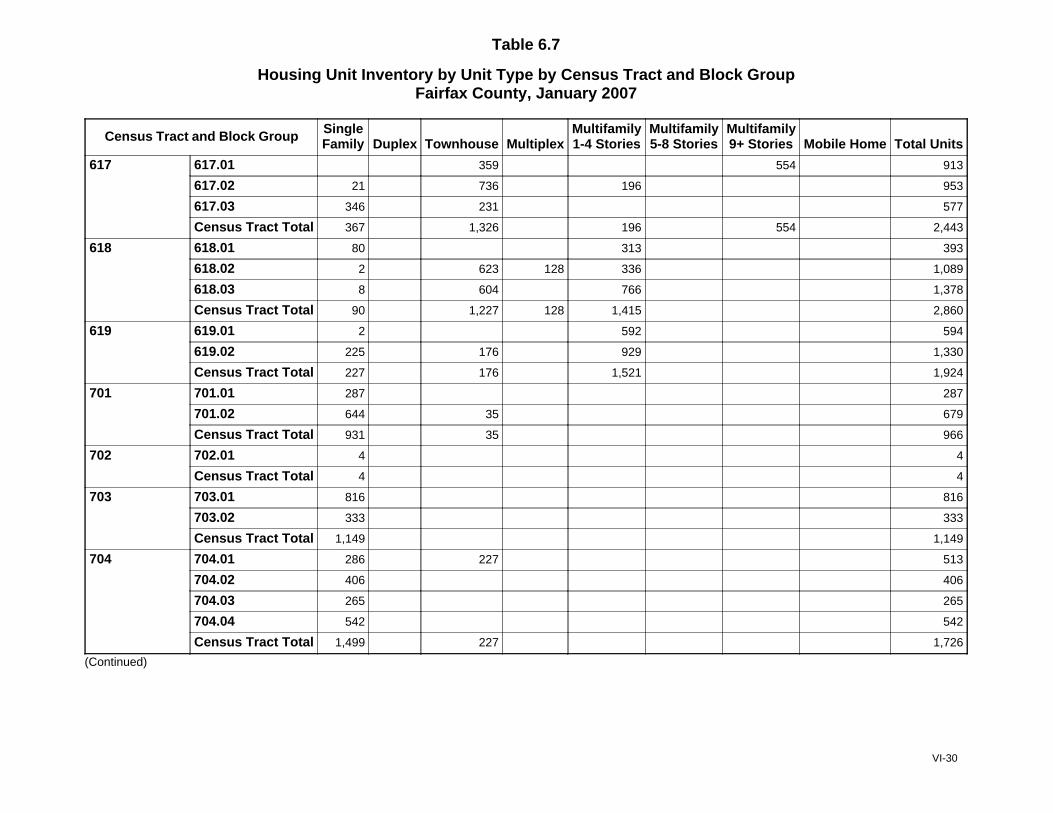
Table 6.7
Housing Unit Inventory by Unit Type by Census Tract and Block GroupFairfax County, January 2007
Census Tract and Block Group SingleFamily Duplex Townhouse Multiplex
Multifamily1-4 Stories
Multifamily5-8 Stories
Multifamily9+ Stories Mobile Home Total Units
617 617.01 359 554 913
617.02 21 736 196 953
617.03 346 231 577
Census Tract Total 367 1,326 196 554 2,443
618 618.01 80 313 393
618.02 2 623 128 336 1,089
618.03 8 604 766 1,378
Census Tract Total 90 1,227 128 1,415 2,860
619 619.01 2 592 594
619.02 225 176 929 1,330
Census Tract Total 227 176 1,521 1,924
701 701.01 287 287
701.02 644 35 679
Census Tract Total 931 35 966
702 702.01 4 4
Census Tract Total 4 4
703 703.01 816 816
703.02 333 333
Census Tract Total 1,149 1,149
704 704.01 286 227 513
704.02 406 406
704.03 265 265
704.04 542 542
Census Tract Total 1,499 227 1,726
(Continued)
VI-30
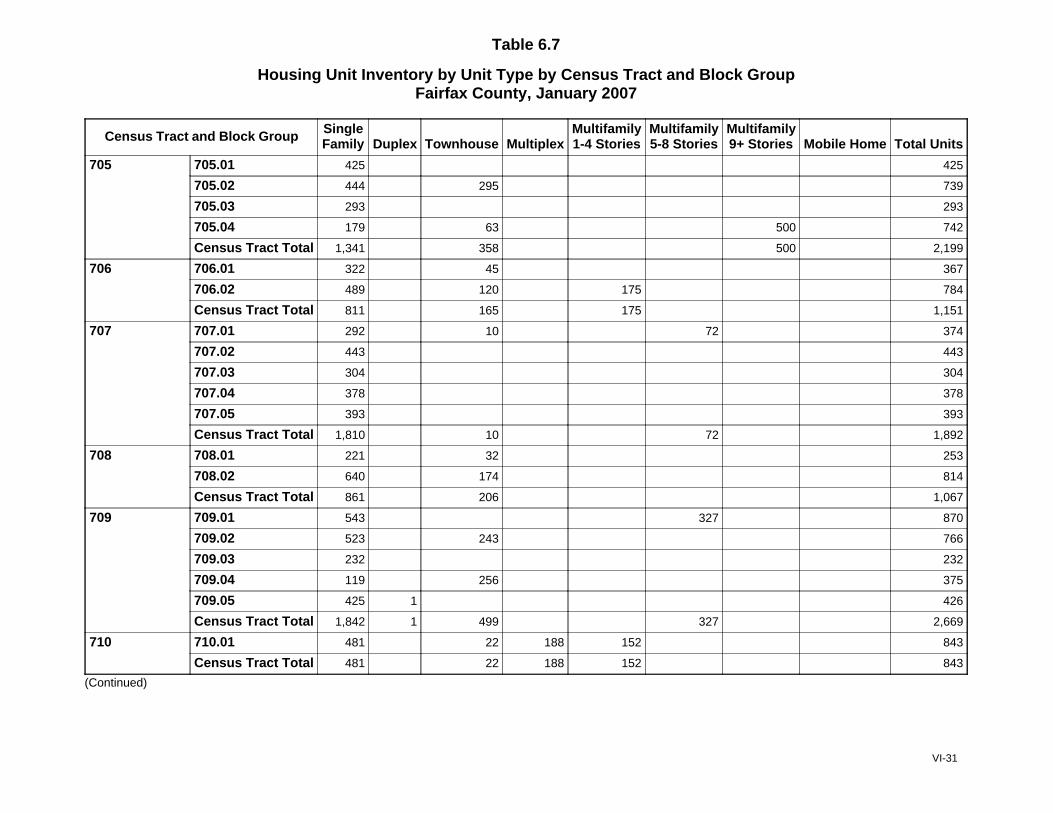
Table 6.7
Housing Unit Inventory by Unit Type by Census Tract and Block GroupFairfax County, January 2007
Census Tract and Block Group SingleFamily Duplex Townhouse Multiplex
Multifamily1-4 Stories
Multifamily5-8 Stories
Multifamily9+ Stories Mobile Home Total Units
705 705.01 425 425
705.02 444 295 739
705.03 293 293
705.04 179 63 500 742
Census Tract Total 1,341 358 500 2,199
706 706.01 322 45 367
706.02 489 120 175 784
Census Tract Total 811 165 175 1,151
707 707.01 292 10 72 374
707.02 443 443
707.03 304 304
707.04 378 378
707.05 393 393
Census Tract Total 1,810 10 72 1,892
708 708.01 221 32 253
708.02 640 174 814
Census Tract Total 861 206 1,067
709 709.01 543 327 870
709.02 523 243 766
709.03 232 232
709.04 119 256 375
709.05 425 1 426
Census Tract Total 1,842 1 499 327 2,669
710 710.01 481 22 188 152 843
Census Tract Total 481 22 188 152 843
(Continued)
VI-31
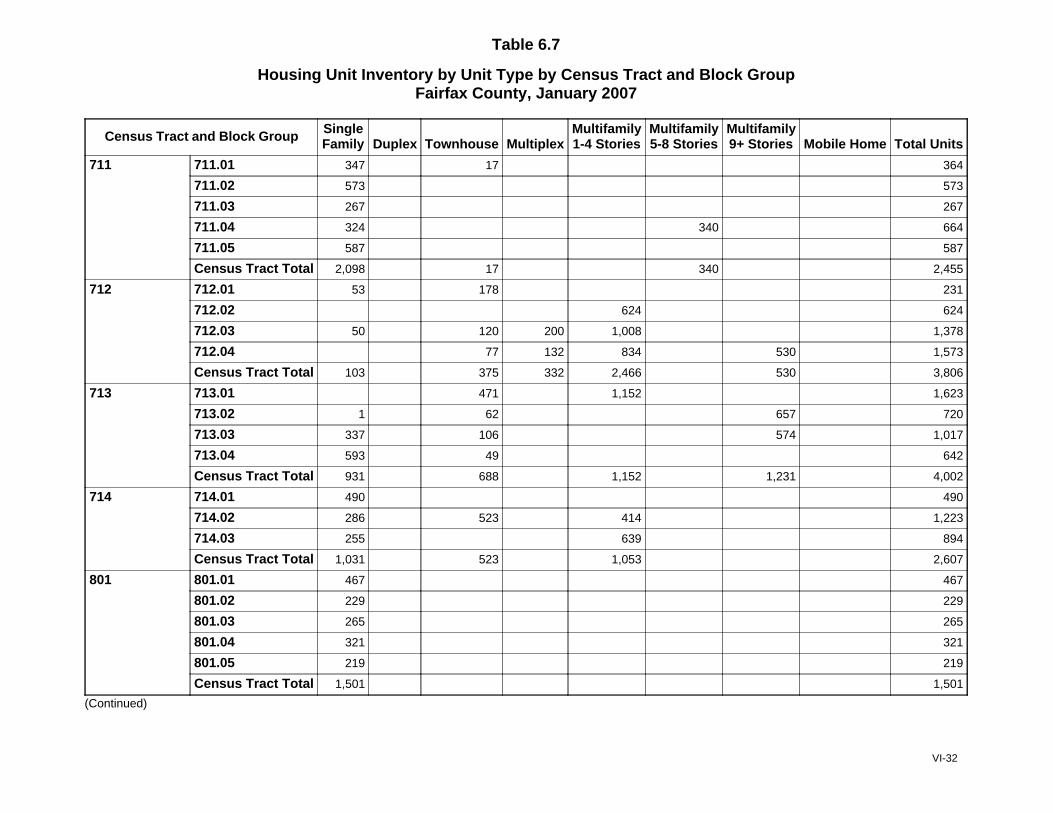
Table 6.7
Housing Unit Inventory by Unit Type by Census Tract and Block GroupFairfax County, January 2007
Census Tract and Block Group SingleFamily Duplex Townhouse Multiplex
Multifamily1-4 Stories
Multifamily5-8 Stories
Multifamily9+ Stories Mobile Home Total Units
711 711.01 347 17 364
711.02 573 573
711.03 267 267
711.04 324 340 664
711.05 587 587
Census Tract Total 2,098 17 340 2,455
712 712.01 53 178 231
712.02 624 624
712.03 50 120 200 1,008 1,378
712.04 77 132 834 530 1,573
Census Tract Total 103 375 332 2,466 530 3,806
713 713.01 471 1,152 1,623
713.02 1 62 657 720
713.03 337 106 574 1,017
713.04 593 49 642
Census Tract Total 931 688 1,152 1,231 4,002
714 714.01 490 490
714.02 286 523 414 1,223
714.03 255 639 894
Census Tract Total 1,031 523 1,053 2,607
801 801.01 467 467
801.02 229 229
801.03 265 265
801.04 321 321
801.05 219 219
Census Tract Total 1,501 1,501
(Continued)
VI-32
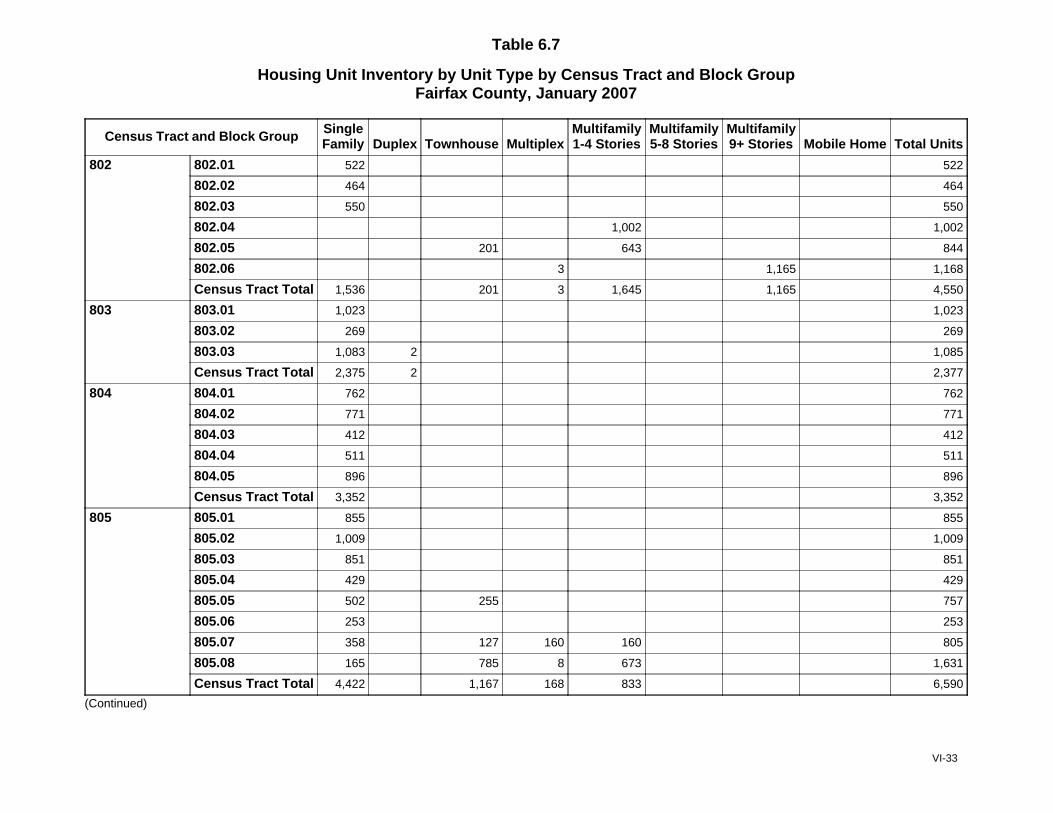
Table 6.7
Housing Unit Inventory by Unit Type by Census Tract and Block GroupFairfax County, January 2007
Census Tract and Block Group SingleFamily Duplex Townhouse Multiplex
Multifamily1-4 Stories
Multifamily5-8 Stories
Multifamily9+ Stories Mobile Home Total Units
802 802.01 522 522
802.02 464 464
802.03 550 550
802.04 1,002 1,002
802.05 201 643 844
802.06 3 1,165 1,168
Census Tract Total 1,536 201 3 1,645 1,165 4,550
803 803.01 1,023 1,023
803.02 269 269
803.03 1,083 2 1,085
Census Tract Total 2,375 2 2,377
804 804.01 762 762
804.02 771 771
804.03 412 412
804.04 511 511
804.05 896 896
Census Tract Total 3,352 3,352
805 805.01 855 855
805.02 1,009 1,009
805.03 851 851
805.04 429 429
805.05 502 255 757
805.06 253 253
805.07 358 127 160 160 805
805.08 165 785 8 673 1,631
Census Tract Total 4,422 1,167 168 833 6,590
(Continued)
VI-33
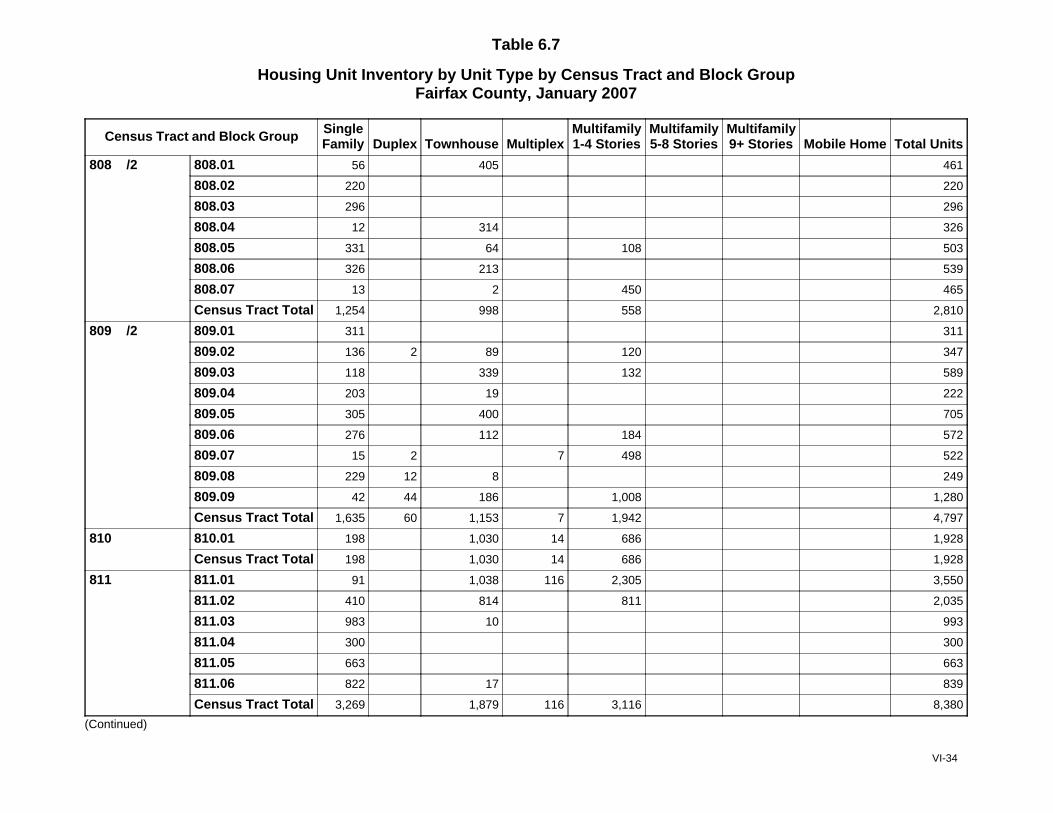
Table 6.7
Housing Unit Inventory by Unit Type by Census Tract and Block GroupFairfax County, January 2007
Census Tract and Block Group SingleFamily Duplex Townhouse Multiplex
Multifamily1-4 Stories
Multifamily5-8 Stories
Multifamily9+ Stories Mobile Home Total Units
808 /2 808.01 56 405 461
808.02 220 220
808.03 296 296
808.04 12 314 326
808.05 331 64 108 503
808.06 326 213 539
808.07 13 2 450 465
Census Tract Total 1,254 998 558 2,810
809 /2 809.01 311 311
809.02 136 2 89 120 347
809.03 118 339 132 589
809.04 203 19 222
809.05 305 400 705
809.06 276 112 184 572
809.07 15 2 7 498 522
809.08 229 12 8 249
809.09 42 44 186 1,008 1,280
Census Tract Total 1,635 60 1,153 7 1,942 4,797
810 810.01 198 1,030 14 686 1,928
Census Tract Total 198 1,030 14 686 1,928
811 811.01 91 1,038 116 2,305 3,550
811.02 410 814 811 2,035
811.03 983 10 993
811.04 300 300
811.05 663 663
811.06 822 17 839
Census Tract Total 3,269 1,879 116 3,116 8,380
(Continued)
VI-34
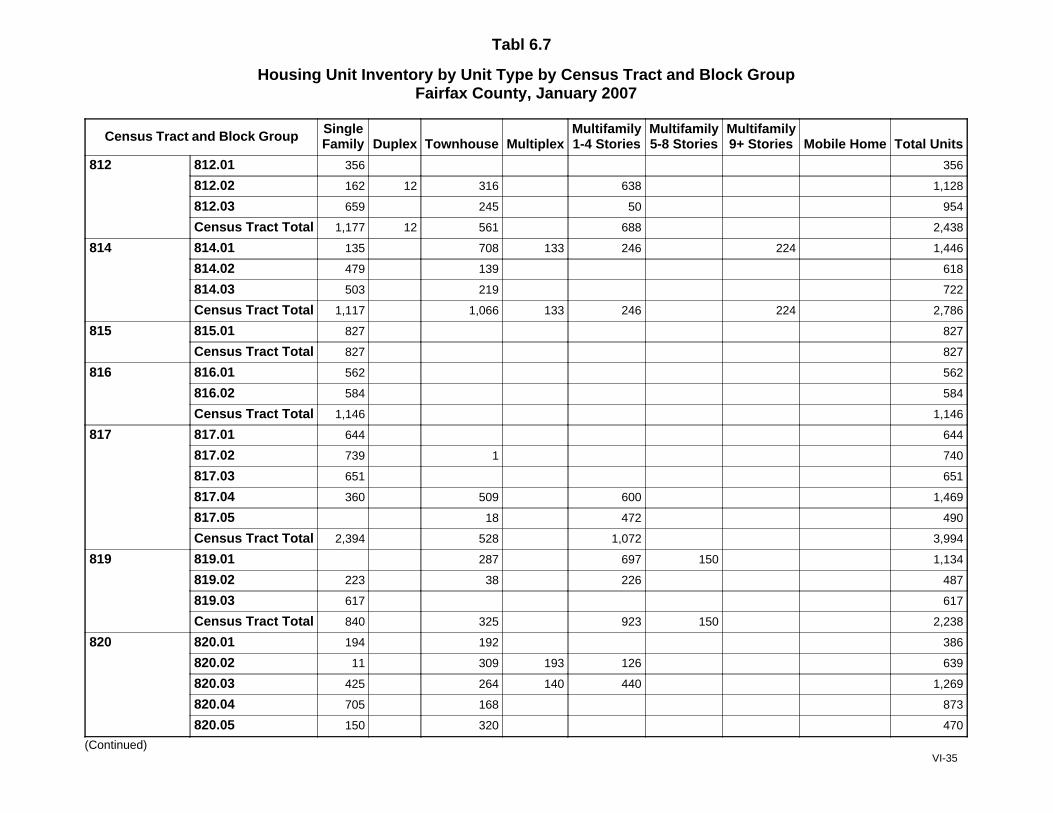
Tabl 6.7
Housing Unit Inventory by Unit Type by Census Tract and Block GroupFairfax County, January 2007
Census Tract and Block Group SingleFamily Duplex Townhouse Multiplex
Multifamily1-4 Stories
Multifamily5-8 Stories
Multifamily9+ Stories Mobile Home Total Units
812 812.01 356 356
812.02 162 12 316 638 1,128
812.03 659 245 50 954
Census Tract Total 1,177 12 561 688 2,438
814 814.01 135 708 133 246 224 1,446
814.02 479 139 618
814.03 503 219 722
Census Tract Total 1,117 1,066 133 246 224 2,786
815 815.01 827 827
Census Tract Total 827 827
816 816.01 562 562
816.02 584 584
Census Tract Total 1,146 1,146
817 817.01 644 644
817.02 739 1 740
817.03 651 651
817.04 360 509 600 1,469
817.05 18 472 490
Census Tract Total 2,394 528 1,072 3,994
819 819.01 287 697 150 1,134
819.02 223 38 226 487
819.03 617 617
Census Tract Total 840 325 923 150 2,238
820 820.01 194 192 386
820.02 11 309 193 126 639
820.03 425 264 140 440 1,269
820.04 705 168 873
820.05 150 320 470
(Continued)VI-35
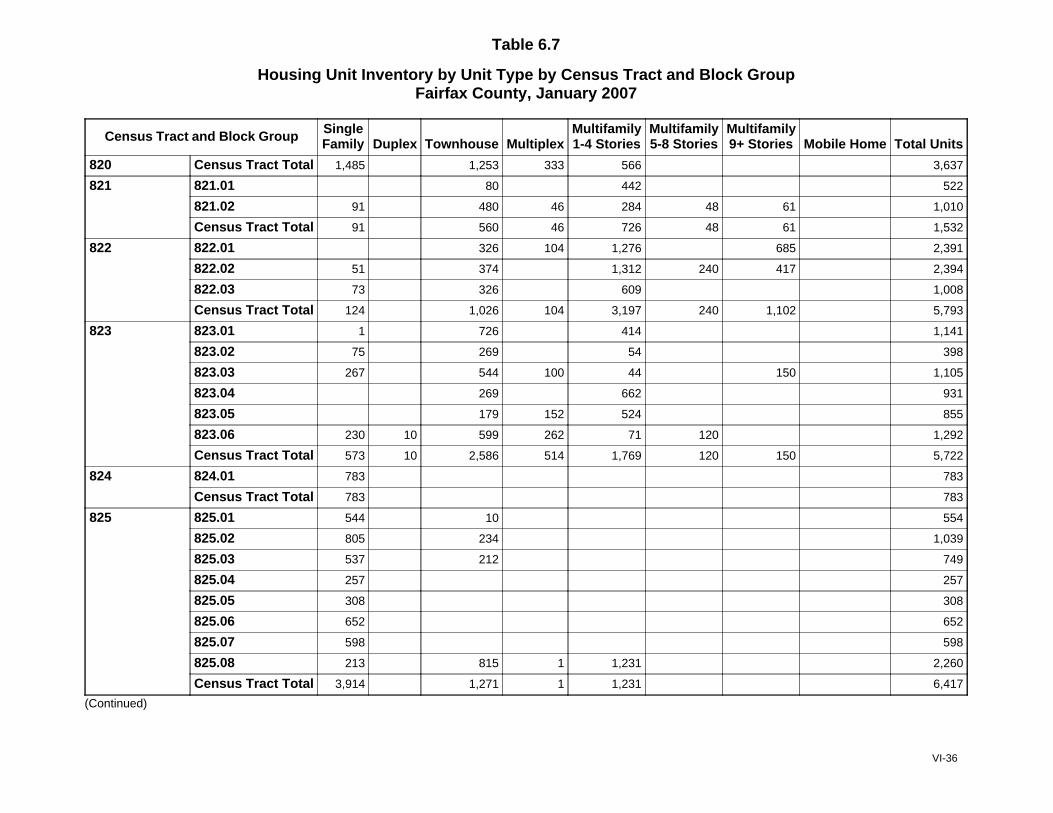
Table 6.7
Housing Unit Inventory by Unit Type by Census Tract and Block GroupFairfax County, January 2007
Census Tract and Block Group SingleFamily Duplex Townhouse Multiplex
Multifamily1-4 Stories
Multifamily5-8 Stories
Multifamily9+ Stories Mobile Home Total Units
Census Tract Total 1,485 1,253 333 566 3,637820
821 821.01 80 442 522
821.02 91 480 46 284 48 61 1,010
Census Tract Total 91 560 46 726 48 61 1,532
822 822.01 326 104 1,276 685 2,391
822.02 51 374 1,312 240 417 2,394
822.03 73 326 609 1,008
Census Tract Total 124 1,026 104 3,197 240 1,102 5,793
823 823.01 1 726 414 1,141
823.02 75 269 54 398
823.03 267 544 100 44 150 1,105
823.04 269 662 931
823.05 179 152 524 855
823.06 230 10 599 262 71 120 1,292
Census Tract Total 573 10 2,586 514 1,769 120 150 5,722
824 824.01 783 783
Census Tract Total 783 783
825 825.01 544 10 554
825.02 805 234 1,039
825.03 537 212 749
825.04 257 257
825.05 308 308
825.06 652 652
825.07 598 598
825.08 213 815 1 1,231 2,260
Census Tract Total 3,914 1,271 1 1,231 6,417
(Continued)
VI-36
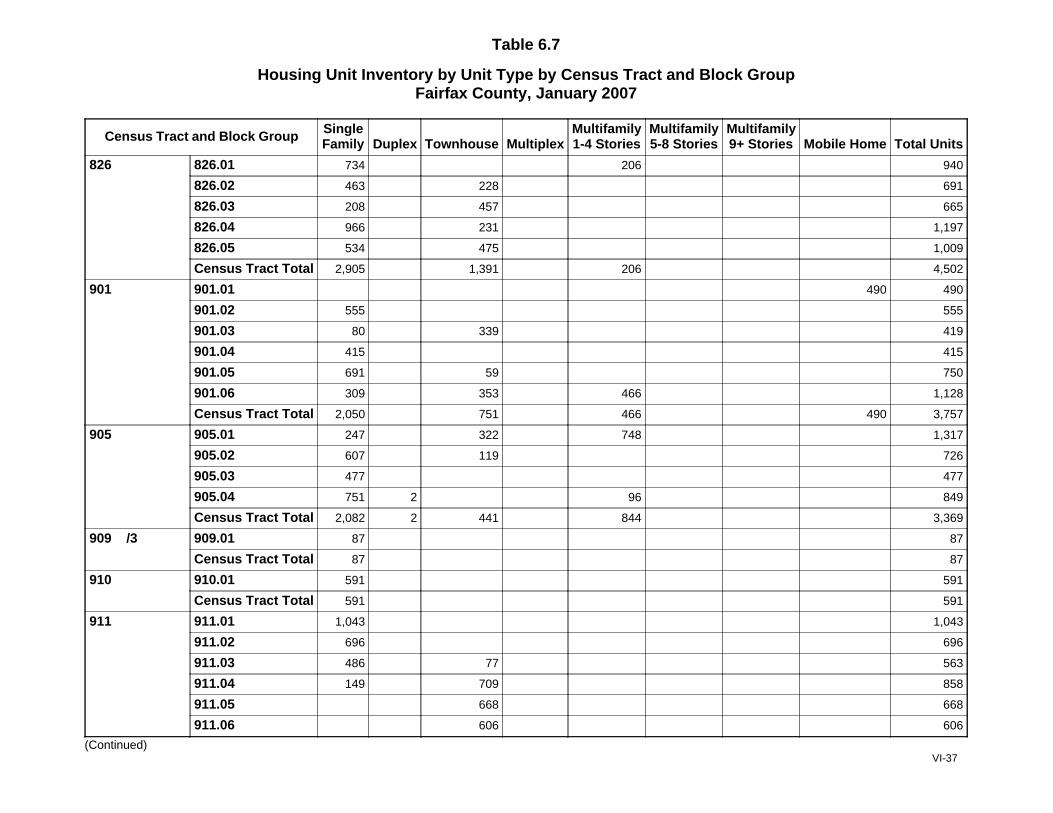
Table 6.7
Housing Unit Inventory by Unit Type by Census Tract and Block GroupFairfax County, January 2007
Census Tract and Block Group SingleFamily Duplex Townhouse Multiplex
Multifamily1-4 Stories
Multifamily5-8 Stories
Multifamily9+ Stories Mobile Home Total Units
826 826.01 734 206 940
826.02 463 228 691
826.03 208 457 665
826.04 966 231 1,197
826.05 534 475 1,009
Census Tract Total 2,905 1,391 206 4,502
901 901.01 490 490
901.02 555 555
901.03 80 339 419
901.04 415 415
901.05 691 59 750
901.06 309 353 466 1,128
Census Tract Total 2,050 751 466 490 3,757
905 905.01 247 322 748 1,317
905.02 607 119 726
905.03 477 477
905.04 751 2 96 849
Census Tract Total 2,082 2 441 844 3,369
909 /3 909.01 87 87
Census Tract Total 87 87
910 910.01 591 591
Census Tract Total 591 591
911 911.01 1,043 1,043
911.02 696 696
911.03 486 77 563
911.04 149 709 858
911.05 668 668
911.06 606 606
(Continued)VI-37
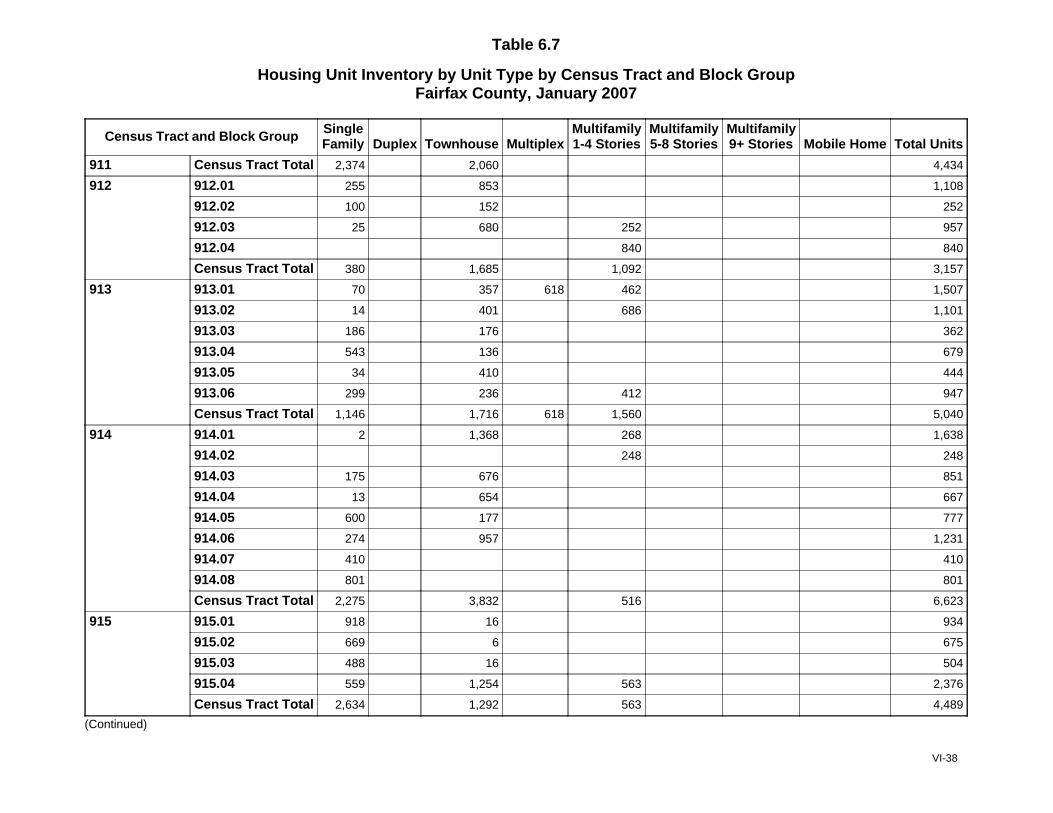
Table 6.7
Housing Unit Inventory by Unit Type by Census Tract and Block GroupFairfax County, January 2007
Census Tract and Block Group SingleFamily Duplex Townhouse Multiplex
Multifamily1-4 Stories
Multifamily5-8 Stories
Multifamily9+ Stories Mobile Home Total Units
Census Tract Total 2,374 2,060 4,434911
912 912.01 255 853 1,108
912.02 100 152 252
912.03 25 680 252 957
912.04 840 840
Census Tract Total 380 1,685 1,092 3,157
913 913.01 70 357 618 462 1,507
913.02 14 401 686 1,101
913.03 186 176 362
913.04 543 136 679
913.05 34 410 444
913.06 299 236 412 947
Census Tract Total 1,146 1,716 618 1,560 5,040
914 914.01 2 1,368 268 1,638
914.02 248 248
914.03 175 676 851
914.04 13 654 667
914.05 600 177 777
914.06 274 957 1,231
914.07 410 410
914.08 801 801
Census Tract Total 2,275 3,832 516 6,623
915 915.01 918 16 934
915.02 669 6 675
915.03 488 16 504
915.04 559 1,254 563 2,376
Census Tract Total 2,634 1,292 563 4,489
(Continued)
VI-38
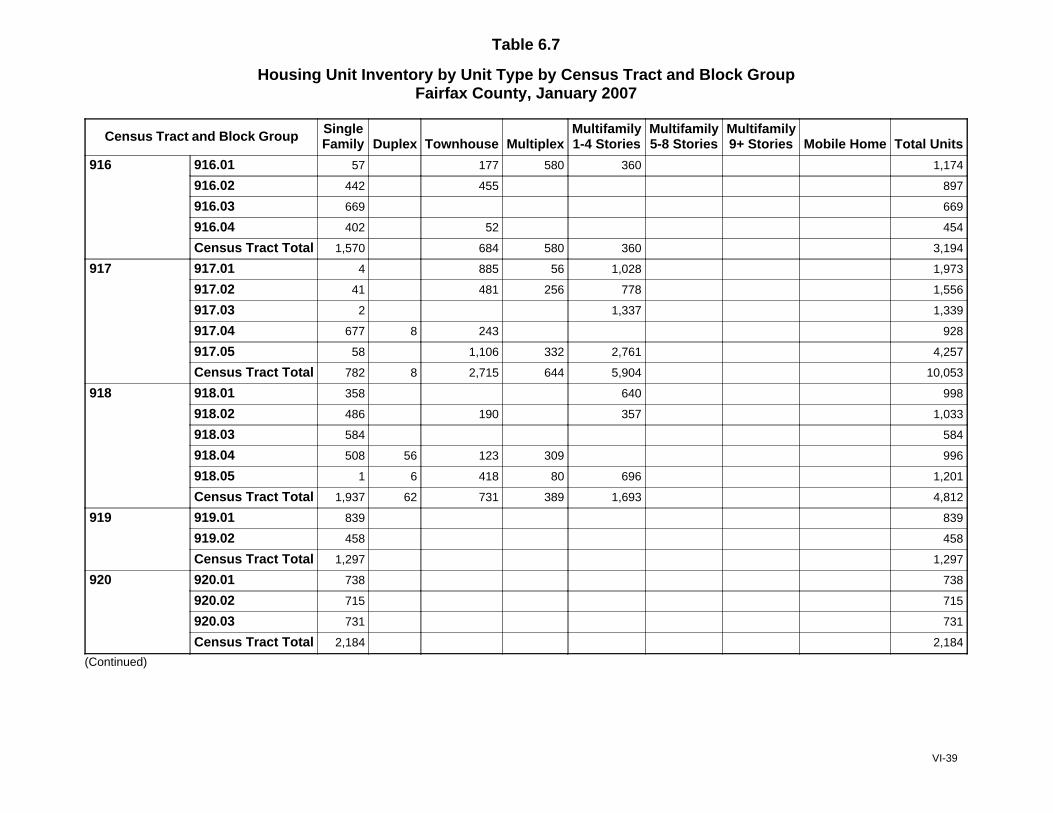
Table 6.7
Housing Unit Inventory by Unit Type by Census Tract and Block GroupFairfax County, January 2007
Census Tract and Block Group SingleFamily Duplex Townhouse Multiplex
Multifamily1-4 Stories
Multifamily5-8 Stories
Multifamily9+ Stories Mobile Home Total Units
916 916.01 57 177 580 360 1,174
916.02 442 455 897
916.03 669 669
916.04 402 52 454
Census Tract Total 1,570 684 580 360 3,194
917 917.01 4 885 56 1,028 1,973
917.02 41 481 256 778 1,556
917.03 2 1,337 1,339
917.04 677 8 243 928
917.05 58 1,106 332 2,761 4,257
Census Tract Total 782 8 2,715 644 5,904 10,053
918 918.01 358 640 998
918.02 486 190 357 1,033
918.03 584 584
918.04 508 56 123 309 996
918.05 1 6 418 80 696 1,201
Census Tract Total 1,937 62 731 389 1,693 4,812
919 919.01 839 839
919.02 458 458
Census Tract Total 1,297 1,297
920 920.01 738 738
920.02 715 715
920.03 731 731
Census Tract Total 2,184 2,184
(Continued)
VI-39
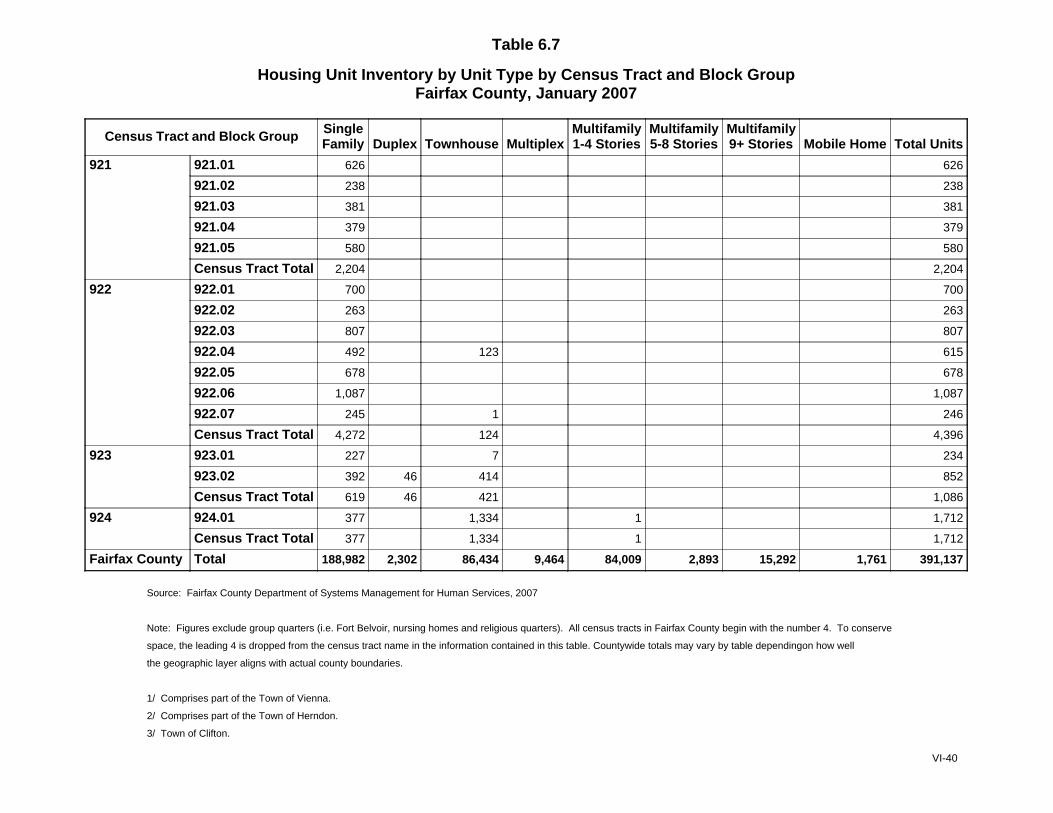
Table 6.7
Housing Unit Inventory by Unit Type by Census Tract and Block GroupFairfax County, January 2007
Census Tract and Block Group SingleFamily Duplex Townhouse Multiplex
Multifamily1-4 Stories
Multifamily5-8 Stories
Multifamily9+ Stories Mobile Home Total Units
921 921.01 626 626
921.02 238 238
921.03 381 381
921.04 379 379
921.05 580 580
Census Tract Total 2,204 2,204
922 922.01 700 700
922.02 263 263
922.03 807 807
922.04 492 123 615
922.05 678 678
922.06 1,087 1,087
922.07 245 1 246
Census Tract Total 4,272 124 4,396
923 923.01 227 7 234
923.02 392 46 414 852
Census Tract Total 619 46 421 1,086
924 924.01 377 1,334 1 1,712
Census Tract Total 377 1,334 1 1,712
Fairfax County Total 188,982 2,302 86,434 9,464 84,009 2,893 15,292 1,761 391,137
Source: Fairfax County Department of Systems Management for Human Services, 2007
Note: Figures exclude group quarters (i.e. Fort Belvoir, nursing homes and religious quarters). All census tracts in Fairfax County begin with the number 4. To conserve
space, the leading 4 is dropped from the census tract name in the information contained in this table. Countywide totals may vary by table dependingon how well
the geographic layer aligns with actual county boundaries.
1/ Comprises part of the Town of Vienna.
2/ Comprises part of the Town of Herndon.
3/ Town of Clifton.
VI-40

Table 6.8
Housing Unit Inventory by Year Built and Supervisor DistrictFairfax County, January 2007
Housing Unit Inventory by Year Built and Supervisor DistrictFairfax County, January 2007
Year Built BraddockDranesville
1/Hunter Mill
2/ Lee MasonMountVernon Providence
Springfield3/ Sully
FairfaxCounty
Units Pct Units Pct Units Pct Units Pct Units Pct Units Pct Units Pct Units Pct Units Pct Units Pct
Before 1960 2,859 7.8 7,163 17.9 3,154 6.2 8,368 20.1 13,586 34.7 8,434 18.5 6,138 12.7 798 1.8 303 0.7 50,803 13.0
1960 to 1969 12,049 32.8 5,601 14.0 5,741 11.3 7,138 17.1 10,260 26.2 9,783 21.5 10,824 22.4 4,405 9.7 1,832 4.4 67,633 17.4
1970 to 1979 12,480 33.9 10,577 26.5 14,876 29.2 6,210 14.9 6,867 17.5 8,026 17.6 11,451 23.7 9,300 20.4 3,674 8.8 83,461 21.4
1980 to 1989 8,133 22.1 8,187 20.5 10,078 19.8 8,258 19.8 5,788 14.8 10,122 22.2 9,584 19.9 15,123 33.2 18,852 45.2 94,125 24.2
1990 to 1999 786 2.1 4,839 12.1 9,836 19.3 8,636 20.7 1,673 4.3 3,768 8.3 5,927 12.3 9,710 21.3 11,787 28.3 56,962 14.6
2000 to 2007 457 1.2 3,584 9.0 7,184 14.1 3,091 7.4 997 2.5 5,396 11.9 4,319 9.0 6,152 13.5 5,214 12.5 36,394 9.3
Total Units 36,764 100.0 39,950 100.0 50,869 100.0 41,701 100.0 39,171 100.0 45,529 100.0 48,243 100.0 45,488 100.0 41,662 100.0 389,377 100.0
Table 6.9
Housing Unit Inventory by Year Built and TownFairfax County, January 2007
Year Built Clifton Herndon ViennaTownsTotal
Units Pct Units Pct Units Pct Units Pct
Before 1960 56 64.4 303 4.0 2,359 42.1 2,718 20.4
1960 to 1969 1 1.1 525 6.9 1,912 34.1 2,438 18.3
1970 to 1979 1 1.1 3,262 42.6 597 10.6 3,860 28.9
1980 to 1989 4 4.6 1,530 20.0 292 5.2 1,826 13.7
1990 to 1999 6 6.9 1,479 19.3 269 4.8 1,754 13.1
2000 to 2007 19 21.8 553 7.2 180 3.2 752 5.6
Total Units 87 100.0 7,652 100.0 5,609 100.0 13,348 100.0
Source: Fairfax County Department of Systems Management for Human Services, 2007
Note: Figures exclude group quarters (i.e. Fort Belvoir, nursing homes and religious quarters) and mobile homes. Countywide totals may vary by table depending on how wellthe geographic layer aligns with actual county boundaries.
1/ Includes the Town of Herndon. 2/ Includes the Town of Vienna. 3/ Includes the Town of Clifton.
VI-41
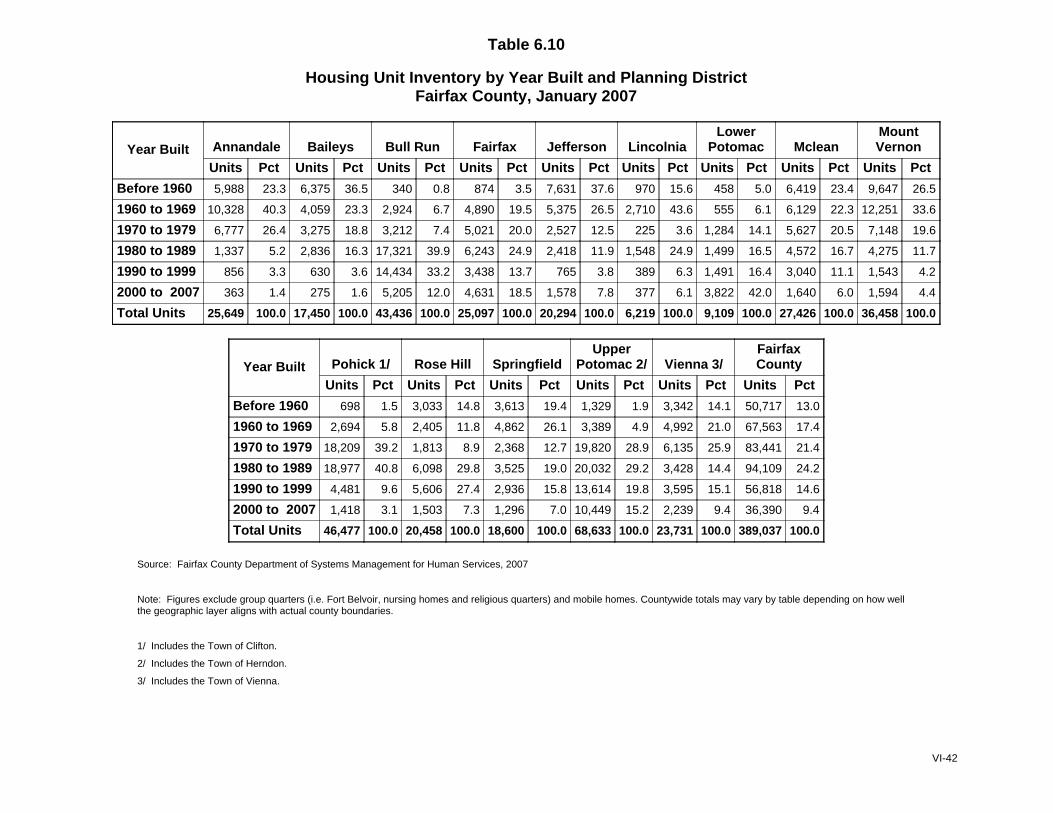
Table 6.10
Housing Unit Inventory by Year Built and Planning DistrictFairfax County, January 2007
Year Built Annandale Baileys Bull Run Fairfax Jefferson LincolniaLower
Potomac McleanMountVernon
Units Pct Units Pct Units Pct Units Pct Units Pct Units Pct Units Pct Units Pct Units Pct
Before 1960 5,988 23.3 6,375 36.5 340 0.8 874 3.5 7,631 37.6 970 15.6 458 5.0 6,419 23.4 9,647 26.5
1960 to 1969 10,328 40.3 4,059 23.3 2,924 6.7 4,890 19.5 5,375 26.5 2,710 43.6 555 6.1 6,129 22.3 12,251 33.6
1970 to 1979 6,777 26.4 3,275 18.8 3,212 7.4 5,021 20.0 2,527 12.5 225 3.6 1,284 14.1 5,627 20.5 7,148 19.6
1980 to 1989 1,337 5.2 2,836 16.3 17,321 39.9 6,243 24.9 2,418 11.9 1,548 24.9 1,499 16.5 4,572 16.7 4,275 11.7
1990 to 1999 856 3.3 630 3.6 14,434 33.2 3,438 13.7 765 3.8 389 6.3 1,491 16.4 3,040 11.1 1,543 4.2
2000 to 2007 363 1.4 275 1.6 5,205 12.0 4,631 18.5 1,578 7.8 377 6.1 3,822 42.0 1,640 6.0 1,594 4.4
Total Units 25,649 100.0 17,450 100.0 43,436 100.0 25,097 100.0 20,294 100.0 6,219 100.0 9,109 100.0 27,426 100.0 36,458 100.0
Year Built Pohick 1/ Rose Hill SpringfieldUpper
Potomac 2/ Vienna 3/FairfaxCounty
Units Pct Units Pct Units Pct Units Pct Units Pct Units Pct
Before 1960 698 1.5 3,033 14.8 3,613 19.4 1,329 1.9 3,342 14.1 50,717 13.0
1960 to 1969 2,694 5.8 2,405 11.8 4,862 26.1 3,389 4.9 4,992 21.0 67,563 17.4
1970 to 1979 18,209 39.2 1,813 8.9 2,368 12.7 19,820 28.9 6,135 25.9 83,441 21.4
1980 to 1989 18,977 40.8 6,098 29.8 3,525 19.0 20,032 29.2 3,428 14.4 94,109 24.2
1990 to 1999 4,481 9.6 5,606 27.4 2,936 15.8 13,614 19.8 3,595 15.1 56,818 14.6
2000 to 2007 1,418 3.1 1,503 7.3 1,296 7.0 10,449 15.2 2,239 9.4 36,390 9.4
Total Units 46,477 100.0 20,458 100.0 18,600 100.0 68,633 100.0 23,731 100.0 389,037 100.0
Source: Fairfax County Department of Systems Management for Human Services, 2007
Note: Figures exclude group quarters (i.e. Fort Belvoir, nursing homes and religious quarters) and mobile homes. Countywide totals may vary by table depending on how wellthe geographic layer aligns with actual county boundaries.
1/ Includes the Town of Clifton.
2/ Includes the Town of Herndon.
3/ Includes the Town of Vienna.
VI-42
HOUSING UNIT FORECASTS The forecasts of housing units in Fairfax County are based on planned residential land uses and densities, vacant and underutilized residential planned land, and residential units at various stages in the process of being developed (in the “development pipeline”). Both short-term and long-term forecasts are produced, each with different methods, with long-term forecasts building upon the short-term figures. All housing unit forecasts reflect projections as of January 1 of each year. Short-Term Forecasts The short-term housing unit forecast horizon is five years into the future. Active residential development is the primary influence on short-term forecasts. Fairfax County’s short-term forecasting method assumes that housing units in the “development pipeline” are expected to be built before units which may be planned at some future time that are not presently in that process. Furthermore, housing units in the process of being developed are expected to be completed according to their stage within the process as of January 1 of the current report year. The general stages considered are: 1) units under construction; 2) units with building permits issued but not started; 3) units shown on an approved development plan; 4) units shown on a development plan under review; 5) units shown on a development plan proffered as a
condition to a rezoning approval; and 6) units shown on a proposed development plan
submitted with a rezoning application under review.
Long-Term Forecasts The long-term housing unit forecast horizon is beyond five years in the future. After units in the development process are forecast to be completed, areas either reach buildout (no additional capacity exists for residential development according to planned land uses and exercising of plan option densities in the currently adopted Comprehensive Plan) or have additional capacity for residential development remaining on vacant or underutilized land. Additional capacity beyond buildout may be forecast over the long-term based on recent development activity that has occurred within that area. Based on the Comprehensive Plan effective January 2007, development is expected to continue throughout the forecast period (through 2035). In addition to the Comprehensive Plan information, site specific characteristics are considered in determining the likelihood of development. This includes factors such as recent sales of vacant property, resource protection areas, and location information (access to metro, sewer, steepness of land, flood plain, accessibility to the parcel, size of parcel, etc.). Three housing unit forecasts are produced – low, most likely and high forecasts. These forecasts are based on the range of density allowed in the Comprehensive Plan and the proximity of the property to characteristics that would make it more or less attractive for development. Only the most likely scenarios are published in this report.
VII-1
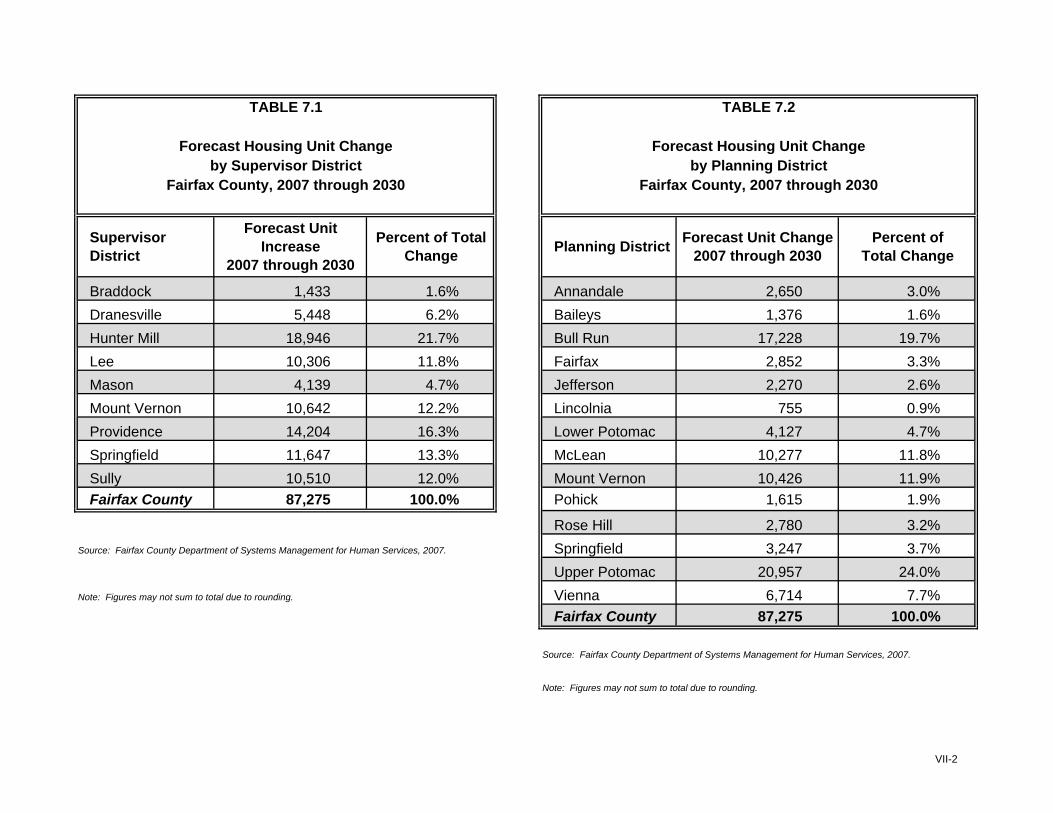
Supervisor District
Forecast Unit Increase
2007 through 2030
Percent of Total Change Planning District Forecast Unit Change
2007 through 2030Percent of
Total Change
Braddock 1,433 1.6% Annandale 2,650 3.0%Dranesville 5,448 6.2% Baileys 1,376 1.6%Hunter Mill 18,946 21.7% Bull Run 17,228 19.7%Lee 10,306 11.8% Fairfax 2,852 3.3%Mason 4,139 4.7% Jefferson 2,270 2.6%Mount Vernon 10,642 12.2% Lincolnia 755 0.9%Providence 14,204 16.3% Lower Potomac 4,127 4.7%Springfield 11,647 13.3% McLean 10,277 11.8%Sully 10,510 12.0% Mount Vernon 10,426 11.9%Fairfax County 87,275 100.0% Pohick 1,615 1.9%
Rose Hill 2,780 3.2%Springfield 3,247 3.7%Upper Potomac 20,957 24.0%Vienna 6,714 7.7%Fairfax County 87,275 100.0%
by Planning DistrictFairfax County, 2007 through 2030
TABLE 7.2
Forecast Housing Unit Change
TABLE 7.1
Forecast Housing Unit Changeby Supervisor District
Fairfax County, 2007 through 2030
Source: Fairfax County Department of Systems Management for Human Services, 2007.
Note: Figures may not sum to total due to rounding.
Source: Fairfax County Department of Systems Management for Human Services, 2007.
Note: Figures may not sum to total due to rounding.
VII-2
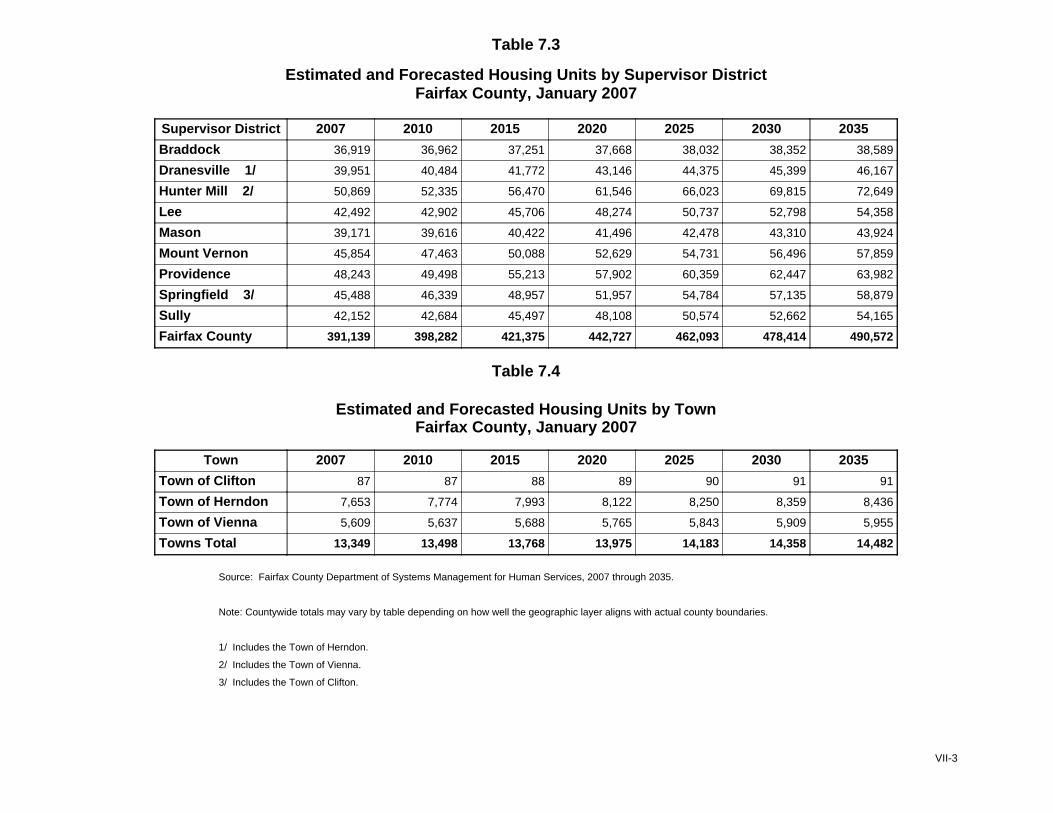
Table 7.3
Estimated and Forecasted Housing Units by Supervisor DistrictFairfax County, January 2007
Supervisor District 2007 2010 2015 2020 2025 2030 2035
Braddock 36,919 36,962 37,251 37,668 38,032 38,352 38,589
Dranesville 1/ 39,951 40,484 41,772 43,146 44,375 45,399 46,167
Hunter Mill 2/ 50,869 52,335 56,470 61,546 66,023 69,815 72,649
Lee 42,492 42,902 45,706 48,274 50,737 52,798 54,358
Mason 39,171 39,616 40,422 41,496 42,478 43,310 43,924
Mount Vernon 45,854 47,463 50,088 52,629 54,731 56,496 57,859
Providence 48,243 49,498 55,213 57,902 60,359 62,447 63,982
Springfield 3/ 45,488 46,339 48,957 51,957 54,784 57,135 58,879
Sully 42,152 42,684 45,497 48,108 50,574 52,662 54,165
Fairfax County 391,139 398,282 421,375 442,727 462,093 478,414 490,572
Table 7.4
Estimated and Forecasted Housing Units by TownFairfax County, January 2007
Town 2007 2010 2015 2020 2025 2030 2035
Town of Clifton 87 87 88 89 90 91 91
Town of Herndon 7,653 7,774 7,993 8,122 8,250 8,359 8,436
Town of Vienna 5,609 5,637 5,688 5,765 5,843 5,909 5,955
Towns Total 13,349 13,498 13,768 13,975 14,183 14,358 14,482
Source: Fairfax County Department of Systems Management for Human Services, 2007 through 2035.
Note: Countywide totals may vary by table depending on how well the geographic layer aligns with actual county boundaries.
1/ Includes the Town of Herndon.
2/ Includes the Town of Vienna.
3/ Includes the Town of Clifton.
VII-3
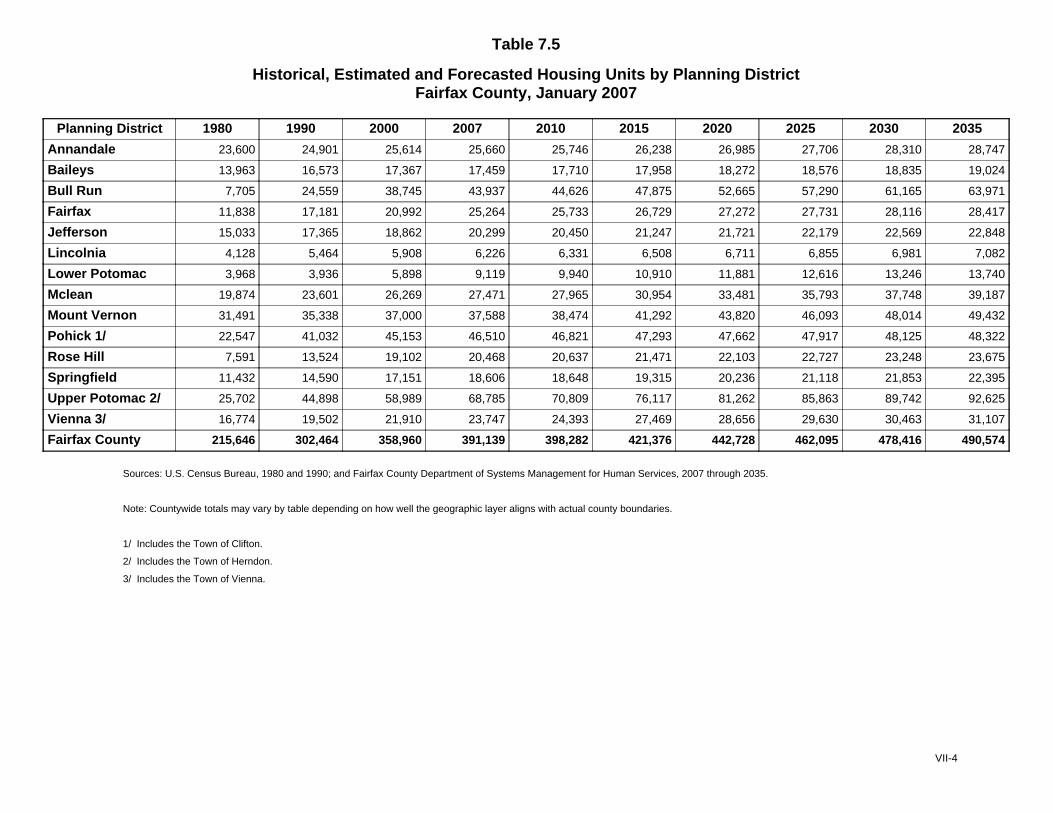
Table 7.5
Historical, Estimated and Forecasted Housing Units by Planning DistrictFairfax County, January 2007
Planning District 1980 1990 2000 2007 2010 2015 2020 2025 2030 2035
Annandale 23,600 24,901 25,614 25,660 25,746 26,238 26,985 27,706 28,310 28,747
Baileys 13,963 16,573 17,367 17,459 17,710 17,958 18,272 18,576 18,835 19,024
Bull Run 7,705 24,559 38,745 43,937 44,626 47,875 52,665 57,290 61,165 63,971
Fairfax 11,838 17,181 20,992 25,264 25,733 26,729 27,272 27,731 28,116 28,417
Jefferson 15,033 17,365 18,862 20,299 20,450 21,247 21,721 22,179 22,569 22,848
Lincolnia 4,128 5,464 5,908 6,226 6,331 6,508 6,711 6,855 6,981 7,082
Lower Potomac 3,968 3,936 5,898 9,119 9,940 10,910 11,881 12,616 13,246 13,740
Mclean 19,874 23,601 26,269 27,471 27,965 30,954 33,481 35,793 37,748 39,187
Mount Vernon 31,491 35,338 37,000 37,588 38,474 41,292 43,820 46,093 48,014 49,432
Pohick 1/ 22,547 41,032 45,153 46,510 46,821 47,293 47,662 47,917 48,125 48,322
Rose Hill 7,591 13,524 19,102 20,468 20,637 21,471 22,103 22,727 23,248 23,675
Springfield 11,432 14,590 17,151 18,606 18,648 19,315 20,236 21,118 21,853 22,395
Upper Potomac 2/ 25,702 44,898 58,989 68,785 70,809 76,117 81,262 85,863 89,742 92,625
Vienna 3/ 16,774 19,502 21,910 23,747 24,393 27,469 28,656 29,630 30,463 31,107
Fairfax County 215,646 302,464 358,960 391,139 398,282 421,376 442,728 462,095 478,416 490,574
Sources: U.S. Census Bureau, 1980 and 1990; and Fairfax County Department of Systems Management for Human Services, 2007 through 2035.
Note: Countywide totals may vary by table depending on how well the geographic layer aligns with actual county boundaries.
1/ Includes the Town of Clifton.
2/ Includes the Town of Herndon.
3/ Includes the Town of Vienna.
VII-4
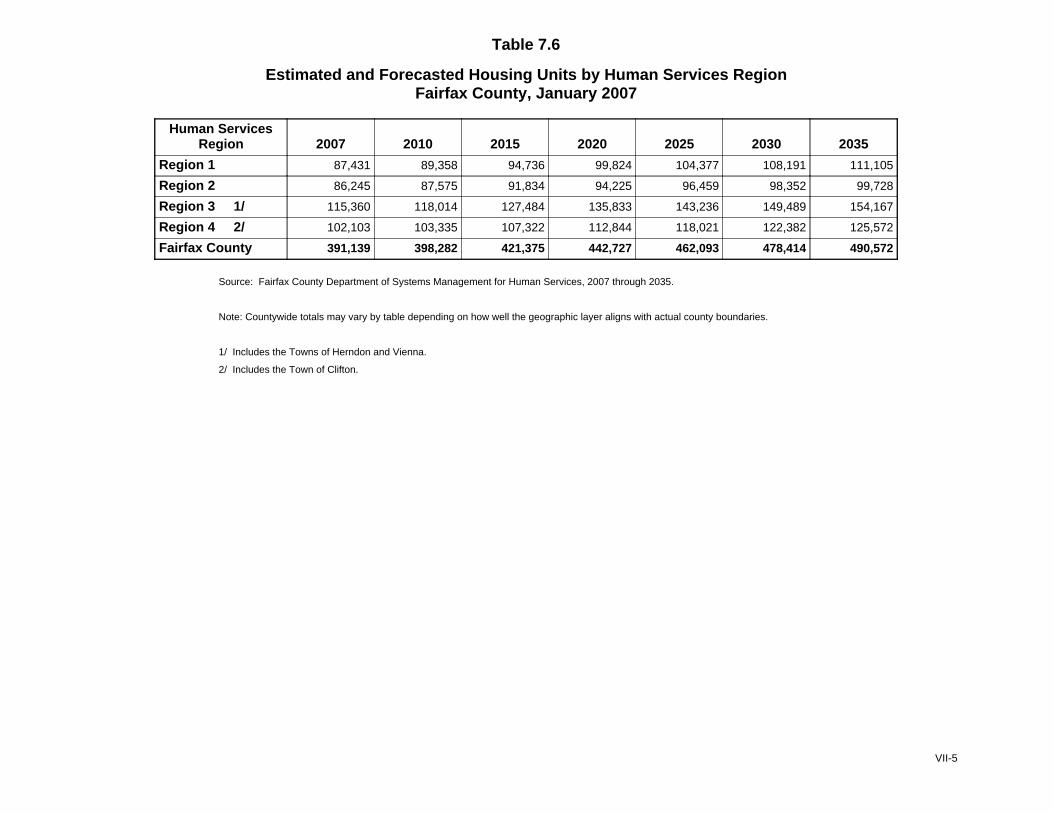
Table 7.6
Estimated and Forecasted Housing Units by Human Services RegionFairfax County, January 2007
Human ServicesRegion 2007 2010 2015 2020 2025 2030 2035
Region 1 87,431 89,358 94,736 99,824 104,377 108,191 111,105
Region 2 86,245 87,575 91,834 94,225 96,459 98,352 99,728
Region 3 1/ 115,360 118,014 127,484 135,833 143,236 149,489 154,167
Region 4 2/ 102,103 103,335 107,322 112,844 118,021 122,382 125,572
Fairfax County 391,139 398,282 421,375 442,727 462,093 478,414 490,572
Source: Fairfax County Department of Systems Management for Human Services, 2007 through 2035.
Note: Countywide totals may vary by table depending on how well the geographic layer aligns with actual county boundaries.
1/ Includes the Towns of Herndon and Vienna.
2/ Includes the Town of Clifton.
VII-5
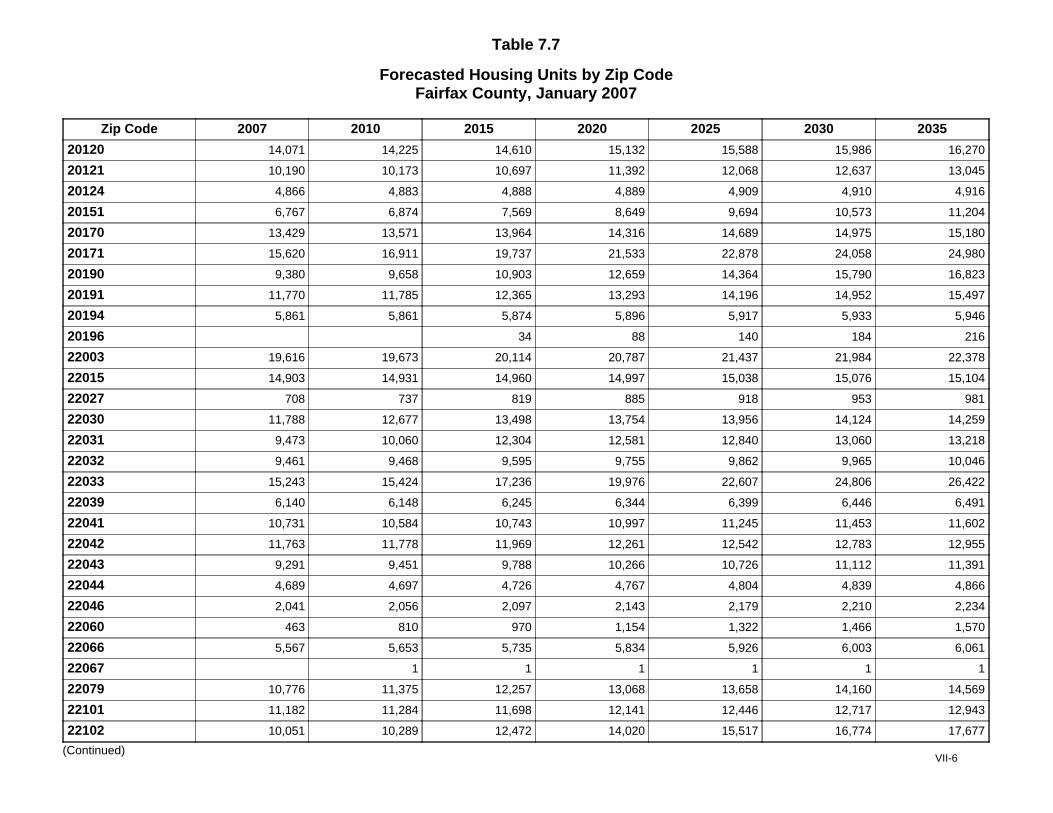
Table 7.7
Forecasted Housing Units by Zip CodeFairfax County, January 2007
Zip Code 2007 2010 2015 2020 2025 2030 2035
20120 14,071 14,225 14,610 15,132 15,588 15,986 16,270
20121 10,190 10,173 10,697 11,392 12,068 12,637 13,045
20124 4,866 4,883 4,888 4,889 4,909 4,910 4,916
20151 6,767 6,874 7,569 8,649 9,694 10,573 11,204
20170 13,429 13,571 13,964 14,316 14,689 14,975 15,180
20171 15,620 16,911 19,737 21,533 22,878 24,058 24,980
20190 9,380 9,658 10,903 12,659 14,364 15,790 16,823
20191 11,770 11,785 12,365 13,293 14,196 14,952 15,497
20194 5,861 5,861 5,874 5,896 5,917 5,933 5,946
20196 34 88 140 184 216
22003 19,616 19,673 20,114 20,787 21,437 21,984 22,378
22015 14,903 14,931 14,960 14,997 15,038 15,076 15,104
22027 708 737 819 885 918 953 981
22030 11,788 12,677 13,498 13,754 13,956 14,124 14,259
22031 9,473 10,060 12,304 12,581 12,840 13,060 13,218
22032 9,461 9,468 9,595 9,755 9,862 9,965 10,046
22033 15,243 15,424 17,236 19,976 22,607 24,806 26,422
22039 6,140 6,148 6,245 6,344 6,399 6,446 6,491
22041 10,731 10,584 10,743 10,997 11,245 11,453 11,602
22042 11,763 11,778 11,969 12,261 12,542 12,783 12,955
22043 9,291 9,451 9,788 10,266 10,726 11,112 11,391
22044 4,689 4,697 4,726 4,767 4,804 4,839 4,866
22046 2,041 2,056 2,097 2,143 2,179 2,210 2,234
22060 463 810 970 1,154 1,322 1,466 1,570
22066 5,567 5,653 5,735 5,834 5,926 6,003 6,061
22067 1 1 1 1 1 1
22079 10,776 11,375 12,257 13,068 13,658 14,160 14,569
22101 11,182 11,284 11,698 12,141 12,446 12,717 12,943
22102 10,051 10,289 12,472 14,020 15,517 16,774 17,677
(Continued)VII-6
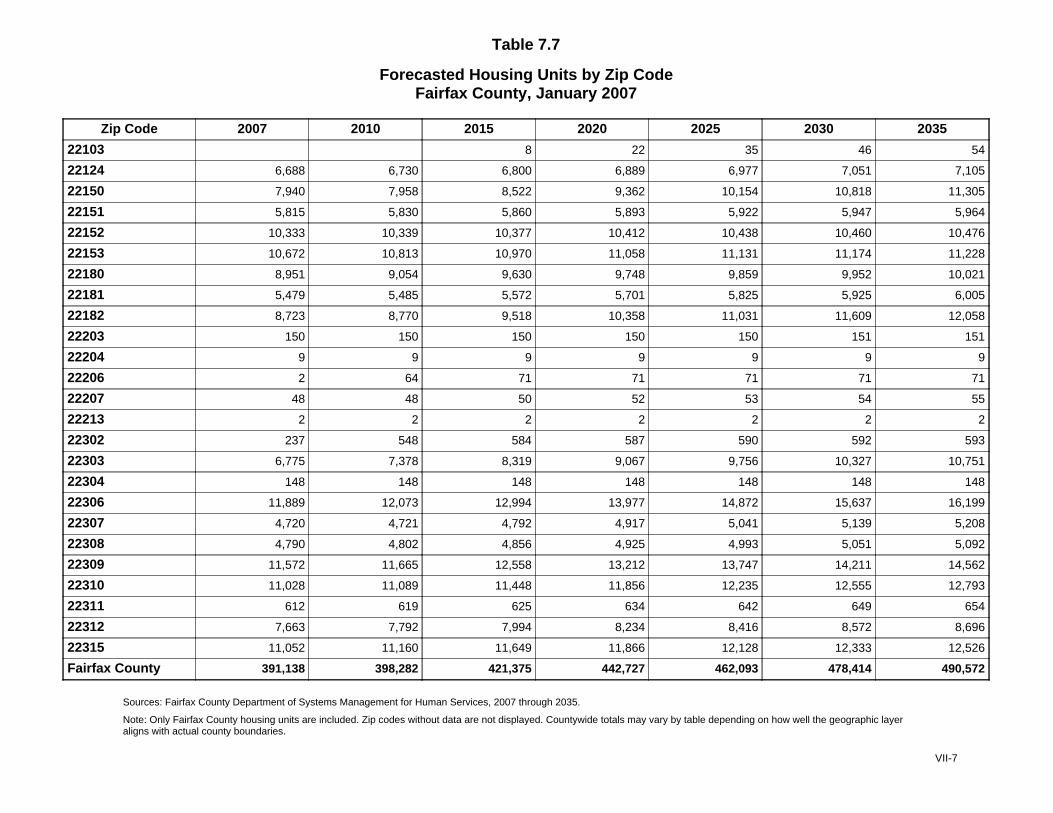
Table 7.7
Forecasted Housing Units by Zip CodeFairfax County, January 2007
Zip Code 2007 2010 2015 2020 2025 2030 2035
22103 8 22 35 46 54
22124 6,688 6,730 6,800 6,889 6,977 7,051 7,105
22150 7,940 7,958 8,522 9,362 10,154 10,818 11,305
22151 5,815 5,830 5,860 5,893 5,922 5,947 5,964
22152 10,333 10,339 10,377 10,412 10,438 10,460 10,476
22153 10,672 10,813 10,970 11,058 11,131 11,174 11,228
22180 8,951 9,054 9,630 9,748 9,859 9,952 10,021
22181 5,479 5,485 5,572 5,701 5,825 5,925 6,005
22182 8,723 8,770 9,518 10,358 11,031 11,609 12,058
22203 150 150 150 150 150 151 151
22204 9 9 9 9 9 9 9
22206 2 64 71 71 71 71 71
22207 48 48 50 52 53 54 55
22213 2 2 2 2 2 2 2
22302 237 548 584 587 590 592 593
22303 6,775 7,378 8,319 9,067 9,756 10,327 10,751
22304 148 148 148 148 148 148 148
22306 11,889 12,073 12,994 13,977 14,872 15,637 16,199
22307 4,720 4,721 4,792 4,917 5,041 5,139 5,208
22308 4,790 4,802 4,856 4,925 4,993 5,051 5,092
22309 11,572 11,665 12,558 13,212 13,747 14,211 14,562
22310 11,028 11,089 11,448 11,856 12,235 12,555 12,793
22311 612 619 625 634 642 649 654
22312 7,663 7,792 7,994 8,234 8,416 8,572 8,696
22315 11,052 11,160 11,649 11,866 12,128 12,333 12,526
Fairfax County 391,138 398,282 421,375 442,727 462,093 478,414 490,572
Sources: Fairfax County Department of Systems Management for Human Services, 2007 through 2035.
Note: Only Fairfax County housing units are included. Zip codes without data are not displayed. Countywide totals may vary by table depending on how well the geographic layeraligns with actual county boundaries.
VII-7
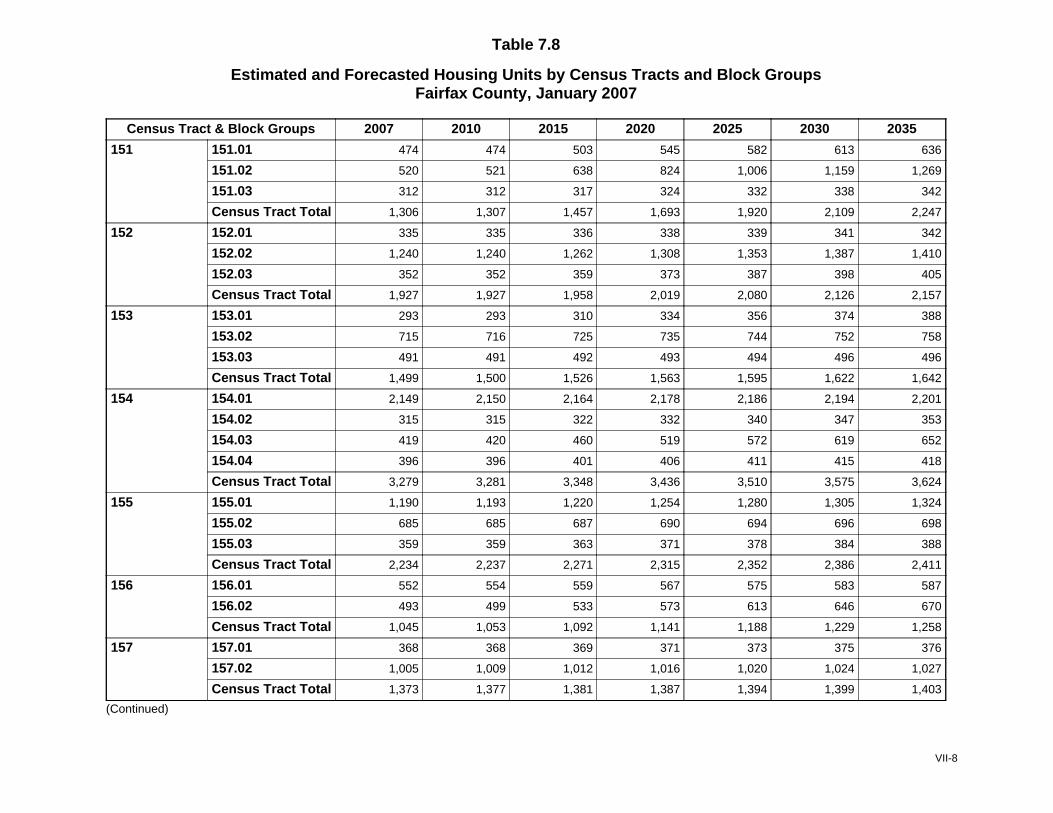
Table 7.8
Estimated and Forecasted Housing Units by Census Tracts and Block GroupsFairfax County, January 2007
Census Tract & Block Groups 2007 2010 2015 2020 2025 2030 2035
151 151.01 474 474 503 545 582 613 636
151.02 520 521 638 824 1,006 1,159 1,269
151.03 312 312 317 324 332 338 342
Census Tract Total 1,306 1,307 1,457 1,693 1,920 2,109 2,247
152 152.01 335 335 336 338 339 341 342
152.02 1,240 1,240 1,262 1,308 1,353 1,387 1,410
152.03 352 352 359 373 387 398 405
Census Tract Total 1,927 1,927 1,958 2,019 2,080 2,126 2,157
153 153.01 293 293 310 334 356 374 388
153.02 715 716 725 735 744 752 758
153.03 491 491 492 493 494 496 496
Census Tract Total 1,499 1,500 1,526 1,563 1,595 1,622 1,642
154 154.01 2,149 2,150 2,164 2,178 2,186 2,194 2,201
154.02 315 315 322 332 340 347 353
154.03 419 420 460 519 572 619 652
154.04 396 396 401 406 411 415 418
Census Tract Total 3,279 3,281 3,348 3,436 3,510 3,575 3,624
155 155.01 1,190 1,193 1,220 1,254 1,280 1,305 1,324
155.02 685 685 687 690 694 696 698
155.03 359 359 363 371 378 384 388
Census Tract Total 2,234 2,237 2,271 2,315 2,352 2,386 2,411
156 156.01 552 554 559 567 575 583 587
156.02 493 499 533 573 613 646 670
Census Tract Total 1,045 1,053 1,092 1,141 1,188 1,229 1,258
157 157.01 368 368 369 371 373 375 376
157.02 1,005 1,009 1,012 1,016 1,020 1,024 1,027
Census Tract Total 1,373 1,377 1,381 1,387 1,394 1,399 1,403
(Continued)
VII-8
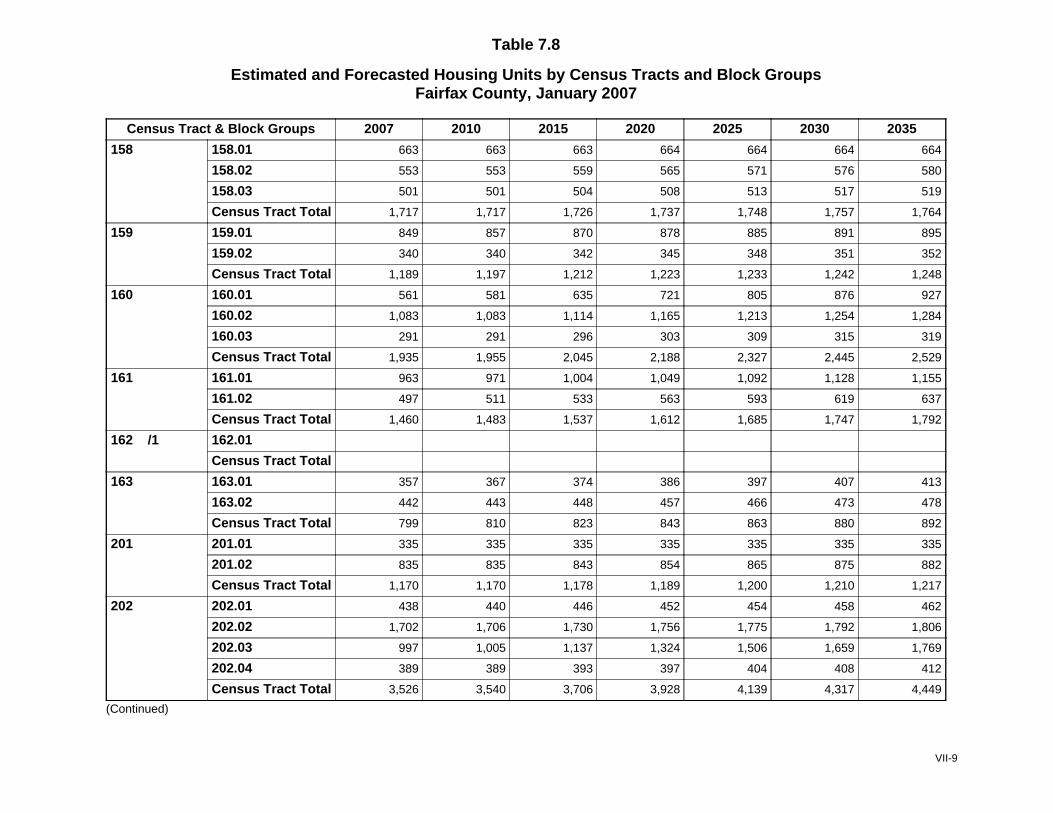
Table 7.8
Estimated and Forecasted Housing Units by Census Tracts and Block GroupsFairfax County, January 2007
Census Tract & Block Groups 2007 2010 2015 2020 2025 2030 2035
158 158.01 663 663 663 664 664 664 664
158.02 553 553 559 565 571 576 580
158.03 501 501 504 508 513 517 519
Census Tract Total 1,717 1,717 1,726 1,737 1,748 1,757 1,764
159 159.01 849 857 870 878 885 891 895
159.02 340 340 342 345 348 351 352
Census Tract Total 1,189 1,197 1,212 1,223 1,233 1,242 1,248
160 160.01 561 581 635 721 805 876 927
160.02 1,083 1,083 1,114 1,165 1,213 1,254 1,284
160.03 291 291 296 303 309 315 319
Census Tract Total 1,935 1,955 2,045 2,188 2,327 2,445 2,529
161 161.01 963 971 1,004 1,049 1,092 1,128 1,155
161.02 497 511 533 563 593 619 637
Census Tract Total 1,460 1,483 1,537 1,612 1,685 1,747 1,792
162 /1 162.01
Census Tract Total
163 163.01 357 367 374 386 397 407 413
163.02 442 443 448 457 466 473 478
Census Tract Total 799 810 823 843 863 880 892
201 201.01 335 335 335 335 335 335 335
201.02 835 835 843 854 865 875 882
Census Tract Total 1,170 1,170 1,178 1,189 1,200 1,210 1,217
202 202.01 438 440 446 452 454 458 462
202.02 1,702 1,706 1,730 1,756 1,775 1,792 1,806
202.03 997 1,005 1,137 1,324 1,506 1,659 1,769
202.04 389 389 393 397 404 408 412
Census Tract Total 3,526 3,540 3,706 3,928 4,139 4,317 4,449
(Continued)
VII-9
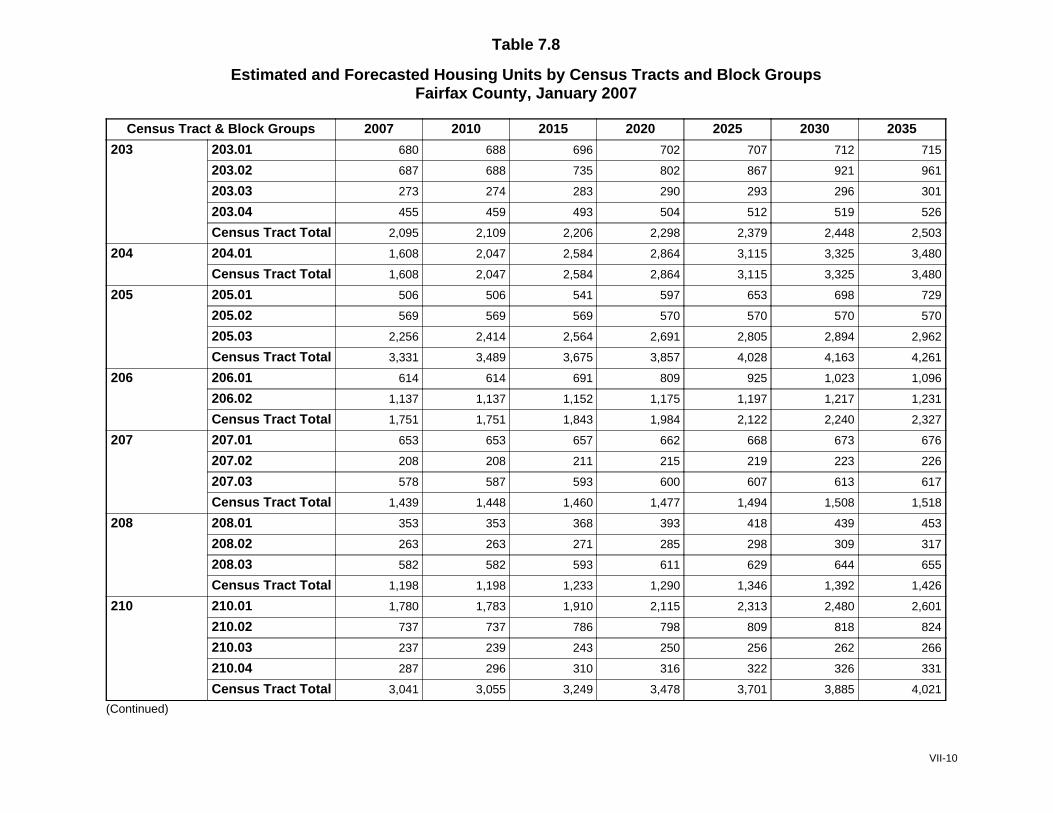
Table 7.8
Estimated and Forecasted Housing Units by Census Tracts and Block GroupsFairfax County, January 2007
Census Tract & Block Groups 2007 2010 2015 2020 2025 2030 2035
203 203.01 680 688 696 702 707 712 715
203.02 687 688 735 802 867 921 961
203.03 273 274 283 290 293 296 301
203.04 455 459 493 504 512 519 526
Census Tract Total 2,095 2,109 2,206 2,298 2,379 2,448 2,503
204 204.01 1,608 2,047 2,584 2,864 3,115 3,325 3,480
Census Tract Total 1,608 2,047 2,584 2,864 3,115 3,325 3,480
205 205.01 506 506 541 597 653 698 729
205.02 569 569 569 570 570 570 570
205.03 2,256 2,414 2,564 2,691 2,805 2,894 2,962
Census Tract Total 3,331 3,489 3,675 3,857 4,028 4,163 4,261
206 206.01 614 614 691 809 925 1,023 1,096
206.02 1,137 1,137 1,152 1,175 1,197 1,217 1,231
Census Tract Total 1,751 1,751 1,843 1,984 2,122 2,240 2,327
207 207.01 653 653 657 662 668 673 676
207.02 208 208 211 215 219 223 226
207.03 578 587 593 600 607 613 617
Census Tract Total 1,439 1,448 1,460 1,477 1,494 1,508 1,518
208 208.01 353 353 368 393 418 439 453
208.02 263 263 271 285 298 309 317
208.03 582 582 593 611 629 644 655
Census Tract Total 1,198 1,198 1,233 1,290 1,346 1,392 1,426
210 210.01 1,780 1,783 1,910 2,115 2,313 2,480 2,601
210.02 737 737 786 798 809 818 824
210.03 237 239 243 250 256 262 266
210.04 287 296 310 316 322 326 331
Census Tract Total 3,041 3,055 3,249 3,478 3,701 3,885 4,021
(Continued)
VII-10
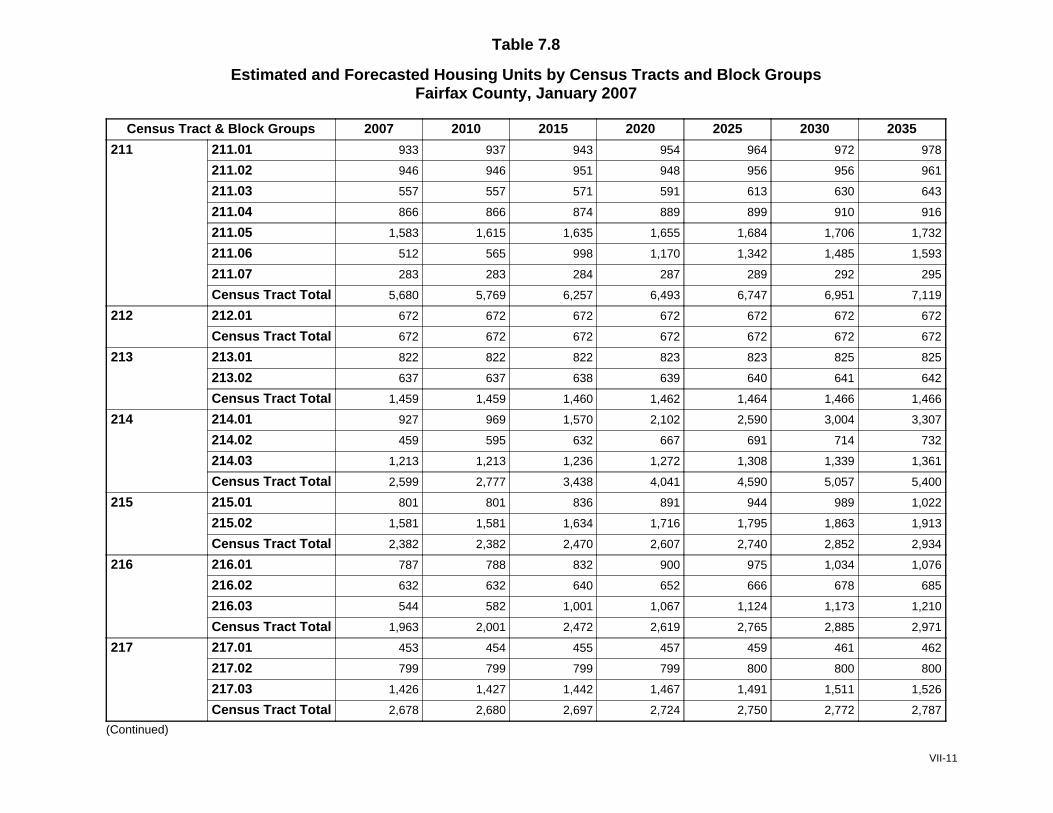
Table 7.8
Estimated and Forecasted Housing Units by Census Tracts and Block GroupsFairfax County, January 2007
Census Tract & Block Groups 2007 2010 2015 2020 2025 2030 2035
211 211.01 933 937 943 954 964 972 978
211.02 946 946 951 948 956 956 961
211.03 557 557 571 591 613 630 643
211.04 866 866 874 889 899 910 916
211.05 1,583 1,615 1,635 1,655 1,684 1,706 1,732
211.06 512 565 998 1,170 1,342 1,485 1,593
211.07 283 283 284 287 289 292 295
Census Tract Total 5,680 5,769 6,257 6,493 6,747 6,951 7,119
212 212.01 672 672 672 672 672 672 672
Census Tract Total 672 672 672 672 672 672 672
213 213.01 822 822 822 823 823 825 825
213.02 637 637 638 639 640 641 642
Census Tract Total 1,459 1,459 1,460 1,462 1,464 1,466 1,466
214 214.01 927 969 1,570 2,102 2,590 3,004 3,307
214.02 459 595 632 667 691 714 732
214.03 1,213 1,213 1,236 1,272 1,308 1,339 1,361
Census Tract Total 2,599 2,777 3,438 4,041 4,590 5,057 5,400
215 215.01 801 801 836 891 944 989 1,022
215.02 1,581 1,581 1,634 1,716 1,795 1,863 1,913
Census Tract Total 2,382 2,382 2,470 2,607 2,740 2,852 2,934
216 216.01 787 788 832 900 975 1,034 1,076
216.02 632 632 640 652 666 678 685
216.03 544 582 1,001 1,067 1,124 1,173 1,210
Census Tract Total 1,963 2,001 2,472 2,619 2,765 2,885 2,971
217 217.01 453 454 455 457 459 461 462
217.02 799 799 799 799 800 800 800
217.03 1,426 1,427 1,442 1,467 1,491 1,511 1,526
Census Tract Total 2,678 2,680 2,697 2,724 2,750 2,772 2,787
(Continued)
VII-11
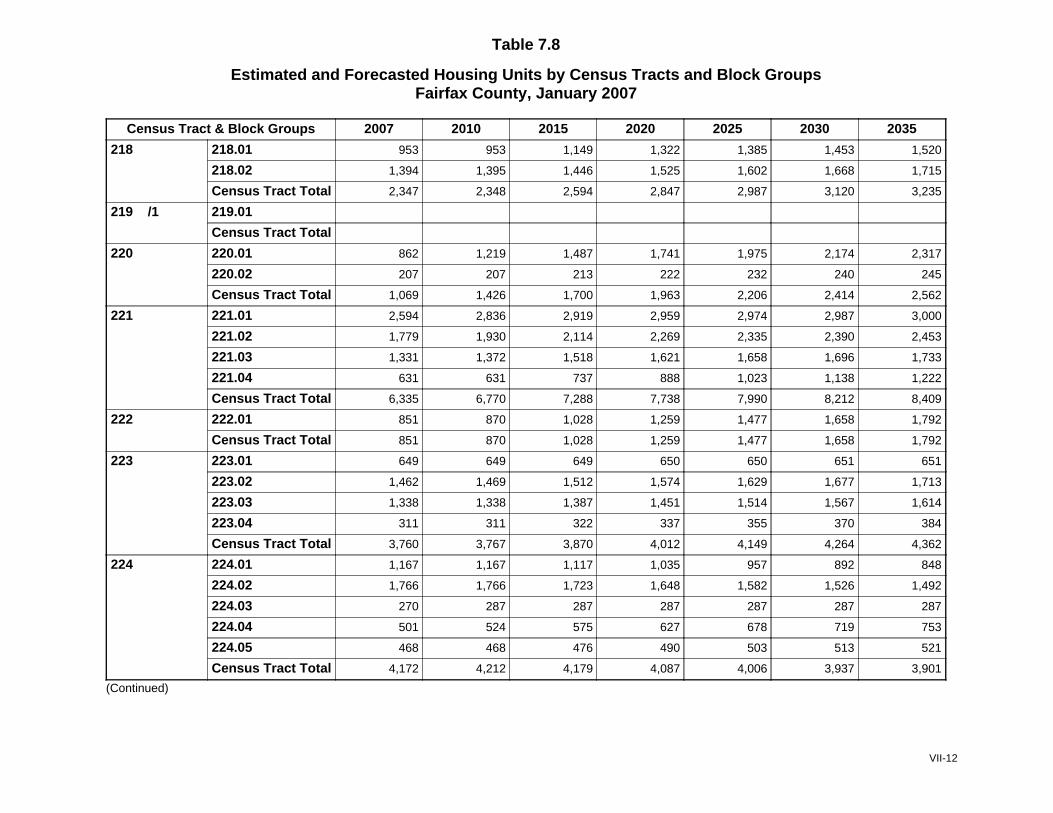
Table 7.8
Estimated and Forecasted Housing Units by Census Tracts and Block GroupsFairfax County, January 2007
Census Tract & Block Groups 2007 2010 2015 2020 2025 2030 2035
218 218.01 953 953 1,149 1,322 1,385 1,453 1,520
218.02 1,394 1,395 1,446 1,525 1,602 1,668 1,715
Census Tract Total 2,347 2,348 2,594 2,847 2,987 3,120 3,235
219 /1 219.01
Census Tract Total
220 220.01 862 1,219 1,487 1,741 1,975 2,174 2,317
220.02 207 207 213 222 232 240 245
Census Tract Total 1,069 1,426 1,700 1,963 2,206 2,414 2,562
221 221.01 2,594 2,836 2,919 2,959 2,974 2,987 3,000
221.02 1,779 1,930 2,114 2,269 2,335 2,390 2,453
221.03 1,331 1,372 1,518 1,621 1,658 1,696 1,733
221.04 631 631 737 888 1,023 1,138 1,222
Census Tract Total 6,335 6,770 7,288 7,738 7,990 8,212 8,409
222 222.01 851 870 1,028 1,259 1,477 1,658 1,792
Census Tract Total 851 870 1,028 1,259 1,477 1,658 1,792
223 223.01 649 649 649 650 650 651 651
223.02 1,462 1,469 1,512 1,574 1,629 1,677 1,713
223.03 1,338 1,338 1,387 1,451 1,514 1,567 1,614
223.04 311 311 322 337 355 370 384
Census Tract Total 3,760 3,767 3,870 4,012 4,149 4,264 4,362
224 224.01 1,167 1,167 1,117 1,035 957 892 848
224.02 1,766 1,766 1,723 1,648 1,582 1,526 1,492
224.03 270 287 287 287 287 287 287
224.04 501 524 575 627 678 719 753
224.05 468 468 476 490 503 513 521
Census Tract Total 4,172 4,212 4,179 4,087 4,006 3,937 3,901
(Continued)
VII-12
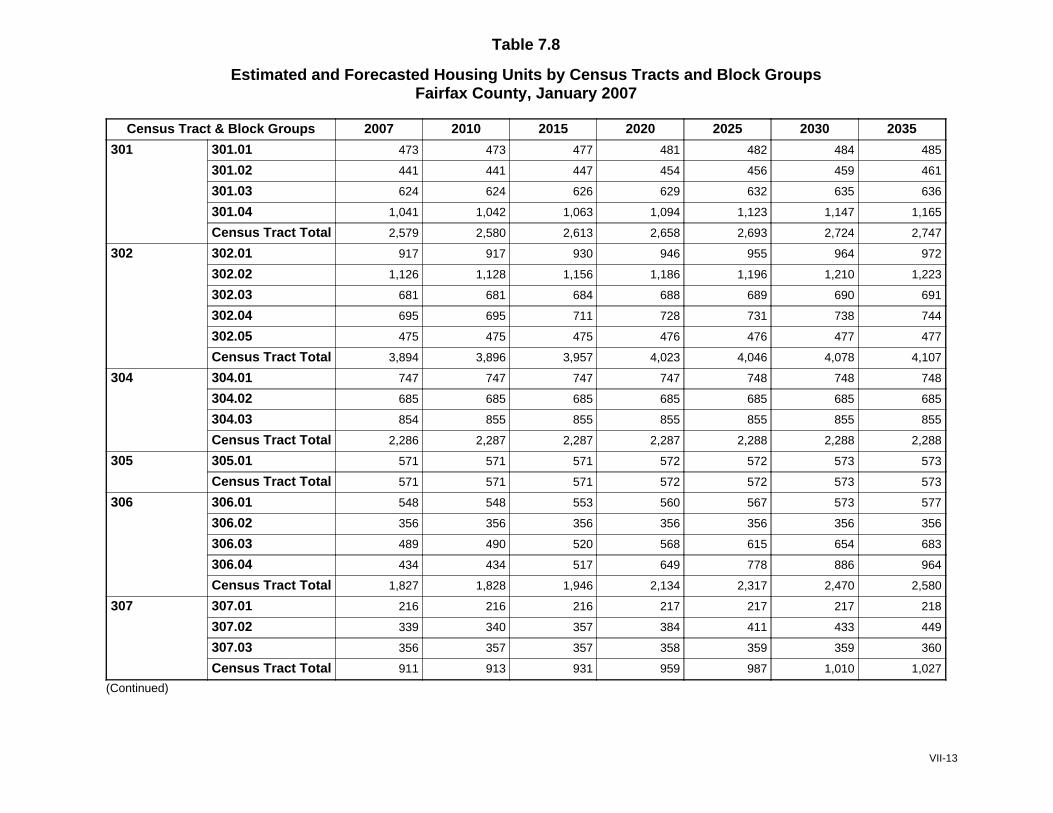
Table 7.8
Estimated and Forecasted Housing Units by Census Tracts and Block GroupsFairfax County, January 2007
Census Tract & Block Groups 2007 2010 2015 2020 2025 2030 2035
301 301.01 473 473 477 481 482 484 485
301.02 441 441 447 454 456 459 461
301.03 624 624 626 629 632 635 636
301.04 1,041 1,042 1,063 1,094 1,123 1,147 1,165
Census Tract Total 2,579 2,580 2,613 2,658 2,693 2,724 2,747
302 302.01 917 917 930 946 955 964 972
302.02 1,126 1,128 1,156 1,186 1,196 1,210 1,223
302.03 681 681 684 688 689 690 691
302.04 695 695 711 728 731 738 744
302.05 475 475 475 476 476 477 477
Census Tract Total 3,894 3,896 3,957 4,023 4,046 4,078 4,107
304 304.01 747 747 747 747 748 748 748
304.02 685 685 685 685 685 685 685
304.03 854 855 855 855 855 855 855
Census Tract Total 2,286 2,287 2,287 2,287 2,288 2,288 2,288
305 305.01 571 571 571 572 572 573 573
Census Tract Total 571 571 571 572 572 573 573
306 306.01 548 548 553 560 567 573 577
306.02 356 356 356 356 356 356 356
306.03 489 490 520 568 615 654 683
306.04 434 434 517 649 778 886 964
Census Tract Total 1,827 1,828 1,946 2,134 2,317 2,470 2,580
307 307.01 216 216 216 217 217 217 218
307.02 339 340 357 384 411 433 449
307.03 356 357 357 358 359 359 360
Census Tract Total 911 913 931 959 987 1,010 1,027
(Continued)
VII-13
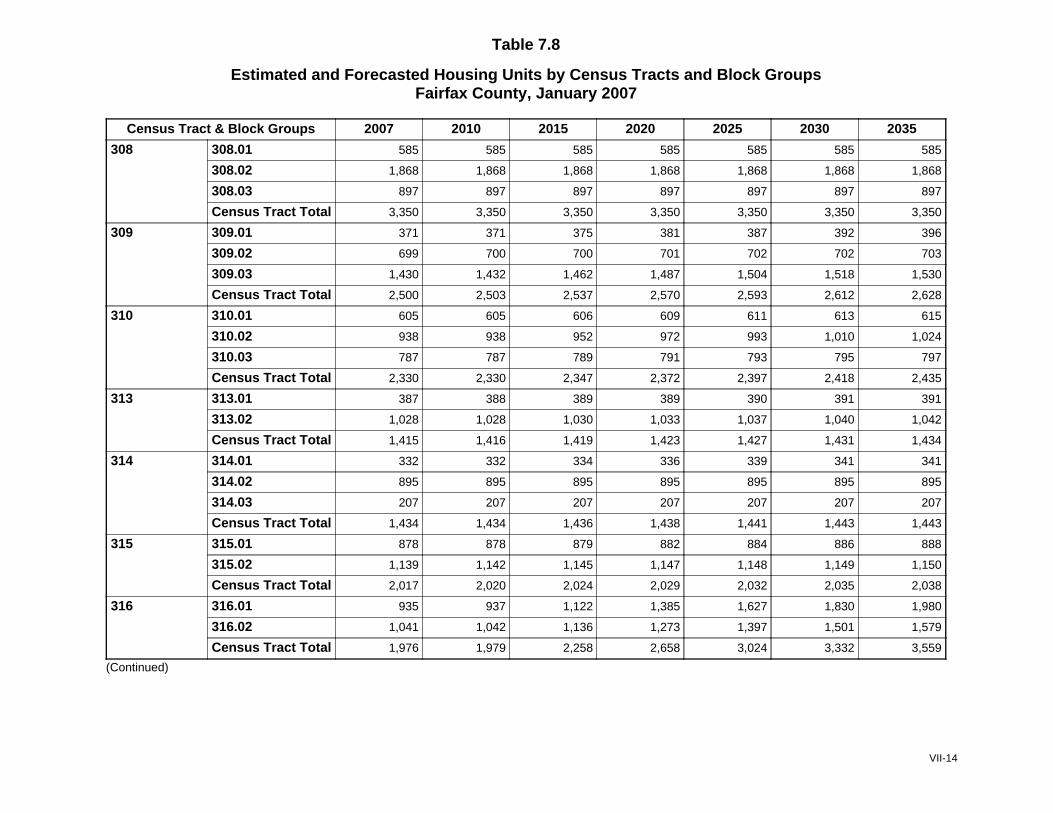
Table 7.8
Estimated and Forecasted Housing Units by Census Tracts and Block GroupsFairfax County, January 2007
Census Tract & Block Groups 2007 2010 2015 2020 2025 2030 2035
308 308.01 585 585 585 585 585 585 585
308.02 1,868 1,868 1,868 1,868 1,868 1,868 1,868
308.03 897 897 897 897 897 897 897
Census Tract Total 3,350 3,350 3,350 3,350 3,350 3,350 3,350
309 309.01 371 371 375 381 387 392 396
309.02 699 700 700 701 702 702 703
309.03 1,430 1,432 1,462 1,487 1,504 1,518 1,530
Census Tract Total 2,500 2,503 2,537 2,570 2,593 2,612 2,628
310 310.01 605 605 606 609 611 613 615
310.02 938 938 952 972 993 1,010 1,024
310.03 787 787 789 791 793 795 797
Census Tract Total 2,330 2,330 2,347 2,372 2,397 2,418 2,435
313 313.01 387 388 389 389 390 391 391
313.02 1,028 1,028 1,030 1,033 1,037 1,040 1,042
Census Tract Total 1,415 1,416 1,419 1,423 1,427 1,431 1,434
314 314.01 332 332 334 336 339 341 341
314.02 895 895 895 895 895 895 895
314.03 207 207 207 207 207 207 207
Census Tract Total 1,434 1,434 1,436 1,438 1,441 1,443 1,443
315 315.01 878 878 879 882 884 886 888
315.02 1,139 1,142 1,145 1,147 1,148 1,149 1,150
Census Tract Total 2,017 2,020 2,024 2,029 2,032 2,035 2,038
316 316.01 935 937 1,122 1,385 1,627 1,830 1,980
316.02 1,041 1,042 1,136 1,273 1,397 1,501 1,579
Census Tract Total 1,976 1,979 2,258 2,658 3,024 3,332 3,559
(Continued)
VII-14
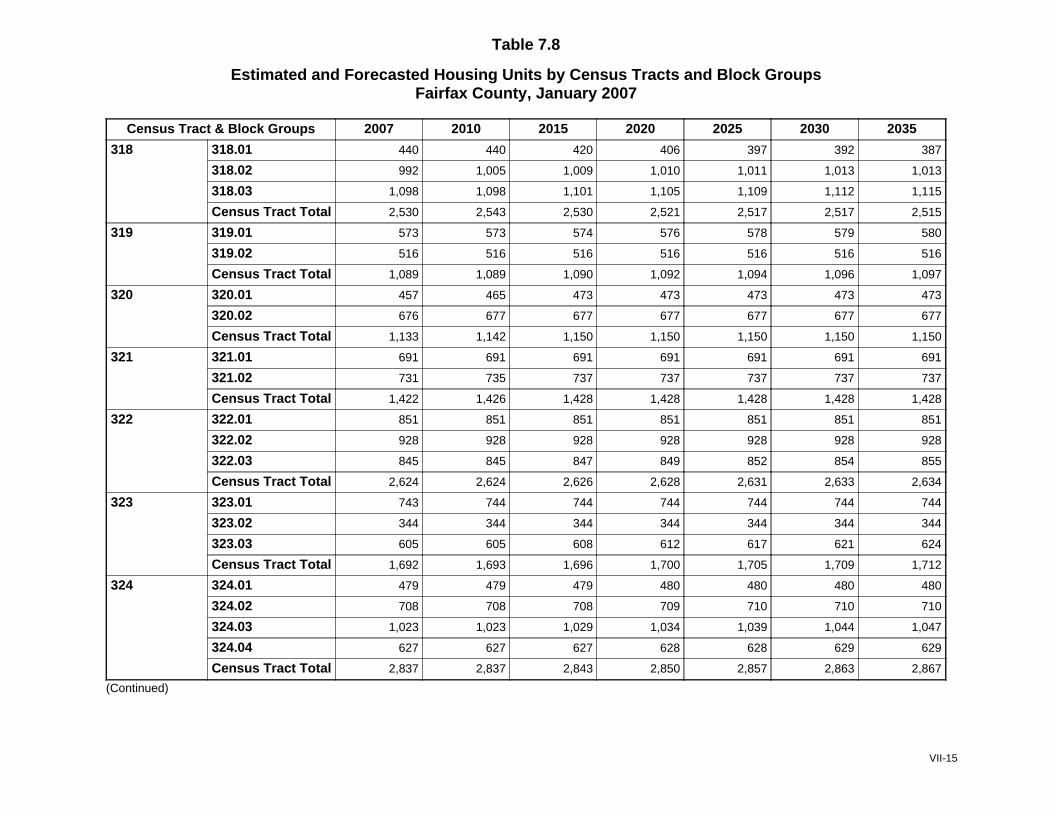
Table 7.8
Estimated and Forecasted Housing Units by Census Tracts and Block GroupsFairfax County, January 2007
Census Tract & Block Groups 2007 2010 2015 2020 2025 2030 2035
318 318.01 440 440 420 406 397 392 387
318.02 992 1,005 1,009 1,010 1,011 1,013 1,013
318.03 1,098 1,098 1,101 1,105 1,109 1,112 1,115
Census Tract Total 2,530 2,543 2,530 2,521 2,517 2,517 2,515
319 319.01 573 573 574 576 578 579 580
319.02 516 516 516 516 516 516 516
Census Tract Total 1,089 1,089 1,090 1,092 1,094 1,096 1,097
320 320.01 457 465 473 473 473 473 473
320.02 676 677 677 677 677 677 677
Census Tract Total 1,133 1,142 1,150 1,150 1,150 1,150 1,150
321 321.01 691 691 691 691 691 691 691
321.02 731 735 737 737 737 737 737
Census Tract Total 1,422 1,426 1,428 1,428 1,428 1,428 1,428
322 322.01 851 851 851 851 851 851 851
322.02 928 928 928 928 928 928 928
322.03 845 845 847 849 852 854 855
Census Tract Total 2,624 2,624 2,626 2,628 2,631 2,633 2,634
323 323.01 743 744 744 744 744 744 744
323.02 344 344 344 344 344 344 344
323.03 605 605 608 612 617 621 624
Census Tract Total 1,692 1,693 1,696 1,700 1,705 1,709 1,712
324 324.01 479 479 479 480 480 480 480
324.02 708 708 708 709 710 710 710
324.03 1,023 1,023 1,029 1,034 1,039 1,044 1,047
324.04 627 627 627 628 628 629 629
Census Tract Total 2,837 2,837 2,843 2,850 2,857 2,863 2,867
(Continued)
VII-15
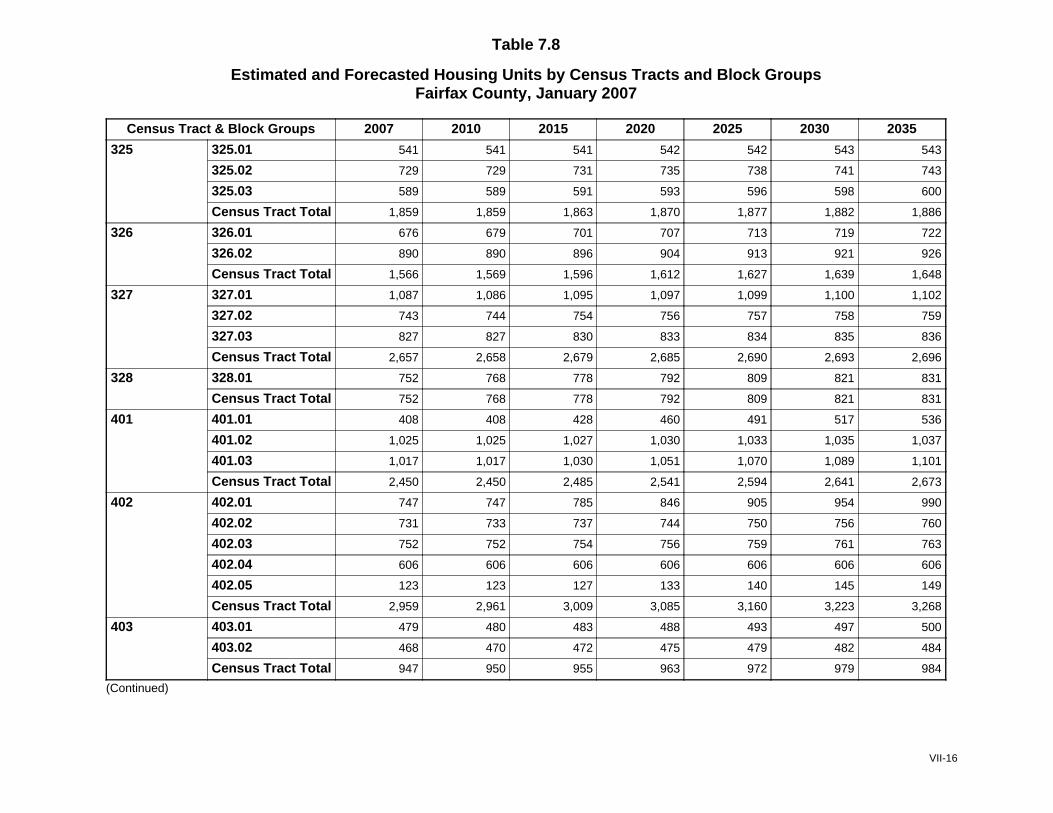
Table 7.8
Estimated and Forecasted Housing Units by Census Tracts and Block GroupsFairfax County, January 2007
Census Tract & Block Groups 2007 2010 2015 2020 2025 2030 2035
325 325.01 541 541 541 542 542 543 543
325.02 729 729 731 735 738 741 743
325.03 589 589 591 593 596 598 600
Census Tract Total 1,859 1,859 1,863 1,870 1,877 1,882 1,886
326 326.01 676 679 701 707 713 719 722
326.02 890 890 896 904 913 921 926
Census Tract Total 1,566 1,569 1,596 1,612 1,627 1,639 1,648
327 327.01 1,087 1,086 1,095 1,097 1,099 1,100 1,102
327.02 743 744 754 756 757 758 759
327.03 827 827 830 833 834 835 836
Census Tract Total 2,657 2,658 2,679 2,685 2,690 2,693 2,696
328 328.01 752 768 778 792 809 821 831
Census Tract Total 752 768 778 792 809 821 831
401 401.01 408 408 428 460 491 517 536
401.02 1,025 1,025 1,027 1,030 1,033 1,035 1,037
401.03 1,017 1,017 1,030 1,051 1,070 1,089 1,101
Census Tract Total 2,450 2,450 2,485 2,541 2,594 2,641 2,673
402 402.01 747 747 785 846 905 954 990
402.02 731 733 737 744 750 756 760
402.03 752 752 754 756 759 761 763
402.04 606 606 606 606 606 606 606
402.05 123 123 127 133 140 145 149
Census Tract Total 2,959 2,961 3,009 3,085 3,160 3,223 3,268
403 403.01 479 480 483 488 493 497 500
403.02 468 470 472 475 479 482 484
Census Tract Total 947 950 955 963 972 979 984
(Continued)
VII-16
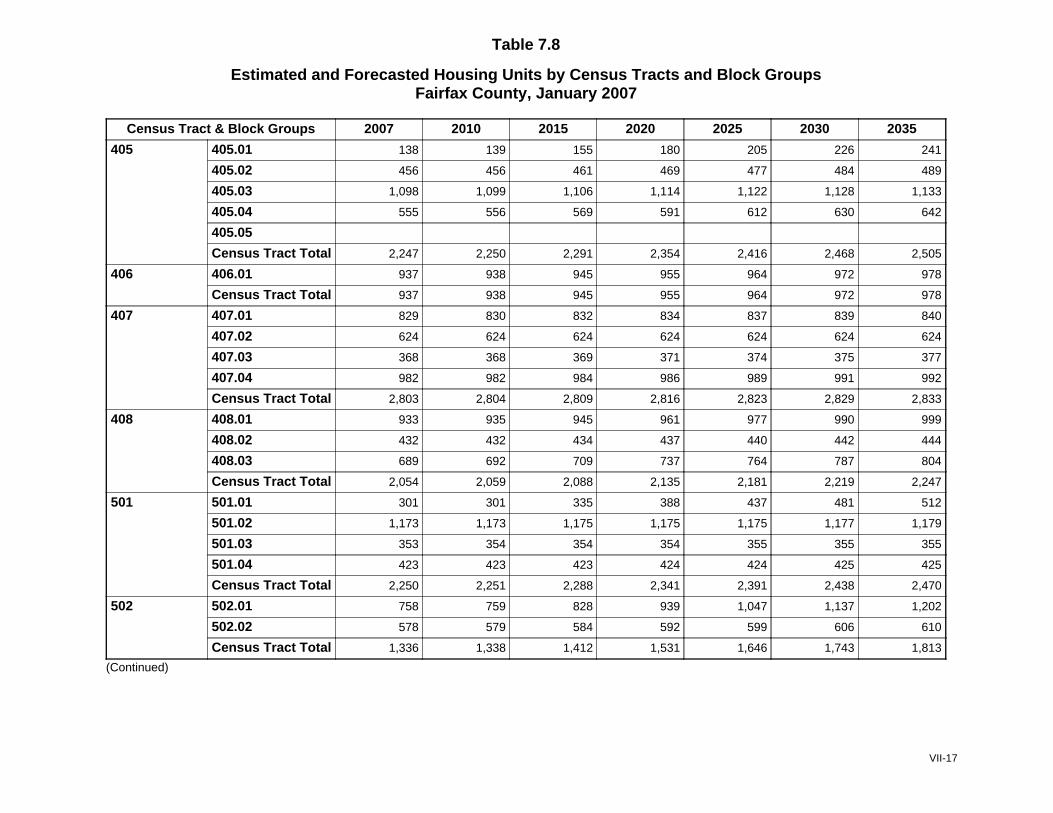
Table 7.8
Estimated and Forecasted Housing Units by Census Tracts and Block GroupsFairfax County, January 2007
Census Tract & Block Groups 2007 2010 2015 2020 2025 2030 2035
405 405.01 138 139 155 180 205 226 241
405.02 456 456 461 469 477 484 489
405.03 1,098 1,099 1,106 1,114 1,122 1,128 1,133
405.04 555 556 569 591 612 630 642
405.05
Census Tract Total 2,247 2,250 2,291 2,354 2,416 2,468 2,505
406 406.01 937 938 945 955 964 972 978
Census Tract Total 937 938 945 955 964 972 978
407 407.01 829 830 832 834 837 839 840
407.02 624 624 624 624 624 624 624
407.03 368 368 369 371 374 375 377
407.04 982 982 984 986 989 991 992
Census Tract Total 2,803 2,804 2,809 2,816 2,823 2,829 2,833
408 408.01 933 935 945 961 977 990 999
408.02 432 432 434 437 440 442 444
408.03 689 692 709 737 764 787 804
Census Tract Total 2,054 2,059 2,088 2,135 2,181 2,219 2,247
501 501.01 301 301 335 388 437 481 512
501.02 1,173 1,173 1,175 1,175 1,175 1,177 1,179
501.03 353 354 354 354 355 355 355
501.04 423 423 423 424 424 425 425
Census Tract Total 2,250 2,251 2,288 2,341 2,391 2,438 2,470
502 502.01 758 759 828 939 1,047 1,137 1,202
502.02 578 579 584 592 599 606 610
Census Tract Total 1,336 1,338 1,412 1,531 1,646 1,743 1,813
(Continued)
VII-17
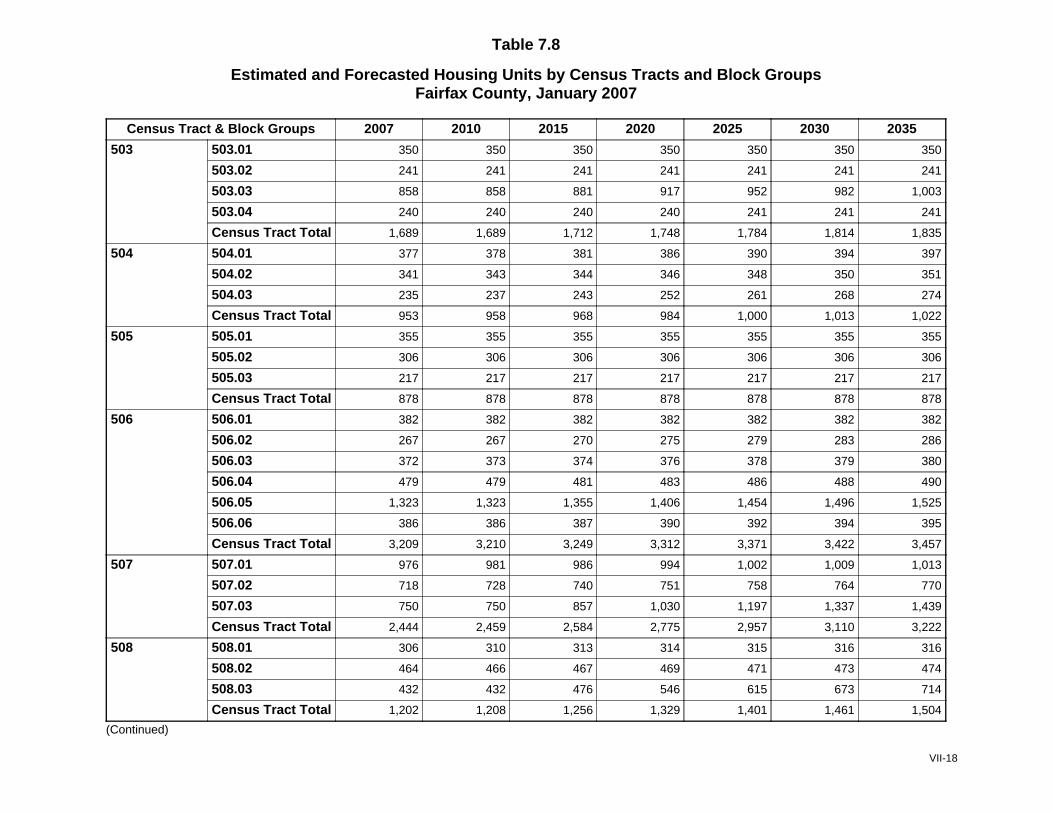
Table 7.8
Estimated and Forecasted Housing Units by Census Tracts and Block GroupsFairfax County, January 2007
Census Tract & Block Groups 2007 2010 2015 2020 2025 2030 2035
503 503.01 350 350 350 350 350 350 350
503.02 241 241 241 241 241 241 241
503.03 858 858 881 917 952 982 1,003
503.04 240 240 240 240 241 241 241
Census Tract Total 1,689 1,689 1,712 1,748 1,784 1,814 1,835
504 504.01 377 378 381 386 390 394 397
504.02 341 343 344 346 348 350 351
504.03 235 237 243 252 261 268 274
Census Tract Total 953 958 968 984 1,000 1,013 1,022
505 505.01 355 355 355 355 355 355 355
505.02 306 306 306 306 306 306 306
505.03 217 217 217 217 217 217 217
Census Tract Total 878 878 878 878 878 878 878
506 506.01 382 382 382 382 382 382 382
506.02 267 267 270 275 279 283 286
506.03 372 373 374 376 378 379 380
506.04 479 479 481 483 486 488 490
506.05 1,323 1,323 1,355 1,406 1,454 1,496 1,525
506.06 386 386 387 390 392 394 395
Census Tract Total 3,209 3,210 3,249 3,312 3,371 3,422 3,457
507 507.01 976 981 986 994 1,002 1,009 1,013
507.02 718 728 740 751 758 764 770
507.03 750 750 857 1,030 1,197 1,337 1,439
Census Tract Total 2,444 2,459 2,584 2,775 2,957 3,110 3,222
508 508.01 306 310 313 314 315 316 316
508.02 464 466 467 469 471 473 474
508.03 432 432 476 546 615 673 714
Census Tract Total 1,202 1,208 1,256 1,329 1,401 1,461 1,504
(Continued)
VII-18

Table 7.8
Estimated and Forecasted Housing Units by Census Tracts and Block GroupsFairfax County, January 2007
Census Tract & Block Groups 2007 2010 2015 2020 2025 2030 2035
509 509.01 303 305 305 306 306 307 307
509.02 298 304 309 310 311 312 313
Census Tract Total 601 609 614 616 617 619 620
510 510.01 403 403 403 403 404 404 404
510.02 494 494 495 497 499 500 501
Census Tract Total 897 897 898 900 902 904 905
511 511.01 362 364 365 367 368 370 371
511.02 469 476 476 477 477 478 478
Census Tract Total 831 840 841 844 846 848 849
512 512.01 345 345 348 353 359 363 366
512.02 293 294 296 299 302 305 306
Census Tract Total 638 639 644 652 660 667 672
513 513.01 425 427 434 444 455 463 470
513.02 490 494 497 499 501 502 504
Census Tract Total 915 921 931 943 955 966 973
514 514.01 1,053 1,053 1,053 1,053 1,053 1,053 1,053
514.02 252 252 252 252 252 253 253
Census Tract Total 1,305 1,305 1,305 1,305 1,305 1,306 1,306
515 515.01 965 965 979 1,000 1,017 1,035 1,050
515.02 1,302 1,302 1,314 1,334 1,353 1,370 1,381
515.03 828 828 832 838 844 849 852
515.04 966 1,340 1,417 1,473 1,529 1,575 1,609
Census Tract Total 4,061 4,435 4,542 4,645 4,743 4,829 4,892
516 516.01 844 844 844 845 846 846 846
516.02 801 801 816 839 862 881 895
516.03 682 682 687 694 702 708 713
516.04 385 385 390 397 405 411 415
Census Tract Total 2,712 2,712 2,737 2,776 2,814 2,847 2,870
(Continued)
VII-19

Table 7.8
Estimated and Forecasted Housing Units by Census Tracts and Block GroupsFairfax County, January 2007
Census Tract & Block Groups 2007 2010 2015 2020 2025 2030 2035
518 518.01 468 469 470 470 471 472 472
518.02 633 642 652 658 664 669 673
Census Tract Total 1,101 1,111 1,121 1,128 1,135 1,141 1,145
519 519.01 1,100 1,104 1,126 1,147 1,157 1,167 1,175
519.02 1,196 1,199 1,262 1,351 1,432 1,501 1,552
Census Tract Total 2,296 2,303 2,388 2,499 2,590 2,668 2,727
520 520.01 1,120 1,135 1,228 1,359 1,486 1,591 1,668
Census Tract Total 1,120 1,135 1,228 1,359 1,486 1,591 1,668
521 521.01 1,046 1,051 1,058 1,068 1,079 1,088 1,094
521.02 601 603 609 616 623 628 632
521.03 629 631 635 640 646 650 653
521.04 403 417 423 430 437 442 446
Census Tract Total 2,679 2,702 2,724 2,754 2,784 2,808 2,826
522 522.01 815 815 815 816 816 817 817
522.02 627 627 644 672 699 721 737
522.03 382 383 383 383 383 383 383
522.04 323 323 323 323 323 323 323
Census Tract Total 2,147 2,148 2,166 2,193 2,221 2,244 2,260
523 523.01 1,296 1,296 1,322 1,366 1,410 1,447 1,473
523.02 209 209 283 401 517 615 685
523.03 1,678 1,678 1,678 1,678 1,678 1,678 1,678
Census Tract Total 3,183 3,183 3,282 3,445 3,605 3,739 3,835
524 524.01 506 507 507 507 507 507 507
524.02 364 364 365 365 365 365 365
524.03 262 262 262 262 262 262 262
524.04 738 738 739 741 743 744 745
524.05 494 504 518 526 531 535 537
Census Tract Total 2,364 2,375 2,391 2,401 2,407 2,413 2,416
(Continued)
VII-20
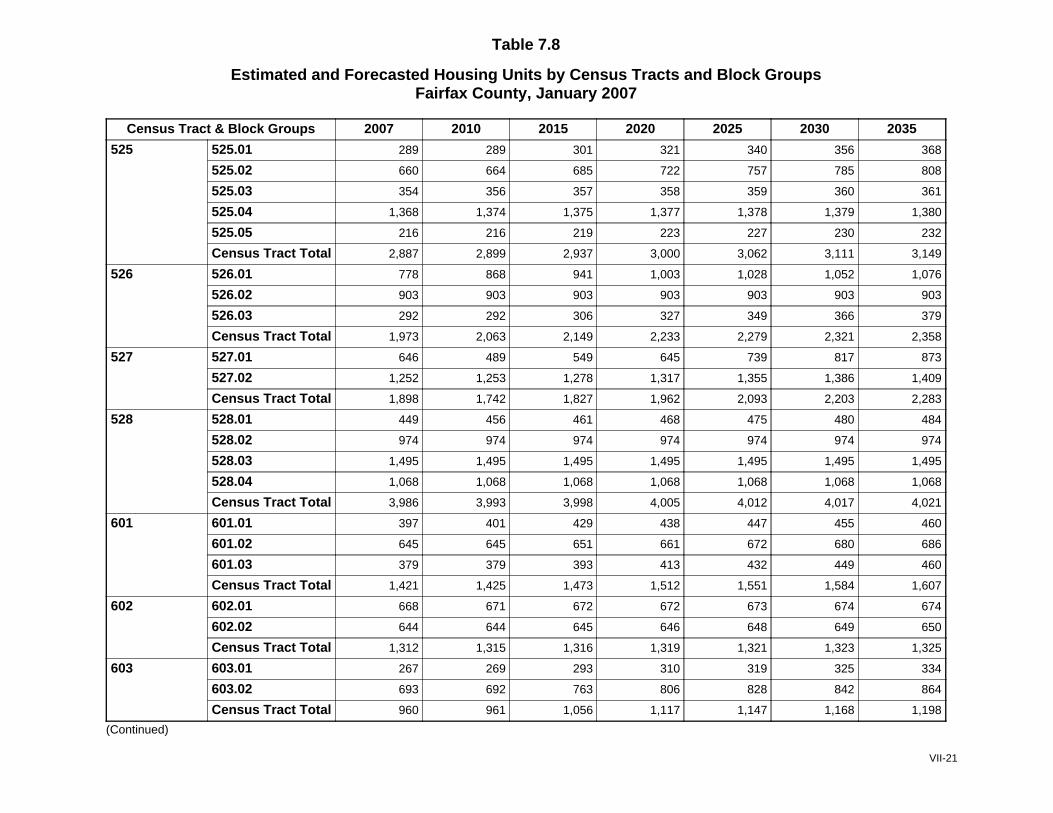
Table 7.8
Estimated and Forecasted Housing Units by Census Tracts and Block GroupsFairfax County, January 2007
Census Tract & Block Groups 2007 2010 2015 2020 2025 2030 2035
525 525.01 289 289 301 321 340 356 368
525.02 660 664 685 722 757 785 808
525.03 354 356 357 358 359 360 361
525.04 1,368 1,374 1,375 1,377 1,378 1,379 1,380
525.05 216 216 219 223 227 230 232
Census Tract Total 2,887 2,899 2,937 3,000 3,062 3,111 3,149
526 526.01 778 868 941 1,003 1,028 1,052 1,076
526.02 903 903 903 903 903 903 903
526.03 292 292 306 327 349 366 379
Census Tract Total 1,973 2,063 2,149 2,233 2,279 2,321 2,358
527 527.01 646 489 549 645 739 817 873
527.02 1,252 1,253 1,278 1,317 1,355 1,386 1,409
Census Tract Total 1,898 1,742 1,827 1,962 2,093 2,203 2,283
528 528.01 449 456 461 468 475 480 484
528.02 974 974 974 974 974 974 974
528.03 1,495 1,495 1,495 1,495 1,495 1,495 1,495
528.04 1,068 1,068 1,068 1,068 1,068 1,068 1,068
Census Tract Total 3,986 3,993 3,998 4,005 4,012 4,017 4,021
601 601.01 397 401 429 438 447 455 460
601.02 645 645 651 661 672 680 686
601.03 379 379 393 413 432 449 460
Census Tract Total 1,421 1,425 1,473 1,512 1,551 1,584 1,607
602 602.01 668 671 672 672 673 674 674
602.02 644 644 645 646 648 649 650
Census Tract Total 1,312 1,315 1,316 1,319 1,321 1,323 1,325
603 603.01 267 269 293 310 319 325 334
603.02 693 692 763 806 828 842 864
Census Tract Total 960 961 1,056 1,117 1,147 1,168 1,198
(Continued)
VII-21
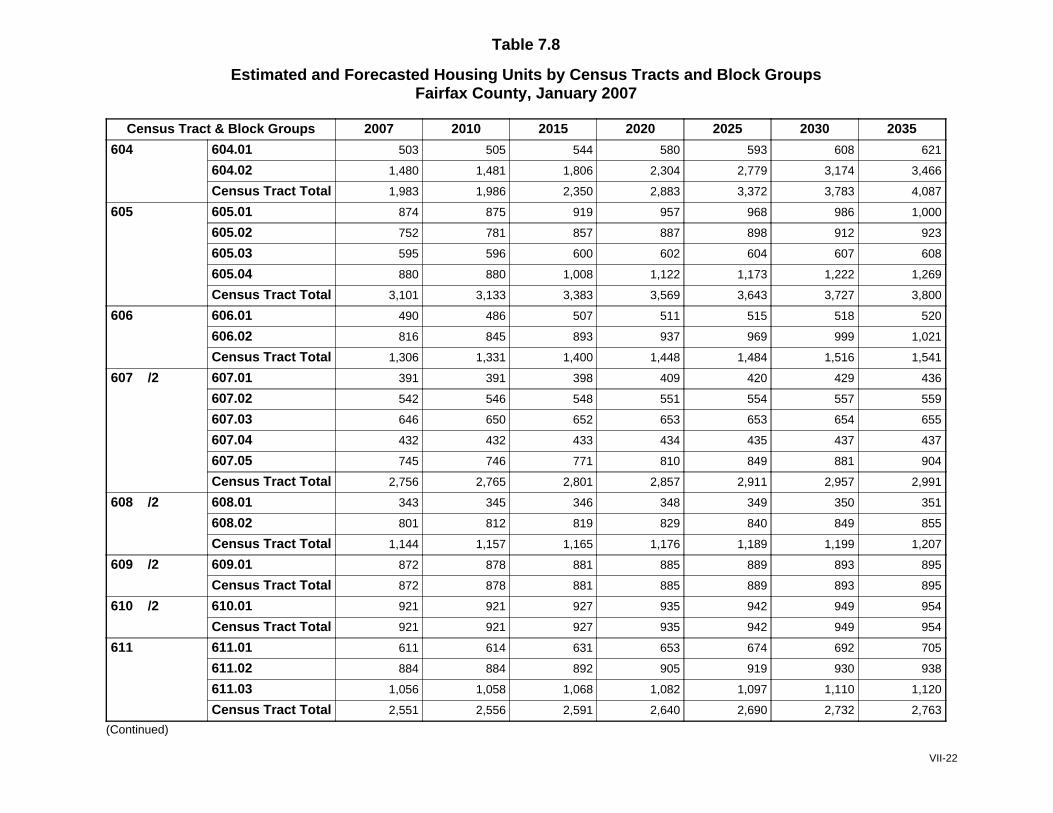
Table 7.8
Estimated and Forecasted Housing Units by Census Tracts and Block GroupsFairfax County, January 2007
Census Tract & Block Groups 2007 2010 2015 2020 2025 2030 2035
604 604.01 503 505 544 580 593 608 621
604.02 1,480 1,481 1,806 2,304 2,779 3,174 3,466
Census Tract Total 1,983 1,986 2,350 2,883 3,372 3,783 4,087
605 605.01 874 875 919 957 968 986 1,000
605.02 752 781 857 887 898 912 923
605.03 595 596 600 602 604 607 608
605.04 880 880 1,008 1,122 1,173 1,222 1,269
Census Tract Total 3,101 3,133 3,383 3,569 3,643 3,727 3,800
606 606.01 490 486 507 511 515 518 520
606.02 816 845 893 937 969 999 1,021
Census Tract Total 1,306 1,331 1,400 1,448 1,484 1,516 1,541
607 /2 607.01 391 391 398 409 420 429 436
607.02 542 546 548 551 554 557 559
607.03 646 650 652 653 653 654 655
607.04 432 432 433 434 435 437 437
607.05 745 746 771 810 849 881 904
Census Tract Total 2,756 2,765 2,801 2,857 2,911 2,957 2,991
608 /2 608.01 343 345 346 348 349 350 351
608.02 801 812 819 829 840 849 855
Census Tract Total 1,144 1,157 1,165 1,176 1,189 1,199 1,207
609 /2 609.01 872 878 881 885 889 893 895
Census Tract Total 872 878 881 885 889 893 895
610 /2 610.01 921 921 927 935 942 949 954
Census Tract Total 921 921 927 935 942 949 954
611 611.01 611 614 631 653 674 692 705
611.02 884 884 892 905 919 930 938
611.03 1,056 1,058 1,068 1,082 1,097 1,110 1,120
Census Tract Total 2,551 2,556 2,591 2,640 2,690 2,732 2,763
(Continued)
VII-22

Table 7.8
Estimated and Forecasted Housing Units by Census Tracts and Block GroupsFairfax County, January 2007
Census Tract & Block Groups 2007 2010 2015 2020 2025 2030 2035
612 612.01 227 229 229 229 230 230 230
612.02 1,291 1,319 1,324 1,325 1,327 1,328 1,329
612.03 1,976 2,131 2,711 2,755 2,771 2,781 2,798
Census Tract Total 3,494 3,679 4,264 4,310 4,328 4,339 4,357
615 615.01 357 358 364 373 383 392 397
615.02 290 290 295 303 311 317 322
615.03 502 502 508 520 532 541 547
615.04 1,323 1,324 1,369 1,436 1,498 1,547 1,590
Census Tract Total 2,472 2,474 2,535 2,632 2,724 2,797 2,856
616 616.01 1,423 1,967 4,052 4,099 4,146 4,185 4,213
616.02 470 472 495 516 532 544 553
616.03 2,039 2,148 2,621 2,621 2,621 2,621 2,621
616.04 390 390 391 391 392 392 392
Census Tract Total 4,322 4,977 7,559 7,628 7,690 7,742 7,779
617 617.01 913 913 951 1,012 1,072 1,121 1,157
617.02 953 953 953 953 953 953 953
617.03 577 579 585 594 604 612 618
Census Tract Total 2,443 2,445 2,489 2,560 2,629 2,687 2,728
618 618.01 393 614 643 650 657 662 666
618.02 1,089 1,089 1,108 1,137 1,166 1,191 1,208
618.03 1,378 1,378 1,397 1,426 1,455 1,479 1,497
Census Tract Total 2,860 3,081 3,148 3,214 3,278 3,332 3,372
619 619.01 594 594 604 619 634 647 656
619.02 1,330 1,338 1,358 1,380 1,395 1,407 1,418
Census Tract Total 1,924 1,932 1,962 1,999 2,029 2,054 2,074
701 701.01 287 290 354 406 427 448 469
701.02 679 685 840 966 1,019 1,071 1,123
Census Tract Total 966 975 1,194 1,372 1,446 1,519 1,593
(Continued)
VII-23
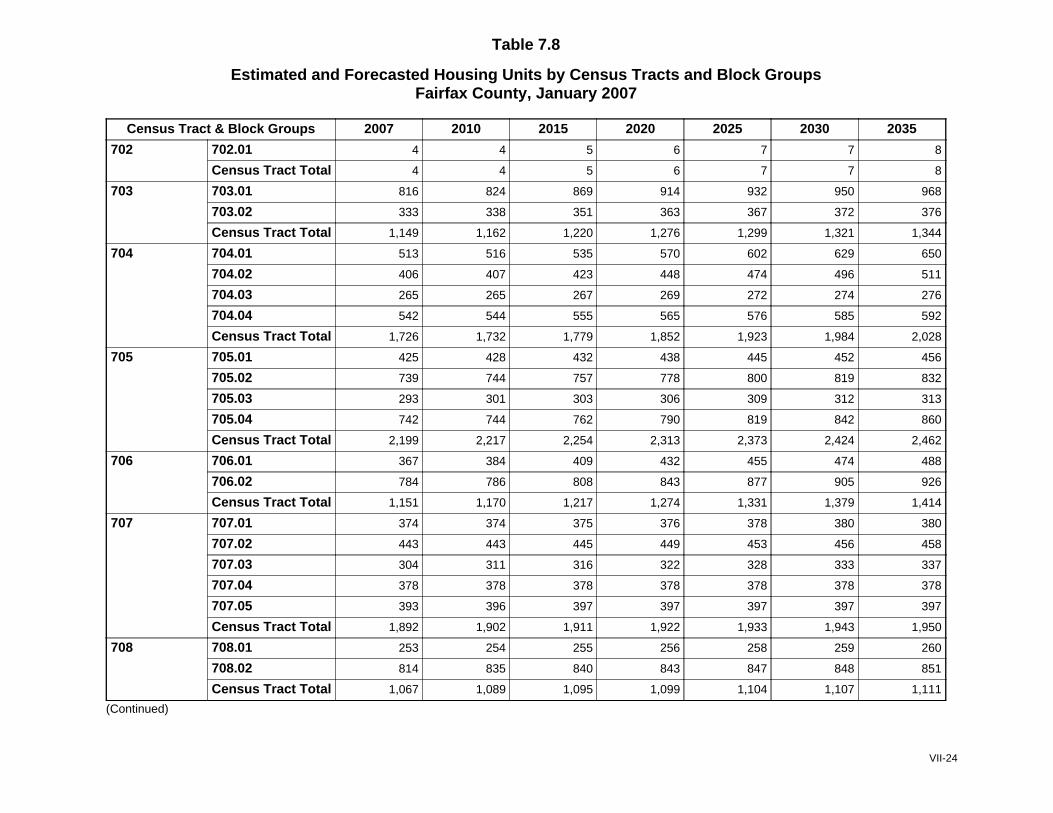
Table 7.8
Estimated and Forecasted Housing Units by Census Tracts and Block GroupsFairfax County, January 2007
Census Tract & Block Groups 2007 2010 2015 2020 2025 2030 2035
702 702.01 4 4 5 6 7 7 8
Census Tract Total 4 4 5 6 7 7 8
703 703.01 816 824 869 914 932 950 968
703.02 333 338 351 363 367 372 376
Census Tract Total 1,149 1,162 1,220 1,276 1,299 1,321 1,344
704 704.01 513 516 535 570 602 629 650
704.02 406 407 423 448 474 496 511
704.03 265 265 267 269 272 274 276
704.04 542 544 555 565 576 585 592
Census Tract Total 1,726 1,732 1,779 1,852 1,923 1,984 2,028
705 705.01 425 428 432 438 445 452 456
705.02 739 744 757 778 800 819 832
705.03 293 301 303 306 309 312 313
705.04 742 744 762 790 819 842 860
Census Tract Total 2,199 2,217 2,254 2,313 2,373 2,424 2,462
706 706.01 367 384 409 432 455 474 488
706.02 784 786 808 843 877 905 926
Census Tract Total 1,151 1,170 1,217 1,274 1,331 1,379 1,414
707 707.01 374 374 375 376 378 380 380
707.02 443 443 445 449 453 456 458
707.03 304 311 316 322 328 333 337
707.04 378 378 378 378 378 378 378
707.05 393 396 397 397 397 397 397
Census Tract Total 1,892 1,902 1,911 1,922 1,933 1,943 1,950
708 708.01 253 254 255 256 258 259 260
708.02 814 835 840 843 847 848 851
Census Tract Total 1,067 1,089 1,095 1,099 1,104 1,107 1,111
(Continued)
VII-24

Table 7.8
Estimated and Forecasted Housing Units by Census Tracts and Block GroupsFairfax County, January 2007
Census Tract & Block Groups 2007 2010 2015 2020 2025 2030 2035
709 709.01 870 883 883 884 885 885 885
709.02 766 772 776 783 790 795 799
709.03 232 235 235 236 237 237 238
709.04 375 491 512 520 523 526 529
709.05 426 434 443 454 464 473 479
Census Tract Total 2,669 2,816 2,850 2,876 2,898 2,916 2,930
710 710.01 843 848 1,073 1,415 1,738 2,009 2,206
Census Tract Total 843 848 1,073 1,415 1,738 2,009 2,206
711 711.01 364 368 368 368 368 368 368
711.02 573 578 579 581 582 584 585
711.03 267 267 267 267 267 267 267
711.04 664 665 676 693 710 724 734
711.05 587 588 594 601 609 615 619
Census Tract Total 2,455 2,466 2,484 2,510 2,536 2,557 2,572
712 712.01 231 234 234 234 235 235 235
712.02 624 624 624 624 624 624 624
712.03 1,378 1,378 1,552 1,830 2,101 2,327 2,491
712.04 1,573 1,573 1,630 1,719 1,807 1,882 1,933
Census Tract Total 3,806 3,809 4,040 4,408 4,766 5,068 5,284
713 713.01 1,623 1,625 1,635 1,636 1,636 1,637 1,637
713.02 720 720 750 799 846 885 914
713.03 1,017 1,017 1,024 1,031 1,039 1,046 1,050
713.04 642 659 686 718 748 774 792
Census Tract Total 4,002 4,021 4,095 4,184 4,270 4,342 4,394
714 714.01 490 492 495 501 506 511 515
714.02 1,223 1,227 1,247 1,277 1,307 1,331 1,349
714.03 894 895 895 895 895 895 895
Census Tract Total 2,607 2,614 2,637 2,673 2,708 2,738 2,759
(Continued)
VII-25
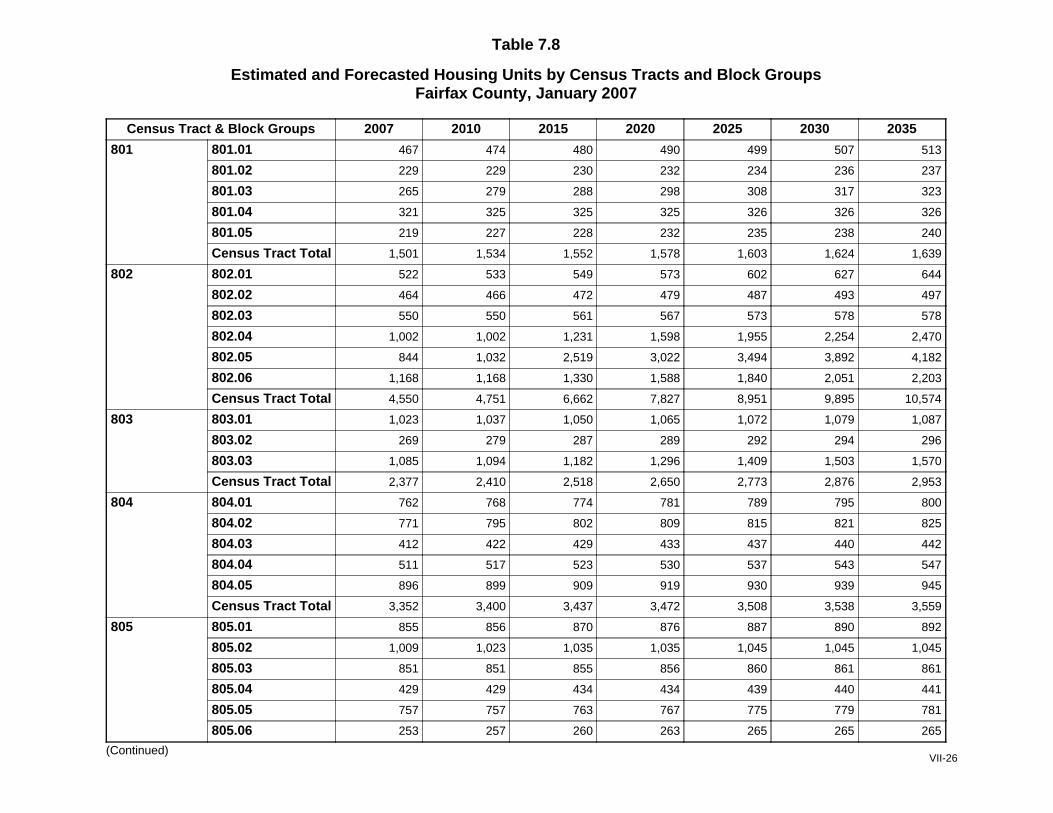
Table 7.8
Estimated and Forecasted Housing Units by Census Tracts and Block GroupsFairfax County, January 2007
Census Tract & Block Groups 2007 2010 2015 2020 2025 2030 2035
801 801.01 467 474 480 490 499 507 513
801.02 229 229 230 232 234 236 237
801.03 265 279 288 298 308 317 323
801.04 321 325 325 325 326 326 326
801.05 219 227 228 232 235 238 240
Census Tract Total 1,501 1,534 1,552 1,578 1,603 1,624 1,639
802 802.01 522 533 549 573 602 627 644
802.02 464 466 472 479 487 493 497
802.03 550 550 561 567 573 578 578
802.04 1,002 1,002 1,231 1,598 1,955 2,254 2,470
802.05 844 1,032 2,519 3,022 3,494 3,892 4,182
802.06 1,168 1,168 1,330 1,588 1,840 2,051 2,203
Census Tract Total 4,550 4,751 6,662 7,827 8,951 9,895 10,574
803 803.01 1,023 1,037 1,050 1,065 1,072 1,079 1,087
803.02 269 279 287 289 292 294 296
803.03 1,085 1,094 1,182 1,296 1,409 1,503 1,570
Census Tract Total 2,377 2,410 2,518 2,650 2,773 2,876 2,953
804 804.01 762 768 774 781 789 795 800
804.02 771 795 802 809 815 821 825
804.03 412 422 429 433 437 440 442
804.04 511 517 523 530 537 543 547
804.05 896 899 909 919 930 939 945
Census Tract Total 3,352 3,400 3,437 3,472 3,508 3,538 3,559
805 805.01 855 856 870 876 887 890 892
805.02 1,009 1,023 1,035 1,035 1,045 1,045 1,045
805.03 851 851 855 856 860 861 861
805.04 429 429 434 434 439 440 441
805.05 757 757 763 767 775 779 781
805.06 253 257 260 263 265 265 265
(Continued)VII-26
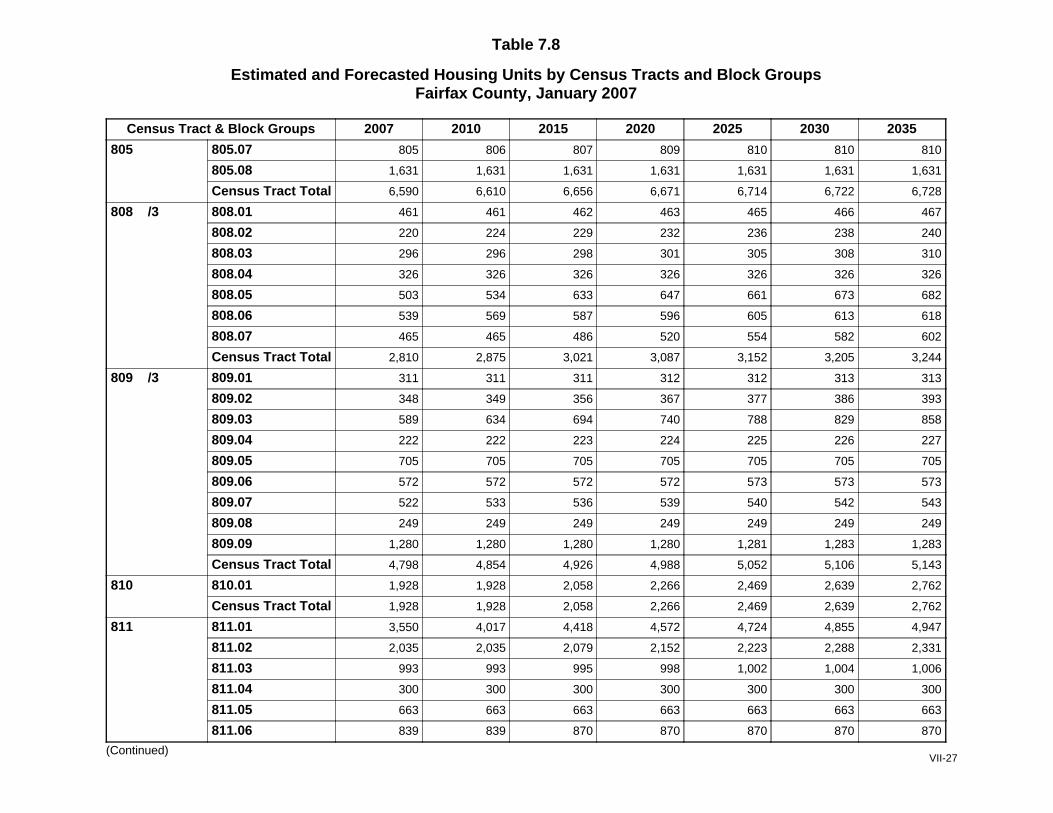
Table 7.8
Estimated and Forecasted Housing Units by Census Tracts and Block GroupsFairfax County, January 2007
Census Tract & Block Groups 2007 2010 2015 2020 2025 2030 2035
805.07 805 806 807 809 810 810 810805
805.08 1,631 1,631 1,631 1,631 1,631 1,631 1,631
Census Tract Total 6,590 6,610 6,656 6,671 6,714 6,722 6,728
808 /3 808.01 461 461 462 463 465 466 467
808.02 220 224 229 232 236 238 240
808.03 296 296 298 301 305 308 310
808.04 326 326 326 326 326 326 326
808.05 503 534 633 647 661 673 682
808.06 539 569 587 596 605 613 618
808.07 465 465 486 520 554 582 602
Census Tract Total 2,810 2,875 3,021 3,087 3,152 3,205 3,244
809 /3 809.01 311 311 311 312 312 313 313
809.02 348 349 356 367 377 386 393
809.03 589 634 694 740 788 829 858
809.04 222 222 223 224 225 226 227
809.05 705 705 705 705 705 705 705
809.06 572 572 572 572 573 573 573
809.07 522 533 536 539 540 542 543
809.08 249 249 249 249 249 249 249
809.09 1,280 1,280 1,280 1,280 1,281 1,283 1,283
Census Tract Total 4,798 4,854 4,926 4,988 5,052 5,106 5,143
810 810.01 1,928 1,928 2,058 2,266 2,469 2,639 2,762
Census Tract Total 1,928 1,928 2,058 2,266 2,469 2,639 2,762
811 811.01 3,550 4,017 4,418 4,572 4,724 4,855 4,947
811.02 2,035 2,035 2,079 2,152 2,223 2,288 2,331
811.03 993 993 995 998 1,002 1,004 1,006
811.04 300 300 300 300 300 300 300
811.05 663 663 663 663 663 663 663
811.06 839 839 870 870 870 870 870
(Continued)VII-27
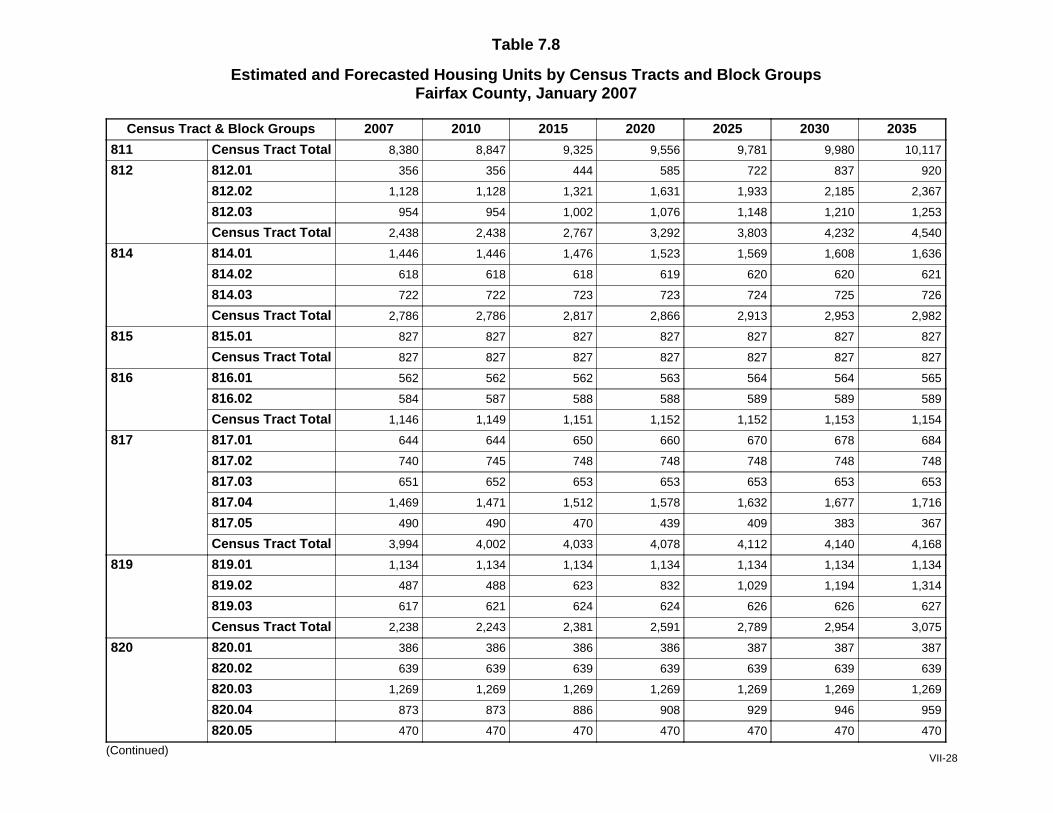
Table 7.8
Estimated and Forecasted Housing Units by Census Tracts and Block GroupsFairfax County, January 2007
Census Tract & Block Groups 2007 2010 2015 2020 2025 2030 2035
Census Tract Total 8,380 8,847 9,325 9,556 9,781 9,980 10,117811
812 812.01 356 356 444 585 722 837 920
812.02 1,128 1,128 1,321 1,631 1,933 2,185 2,367
812.03 954 954 1,002 1,076 1,148 1,210 1,253
Census Tract Total 2,438 2,438 2,767 3,292 3,803 4,232 4,540
814 814.01 1,446 1,446 1,476 1,523 1,569 1,608 1,636
814.02 618 618 618 619 620 620 621
814.03 722 722 723 723 724 725 726
Census Tract Total 2,786 2,786 2,817 2,866 2,913 2,953 2,982
815 815.01 827 827 827 827 827 827 827
Census Tract Total 827 827 827 827 827 827 827
816 816.01 562 562 562 563 564 564 565
816.02 584 587 588 588 589 589 589
Census Tract Total 1,146 1,149 1,151 1,152 1,152 1,153 1,154
817 817.01 644 644 650 660 670 678 684
817.02 740 745 748 748 748 748 748
817.03 651 652 653 653 653 653 653
817.04 1,469 1,471 1,512 1,578 1,632 1,677 1,716
817.05 490 490 470 439 409 383 367
Census Tract Total 3,994 4,002 4,033 4,078 4,112 4,140 4,168
819 819.01 1,134 1,134 1,134 1,134 1,134 1,134 1,134
819.02 487 488 623 832 1,029 1,194 1,314
819.03 617 621 624 624 626 626 627
Census Tract Total 2,238 2,243 2,381 2,591 2,789 2,954 3,075
820 820.01 386 386 386 386 387 387 387
820.02 639 639 639 639 639 639 639
820.03 1,269 1,269 1,269 1,269 1,269 1,269 1,269
820.04 873 873 886 908 929 946 959
820.05 470 470 470 470 470 470 470
(Continued)VII-28
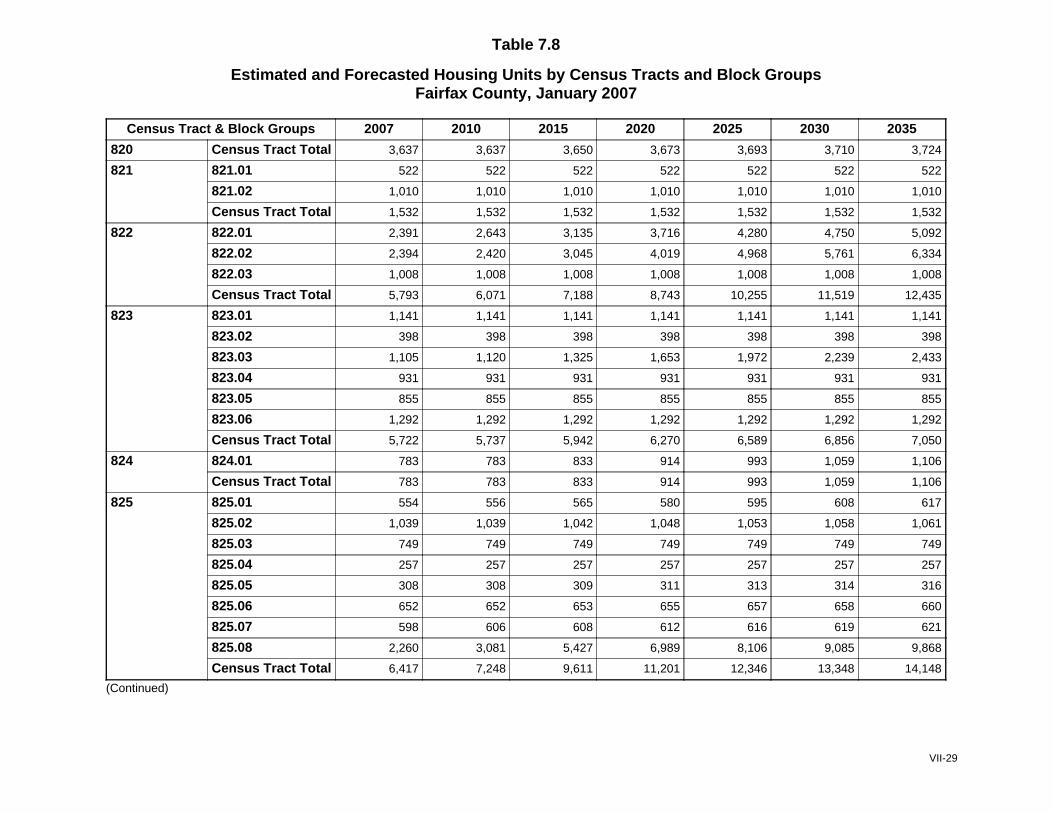
Table 7.8
Estimated and Forecasted Housing Units by Census Tracts and Block GroupsFairfax County, January 2007
Census Tract & Block Groups 2007 2010 2015 2020 2025 2030 2035
Census Tract Total 3,637 3,637 3,650 3,673 3,693 3,710 3,724820
821 821.01 522 522 522 522 522 522 522
821.02 1,010 1,010 1,010 1,010 1,010 1,010 1,010
Census Tract Total 1,532 1,532 1,532 1,532 1,532 1,532 1,532
822 822.01 2,391 2,643 3,135 3,716 4,280 4,750 5,092
822.02 2,394 2,420 3,045 4,019 4,968 5,761 6,334
822.03 1,008 1,008 1,008 1,008 1,008 1,008 1,008
Census Tract Total 5,793 6,071 7,188 8,743 10,255 11,519 12,435
823 823.01 1,141 1,141 1,141 1,141 1,141 1,141 1,141
823.02 398 398 398 398 398 398 398
823.03 1,105 1,120 1,325 1,653 1,972 2,239 2,433
823.04 931 931 931 931 931 931 931
823.05 855 855 855 855 855 855 855
823.06 1,292 1,292 1,292 1,292 1,292 1,292 1,292
Census Tract Total 5,722 5,737 5,942 6,270 6,589 6,856 7,050
824 824.01 783 783 833 914 993 1,059 1,106
Census Tract Total 783 783 833 914 993 1,059 1,106
825 825.01 554 556 565 580 595 608 617
825.02 1,039 1,039 1,042 1,048 1,053 1,058 1,061
825.03 749 749 749 749 749 749 749
825.04 257 257 257 257 257 257 257
825.05 308 308 309 311 313 314 316
825.06 652 652 653 655 657 658 660
825.07 598 606 608 612 616 619 621
825.08 2,260 3,081 5,427 6,989 8,106 9,085 9,868
Census Tract Total 6,417 7,248 9,611 11,201 12,346 13,348 14,148
(Continued)
VII-29
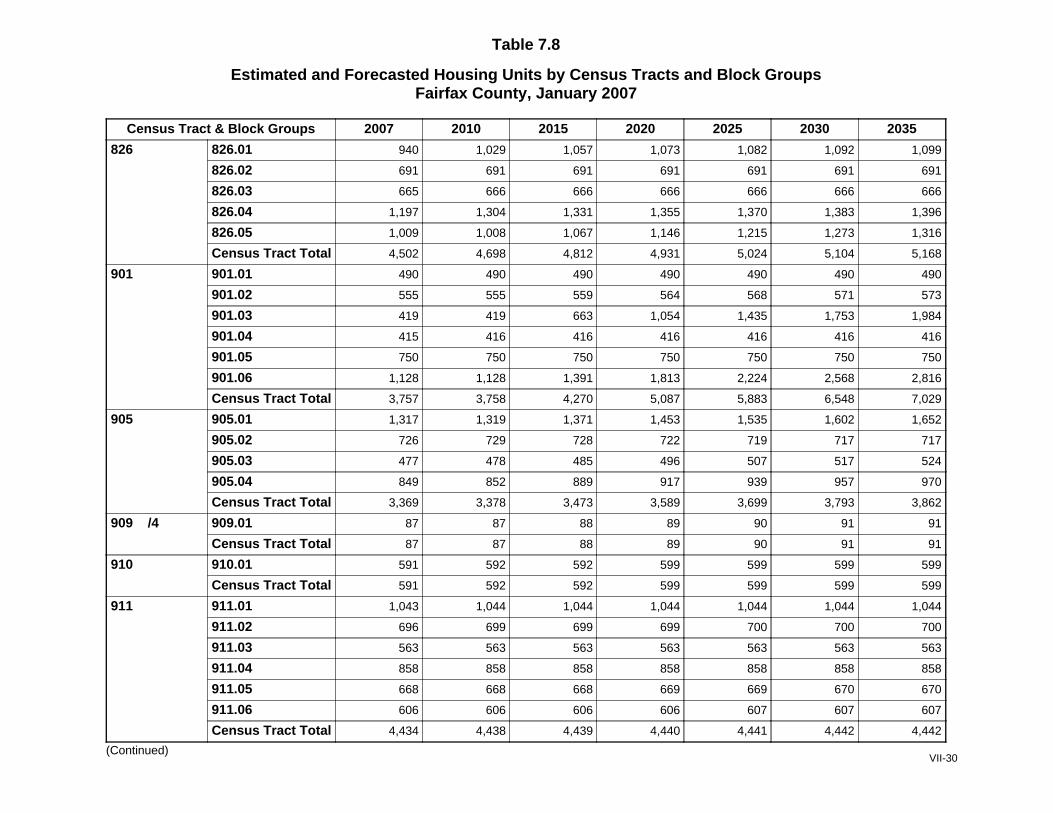
Table 7.8
Estimated and Forecasted Housing Units by Census Tracts and Block GroupsFairfax County, January 2007
Census Tract & Block Groups 2007 2010 2015 2020 2025 2030 2035
826 826.01 940 1,029 1,057 1,073 1,082 1,092 1,099
826.02 691 691 691 691 691 691 691
826.03 665 666 666 666 666 666 666
826.04 1,197 1,304 1,331 1,355 1,370 1,383 1,396
826.05 1,009 1,008 1,067 1,146 1,215 1,273 1,316
Census Tract Total 4,502 4,698 4,812 4,931 5,024 5,104 5,168
901 901.01 490 490 490 490 490 490 490
901.02 555 555 559 564 568 571 573
901.03 419 419 663 1,054 1,435 1,753 1,984
901.04 415 416 416 416 416 416 416
901.05 750 750 750 750 750 750 750
901.06 1,128 1,128 1,391 1,813 2,224 2,568 2,816
Census Tract Total 3,757 3,758 4,270 5,087 5,883 6,548 7,029
905 905.01 1,317 1,319 1,371 1,453 1,535 1,602 1,652
905.02 726 729 728 722 719 717 717
905.03 477 478 485 496 507 517 524
905.04 849 852 889 917 939 957 970
Census Tract Total 3,369 3,378 3,473 3,589 3,699 3,793 3,862
909 /4 909.01 87 87 88 89 90 91 91
Census Tract Total 87 87 88 89 90 91 91
910 910.01 591 592 592 599 599 599 599
Census Tract Total 591 592 592 599 599 599 599
911 911.01 1,043 1,044 1,044 1,044 1,044 1,044 1,044
911.02 696 699 699 699 700 700 700
911.03 563 563 563 563 563 563 563
911.04 858 858 858 858 858 858 858
911.05 668 668 668 669 669 670 670
911.06 606 606 606 606 607 607 607
Census Tract Total 4,434 4,438 4,439 4,440 4,441 4,442 4,442
(Continued)VII-30
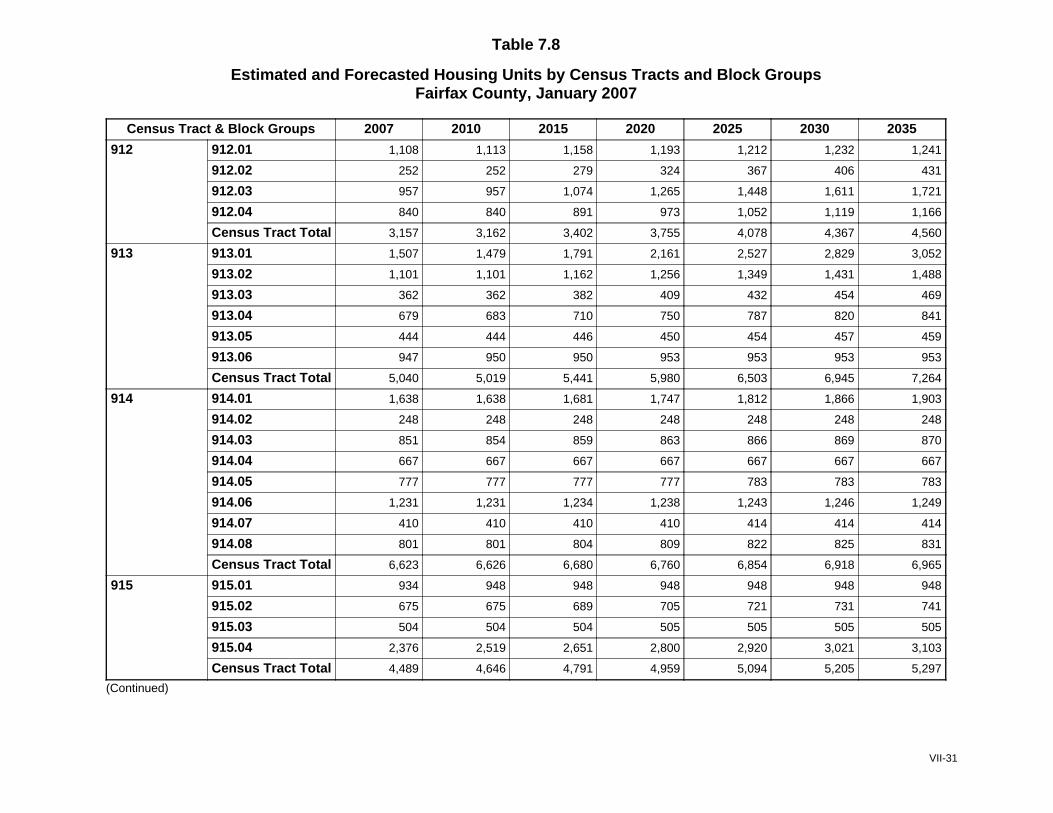
Table 7.8
Estimated and Forecasted Housing Units by Census Tracts and Block GroupsFairfax County, January 2007
Census Tract & Block Groups 2007 2010 2015 2020 2025 2030 2035
912 912.01 1,108 1,113 1,158 1,193 1,212 1,232 1,241
912.02 252 252 279 324 367 406 431
912.03 957 957 1,074 1,265 1,448 1,611 1,721
912.04 840 840 891 973 1,052 1,119 1,166
Census Tract Total 3,157 3,162 3,402 3,755 4,078 4,367 4,560
913 913.01 1,507 1,479 1,791 2,161 2,527 2,829 3,052
913.02 1,101 1,101 1,162 1,256 1,349 1,431 1,488
913.03 362 362 382 409 432 454 469
913.04 679 683 710 750 787 820 841
913.05 444 444 446 450 454 457 459
913.06 947 950 950 953 953 953 953
Census Tract Total 5,040 5,019 5,441 5,980 6,503 6,945 7,264
914 914.01 1,638 1,638 1,681 1,747 1,812 1,866 1,903
914.02 248 248 248 248 248 248 248
914.03 851 854 859 863 866 869 870
914.04 667 667 667 667 667 667 667
914.05 777 777 777 777 783 783 783
914.06 1,231 1,231 1,234 1,238 1,243 1,246 1,249
914.07 410 410 410 410 414 414 414
914.08 801 801 804 809 822 825 831
Census Tract Total 6,623 6,626 6,680 6,760 6,854 6,918 6,965
915 915.01 934 948 948 948 948 948 948
915.02 675 675 689 705 721 731 741
915.03 504 504 504 505 505 505 505
915.04 2,376 2,519 2,651 2,800 2,920 3,021 3,103
Census Tract Total 4,489 4,646 4,791 4,959 5,094 5,205 5,297
(Continued)
VII-31
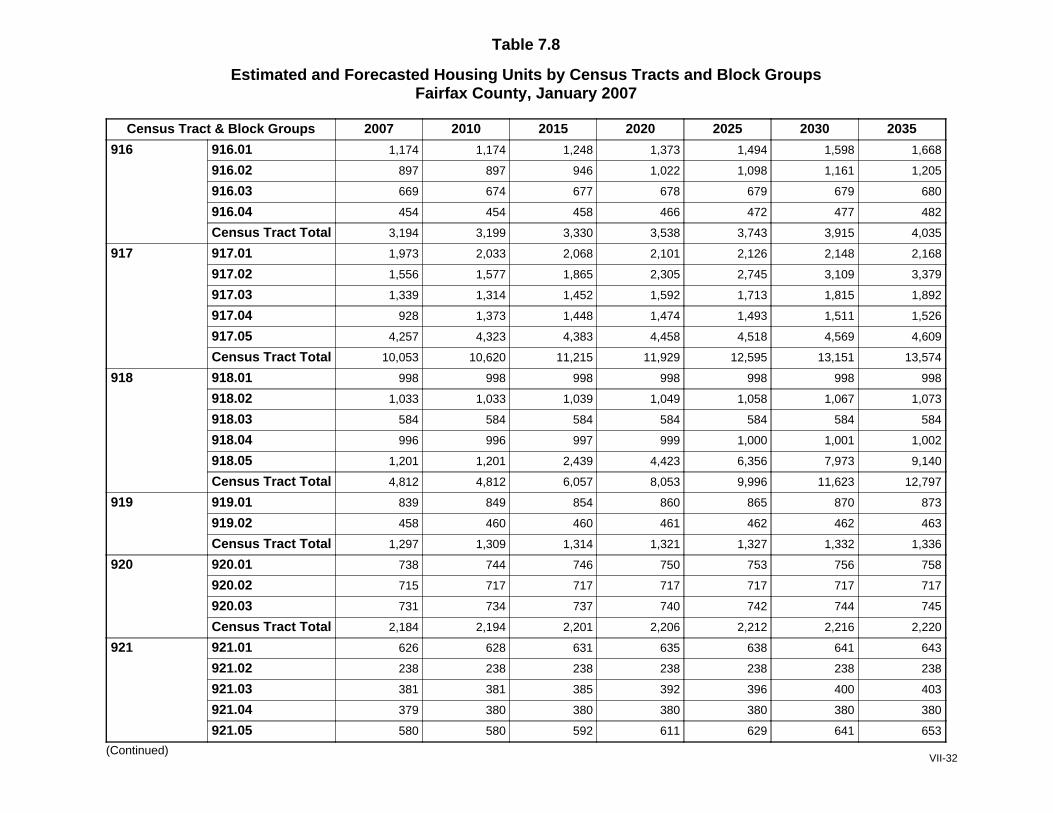
Table 7.8
Estimated and Forecasted Housing Units by Census Tracts and Block GroupsFairfax County, January 2007
Census Tract & Block Groups 2007 2010 2015 2020 2025 2030 2035
916 916.01 1,174 1,174 1,248 1,373 1,494 1,598 1,668
916.02 897 897 946 1,022 1,098 1,161 1,205
916.03 669 674 677 678 679 679 680
916.04 454 454 458 466 472 477 482
Census Tract Total 3,194 3,199 3,330 3,538 3,743 3,915 4,035
917 917.01 1,973 2,033 2,068 2,101 2,126 2,148 2,168
917.02 1,556 1,577 1,865 2,305 2,745 3,109 3,379
917.03 1,339 1,314 1,452 1,592 1,713 1,815 1,892
917.04 928 1,373 1,448 1,474 1,493 1,511 1,526
917.05 4,257 4,323 4,383 4,458 4,518 4,569 4,609
Census Tract Total 10,053 10,620 11,215 11,929 12,595 13,151 13,574
918 918.01 998 998 998 998 998 998 998
918.02 1,033 1,033 1,039 1,049 1,058 1,067 1,073
918.03 584 584 584 584 584 584 584
918.04 996 996 997 999 1,000 1,001 1,002
918.05 1,201 1,201 2,439 4,423 6,356 7,973 9,140
Census Tract Total 4,812 4,812 6,057 8,053 9,996 11,623 12,797
919 919.01 839 849 854 860 865 870 873
919.02 458 460 460 461 462 462 463
Census Tract Total 1,297 1,309 1,314 1,321 1,327 1,332 1,336
920 920.01 738 744 746 750 753 756 758
920.02 715 717 717 717 717 717 717
920.03 731 734 737 740 742 744 745
Census Tract Total 2,184 2,194 2,201 2,206 2,212 2,216 2,220
921 921.01 626 628 631 635 638 641 643
921.02 238 238 238 238 238 238 238
921.03 381 381 385 392 396 400 403
921.04 379 380 380 380 380 380 380
921.05 580 580 592 611 629 641 653
(Continued)VII-32

Table 7.8
Estimated and Forecasted Housing Units by Census Tracts and Block GroupsFairfax County, January 2007
Census Tract & Block Groups 2007 2010 2015 2020 2025 2030 2035
Census Tract Total 2,204 2,207 2,226 2,255 2,281 2,300 2,318921
922 922.01 700 702 703 705 706 707 708
922.02 263 376 439 456 464 472 479
922.03 807 807 832 858 866 875 883
922.04 615 729 762 768 769 770 771
922.05 678 678 701 722 730 737 744
922.06 1,087 1,098 1,132 1,153 1,167 1,179 1,190
922.07 246 246 253 258 260 263 265
Census Tract Total 4,396 4,636 4,822 4,920 4,962 5,002 5,041
923 923.01 234 238 258 274 282 288 295
923.02 852 856 889 909 922 926 939
Census Tract Total 1,086 1,094 1,147 1,184 1,204 1,214 1,234
924 924.01 1,712 1,713 1,703 1,684 1,687 1,672 1,674
Census Tract Total 1,712 1,713 1,703 1,684 1,687 1,672 1,674
Fairfax County Total 391,139 398,304 421,400 442,755 462,122 478,443 490,602
Source: Fairfax County Department of Systems Managment for Human Services, 2007
Note: All census tracts in Fairfax County begin with number 4. To conserve space, the leading 4 is dropped from the census tract name in the information contained in thistable. Countywide totals may vary by table depending onhow well the geographic layer aligns with actual county boundaries.
1/ On Fort Belvior Military Reservation, Fairfax County does not estimate or forecast dwelling units.
2/ Comprises part of the Town of Vienna.
3/ Comprises part of the Town of Herndon.
4/ Town of Clifton.
VII-33


MARKET VALUE Market value refers to the estimated market value of owned housing units as of January 1 of the respective year on the table. Estimated market value for each dwelling unit represents a previous year sales price or is derived from the latest tax assessment value. For housing units without a previous year sales price, market value is derived by comparing the spread between current sales prices and assessments of properties that sold during the previous year. Median market value is a statistic calculated from individual market value information for a particular geography. The estimated median market value of individually owned housing units indicates that half of all owned housing units in the County had market values exceeding this value and half had values below this level.
Average market value also is a statistic calculated from individual market value information for a particular geography. Often called the mean, the average is a measure of central tendency. The estimated average market value of individually owned housing units is calculated by summing the individual market values of all owned housing units and dividing by the number of owned housing units.
VIII-1
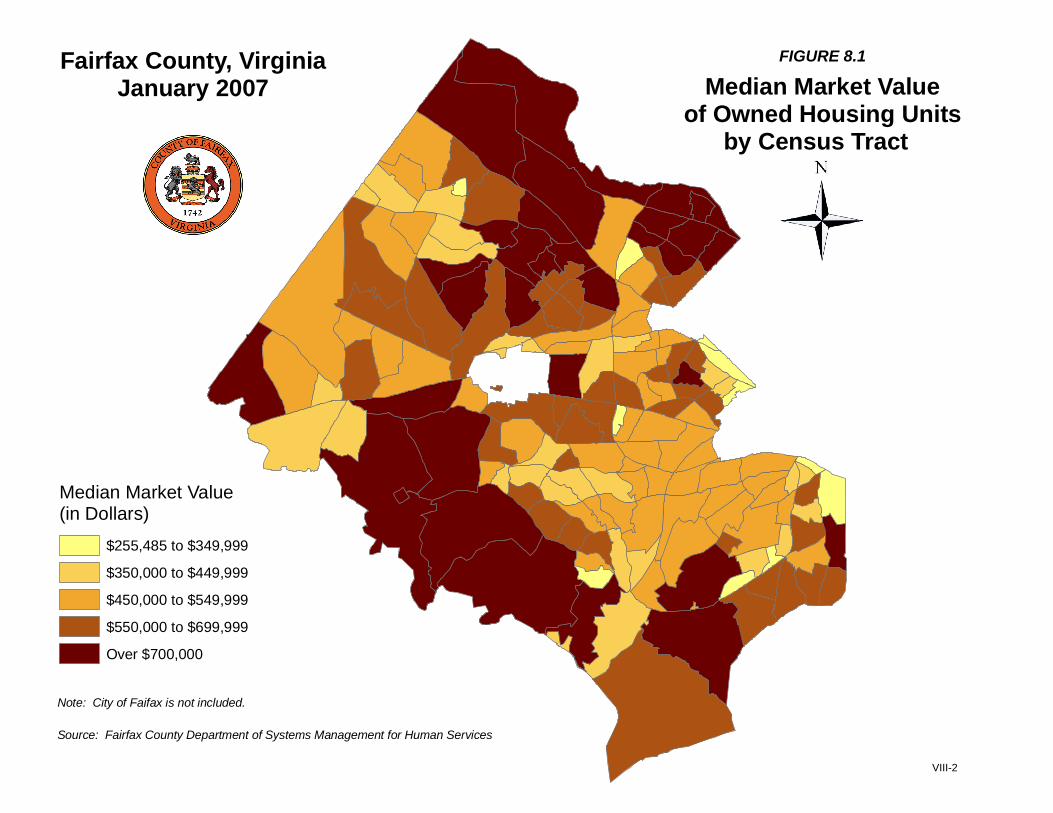
Note: City of Faifax is not included.
Source: Fairfax County Department of Systems Management for Human Services
Fairfax County, VirginiaJanuary 2007
FIGURE 8.1
Median Market Valueof Owned Housing Units
by Census Tract
Median Market Value(in Dollars)
$255,485 to $349,999
$350,000 to $449,999
$450,000 to $549,999
$550,000 to $699,999
Over $700,000
VIII-2
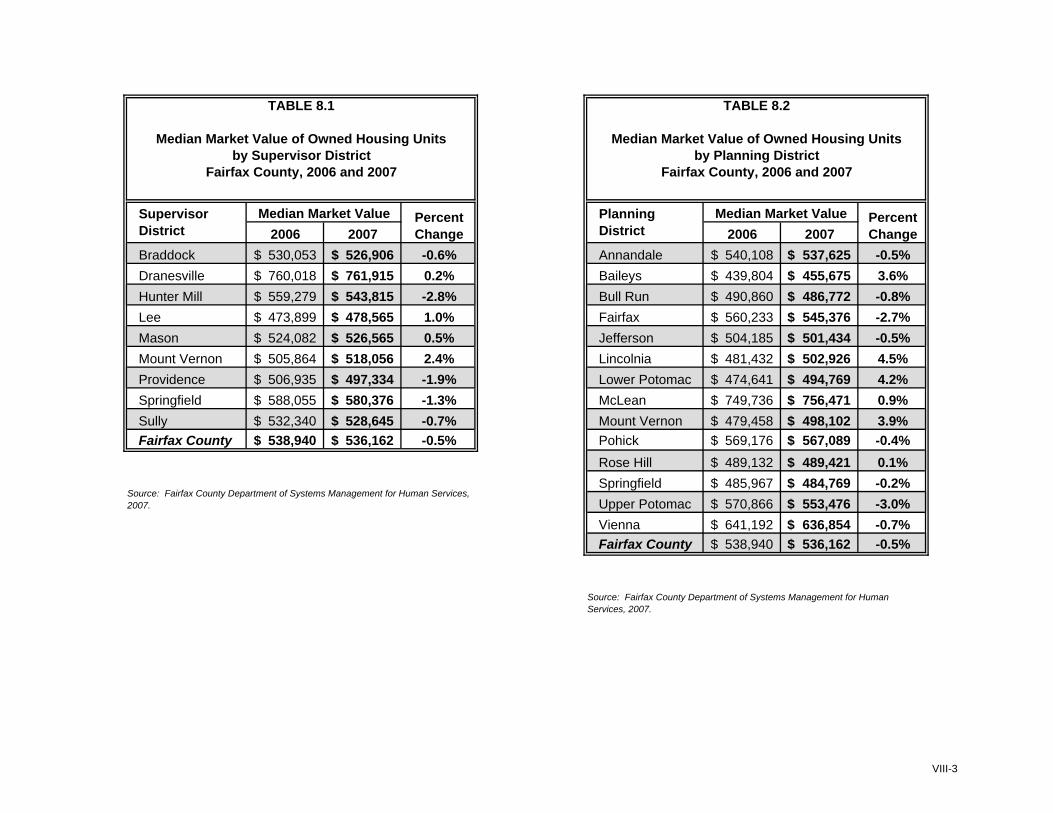
2006 2007 2006 2007Braddock 530,053$ 526,906$ -0.6% Annandale 540,108$ 537,625$ -0.5%Dranesville 760,018$ 761,915$ 0.2% Baileys 439,804$ 455,675$ 3.6%Hunter Mill 559,279$ 543,815$ -2.8% Bull Run 490,860$ 486,772$ -0.8%Lee 473,899$ 478,565$ 1.0% Fairfax 560,233$ 545,376$ -2.7%Mason 524,082$ 526,565$ 0.5% Jefferson 504,185$ 501,434$ -0.5%Mount Vernon 505,864$ 518,056$ 2.4% Lincolnia 481,432$ 502,926$ 4.5%Providence 506,935$ 497,334$ -1.9% Lower Potomac 474,641$ 494,769$ 4.2%Springfield 588,055$ 580,376$ -1.3% McLean 749,736$ 756,471$ 0.9%Sully 532,340$ 528,645$ -0.7% Mount Vernon 479,458$ 498,102$ 3.9%Fairfax County 538,940$ 536,162$ -0.5% Pohick 569,176$ 567,089$ -0.4%
Rose Hill 489,132$ 489,421$ 0.1%Springfield 485,967$ 484,769$ -0.2%Upper Potomac 570,866$ 553,476$ -3.0%Vienna 641,192$ 636,854$ -0.7%Fairfax County 538,940$ 536,162$ -0.5%
Source: Fairfax County Department of Systems Management for Human Services, 2007.
Source: Fairfax County Department of Systems Management for Human Services, 2007.
Median Market Value PercentChange
TABLE 8.1
Median Market Value of Owned Housing Unitsby Supervisor District
Fairfax County, 2006 and 2007
Supervisor District
Median Market Value PercentChange
Fairfax County, 2006 and 2007
Planning District
TABLE 8.2
Median Market Value of Owned Housing Unitsby Planning District
VIII-3

Table 8.3
Estimated Median and Average Market ValuesOwned Housing Units by Unit Type and Supervisor District
Fairfax County, January 2007
Median Market Value Average Market Value
Supervisor DistrictSingle Family
DetachedSingle Family
Attached Multifamily All UnitsSingle Family
DetachedSingle Family
Attached Multifamily All Units
Braddock $579,546 $401,556 $255,943 $526,906 $594,173 $402,023 $257,090 $514,163
Dranesville 1/ $832,237 $423,490 $291,665 $761,915 $1,006,610 $517,903 $355,456 $914,616
Hunter Mill 2/ $682,473 $419,040 $304,326 $543,815 $732,248 $447,093 $352,411 $573,386
Lee $525,734 $424,086 $320,482 $478,565 $571,025 $433,243 $305,092 $487,824
Mason $600,435 $462,264 $260,041 $526,565 $642,388 $473,986 $273,511 $531,870
Mount Vernon $627,341 $386,754 $278,124 $518,056 $680,056 $395,113 $297,646 $551,816
Providence $671,649 $470,651 $315,700 $497,334 $731,128 $497,177 $327,755 $543,021
Springfield 3/ $682,264 $432,556 $329,324 $580,376 $738,367 $438,614 $322,831 $628,115
Sully $665,038 $386,797 $281,254 $528,645 $717,640 $391,366 $280,593 $567,940
Fairfax County $641,388 $417,198 $293,865 $536,162 $730,709 $434,819 $312,587 $592,824
Source: Fairfax County Department of Systems Management for Human Services, 2007
Note: The single family attached category includes townhouses, duplexes and multiplex units. The multifamily category includes condominium and other units in structures with a common entryway.
Excludes units in rental complexes, units in nonresidential structures, and units in certain ownership statuses such as cooperatives. Market value refers to the estimated value as of January 2007.
Market value for each unit is derived from the 2007 tax assessment and is adjusted to reflect the unit's market value or sales price if the unit sold during the prior year. All dollars are expressed
in thousands of dollars. Countywide totals may vary by table depending on how well the geographic layer aligns with actual county boundaries.
1/ Includes the Town of Herndon.
2/ Includes the Town of Vienna.
3/ Includes the Town of Clifton.
VIII-4
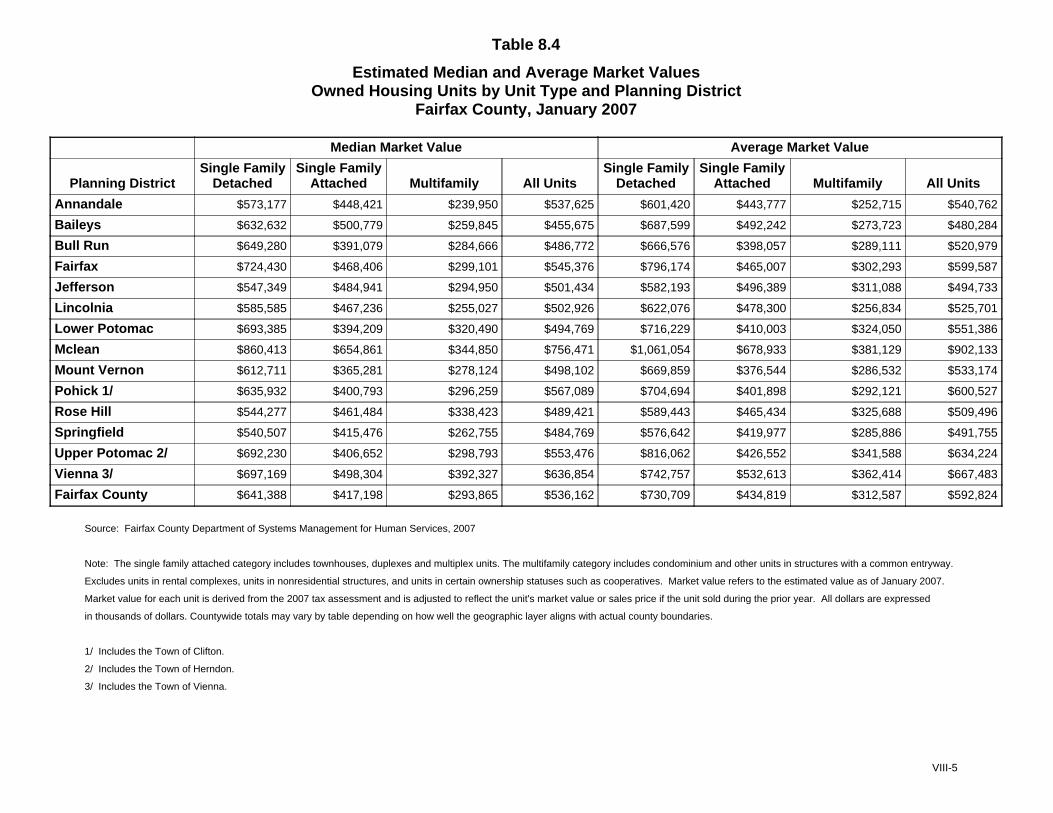
Table 8.4
Estimated Median and Average Market ValuesOwned Housing Units by Unit Type and Planning District
Fairfax County, January 2007
Median Market Value Average Market Value
Planning DistrictSingle Family
DetachedSingle Family
Attached Multifamily All UnitsSingle Family
DetachedSingle Family
Attached Multifamily All Units
Annandale $573,177 $448,421 $239,950 $537,625 $601,420 $443,777 $252,715 $540,762
Baileys $632,632 $500,779 $259,845 $455,675 $687,599 $492,242 $273,723 $480,284
Bull Run $649,280 $391,079 $284,666 $486,772 $666,576 $398,057 $289,111 $520,979
Fairfax $724,430 $468,406 $299,101 $545,376 $796,174 $465,007 $302,293 $599,587
Jefferson $547,349 $484,941 $294,950 $501,434 $582,193 $496,389 $311,088 $494,733
Lincolnia $585,585 $467,236 $255,027 $502,926 $622,076 $478,300 $256,834 $525,701
Lower Potomac $693,385 $394,209 $320,490 $494,769 $716,229 $410,003 $324,050 $551,386
Mclean $860,413 $654,861 $344,850 $756,471 $1,061,054 $678,933 $381,129 $902,133
Mount Vernon $612,711 $365,281 $278,124 $498,102 $669,859 $376,544 $286,532 $533,174
Pohick 1/ $635,932 $400,793 $296,259 $567,089 $704,694 $401,898 $292,121 $600,527
Rose Hill $544,277 $461,484 $338,423 $489,421 $589,443 $465,434 $325,688 $509,496
Springfield $540,507 $415,476 $262,755 $484,769 $576,642 $419,977 $285,886 $491,755
Upper Potomac 2/ $692,230 $406,652 $298,793 $553,476 $816,062 $426,552 $341,588 $634,224
Vienna 3/ $697,169 $498,304 $392,327 $636,854 $742,757 $532,613 $362,414 $667,483
Fairfax County $641,388 $417,198 $293,865 $536,162 $730,709 $434,819 $312,587 $592,824
Source: Fairfax County Department of Systems Management for Human Services, 2007
Note: The single family attached category includes townhouses, duplexes and multiplex units. The multifamily category includes condominium and other units in structures with a common entryway.
Excludes units in rental complexes, units in nonresidential structures, and units in certain ownership statuses such as cooperatives. Market value refers to the estimated value as of January 2007.
Market value for each unit is derived from the 2007 tax assessment and is adjusted to reflect the unit's market value or sales price if the unit sold during the prior year. All dollars are expressed
in thousands of dollars. Countywide totals may vary by table depending on how well the geographic layer aligns with actual county boundaries.
1/ Includes the Town of Clifton.
2/ Includes the Town of Herndon.
3/ Includes the Town of Vienna.
VIII-5
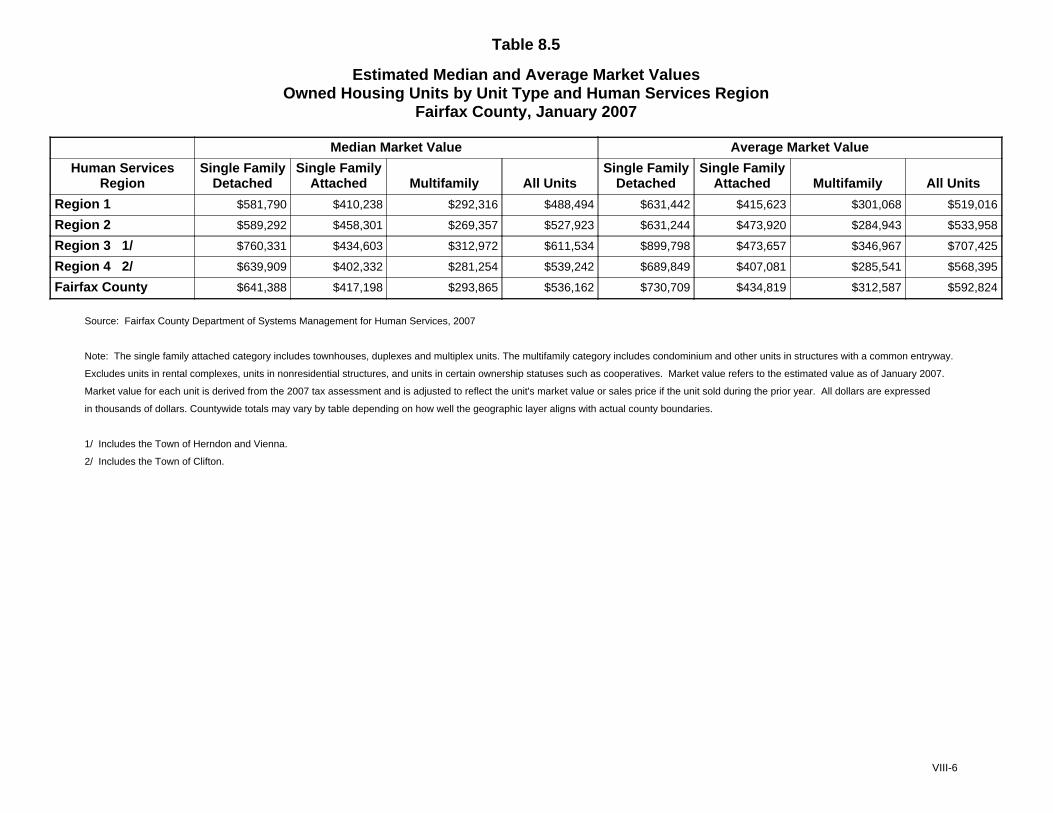
Table 8.5
Estimated Median and Average Market ValuesOwned Housing Units by Unit Type and Human Services Region
Fairfax County, January 2007
Median Market Value Average Market Value
Human ServicesRegion
Single FamilyDetached
Single FamilyAttached Multifamily All Units
Single FamilyDetached
Single FamilyAttached Multifamily All Units
Region 1 $581,790 $410,238 $292,316 $488,494 $631,442 $415,623 $301,068 $519,016
Region 2 $589,292 $458,301 $269,357 $527,923 $631,244 $473,920 $284,943 $533,958
Region 3 1/ $760,331 $434,603 $312,972 $611,534 $899,798 $473,657 $346,967 $707,425
Region 4 2/ $639,909 $402,332 $281,254 $539,242 $689,849 $407,081 $285,541 $568,395
Fairfax County $641,388 $417,198 $293,865 $536,162 $730,709 $434,819 $312,587 $592,824
Source: Fairfax County Department of Systems Management for Human Services, 2007
Note: The single family attached category includes townhouses, duplexes and multiplex units. The multifamily category includes condominium and other units in structures with a common entryway.
Excludes units in rental complexes, units in nonresidential structures, and units in certain ownership statuses such as cooperatives. Market value refers to the estimated value as of January 2007.
Market value for each unit is derived from the 2007 tax assessment and is adjusted to reflect the unit's market value or sales price if the unit sold during the prior year. All dollars are expressed
in thousands of dollars. Countywide totals may vary by table depending on how well the geographic layer aligns with actual county boundaries.
1/ Includes the Town of Herndon and Vienna.
2/ Includes the Town of Clifton.
VIII-6
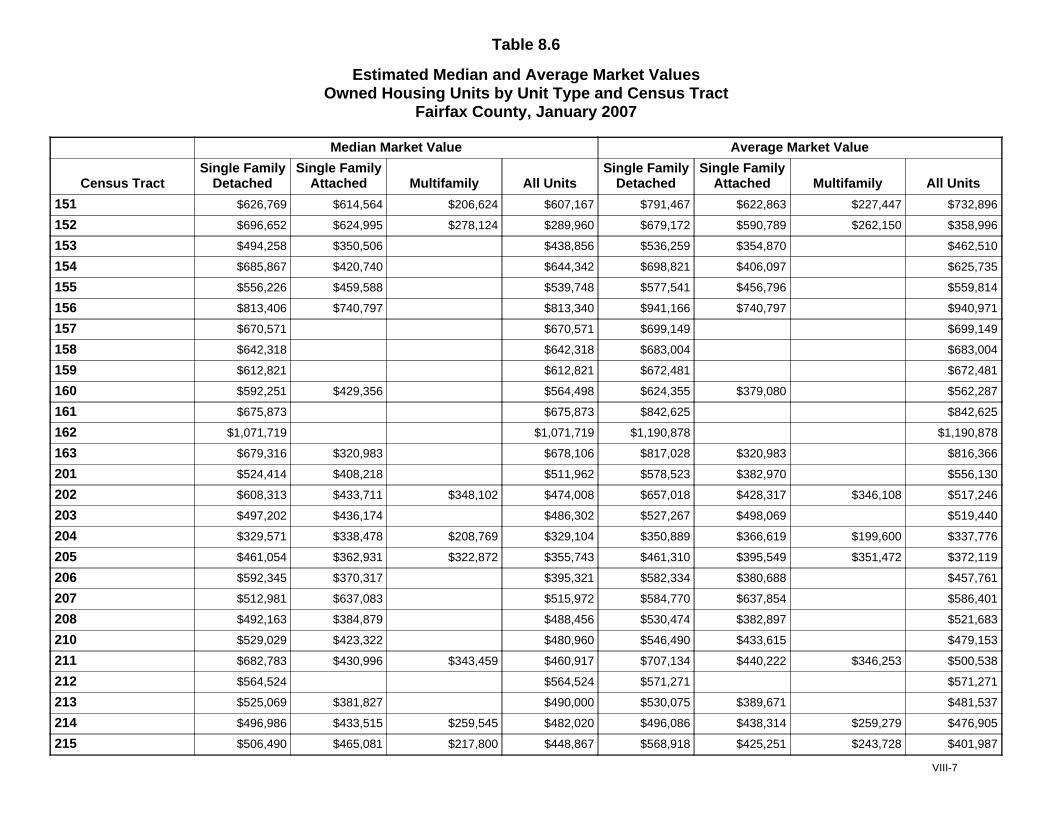
Table 8.6
Estimated Median and Average Market ValuesOwned Housing Units by Unit Type and Census Tract
Fairfax County, January 2007
Median Market Value Average Market Value
Census TractSingle Family
DetachedSingle Family
Attached Multifamily All UnitsSingle Family
DetachedSingle Family
Attached Multifamily All Units
151 $626,769 $614,564 $206,624 $607,167 $791,467 $622,863 $227,447 $732,896
152 $696,652 $624,995 $278,124 $289,960 $679,172 $590,789 $262,150 $358,996
153 $494,258 $350,506 $438,856 $536,259 $354,870 $462,510
154 $685,867 $420,740 $644,342 $698,821 $406,097 $625,735
155 $556,226 $459,588 $539,748 $577,541 $456,796 $559,814
156 $813,406 $740,797 $813,340 $941,166 $740,797 $940,971
157 $670,571 $670,571 $699,149 $699,149
158 $642,318 $642,318 $683,004 $683,004
159 $612,821 $612,821 $672,481 $672,481
160 $592,251 $429,356 $564,498 $624,355 $379,080 $562,287
161 $675,873 $675,873 $842,625 $842,625
162 $1,071,719 $1,071,719 $1,190,878 $1,190,878
163 $679,316 $320,983 $678,106 $817,028 $320,983 $816,366
201 $524,414 $408,218 $511,962 $578,523 $382,970 $556,130
202 $608,313 $433,711 $348,102 $474,008 $657,018 $428,317 $346,108 $517,246
203 $497,202 $436,174 $486,302 $527,267 $498,069 $519,440
204 $329,571 $338,478 $208,769 $329,104 $350,889 $366,619 $199,600 $337,776
205 $461,054 $362,931 $322,872 $355,743 $461,310 $395,549 $351,472 $372,119
206 $592,345 $370,317 $395,321 $582,334 $380,688 $457,761
207 $512,981 $637,083 $515,972 $584,770 $637,854 $586,401
208 $492,163 $384,879 $488,456 $530,474 $382,897 $521,683
210 $529,029 $423,322 $480,960 $546,490 $433,615 $479,153
211 $682,783 $430,996 $343,459 $460,917 $707,134 $440,222 $346,253 $500,538
212 $564,524 $564,524 $571,271 $571,271
213 $525,069 $381,827 $490,000 $530,075 $389,671 $481,537
214 $496,986 $433,515 $259,545 $482,020 $496,086 $438,314 $259,279 $476,905
215 $506,490 $465,081 $217,800 $448,867 $568,918 $425,251 $243,728 $401,987
VIII-7
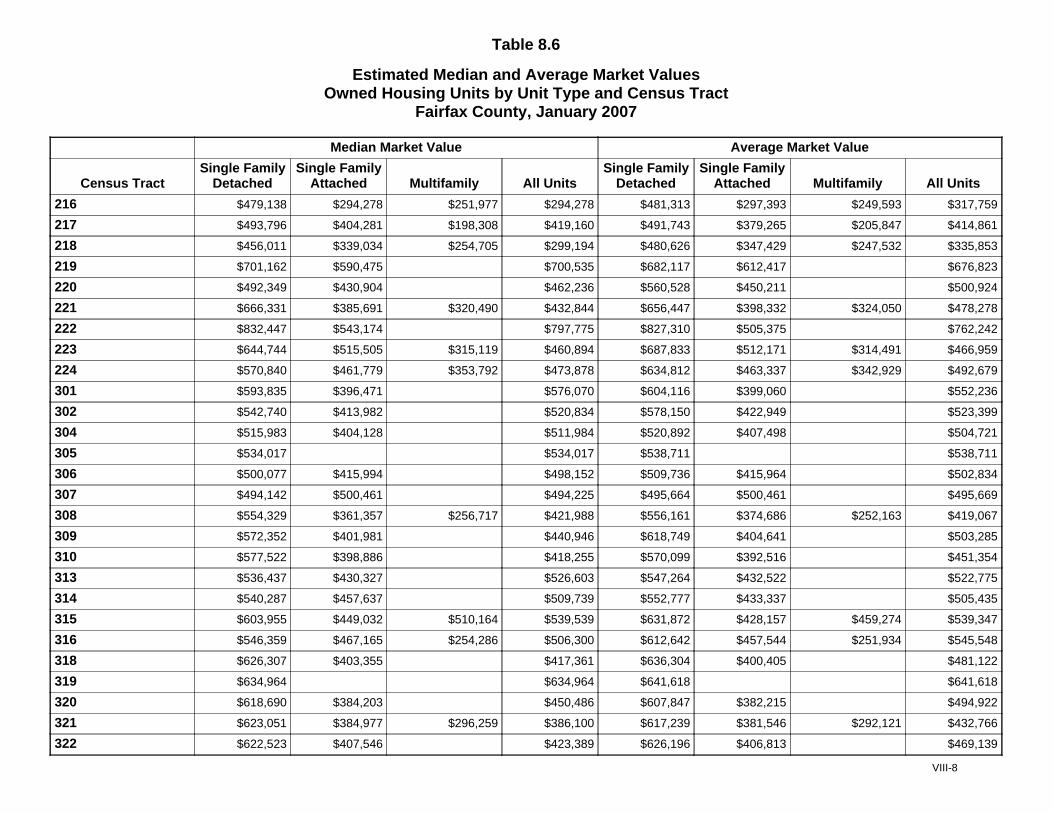
Table 8.6
Estimated Median and Average Market ValuesOwned Housing Units by Unit Type and Census Tract
Fairfax County, January 2007
Median Market Value Average Market Value
Census TractSingle Family
DetachedSingle Family
Attached Multifamily All UnitsSingle Family
DetachedSingle Family
Attached Multifamily All Units
216 $479,138 $294,278 $251,977 $294,278 $481,313 $297,393 $249,593 $317,759
217 $493,796 $404,281 $198,308 $419,160 $491,743 $379,265 $205,847 $414,861
218 $456,011 $339,034 $254,705 $299,194 $480,626 $347,429 $247,532 $335,853
219 $701,162 $590,475 $700,535 $682,117 $612,417 $676,823
220 $492,349 $430,904 $462,236 $560,528 $450,211 $500,924
221 $666,331 $385,691 $320,490 $432,844 $656,447 $398,332 $324,050 $478,278
222 $832,447 $543,174 $797,775 $827,310 $505,375 $762,242
223 $644,744 $515,505 $315,119 $460,894 $687,833 $512,171 $314,491 $466,959
224 $570,840 $461,779 $353,792 $473,878 $634,812 $463,337 $342,929 $492,679
301 $593,835 $396,471 $576,070 $604,116 $399,060 $552,236
302 $542,740 $413,982 $520,834 $578,150 $422,949 $523,399
304 $515,983 $404,128 $511,984 $520,892 $407,498 $504,721
305 $534,017 $534,017 $538,711 $538,711
306 $500,077 $415,994 $498,152 $509,736 $415,964 $502,834
307 $494,142 $500,461 $494,225 $495,664 $500,461 $495,669
308 $554,329 $361,357 $256,717 $421,988 $556,161 $374,686 $252,163 $419,067
309 $572,352 $401,981 $440,946 $618,749 $404,641 $503,285
310 $577,522 $398,886 $418,255 $570,099 $392,516 $451,354
313 $536,437 $430,327 $526,603 $547,264 $432,522 $522,775
314 $540,287 $457,637 $509,739 $552,777 $433,337 $505,435
315 $603,955 $449,032 $510,164 $539,539 $631,872 $428,157 $459,274 $539,347
316 $546,359 $467,165 $254,286 $506,300 $612,642 $457,544 $251,934 $545,548
318 $626,307 $403,355 $417,361 $636,304 $400,405 $481,122
319 $634,964 $634,964 $641,618 $641,618
320 $618,690 $384,203 $450,486 $607,847 $382,215 $494,922
321 $623,051 $384,977 $296,259 $386,100 $617,239 $381,546 $292,121 $432,766
322 $622,523 $407,546 $423,389 $626,196 $406,813 $469,139
VIII-8
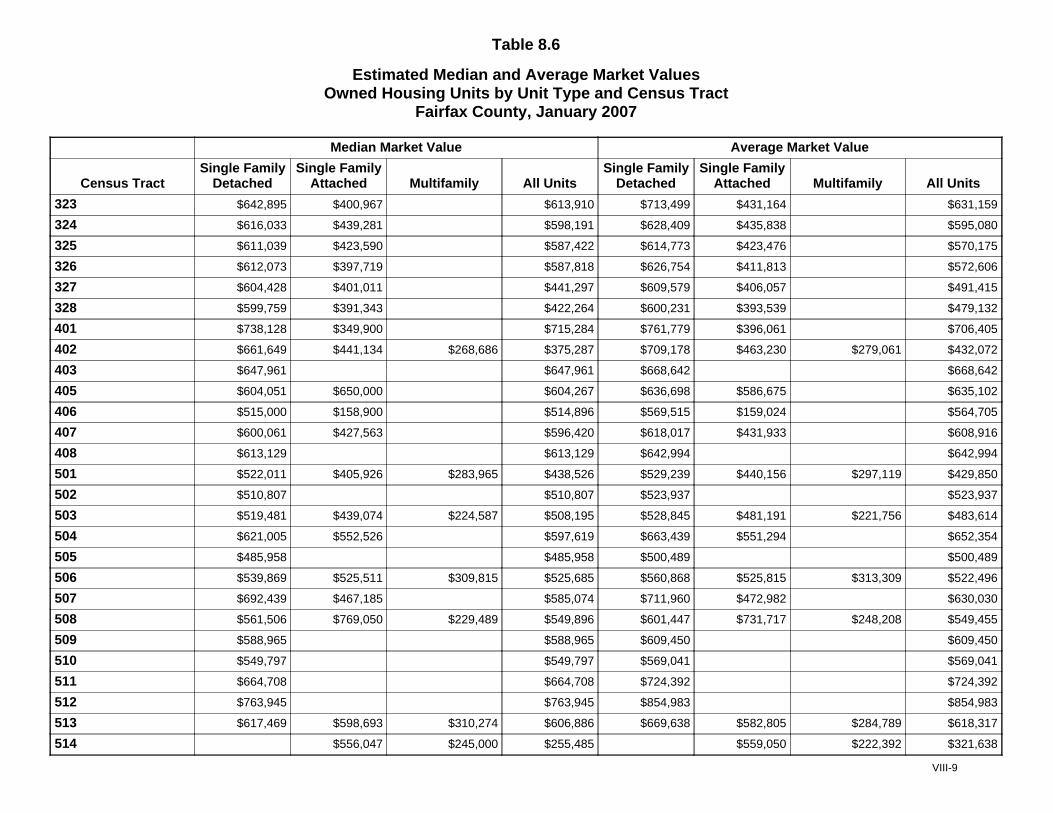
Table 8.6
Estimated Median and Average Market ValuesOwned Housing Units by Unit Type and Census Tract
Fairfax County, January 2007
Median Market Value Average Market Value
Census TractSingle Family
DetachedSingle Family
Attached Multifamily All UnitsSingle Family
DetachedSingle Family
Attached Multifamily All Units
323 $642,895 $400,967 $613,910 $713,499 $431,164 $631,159
324 $616,033 $439,281 $598,191 $628,409 $435,838 $595,080
325 $611,039 $423,590 $587,422 $614,773 $423,476 $570,175
326 $612,073 $397,719 $587,818 $626,754 $411,813 $572,606
327 $604,428 $401,011 $441,297 $609,579 $406,057 $491,415
328 $599,759 $391,343 $422,264 $600,231 $393,539 $479,132
401 $738,128 $349,900 $715,284 $761,779 $396,061 $706,405
402 $661,649 $441,134 $268,686 $375,287 $709,178 $463,230 $279,061 $432,072
403 $647,961 $647,961 $668,642 $668,642
405 $604,051 $650,000 $604,267 $636,698 $586,675 $635,102
406 $515,000 $158,900 $514,896 $569,515 $159,024 $564,705
407 $600,061 $427,563 $596,420 $618,017 $431,933 $608,916
408 $613,129 $613,129 $642,994 $642,994
501 $522,011 $405,926 $283,965 $438,526 $529,239 $440,156 $297,119 $429,850
502 $510,807 $510,807 $523,937 $523,937
503 $519,481 $439,074 $224,587 $508,195 $528,845 $481,191 $221,756 $483,614
504 $621,005 $552,526 $597,619 $663,439 $551,294 $652,354
505 $485,958 $485,958 $500,489 $500,489
506 $539,869 $525,511 $309,815 $525,685 $560,868 $525,815 $313,309 $522,496
507 $692,439 $467,185 $585,074 $711,960 $472,982 $630,030
508 $561,506 $769,050 $229,489 $549,896 $601,447 $731,717 $248,208 $549,455
509 $588,965 $588,965 $609,450 $609,450
510 $549,797 $549,797 $569,041 $569,041
511 $664,708 $664,708 $724,392 $724,392
512 $763,945 $763,945 $854,983 $854,983
513 $617,469 $598,693 $310,274 $606,886 $669,638 $582,805 $284,789 $618,317
514 $556,047 $245,000 $255,485 $559,050 $222,392 $321,638
VIII-9
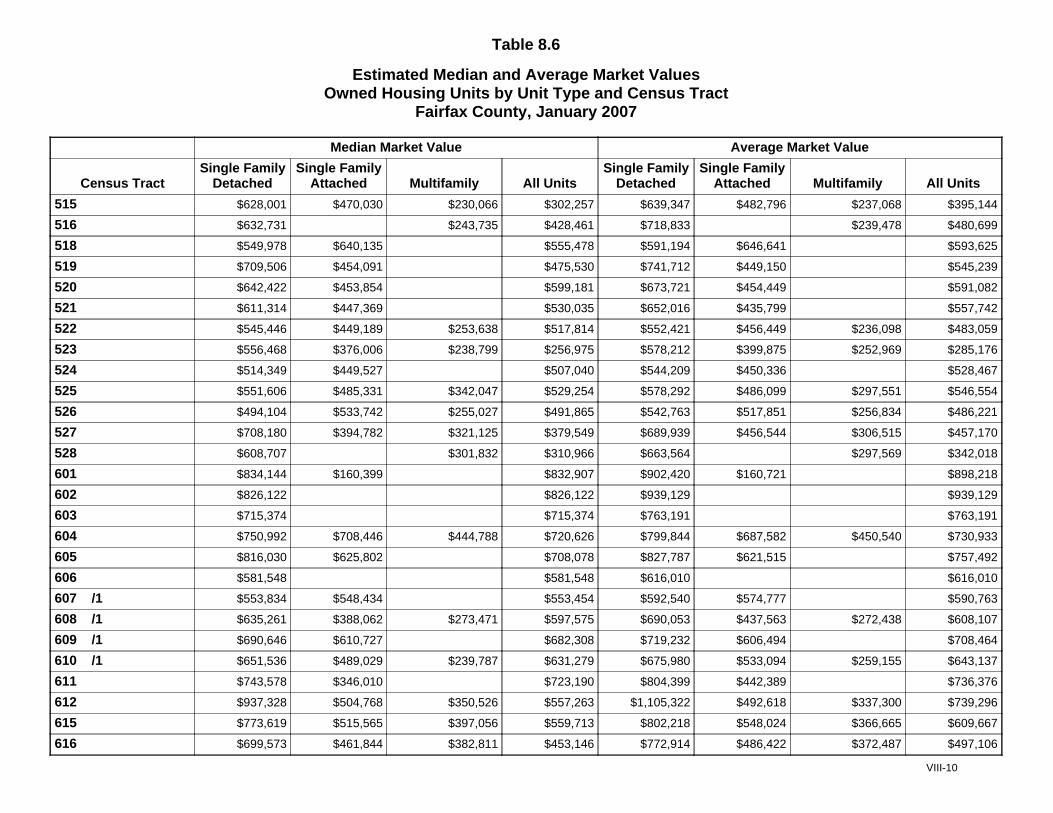
Table 8.6
Estimated Median and Average Market ValuesOwned Housing Units by Unit Type and Census Tract
Fairfax County, January 2007
Median Market Value Average Market Value
Census TractSingle Family
DetachedSingle Family
Attached Multifamily All UnitsSingle Family
DetachedSingle Family
Attached Multifamily All Units
515 $628,001 $470,030 $230,066 $302,257 $639,347 $482,796 $237,068 $395,144
516 $632,731 $243,735 $428,461 $718,833 $239,478 $480,699
518 $549,978 $640,135 $555,478 $591,194 $646,641 $593,625
519 $709,506 $454,091 $475,530 $741,712 $449,150 $545,239
520 $642,422 $453,854 $599,181 $673,721 $454,449 $591,082
521 $611,314 $447,369 $530,035 $652,016 $435,799 $557,742
522 $545,446 $449,189 $253,638 $517,814 $552,421 $456,449 $236,098 $483,059
523 $556,468 $376,006 $238,799 $256,975 $578,212 $399,875 $252,969 $285,176
524 $514,349 $449,527 $507,040 $544,209 $450,336 $528,467
525 $551,606 $485,331 $342,047 $529,254 $578,292 $486,099 $297,551 $546,554
526 $494,104 $533,742 $255,027 $491,865 $542,763 $517,851 $256,834 $486,221
527 $708,180 $394,782 $321,125 $379,549 $689,939 $456,544 $306,515 $457,170
528 $608,707 $301,832 $310,966 $663,564 $297,569 $342,018
601 $834,144 $160,399 $832,907 $902,420 $160,721 $898,218
602 $826,122 $826,122 $939,129 $939,129
603 $715,374 $715,374 $763,191 $763,191
604 $750,992 $708,446 $444,788 $720,626 $799,844 $687,582 $450,540 $730,933
605 $816,030 $625,802 $708,078 $827,787 $621,515 $757,492
606 $581,548 $581,548 $616,010 $616,010
607 /1 $553,834 $548,434 $553,454 $592,540 $574,777 $590,763
608 /1 $635,261 $388,062 $273,471 $597,575 $690,053 $437,563 $272,438 $608,107
609 /1 $690,646 $610,727 $682,308 $719,232 $606,494 $708,464
610 /1 $651,536 $489,029 $239,787 $631,279 $675,980 $533,094 $259,155 $643,137
611 $743,578 $346,010 $723,190 $804,399 $442,389 $736,376
612 $937,328 $504,768 $350,526 $557,263 $1,105,322 $492,618 $337,300 $739,296
615 $773,619 $515,565 $397,056 $559,713 $802,218 $548,024 $366,665 $609,667
616 $699,573 $461,844 $382,811 $453,146 $772,914 $486,422 $372,487 $497,106
VIII-10
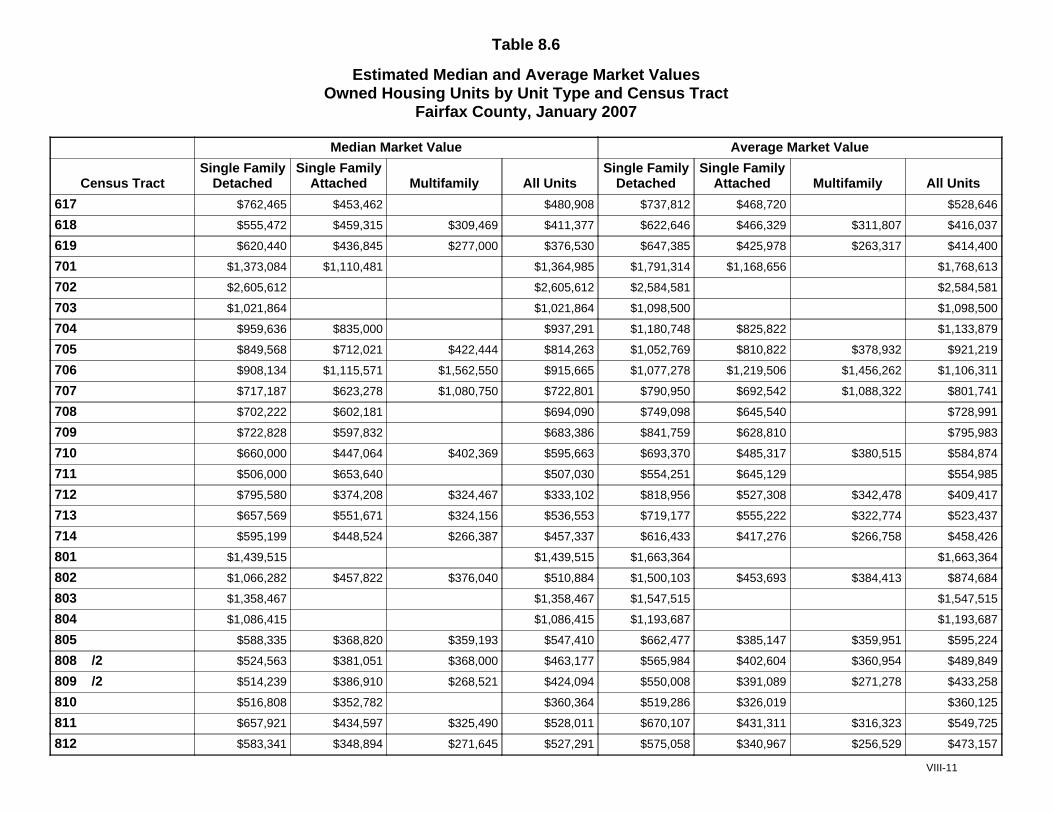
Table 8.6
Estimated Median and Average Market ValuesOwned Housing Units by Unit Type and Census Tract
Fairfax County, January 2007
Median Market Value Average Market Value
Census TractSingle Family
DetachedSingle Family
Attached Multifamily All UnitsSingle Family
DetachedSingle Family
Attached Multifamily All Units
617 $762,465 $453,462 $480,908 $737,812 $468,720 $528,646
618 $555,472 $459,315 $309,469 $411,377 $622,646 $466,329 $311,807 $416,037
619 $620,440 $436,845 $277,000 $376,530 $647,385 $425,978 $263,317 $414,400
701 $1,373,084 $1,110,481 $1,364,985 $1,791,314 $1,168,656 $1,768,613
702 $2,605,612 $2,605,612 $2,584,581 $2,584,581
703 $1,021,864 $1,021,864 $1,098,500 $1,098,500
704 $959,636 $835,000 $937,291 $1,180,748 $825,822 $1,133,879
705 $849,568 $712,021 $422,444 $814,263 $1,052,769 $810,822 $378,932 $921,219
706 $908,134 $1,115,571 $1,562,550 $915,665 $1,077,278 $1,219,506 $1,456,262 $1,106,311
707 $717,187 $623,278 $1,080,750 $722,801 $790,950 $692,542 $1,088,322 $801,741
708 $702,222 $602,181 $694,090 $749,098 $645,540 $728,991
709 $722,828 $597,832 $683,386 $841,759 $628,810 $795,983
710 $660,000 $447,064 $402,369 $595,663 $693,370 $485,317 $380,515 $584,874
711 $506,000 $653,640 $507,030 $554,251 $645,129 $554,985
712 $795,580 $374,208 $324,467 $333,102 $818,956 $527,308 $342,478 $409,417
713 $657,569 $551,671 $324,156 $536,553 $719,177 $555,222 $322,774 $523,437
714 $595,199 $448,524 $266,387 $457,337 $616,433 $417,276 $266,758 $458,426
801 $1,439,515 $1,439,515 $1,663,364 $1,663,364
802 $1,066,282 $457,822 $376,040 $510,884 $1,500,103 $453,693 $384,413 $874,684
803 $1,358,467 $1,358,467 $1,547,515 $1,547,515
804 $1,086,415 $1,086,415 $1,193,687 $1,193,687
805 $588,335 $368,820 $359,193 $547,410 $662,477 $385,147 $359,951 $595,224
808 /2 $524,563 $381,051 $368,000 $463,177 $565,984 $402,604 $360,954 $489,849
809 /2 $514,239 $386,910 $268,521 $424,094 $550,008 $391,089 $271,278 $433,258
810 $516,808 $352,782 $360,364 $519,286 $326,019 $360,125
811 $657,921 $434,597 $325,490 $528,011 $670,107 $431,311 $316,323 $549,725
812 $583,341 $348,894 $271,645 $527,291 $575,058 $340,967 $256,529 $473,157
VIII-11
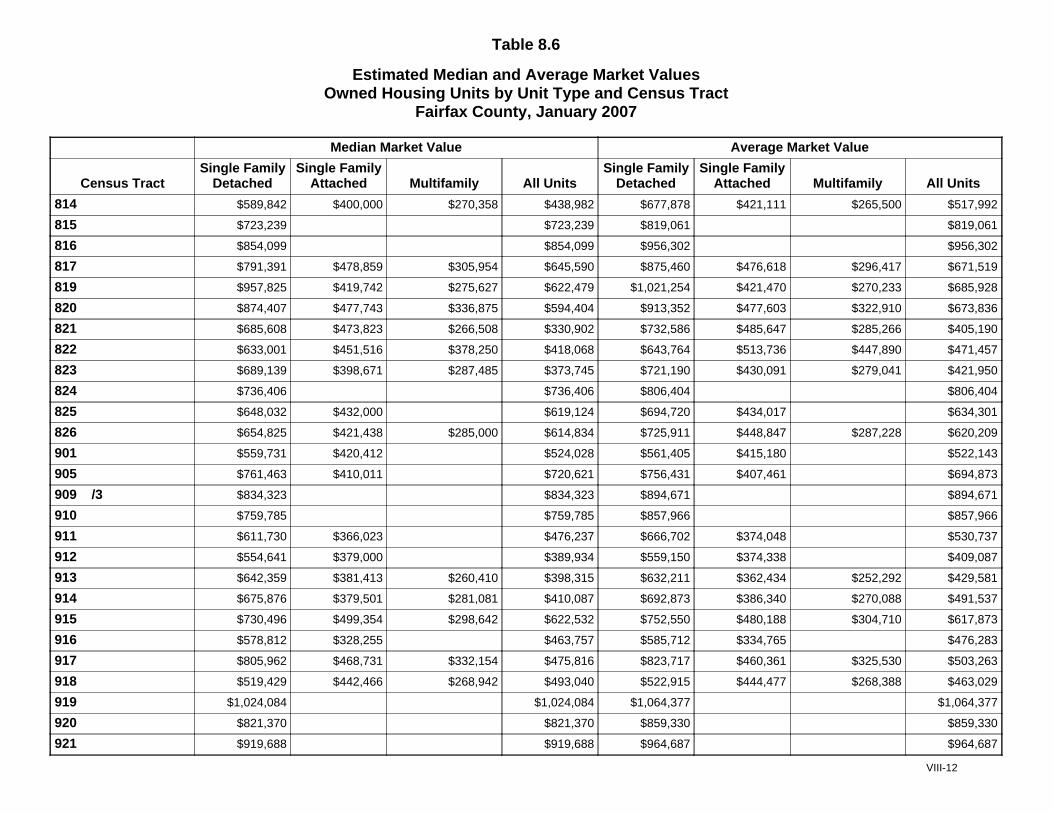
Table 8.6
Estimated Median and Average Market ValuesOwned Housing Units by Unit Type and Census Tract
Fairfax County, January 2007
Median Market Value Average Market Value
Census TractSingle Family
DetachedSingle Family
Attached Multifamily All UnitsSingle Family
DetachedSingle Family
Attached Multifamily All Units
814 $589,842 $400,000 $270,358 $438,982 $677,878 $421,111 $265,500 $517,992
815 $723,239 $723,239 $819,061 $819,061
816 $854,099 $854,099 $956,302 $956,302
817 $791,391 $478,859 $305,954 $645,590 $875,460 $476,618 $296,417 $671,519
819 $957,825 $419,742 $275,627 $622,479 $1,021,254 $421,470 $270,233 $685,928
820 $874,407 $477,743 $336,875 $594,404 $913,352 $477,603 $322,910 $673,836
821 $685,608 $473,823 $266,508 $330,902 $732,586 $485,647 $285,266 $405,190
822 $633,001 $451,516 $378,250 $418,068 $643,764 $513,736 $447,890 $471,457
823 $689,139 $398,671 $287,485 $373,745 $721,190 $430,091 $279,041 $421,950
824 $736,406 $736,406 $806,404 $806,404
825 $648,032 $432,000 $619,124 $694,720 $434,017 $634,301
826 $654,825 $421,438 $285,000 $614,834 $725,911 $448,847 $287,228 $620,209
901 $559,731 $420,412 $524,028 $561,405 $415,180 $522,143
905 $761,463 $410,011 $720,621 $756,431 $407,461 $694,873
909 /3 $834,323 $834,323 $894,671 $894,671
910 $759,785 $759,785 $857,966 $857,966
911 $611,730 $366,023 $476,237 $666,702 $374,048 $530,737
912 $554,641 $379,000 $389,934 $559,150 $374,338 $409,087
913 $642,359 $381,413 $260,410 $398,315 $632,211 $362,434 $252,292 $429,581
914 $675,876 $379,501 $281,081 $410,087 $692,873 $386,340 $270,088 $491,537
915 $730,496 $499,354 $298,642 $622,532 $752,550 $480,188 $304,710 $617,873
916 $578,812 $328,255 $463,757 $585,712 $334,765 $476,283
917 $805,962 $468,731 $332,154 $475,816 $823,717 $460,361 $325,530 $503,263
918 $519,429 $442,466 $268,942 $493,040 $522,915 $444,477 $268,388 $463,029
919 $1,024,084 $1,024,084 $1,064,377 $1,064,377
920 $821,370 $821,370 $859,330 $859,330
921 $919,688 $919,688 $964,687 $964,687
VIII-12
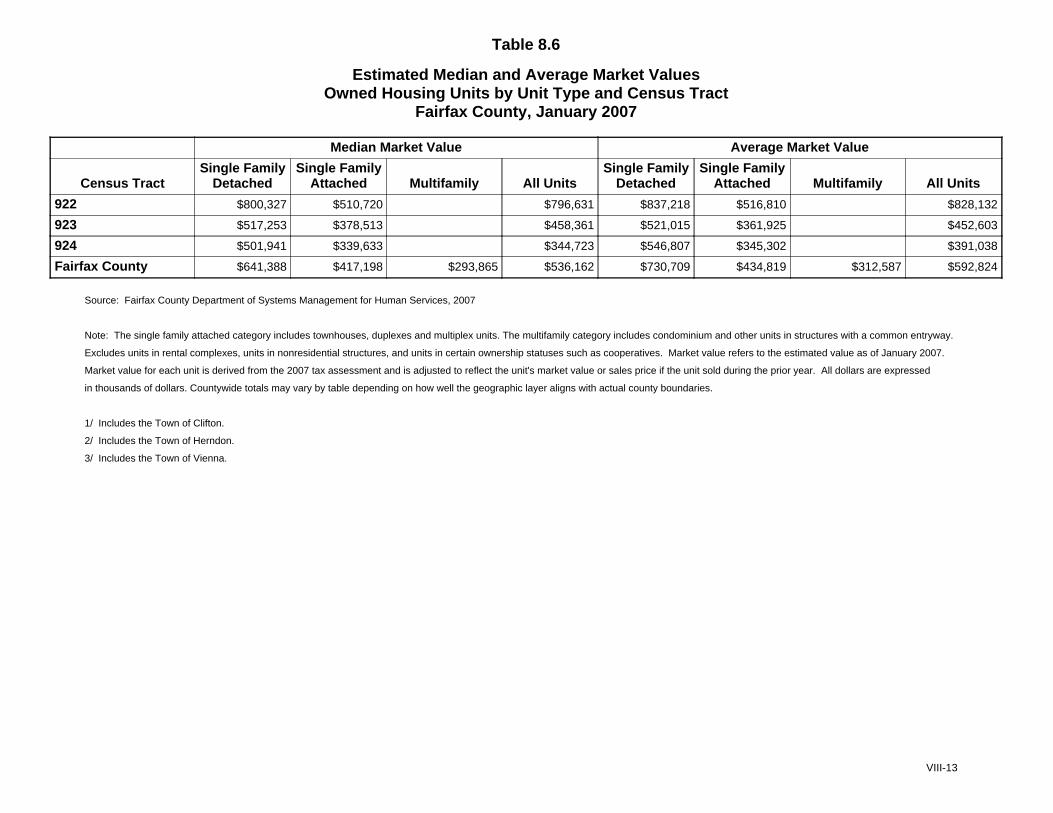
Table 8.6
Estimated Median and Average Market ValuesOwned Housing Units by Unit Type and Census Tract
Fairfax County, January 2007
Median Market Value Average Market Value
Census TractSingle Family
DetachedSingle Family
Attached Multifamily All UnitsSingle Family
DetachedSingle Family
Attached Multifamily All Units
922 $800,327 $510,720 $796,631 $837,218 $516,810 $828,132
923 $517,253 $378,513 $458,361 $521,015 $361,925 $452,603
924 $501,941 $339,633 $344,723 $546,807 $345,302 $391,038
Fairfax County $641,388 $417,198 $293,865 $536,162 $730,709 $434,819 $312,587 $592,824
Source: Fairfax County Department of Systems Management for Human Services, 2007
Note: The single family attached category includes townhouses, duplexes and multiplex units. The multifamily category includes condominium and other units in structures with a common entryway.
Excludes units in rental complexes, units in nonresidential structures, and units in certain ownership statuses such as cooperatives. Market value refers to the estimated value as of January 2007.
Market value for each unit is derived from the 2007 tax assessment and is adjusted to reflect the unit's market value or sales price if the unit sold during the prior year. All dollars are expressed
in thousands of dollars. Countywide totals may vary by table depending on how well the geographic layer aligns with actual county boundaries.
1/ Includes the Town of Clifton.
2/ Includes the Town of Herndon.
3/ Includes the Town of Vienna.
VIII-13
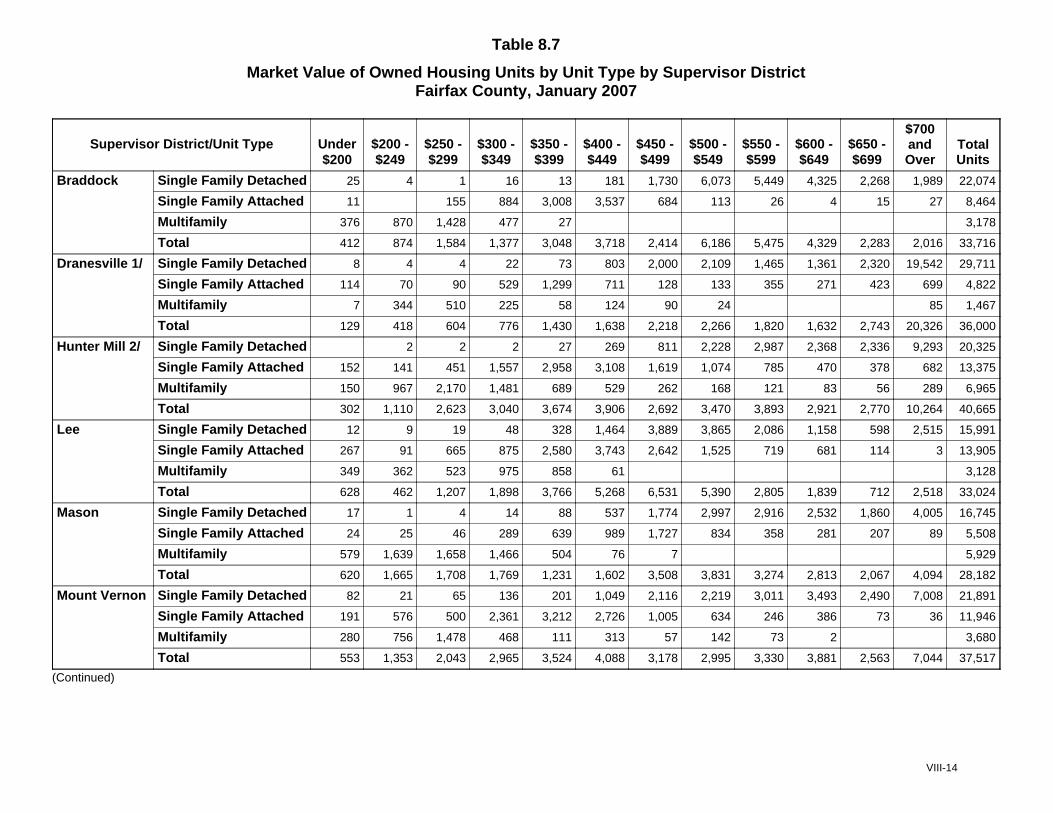
Table 8.7
Market Value of Owned Housing Units by Unit Type by Supervisor DistrictFairfax County, January 2007
Supervisor District/Unit Type Under$200
$200 -$249
$250 -$299
$300 -$349
$350 -$399
$400 -$449
$450 -$499
$500 -$549
$550 -$599
$600 -$649
$650 -$699
$700andOver
TotalUnits
Braddock Single Family Detached 25 4 1 16 13 181 1,730 6,073 5,449 4,325 2,268 1,989 22,074
Single Family Attached 11 155 884 3,008 3,537 684 113 26 4 15 27 8,464
Multifamily 376 870 1,428 477 27 3,178
Total 412 874 1,584 1,377 3,048 3,718 2,414 6,186 5,475 4,329 2,283 2,016 33,716
Dranesville 1/ Single Family Detached 8 4 4 22 73 803 2,000 2,109 1,465 1,361 2,320 19,542 29,711
Single Family Attached 114 70 90 529 1,299 711 128 133 355 271 423 699 4,822
Multifamily 7 344 510 225 58 124 90 24 85 1,467
Total 129 418 604 776 1,430 1,638 2,218 2,266 1,820 1,632 2,743 20,326 36,000
Hunter Mill 2/ Single Family Detached 2 2 2 27 269 811 2,228 2,987 2,368 2,336 9,293 20,325
Single Family Attached 152 141 451 1,557 2,958 3,108 1,619 1,074 785 470 378 682 13,375
Multifamily 150 967 2,170 1,481 689 529 262 168 121 83 56 289 6,965
Total 302 1,110 2,623 3,040 3,674 3,906 2,692 3,470 3,893 2,921 2,770 10,264 40,665
Lee Single Family Detached 12 9 19 48 328 1,464 3,889 3,865 2,086 1,158 598 2,515 15,991
Single Family Attached 267 91 665 875 2,580 3,743 2,642 1,525 719 681 114 3 13,905
Multifamily 349 362 523 975 858 61 3,128
Total 628 462 1,207 1,898 3,766 5,268 6,531 5,390 2,805 1,839 712 2,518 33,024
Mason Single Family Detached 17 1 4 14 88 537 1,774 2,997 2,916 2,532 1,860 4,005 16,745
Single Family Attached 24 25 46 289 639 989 1,727 834 358 281 207 89 5,508
Multifamily 579 1,639 1,658 1,466 504 76 7 5,929
Total 620 1,665 1,708 1,769 1,231 1,602 3,508 3,831 3,274 2,813 2,067 4,094 28,182
Mount Vernon Single Family Detached 82 21 65 136 201 1,049 2,116 2,219 3,011 3,493 2,490 7,008 21,891
Single Family Attached 191 576 500 2,361 3,212 2,726 1,005 634 246 386 73 36 11,946
Multifamily 280 756 1,478 468 111 313 57 142 73 2 3,680
Total 553 1,353 2,043 2,965 3,524 4,088 3,178 2,995 3,330 3,881 2,563 7,044 37,517
(Continued)
VIII-14
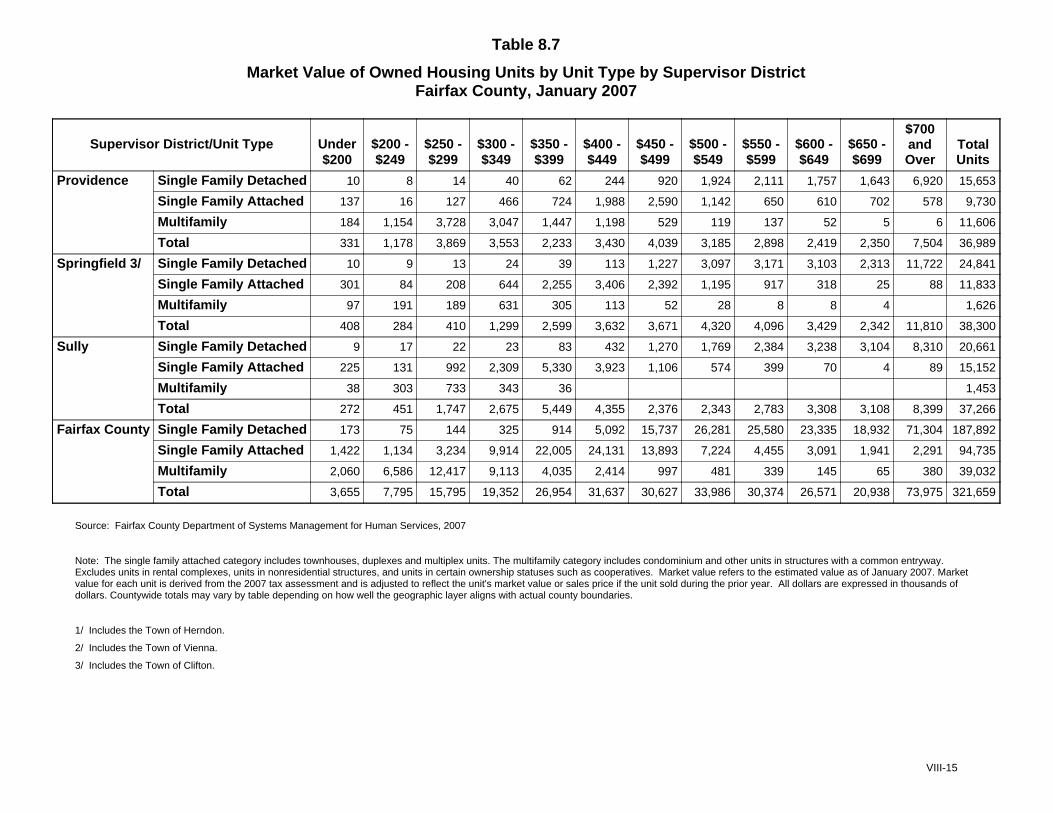
Table 8.7
Market Value of Owned Housing Units by Unit Type by Supervisor DistrictFairfax County, January 2007
Supervisor District/Unit Type Under$200
$200 -$249
$250 -$299
$300 -$349
$350 -$399
$400 -$449
$450 -$499
$500 -$549
$550 -$599
$600 -$649
$650 -$699
$700andOver
TotalUnits
Providence Single Family Detached 10 8 14 40 62 244 920 1,924 2,111 1,757 1,643 6,920 15,653
Single Family Attached 137 16 127 466 724 1,988 2,590 1,142 650 610 702 578 9,730
Multifamily 184 1,154 3,728 3,047 1,447 1,198 529 119 137 52 5 6 11,606
Total 331 1,178 3,869 3,553 2,233 3,430 4,039 3,185 2,898 2,419 2,350 7,504 36,989
Springfield 3/ Single Family Detached 10 9 13 24 39 113 1,227 3,097 3,171 3,103 2,313 11,722 24,841
Single Family Attached 301 84 208 644 2,255 3,406 2,392 1,195 917 318 25 88 11,833
Multifamily 97 191 189 631 305 113 52 28 8 8 4 1,626
Total 408 284 410 1,299 2,599 3,632 3,671 4,320 4,096 3,429 2,342 11,810 38,300
Sully Single Family Detached 9 17 22 23 83 432 1,270 1,769 2,384 3,238 3,104 8,310 20,661
Single Family Attached 225 131 992 2,309 5,330 3,923 1,106 574 399 70 4 89 15,152
Multifamily 38 303 733 343 36 1,453
Total 272 451 1,747 2,675 5,449 4,355 2,376 2,343 2,783 3,308 3,108 8,399 37,266
Fairfax County Single Family Detached 173 75 144 325 914 5,092 15,737 26,281 25,580 23,335 18,932 71,304 187,892
Single Family Attached 1,422 1,134 3,234 9,914 22,005 24,131 13,893 7,224 4,455 3,091 1,941 2,291 94,735
Multifamily 2,060 6,586 12,417 9,113 4,035 2,414 997 481 339 145 65 380 39,032
Total 3,655 7,795 15,795 19,352 26,954 31,637 30,627 33,986 30,374 26,571 20,938 73,975 321,659
Source: Fairfax County Department of Systems Management for Human Services, 2007
Note: The single family attached category includes townhouses, duplexes and multiplex units. The multifamily category includes condominium and other units in structures with a common entryway.Excludes units in rental complexes, units in nonresidential structures, and units in certain ownership statuses such as cooperatives. Market value refers to the estimated value as of January 2007. Marketvalue for each unit is derived from the 2007 tax assessment and is adjusted to reflect the unit's market value or sales price if the unit sold during the prior year. All dollars are expressed in thousands ofdollars. Countywide totals may vary by table depending on how well the geographic layer aligns with actual county boundaries.
1/ Includes the Town of Herndon.
2/ Includes the Town of Vienna.
3/ Includes the Town of Clifton.
VIII-15
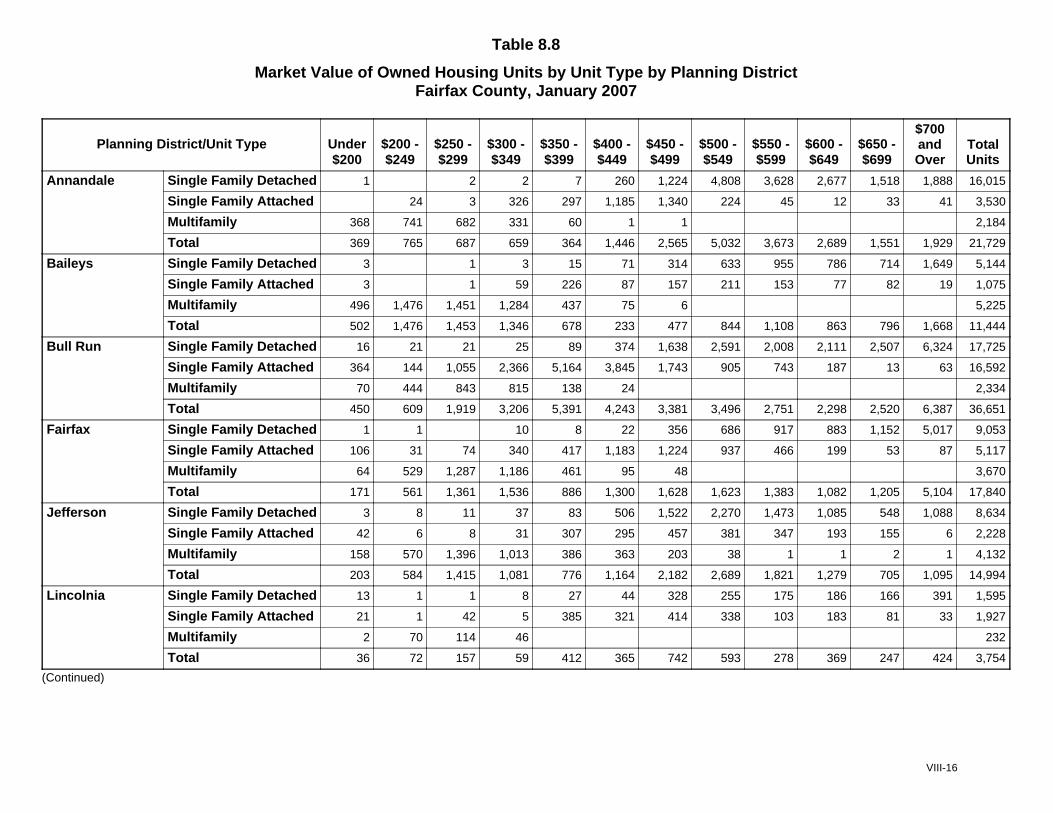
Table 8.8
Market Value of Owned Housing Units by Unit Type by Planning DistrictFairfax County, January 2007
Planning District/Unit Type Under$200
$200 -$249
$250 -$299
$300 -$349
$350 -$399
$400 -$449
$450 -$499
$500 -$549
$550 -$599
$600 -$649
$650 -$699
$700andOver
TotalUnits
Annandale Single Family Detached 1 2 2 7 260 1,224 4,808 3,628 2,677 1,518 1,888 16,015
Single Family Attached 24 3 326 297 1,185 1,340 224 45 12 33 41 3,530
Multifamily 368 741 682 331 60 1 1 2,184
Total 369 765 687 659 364 1,446 2,565 5,032 3,673 2,689 1,551 1,929 21,729
Baileys Single Family Detached 3 1 3 15 71 314 633 955 786 714 1,649 5,144
Single Family Attached 3 1 59 226 87 157 211 153 77 82 19 1,075
Multifamily 496 1,476 1,451 1,284 437 75 6 5,225
Total 502 1,476 1,453 1,346 678 233 477 844 1,108 863 796 1,668 11,444
Bull Run Single Family Detached 16 21 21 25 89 374 1,638 2,591 2,008 2,111 2,507 6,324 17,725
Single Family Attached 364 144 1,055 2,366 5,164 3,845 1,743 905 743 187 13 63 16,592
Multifamily 70 444 843 815 138 24 2,334
Total 450 609 1,919 3,206 5,391 4,243 3,381 3,496 2,751 2,298 2,520 6,387 36,651
Fairfax Single Family Detached 1 1 10 8 22 356 686 917 883 1,152 5,017 9,053
Single Family Attached 106 31 74 340 417 1,183 1,224 937 466 199 53 87 5,117
Multifamily 64 529 1,287 1,186 461 95 48 3,670
Total 171 561 1,361 1,536 886 1,300 1,628 1,623 1,383 1,082 1,205 5,104 17,840
Jefferson Single Family Detached 3 8 11 37 83 506 1,522 2,270 1,473 1,085 548 1,088 8,634
Single Family Attached 42 6 8 31 307 295 457 381 347 193 155 6 2,228
Multifamily 158 570 1,396 1,013 386 363 203 38 1 1 2 1 4,132
Total 203 584 1,415 1,081 776 1,164 2,182 2,689 1,821 1,279 705 1,095 14,994
Lincolnia Single Family Detached 13 1 1 8 27 44 328 255 175 186 166 391 1,595
Single Family Attached 21 1 42 5 385 321 414 338 103 183 81 33 1,927
Multifamily 2 70 114 46 232
Total 36 72 157 59 412 365 742 593 278 369 247 424 3,754
(Continued)
VIII-16
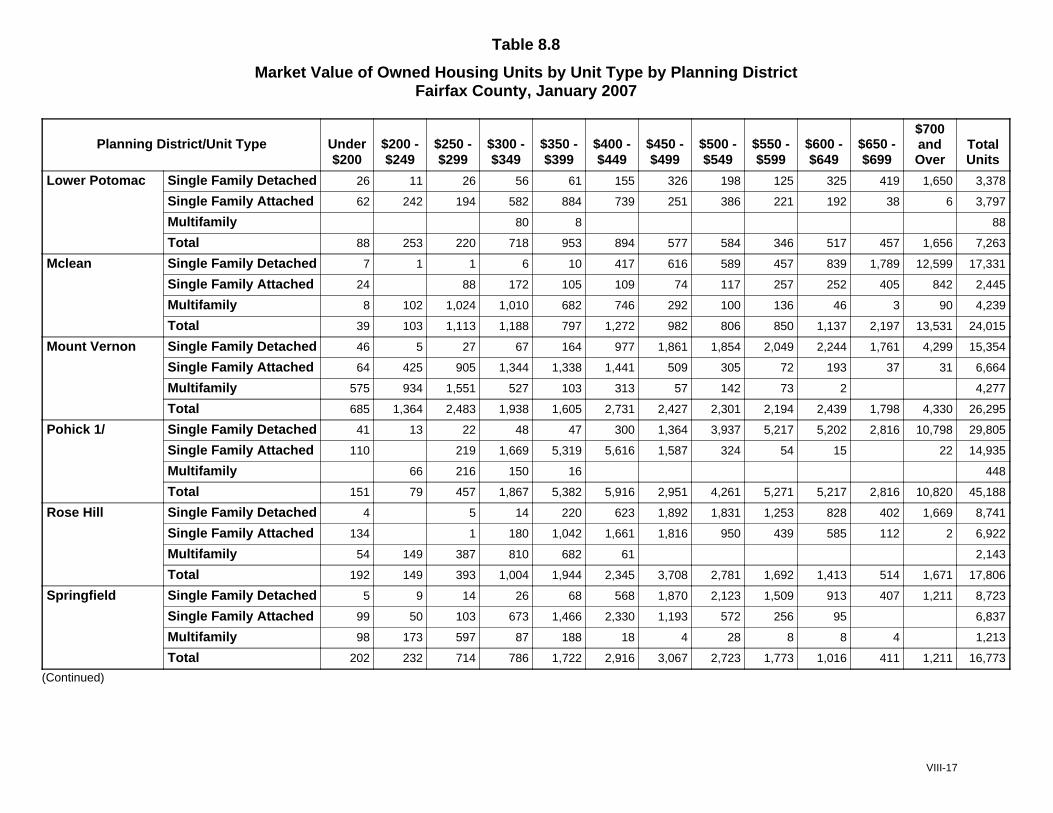
Table 8.8
Market Value of Owned Housing Units by Unit Type by Planning DistrictFairfax County, January 2007
Planning District/Unit Type Under$200
$200 -$249
$250 -$299
$300 -$349
$350 -$399
$400 -$449
$450 -$499
$500 -$549
$550 -$599
$600 -$649
$650 -$699
$700andOver
TotalUnits
Lower Potomac Single Family Detached 26 11 26 56 61 155 326 198 125 325 419 1,650 3,378
Single Family Attached 62 242 194 582 884 739 251 386 221 192 38 6 3,797
Multifamily 80 8 88
Total 88 253 220 718 953 894 577 584 346 517 457 1,656 7,263
Mclean Single Family Detached 7 1 1 6 10 417 616 589 457 839 1,789 12,599 17,331
Single Family Attached 24 88 172 105 109 74 117 257 252 405 842 2,445
Multifamily 8 102 1,024 1,010 682 746 292 100 136 46 3 90 4,239
Total 39 103 1,113 1,188 797 1,272 982 806 850 1,137 2,197 13,531 24,015
Mount Vernon Single Family Detached 46 5 27 67 164 977 1,861 1,854 2,049 2,244 1,761 4,299 15,354
Single Family Attached 64 425 905 1,344 1,338 1,441 509 305 72 193 37 31 6,664
Multifamily 575 934 1,551 527 103 313 57 142 73 2 4,277
Total 685 1,364 2,483 1,938 1,605 2,731 2,427 2,301 2,194 2,439 1,798 4,330 26,295
Pohick 1/ Single Family Detached 41 13 22 48 47 300 1,364 3,937 5,217 5,202 2,816 10,798 29,805
Single Family Attached 110 219 1,669 5,319 5,616 1,587 324 54 15 22 14,935
Multifamily 66 216 150 16 448
Total 151 79 457 1,867 5,382 5,916 2,951 4,261 5,271 5,217 2,816 10,820 45,188
Rose Hill Single Family Detached 4 5 14 220 623 1,892 1,831 1,253 828 402 1,669 8,741
Single Family Attached 134 1 180 1,042 1,661 1,816 950 439 585 112 2 6,922
Multifamily 54 149 387 810 682 61 2,143
Total 192 149 393 1,004 1,944 2,345 3,708 2,781 1,692 1,413 514 1,671 17,806
Springfield Single Family Detached 5 9 14 26 68 568 1,870 2,123 1,509 913 407 1,211 8,723
Single Family Attached 99 50 103 673 1,466 2,330 1,193 572 256 95 6,837
Multifamily 98 173 597 87 188 18 4 28 8 8 4 1,213
Total 202 232 714 786 1,722 2,916 3,067 2,723 1,773 1,016 411 1,211 16,773
(Continued)
VIII-17
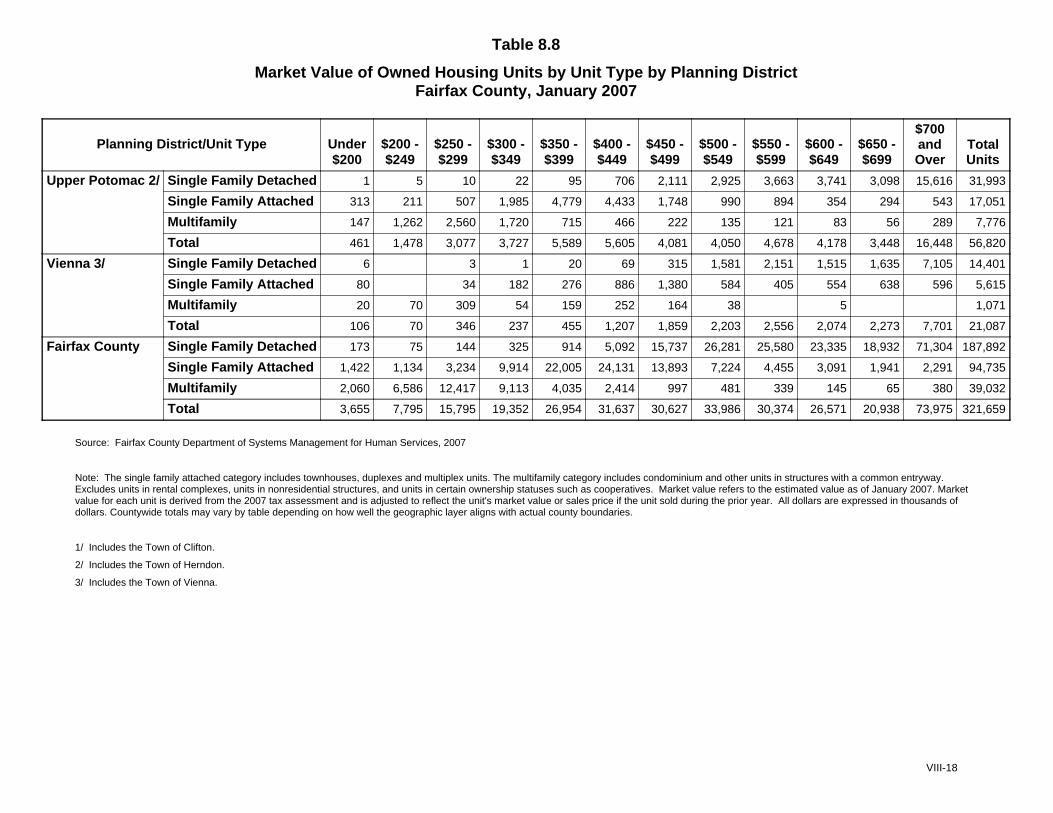
Table 8.8
Market Value of Owned Housing Units by Unit Type by Planning DistrictFairfax County, January 2007
Planning District/Unit Type Under$200
$200 -$249
$250 -$299
$300 -$349
$350 -$399
$400 -$449
$450 -$499
$500 -$549
$550 -$599
$600 -$649
$650 -$699
$700andOver
TotalUnits
Upper Potomac 2/ Single Family Detached 1 5 10 22 95 706 2,111 2,925 3,663 3,741 3,098 15,616 31,993
Single Family Attached 313 211 507 1,985 4,779 4,433 1,748 990 894 354 294 543 17,051
Multifamily 147 1,262 2,560 1,720 715 466 222 135 121 83 56 289 7,776
Total 461 1,478 3,077 3,727 5,589 5,605 4,081 4,050 4,678 4,178 3,448 16,448 56,820
Vienna 3/ Single Family Detached 6 3 1 20 69 315 1,581 2,151 1,515 1,635 7,105 14,401
Single Family Attached 80 34 182 276 886 1,380 584 405 554 638 596 5,615
Multifamily 20 70 309 54 159 252 164 38 5 1,071
Total 106 70 346 237 455 1,207 1,859 2,203 2,556 2,074 2,273 7,701 21,087
Fairfax County Single Family Detached 173 75 144 325 914 5,092 15,737 26,281 25,580 23,335 18,932 71,304 187,892
Single Family Attached 1,422 1,134 3,234 9,914 22,005 24,131 13,893 7,224 4,455 3,091 1,941 2,291 94,735
Multifamily 2,060 6,586 12,417 9,113 4,035 2,414 997 481 339 145 65 380 39,032
Total 3,655 7,795 15,795 19,352 26,954 31,637 30,627 33,986 30,374 26,571 20,938 73,975 321,659
Source: Fairfax County Department of Systems Management for Human Services, 2007
Note: The single family attached category includes townhouses, duplexes and multiplex units. The multifamily category includes condominium and other units in structures with a common entryway.Excludes units in rental complexes, units in nonresidential structures, and units in certain ownership statuses such as cooperatives. Market value refers to the estimated value as of January 2007. Marketvalue for each unit is derived from the 2007 tax assessment and is adjusted to reflect the unit's market value or sales price if the unit sold during the prior year. All dollars are expressed in thousands ofdollars. Countywide totals may vary by table depending on how well the geographic layer aligns with actual county boundaries.
1/ Includes the Town of Clifton.
2/ Includes the Town of Herndon.
3/ Includes the Town of Vienna.
VIII-18
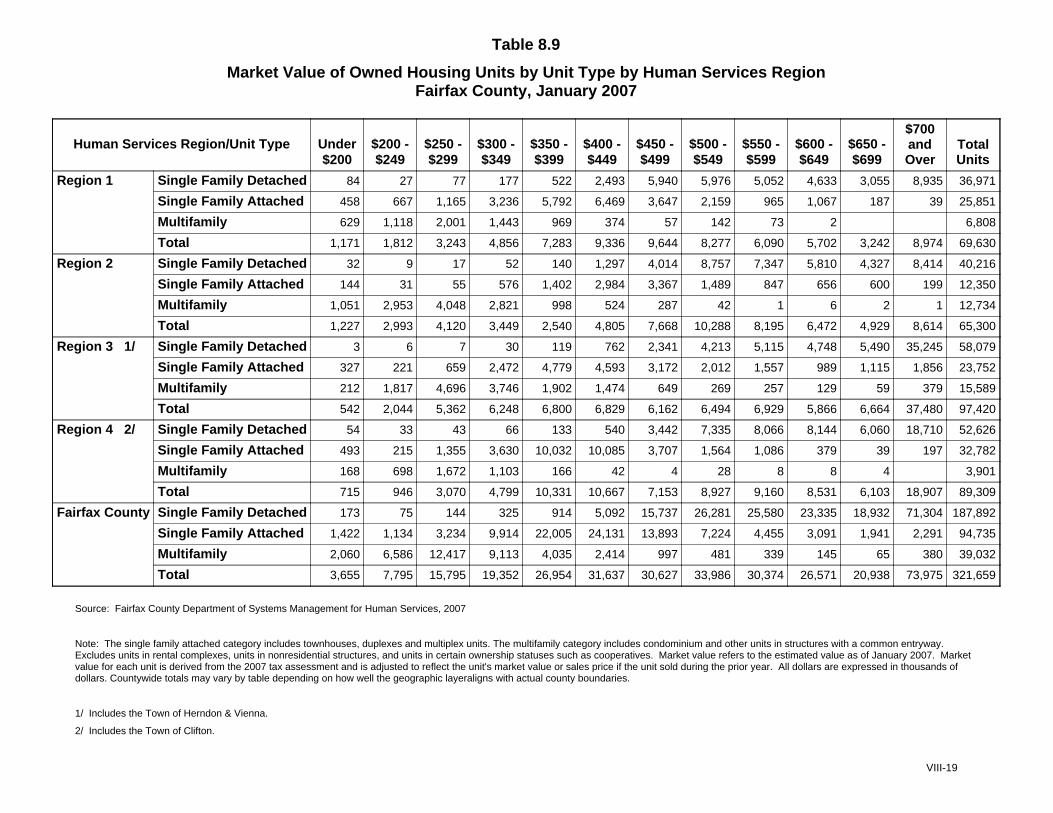
Table 8.9
Market Value of Owned Housing Units by Unit Type by Human Services RegionFairfax County, January 2007
Human Services Region/Unit Type Under$200
$200 -$249
$250 -$299
$300 -$349
$350 -$399
$400 -$449
$450 -$499
$500 -$549
$550 -$599
$600 -$649
$650 -$699
$700andOver
TotalUnits
Region 1 Single Family Detached 84 27 77 177 522 2,493 5,940 5,976 5,052 4,633 3,055 8,935 36,971
Single Family Attached 458 667 1,165 3,236 5,792 6,469 3,647 2,159 965 1,067 187 39 25,851
Multifamily 629 1,118 2,001 1,443 969 374 57 142 73 2 6,808
Total 1,171 1,812 3,243 4,856 7,283 9,336 9,644 8,277 6,090 5,702 3,242 8,974 69,630
Region 2 Single Family Detached 32 9 17 52 140 1,297 4,014 8,757 7,347 5,810 4,327 8,414 40,216
Single Family Attached 144 31 55 576 1,402 2,984 3,367 1,489 847 656 600 199 12,350
Multifamily 1,051 2,953 4,048 2,821 998 524 287 42 1 6 2 1 12,734
Total 1,227 2,993 4,120 3,449 2,540 4,805 7,668 10,288 8,195 6,472 4,929 8,614 65,300
Region 3 1/ Single Family Detached 3 6 7 30 119 762 2,341 4,213 5,115 4,748 5,490 35,245 58,079
Single Family Attached 327 221 659 2,472 4,779 4,593 3,172 2,012 1,557 989 1,115 1,856 23,752
Multifamily 212 1,817 4,696 3,746 1,902 1,474 649 269 257 129 59 379 15,589
Total 542 2,044 5,362 6,248 6,800 6,829 6,162 6,494 6,929 5,866 6,664 37,480 97,420
Region 4 2/ Single Family Detached 54 33 43 66 133 540 3,442 7,335 8,066 8,144 6,060 18,710 52,626
Single Family Attached 493 215 1,355 3,630 10,032 10,085 3,707 1,564 1,086 379 39 197 32,782
Multifamily 168 698 1,672 1,103 166 42 4 28 8 8 4 3,901
Total 715 946 3,070 4,799 10,331 10,667 7,153 8,927 9,160 8,531 6,103 18,907 89,309
Fairfax County Single Family Detached 173 75 144 325 914 5,092 15,737 26,281 25,580 23,335 18,932 71,304 187,892
Single Family Attached 1,422 1,134 3,234 9,914 22,005 24,131 13,893 7,224 4,455 3,091 1,941 2,291 94,735
Multifamily 2,060 6,586 12,417 9,113 4,035 2,414 997 481 339 145 65 380 39,032
Total 3,655 7,795 15,795 19,352 26,954 31,637 30,627 33,986 30,374 26,571 20,938 73,975 321,659
Source: Fairfax County Department of Systems Management for Human Services, 2007
Note: The single family attached category includes townhouses, duplexes and multiplex units. The multifamily category includes condominium and other units in structures with a common entryway.Excludes units in rental complexes, units in nonresidential structures, and units in certain ownership statuses such as cooperatives. Market value refers to the estimated value as of January 2007. Marketvalue for each unit is derived from the 2007 tax assessment and is adjusted to reflect the unit's market value or sales price if the unit sold during the prior year. All dollars are expressed in thousands ofdollars. Countywide totals may vary by table depending on how well the geographic layeraligns with actual county boundaries.
1/ Includes the Town of Herndon & Vienna.
2/ Includes the Town of Clifton.
VIII-19

RESIDENTIAL DEVELOPMENT ACTIVITY The residential development process encompasses the entire land development process, from the rezoning of land, through the site plan and subdivision phases, the issuance of building permits, and the construction and completion of housing units. The development process reflects active residential projects occurring in Fairfax County at one specific point in time (January 1 of the current report year) and does not reflect cumulative activity occurring throughout the preceding year. Further, specific units are counted only within the stage of the development process in which they occur on January 1 of the current report year. Stages in the development process include the following: 1) The number of residential units under construction. 2) The number of units for which building permits were
issued but not started.
3) Approved development plans. 4) Development plans submitted. 5) Approved rezoning requests (identified as “Rezoning
Granted” in the tables). Residential units counted in this stage typically are shown on development plans proffered with approved rezoning requests.
6) Rezoning requests submitted (identified as “Rezoning Pending”).
The number of units in the development process are categorized by housing unit type. The categories include single-family detached units, single-family attached units (townhouses, duplexes, and multiplexes), and multifamily units (condominium and rental units, which may be garden, medium-rise, or high-rise structure types).
IX-1
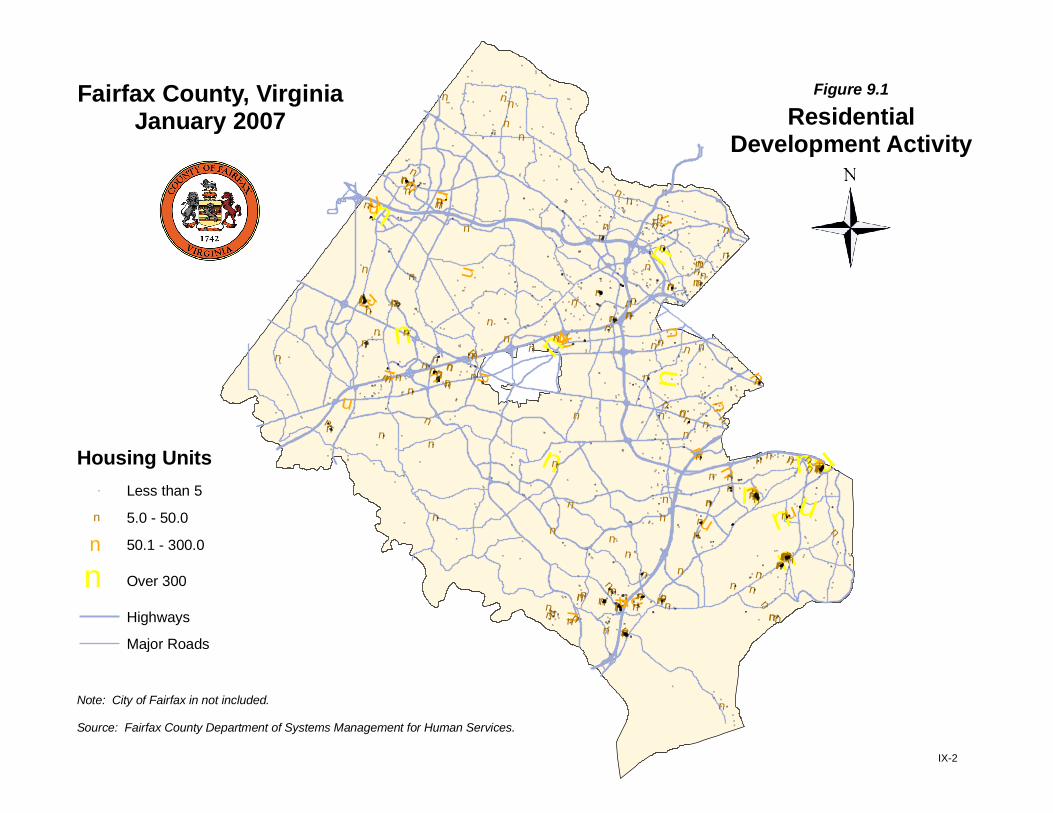
n
nn
n
n
nnn n
nn
n
n
n
nn
n
n
n
n
n
n
n
nn
nn
n
n
n nn
n
n
n
n n
n n
n
n
n
n
n
n
nn
n
n
n
n
n
n
n
n
nn
n
n
n
n
nn
n
n
n
n
n
n
nn
n
n
n
n
n
n
n
n
n
n
n
n
n
n
n
n
n
n
n
n
n
n
n
n
n
n
n
nn
n
nn
n
n
n
n
n
nn
n
n
n
n
nn
n
n
n
n
n
n
n
n
nn
nn
n
n
n
n
n
n
n
nn
n
n
n
n
n
n
n
n
n
nnnnn
n
n
n
n
n
n
nn
n
n
n
n
n
n
n
n
n
n
n
n
nn
n
n
n
nn
n
n
n
n
nn
n
n
n
n
n
nn
n
n
n
nn
n
nn
n
n
n
n
n n
n
n
n
n
n
n
n n
n
n
nn
n
n
nn
nn
n
n
n
n
n
n
n
n
n
nn n
n
nn
n n
n
nn
n
n
n
n
n
n
n
n
n
n
n
n
n
n
n
n
n
n
n
n
n
n
n
nn
n
n
n
n
n
n
nnn
n
nn
n
n
n
n
n
n
n
n
n
n
n
n
n
n
n
n
n
n
n
n
n
n
n
n
n
n
n
n
n
n
nn
nn
n
n
nn
n
n
n
n
n
n
n
n
n
n
n
n
n
n
n
n
n
n
n
n
n
n
n
n
n
n
n
n
n
n
n
n
n
n
n
n
n
n
n
n
n
n
n
n
n
n
n
n
n
n
n
n
n
n
n
n
n
n
n
n
n
n
n
n
n
n
n
n
n
n
n
n
n
n
n
n
n
n
n
n
n
n
n
n
n
n
n
n
n
n
n
n
n
n
n
n
n
nn
n
n
n
n
n
n
n
n
n
n
n
n
n
n
n
n
n
n
n
n
n
n
nnnn
nn
nn
n
n
nnnn
n
n
n
nn
n
n
n
n
n
n
n
n
n
n
n
n
n
n
n
n
n
n
n
n
n
n
n
n
n
nn
n
n
nn
n
n
n
n
n
n
n
n
n
n
n
n
n
n
n
n
n
n
n
n
n
n
n
n
n
n
n
n
n
n
n
n
n
n
n
n
n
n
n
n
n
n
n
n
n
n
n
n
nn
n
n
n
n
n
n
n
n
n
n
n
n
n
n
n
n
n
n
n
n
n
n
n
n
n
n
n
n
n
n
n
n
n
n
n
n
n
n
n
n
n
n
nn
n
n
n
n
nn
n
n
nnn
n
n
n
n
n
n
n
n
n
n
n
n
n
n
n
n
n
n
n
n
n
n
n
n
n
n
n
n
n
n
n
n
n
n
n
n
n
n
n
n
n
n
n
n
n
n
n
n
n
n
n
n
n
n
n
n
n
n
nn
n
n
n
n
n
n
n
nnnn
n
n
n
n
n
n
n
n
n
n
n
n
nn
nn
n
n
n
n
nn
n
n
nn
n
n
nn
n
n
nnn
n
n
n
nn
n
n
n
n
nn
n
nn
n
n
n
n
n
n
n
n
n
n
n
n
n
n
n
n
nn
n
n
n
n
n
nn n
n
n
n
nn
n
n
n
nn
n
n
n
n
nn
n
n
n
n
n
n
nn
n
nnn
n
n n
n
n
n
n
n
n
n
n
n
n
n
n
n
n
n
n
n
n
nn
n
n
n
n
nn
nn
n
n
n
n
n
n
n
n
nnn
nn
n
nn
nn
n
n
nn
n
n
n
n
n
nnn
n
n
n
n
nn
nn
n
n
n
n
nn
n
n
n
n
n
n
n
n
n
n
n
n
n n
n
n
n
n
nn
nn
nnn
n
n
n
n
nn
nn
n
n
n
n
n
nn
n
n
nn
n
n
n
n
n
n
n
n
nn
nn
n
n
n
n
n
n
n
n
n
n
n
n
n
n
n
n
n
n
n
n
n
n
n
nn
n
n
n
n
nn
n
n
n
n
n
n
nn
n
nnn
n
n
n
n
n
n
n
nn
n
n
n
n
n
nn
n
n
n
n
n
n
n
n
n
n
n
n
n
n
n
n
n
nn
n
n
n
n
n
n
n
n
n
n
n
n
n
n
n
n
n
n
n
n
n
n
n
n
n
n
n
n
n
n
nn
n
n
n
nn
n
nn
n
nn
n
n
nn
n
n
n
n
n
nn
n
n
nn
nn
n
n
n
n
n
n
n
n
n
nn
n
n
n
n
n
n
n
n
nnn
n
n
n
n
n
n
n
n
nn
n
n
n
n
n
n
n
n
nn
n
n
n
nn
nnnnn
n
n
n
n
n
n
n
n
nnn
n
n
nn
n
n
n
n
nn
n
n
n
n
n
nn
n
n
n
n
n
n
n
n
n
n
n
nn
n
nn
nn
n
n
n
nnn
nn
n
nn
nn
n
n
n
n
n
n
nnn
n
nn
n
n
n
n
n
n
n
n
n
nn
n
n
n
n
n
n
n
n
n
n
n
n
n
n
n
n
nn
n
n
n
n
n
n
n
n
n
nn
n
n
nnn
n
n
n
n
n
n
n
n
n
n
n
nn
nnn
n
nnn
n
n
n
n
n
nn
n
n
n
n
n
n
n
n
n
n
n
n
n
n
n
n
n
nn
n
n
n
nn
nn
n
nn
n
n
n
n
n
n
n
n
nnn
n
n
n
n
n
n
n
n
n
n
n
n
n
n
nn
n
n
n
n
n
n
n
n
n
n
n
n
n
n
n
n
n
n
n
n
n
n
n
n
n
n
nn
n
n
n
n
n
n
nn
n
n
n
n
n
n
n
n
n
n
n
n
n
n
n
n
nn
n
n
n
n
n
n
n
n
n
n
n
nn
n
n
n
n
n
n
n
nn
n
n
n
n
nn
n
n n
n
n
n
n
n
n
n
n
n
n
n
nn
n
n
n
n
nn
n
n
n
n
n
n
n
n
n
n
n
n
nn
n
nnn
n
n
n
n
n
n
n
n
nn
n
n
n
n
n
n
n
n
n
n
n
nn
n
n
nn
n
n
n
n
n
nnn
nn
n
n
n
n
n
n
n
n
n
n
n
n
nn
n
n
n
n
nn
nnn
n
nnnn
n
n
nnn
n
nn
n
n
n
n
nn
nn
n
nn
n
n
n
n
n
n
n
n
nn
n
n
n
n
n
n
n
n
n
n
n
n
n
n
n
nn
n
n
n
n
n
nn
n
nnn
n
nn
n
nnn
n
n
n
n
n
n
n
n
n
n
n
n
nn
n
n
n
n
n
n
n
n
n
n
nn
n
n n
n
n
n nnn
n
n
n
n
n
nn
n
n
n
nn
nn
nn
n
n
n
n
n
nn
n
n
n
n
n
n
n
n
nn
n
n
n
n
n
n
n
n
n
nn
nnn
n
n
n
nn
n
n
n
n
n
n
n
n
nn
n
n
n
nn
n
n
n
n
n
nnn
n
n
n
n
nnn
n
n
n
n
n
n
n
n
n
n
nn
nnn
n
n
n
n
n
n
n
n
n
n
n
n
n
nn
n
n
n
n
n
n
n
n
n
nn
n
n
n
n n
n
n
nn
n
n
n
nn
n
n
n
nn
n
n
n
n
n
n
n
n
nn
nn
n
n
n
n
n
n
n
n
n
n
n
n
n
n
n
n
n
n
n
n
n
n
n
n
n
n
n
n
n
nn
nn
n
n
n
n
n
n
nnn
n
n
n
n
n
n
n
n
nn
n
n
n
n
n
n
n
n
n
n
n
n
n
n
n
n
nn
n
nn
n
n
n
n
nn
n
n
n
nn
n
n
n
n
n
n
n
n
n
nn
n
n
n
n
n
n
n
n
n
n
n
n
n
n
nn
nn
n
n
nn
n
nn
n
n
n
nnn
n
n
n
n
n
n
n
n
n
n
n
nn
n
n
n
n
n
n
n
n
n
n
n
n
n
n
n
n
n
n
n
n n
nn
nn
n
n
n
n
n
n
nn
nnn
n
n
nn
n
nn
nnn
n
n
n
n
n
n
n
n
nn
nnn
n
n
n
n
n
nn
n
n
n
n
n
n
n
n
n
n
n
n
nnnnn
n
n
n
n
n
n
n
n
n
n
n
nn
n
n
n
n
n
n
nnn
n
n
n
n
nn
n
n
n
n
n
n
nnnnn
n
n
n
n
nn
n
nn
n
n
nn
n
n
n
n
n
n
n
n
n
n
n
n
n
n
n
n
n
n
n
n
n
n
n
n
n
nnnn
n
nn
n
n
n
n
n
nn
nn
n
n
n
nn
n
n
n
n
n
n
n
n
n
n
n
n
n
n
nn
n
n
n
n
n
n n
n
n
n
n
n
n
n
nn
nnn
n
n
n
n
n
n
n
n
nn
n
n
n
n
n
n
n
n
n
n
n
n
n
n
nn
n
nn
n
n
n
n
n
n
n
n
nn
nn
n
n
n
n
n
n
n
n
n
n
n
n
n
n
n
n
n
n
n
nn
n
n
n
n
n
n
n
n
nnn
nn
nn
nnn
n
n
n
n
nn
n n
n
nn
n
n
n
n
n
n
n
n
n
n
n
n
n
n
n
n
nn
n
n
n
n
n
n
n
n
n
n
nn
n
n
n
n
nn
n
n
n
n
n
n
n
n
n
nnn
n
n
n
n
n
n
n
n
n
n
n
n
n
n
n
n
n
n
n
n
n
n
n
n
n
n
n
n
n
n
n
n
n
n
n
n
n
n
n
n
n
n
n
n
n
n
n
n
n
n
nn
n
n
n
n
n
n
n
n
n
n
n
n
n
n
n
n
n
n
n
n
n
nn
n
n
nn
n
n
nn
n
n
n
n
nnn
n
n
n
n
n
n
n
n
n
nn
n
n
n
n
n
n
n
n
nn
n
n
n
n
n
n
n
n
n
n
n
n
n
n
n
n
n
n
n
n
n
n
n
n
n
n
n
n
Fairfax County, VirginiaJanuary 2007
Note: City of Fairfax in not included.
Source: Fairfax County Department of Systems Management for Human Services.
Figure 9.1
ResidentialDevelopment Activity
Housing Unitsn Less than 5
n 5.0 - 50.0
n 50.1 - 300.0
n Over 300
Highways
Major Roads
IX-2
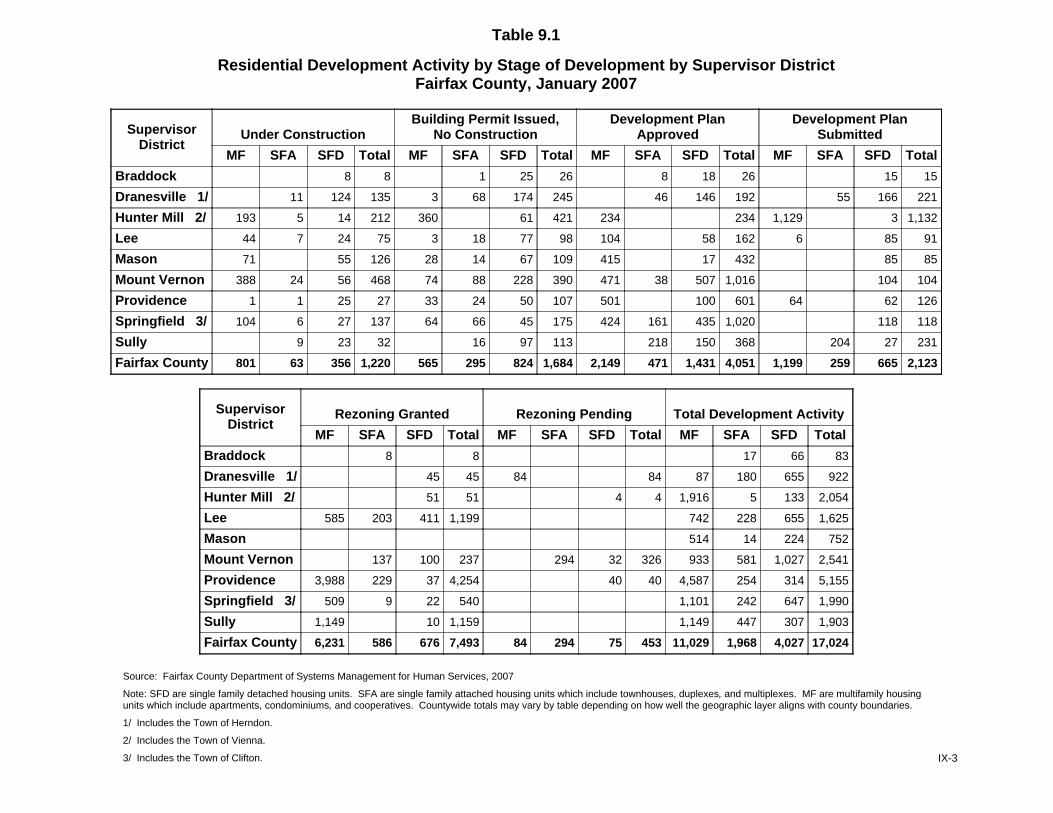
Table 9.1
Residential Development Activity by Stage of Development by Supervisor DistrictFairfax County, January 2007
SupervisorDistrict
Under ConstructionBuilding Permit Issued,
No ConstructionDevelopment Plan
ApprovedDevelopment Plan
Submitted
MF SFA SFD Total MF SFA SFD Total MF SFA SFD Total MF SFA SFD Total
Braddock 8 8 1 25 26 8 18 26 15 15
Dranesville 1/ 11 124 135 3 68 174 245 46 146 192 55 166 221
Hunter Mill 2/ 193 5 14 212 360 61 421 234 234 1,129 3 1,132
Lee 44 7 24 75 3 18 77 98 104 58 162 6 85 91
Mason 71 55 126 28 14 67 109 415 17 432 85 85
Mount Vernon 388 24 56 468 74 88 228 390 471 38 507 1,016 104 104
Providence 1 1 25 27 33 24 50 107 501 100 601 64 62 126
Springfield 3/ 104 6 27 137 64 66 45 175 424 161 435 1,020 118 118
Sully 9 23 32 16 97 113 218 150 368 204 27 231
Fairfax County 801 63 356 1,220 565 295 824 1,684 2,149 471 1,431 4,051 1,199 259 665 2,123
SupervisorDistrict
Rezoning Granted Rezoning Pending Total Development Activity
MF SFA SFD Total MF SFA SFD Total MF SFA SFD Total
Braddock 8 8 17 66 83
Dranesville 1/ 45 45 84 84 87 180 655 922
Hunter Mill 2/ 51 51 4 4 1,916 5 133 2,054
Lee 585 203 411 1,199 742 228 655 1,625
Mason 514 14 224 752
Mount Vernon 137 100 237 294 32 326 933 581 1,027 2,541
Providence 3,988 229 37 4,254 40 40 4,587 254 314 5,155
Springfield 3/ 509 9 22 540 1,101 242 647 1,990
Sully 1,149 10 1,159 1,149 447 307 1,903
Fairfax County 6,231 586 676 7,493 84 294 75 453 11,029 1,968 4,027 17,024
Source: Fairfax County Department of Systems Management for Human Services, 2007
Note: SFD are single family detached housing units. SFA are single family attached housing units which include townhouses, duplexes, and multiplexes. MF are multifamily housingunits which include apartments, condominiums, and cooperatives. Countywide totals may vary by table depending on how well the geographic layer aligns with county boundaries.
1/ Includes the Town of Herndon.
2/ Includes the Town of Vienna.
3/ Includes the Town of Clifton. IX-3
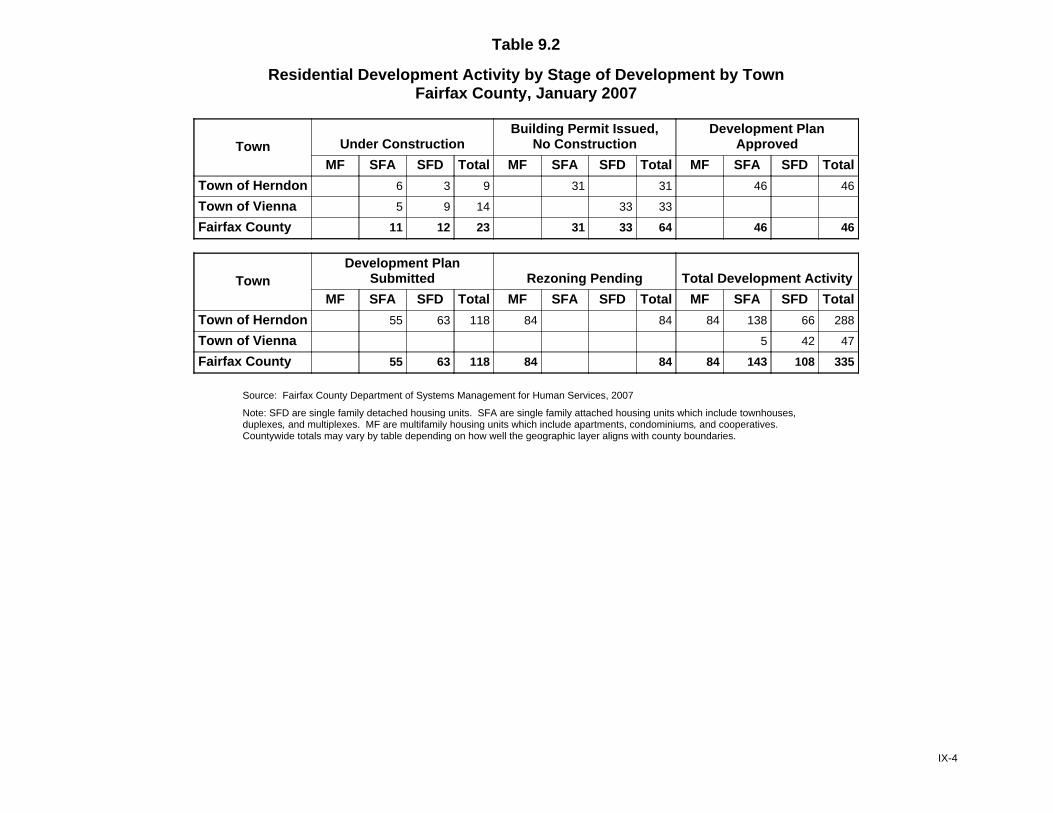
Table 9.2
Residential Development Activity by Stage of Development by TownFairfax County, January 2007
Town Under ConstructionBuilding Permit Issued,
No ConstructionDevelopment Plan
Approved
MF SFA SFD Total MF SFA SFD Total MF SFA SFD Total
Town of Herndon 6 3 9 31 31 46 46
Town of Vienna 5 9 14 33 33
Fairfax County 11 12 23 31 33 64 46 46
TownDevelopment Plan
Submitted Rezoning Pending Total Development Activity
MF SFA SFD Total MF SFA SFD Total MF SFA SFD Total
Town of Herndon 55 63 118 84 84 84 138 66 288
Town of Vienna 5 42 47
Fairfax County 55 63 118 84 84 84 143 108 335
Source: Fairfax County Department of Systems Management for Human Services, 2007
Note: SFD are single family detached housing units. SFA are single family attached housing units which include townhouses,duplexes, and multiplexes. MF are multifamily housing units which include apartments, condominiums, and cooperatives. Countywide totals may vary by table depending on how well the geographic layer aligns with county boundaries.
IX-4

Table 9.3
Residential Development Activity by Stage of Development by Planning DistrictFairfax County, January 2007
Table 9.3
Residential Development Activity by Stage of Development by Planning DistrictFairfax County, January 2007
Planning District Under ConstructionBuilding Permit Issued,
No ConstructionDevelopment Plan
ApprovedDevelopment Plan
Submitted
MF SFA SFD Total MF SFA SFD Total MF SFA SFD Total MF SFA SFD Total
Annandale 39 39 14 32 46 11 11 46 46
Baileys 14 14 1 26 27 415 9 424 20 20
Bull Run 22 11 17 50 1 16 74 91 62 318 338 718 204 15 219
Fairfax 79 1 12 92 62 66 22 150 608 33 641 64 36 100
Jefferson 1 8 9 33 24 57 19 19 25 25
Lincolnia 71 4 75 27 11 38 8 8
Lower Potomac 35 13 22 70 74 69 141 284 251 421 672 15 15
McLean 5 83 88 3 38 128 169 109 109 56 56
Mount Vernon 397 16 30 443 3 20 53 76 324 38 18 380 6 39 45
Pohick 1/ 28 28 2 58 60 8 180 188 175 175
Rose Hill 2 15 17 17 34 51 54 54 67 67
Springfield 3 7 10 1 57 58 4 4 21 21
Upper Potomac 2/ 193 9 53 255 360 36 89 485 234 107 187 528 1,129 55 121 1,305
Vienna 3/ 6 24 30 17 75 92 255 48 303 21 21
Fairfax County 801 63 356 1,220 565 295 824 1,684 2,149 471 1,431 4,051 1,199 259 665 2,123
IX-5
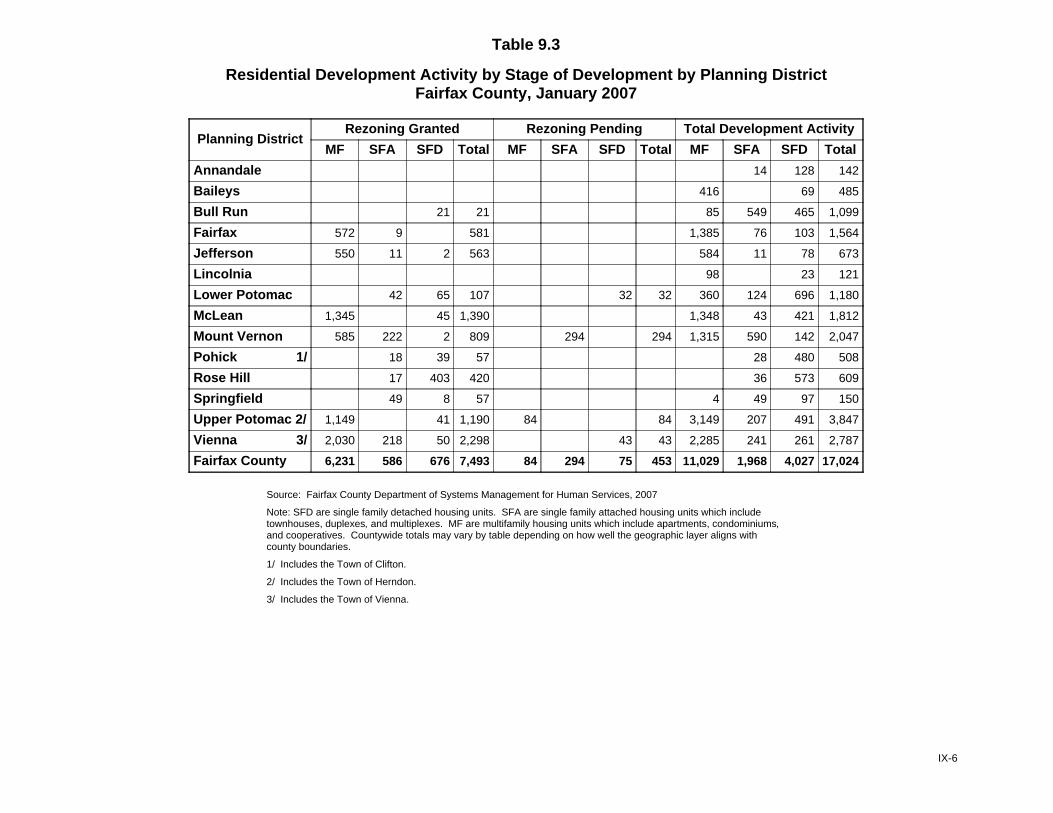
Table 9.3
Residential Development Activity by Stage of Development by Planning DistrictFairfax County, January 2007
Planning DistrictRezoning Granted Rezoning Pending Total Development Activity
MF SFA SFD Total MF SFA SFD Total MF SFA SFD Total
Annandale 14 128 142
Baileys 416 69 485
Bull Run 21 21 85 549 465 1,099
Fairfax 572 9 581 1,385 76 103 1,564
Jefferson 550 11 2 563 584 11 78 673
Lincolnia 98 23 121
Lower Potomac 42 65 107 32 32 360 124 696 1,180
McLean 1,345 45 1,390 1,348 43 421 1,812
Mount Vernon 585 222 2 809 294 294 1,315 590 142 2,047
Pohick 1/ 18 39 57 28 480 508
Rose Hill 17 403 420 36 573 609
Springfield 49 8 57 4 49 97 150
Upper Potomac 2/ 1,149 41 1,190 84 84 3,149 207 491 3,847
Vienna 3/ 2,030 218 50 2,298 43 43 2,285 241 261 2,787
Fairfax County 6,231 586 676 7,493 84 294 75 453 11,029 1,968 4,027 17,024
Source: Fairfax County Department of Systems Management for Human Services, 2007
Note: SFD are single family detached housing units. SFA are single family attached housing units which includetownhouses, duplexes, and multiplexes. MF are multifamily housing units which include apartments, condominiums,and cooperatives. Countywide totals may vary by table depending on how well the geographic layer aligns withcounty boundaries.
1/ Includes the Town of Clifton.
2/ Includes the Town of Herndon.
3/ Includes the Town of Vienna.
IX-6
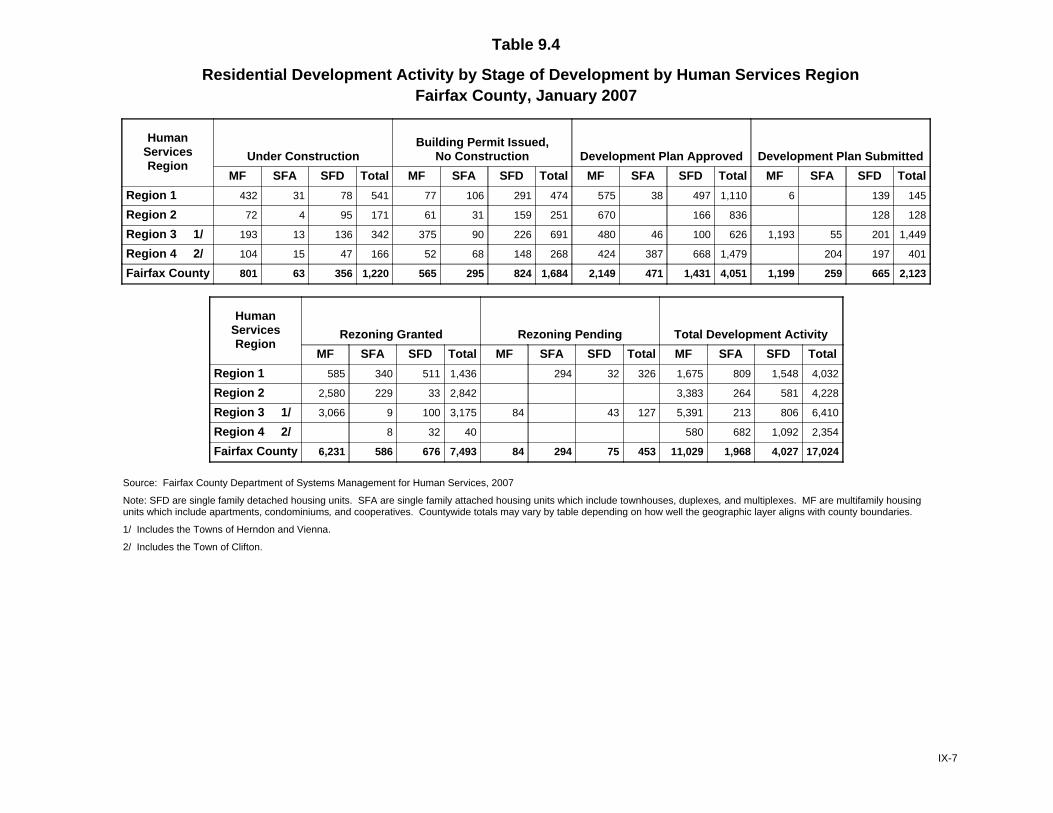
Table 9.4
Residential Development Activity by Stage of Development by Human Services RegionFairfax County, January 2007
HumanServicesRegion
Under ConstructionBuilding Permit Issued,
No Construction Development Plan Approved Development Plan Submitted
MF SFA SFD Total MF SFA SFD Total MF SFA SFD Total MF SFA SFD Total
Region 1 432 31 78 541 77 106 291 474 575 38 497 1,110 6 139 145
Region 2 72 4 95 171 61 31 159 251 670 166 836 128 128
Region 3 1/ 193 13 136 342 375 90 226 691 480 46 100 626 1,193 55 201 1,449
Region 4 2/ 104 15 47 166 52 68 148 268 424 387 668 1,479 204 197 401
Fairfax County 801 63 356 1,220 565 295 824 1,684 2,149 471 1,431 4,051 1,199 259 665 2,123
HumanServicesRegion
Rezoning Granted Rezoning Pending Total Development Activity
MF SFA SFD Total MF SFA SFD Total MF SFA SFD Total
Region 1 585 340 511 1,436 294 32 326 1,675 809 1,548 4,032
Region 2 2,580 229 33 2,842 3,383 264 581 4,228
Region 3 1/ 3,066 9 100 3,175 84 43 127 5,391 213 806 6,410
Region 4 2/ 8 32 40 580 682 1,092 2,354
Fairfax County 6,231 586 676 7,493 84 294 75 453 11,029 1,968 4,027 17,024
Source: Fairfax County Department of Systems Management for Human Services, 2007
Note: SFD are single family detached housing units. SFA are single family attached housing units which include townhouses, duplexes, and multiplexes. MF are multifamily housingunits which include apartments, condominiums, and cooperatives. Countywide totals may vary by table depending on how well the geographic layer aligns with county boundaries.
1/ Includes the Towns of Herndon and Vienna.
2/ Includes the Town of Clifton.
IX-7
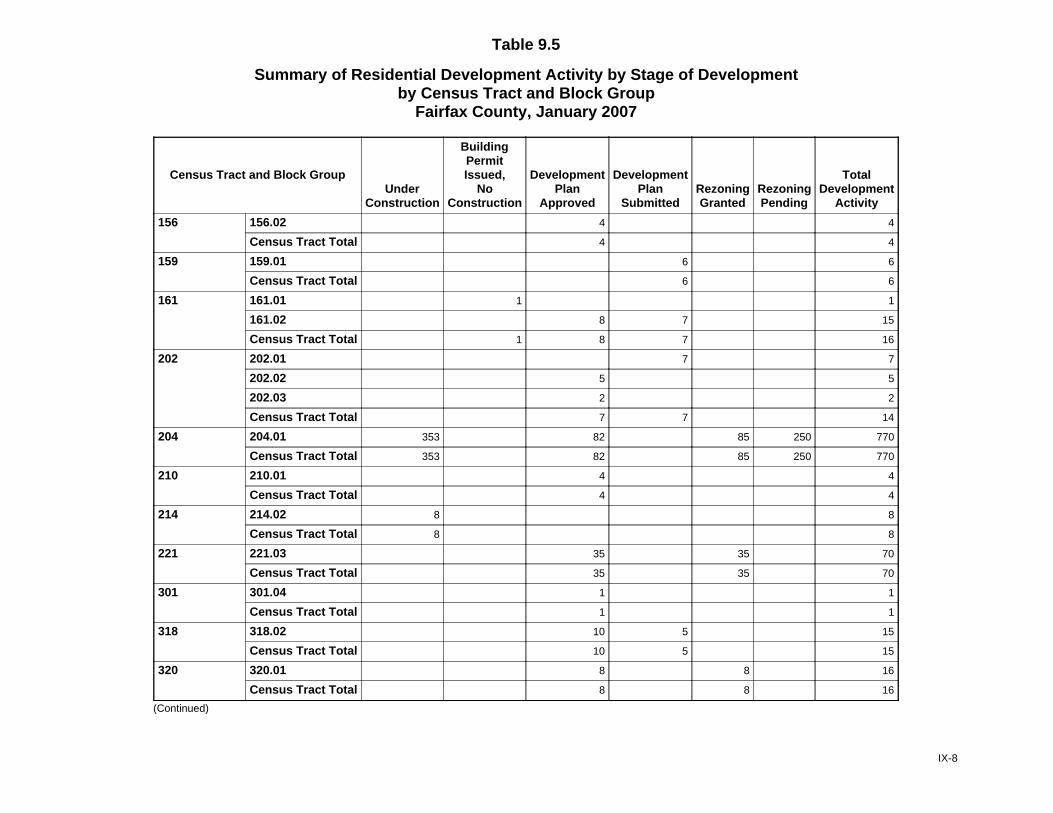
Table 9.5
Summary of Residential Development Activity by Stage of Developmentby Census Tract and Block Group
Fairfax County, January 2007
Census Tract and Block GroupUnder
Construction
BuildingPermitIssued,
NoConstruction
DevelopmentPlan
Approved
DevelopmentPlan
SubmittedRezoningGranted
RezoningPending
TotalDevelopment
Activity
156 156.02 4 4
Census Tract Total 4 4
159 159.01 6 6
Census Tract Total 6 6
161 161.01 1 1
161.02 8 7 15
Census Tract Total 1 8 7 16
202 202.01 7 7
202.02 5 5
202.03 2 2
Census Tract Total 7 7 14
204 204.01 353 82 85 250 770
Census Tract Total 353 82 85 250 770
210 210.01 4 4
Census Tract Total 4 4
214 214.02 8 8
Census Tract Total 8 8
221 221.03 35 35 70
Census Tract Total 35 35 70
301 301.04 1 1
Census Tract Total 1 1
318 318.02 10 5 15
Census Tract Total 10 5 15
320 320.01 8 8 16
Census Tract Total 8 8 16
(Continued)
IX-8

Table 9.5
Summary of Residential Development Activity by Stage of Developmentby Census Tract and Block Group
Fairfax County, January 2007
Census Tract and Block GroupUnder
Construction
BuildingPermitIssued,
NoConstruction
DevelopmentPlan
Approved
DevelopmentPlan
SubmittedRezoningGranted
RezoningPending
TotalDevelopment
Activity
506 506.03 2 2
Census Tract Total 2 2
515 515.04 415 415
Census Tract Total 415 415
524 524.05 1 1
Census Tract Total 1 1
528 528.01 9 9
Census Tract Total 9 9
612 612.02 7 3 10
612.03 6 509 515
Census Tract Total 13 3 509 525
616 616.01 2,248 2,248
Census Tract Total 2,248 2,248
701 701.02 1 1
Census Tract Total 1 1
703 703.02 5 5
Census Tract Total 5 5
713 713.04 12 12 24
Census Tract Total 12 12 24
803 803.01 2 2
Census Tract Total 2 2
804 804.02 5 7 12
Census Tract Total 5 7 12
808 /2 808.05 1 1
808.06 7 7
Census Tract Total 8 8
(Continued)
IX-9
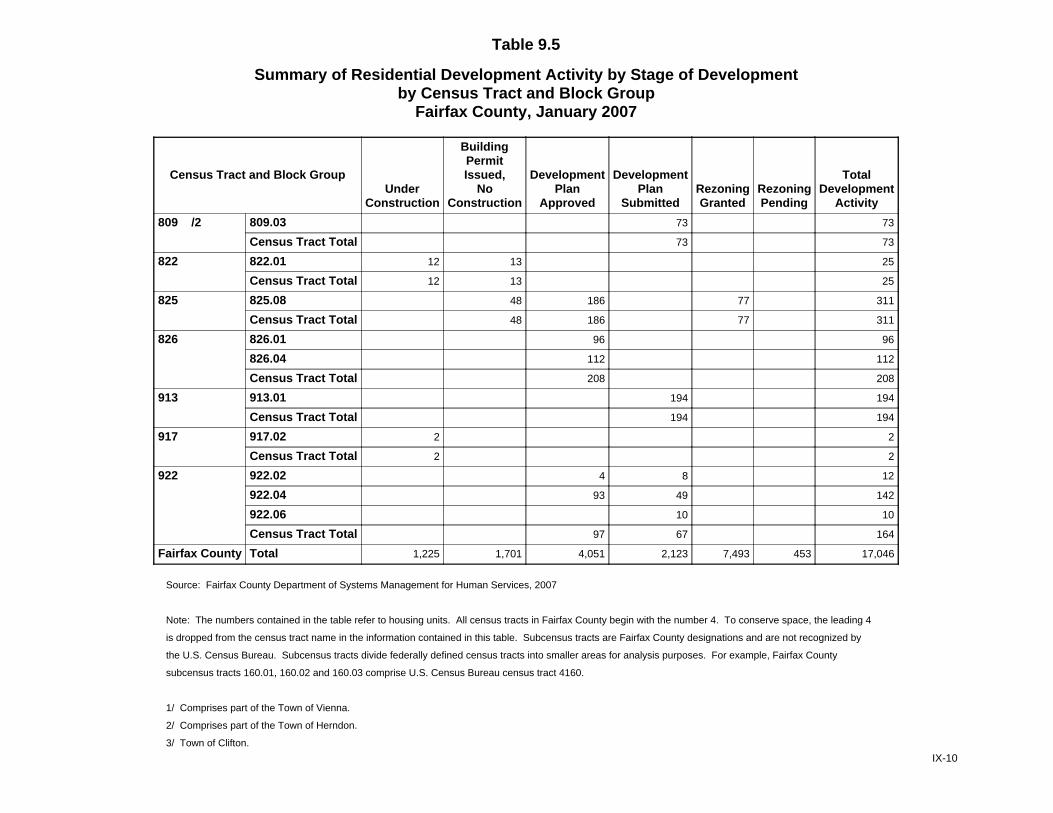
Table 9.5
Summary of Residential Development Activity by Stage of Developmentby Census Tract and Block Group
Fairfax County, January 2007
Census Tract and Block GroupUnder
Construction
BuildingPermitIssued,
NoConstruction
DevelopmentPlan
Approved
DevelopmentPlan
SubmittedRezoningGranted
RezoningPending
TotalDevelopment
Activity
809 /2 809.03 73 73
Census Tract Total 73 73
822 822.01 12 13 25
Census Tract Total 12 13 25
825 825.08 48 186 77 311
Census Tract Total 48 186 77 311
826 826.01 96 96
826.04 112 112
Census Tract Total 208 208
913 913.01 194 194
Census Tract Total 194 194
917 917.02 2 2
Census Tract Total 2 2
922 922.02 4 8 12
922.04 93 49 142
922.06 10 10
Census Tract Total 97 67 164
Fairfax County Total 1,225 1,701 4,051 2,123 7,493 453 17,046
Source: Fairfax County Department of Systems Management for Human Services, 2007
Note: The numbers contained in the table refer to housing units. All census tracts in Fairfax County begin with the number 4. To conserve space, the leading 4
is dropped from the census tract name in the information contained in this table. Subcensus tracts are Fairfax County designations and are not recognized by
the U.S. Census Bureau. Subcensus tracts divide federally defined census tracts into smaller areas for analysis purposes. For example, Fairfax County
subcensus tracts 160.01, 160.02 and 160.03 comprise U.S. Census Bureau census tract 4160.
1/ Comprises part of the Town of Vienna.
2/ Comprises part of the Town of Herndon.
3/ Town of Clifton.
IX-10
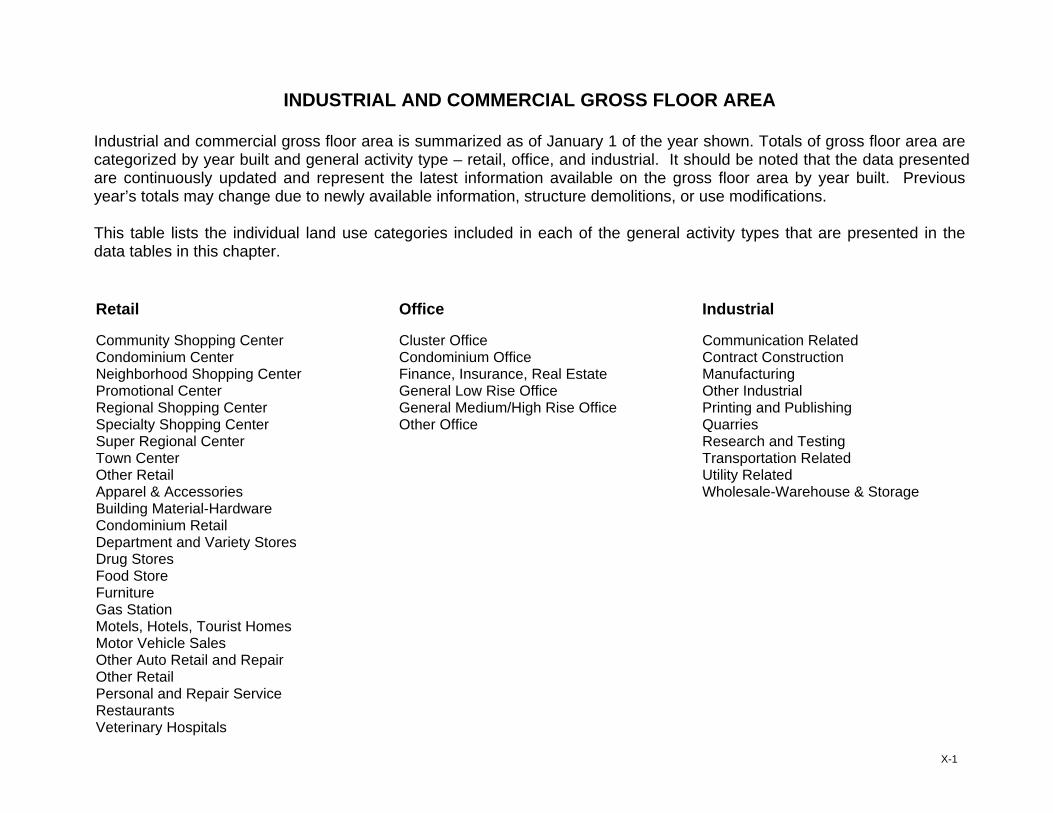
Retail Community Shopping Center Condominium Center Neighborhood Shopping Center Promotional Center Regional Shopping Center Specialty Shopping Center Super Regional Center Town Center Other Retail Apparel & Accessories Building Material-Hardware Condominium Retail Department and Variety Stores Drug Stores Food Store Furniture Gas Station Motels, Hotels, Tourist Homes Motor Vehicle Sales Other Auto Retail and Repair Other Retail Personal and Repair Service Restaurants Veterinary Hospitals
Office Cluster Office Condominium Office Finance, Insurance, Real Estate General Low Rise Office General Medium/High Rise Office Other Office
Industrial Communication Related Contract Construction Manufacturing Other Industrial Printing and Publishing Quarries Research and Testing Transportation Related Utility Related Wholesale-Warehouse & Storage
INDUSTRIAL AND COMMERCIAL GROSS FLOOR AREA
Industrial and commercial gross floor area is summarized as of January 1 of the year shown. Totals of gross floor area are categorized by year built and general activity type – retail, office, and industrial. It should be noted that the data presented are continuously updated and represent the latest information available on the gross floor area by year built. Previous year’s totals may change due to newly available information, structure demolitions, or use modifications. This table lists the individual land use categories included in each of the general activity types that are presented in the data tables in this chapter.
X-1
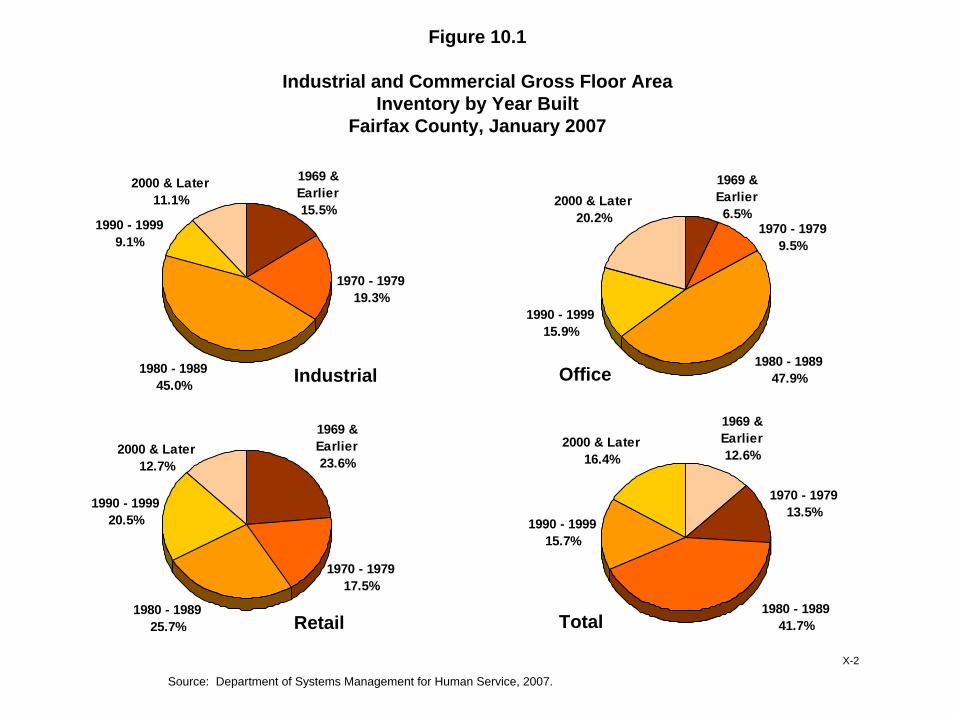
Figure 10.1
Industrial and Commercial Gross Floor AreaInventory by Year Built
Fairfax County, January 2007
1970 - 197919.3%
1980 - 198945.0%
1990 - 19999.1%
2000 & Later11.1%
1969 & Earlier15.5%
Industrial
2000 & Later20.2%
1990 - 199915.9%
1980 - 198947.9%
1969 & Earlier6.5%
1970 - 19799.5%
Office
1969 & Earlier12.6%
1970 - 197913.5%
1990 - 199915.7%
2000 & Later16.4%
1980 - 198941.7%Total
1970 - 197917.5%
1990 - 199920.5%
1969 & Earlier23.6%
1980 - 198925.7%
2000 & Later12.7%
Retail
Source: Department of Systems Management for Human Service, 2007.
X-2
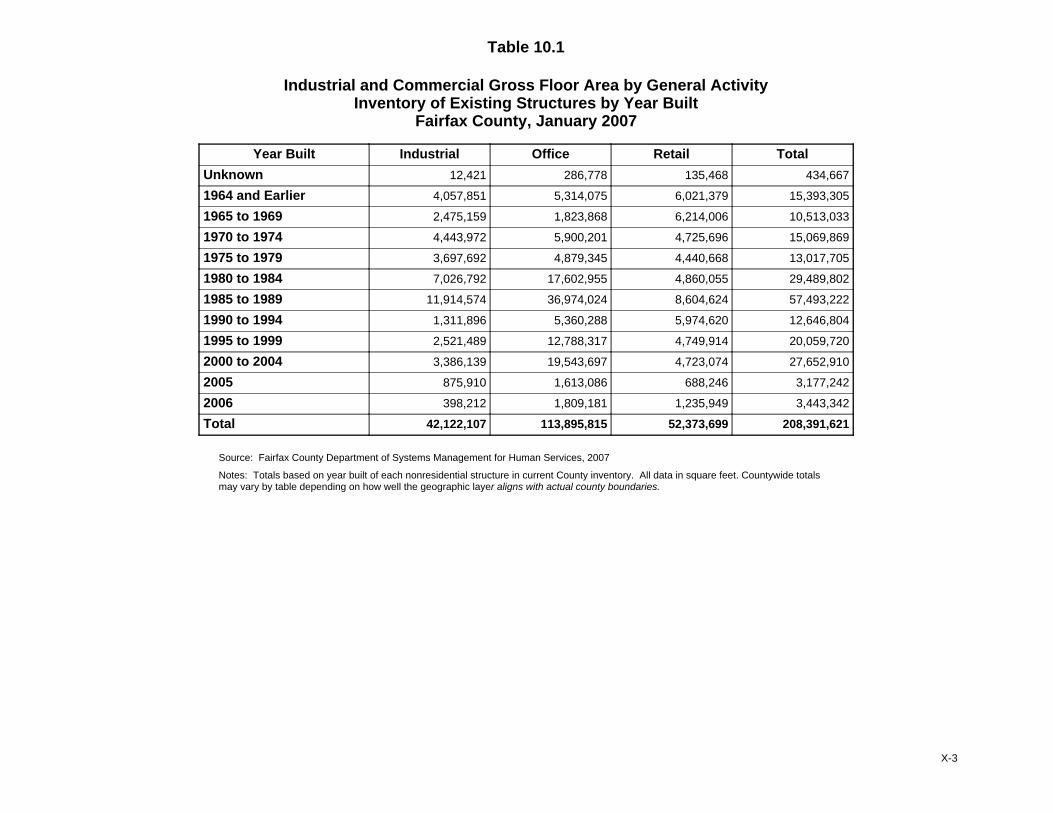
Table 10.1
Industrial and Commercial Gross Floor Area by General ActivityInventory of Existing Structures by Year Built
Fairfax County, January 2007
Year Built Industrial Office Retail Total
Unknown 12,421 286,778 135,468 434,667
1964 and Earlier 4,057,851 5,314,075 6,021,379 15,393,305
1965 to 1969 2,475,159 1,823,868 6,214,006 10,513,033
1970 to 1974 4,443,972 5,900,201 4,725,696 15,069,869
1975 to 1979 3,697,692 4,879,345 4,440,668 13,017,705
1980 to 1984 7,026,792 17,602,955 4,860,055 29,489,802
1985 to 1989 11,914,574 36,974,024 8,604,624 57,493,222
1990 to 1994 1,311,896 5,360,288 5,974,620 12,646,804
1995 to 1999 2,521,489 12,788,317 4,749,914 20,059,720
2000 to 2004 3,386,139 19,543,697 4,723,074 27,652,910
2005 875,910 1,613,086 688,246 3,177,242
2006 398,212 1,809,181 1,235,949 3,443,342
Total 42,122,107 113,895,815 52,373,699 208,391,621
Source: Fairfax County Department of Systems Management for Human Services, 2007
Notes: Totals based on year built of each nonresidential structure in current County inventory. All data in square feet. Countywide totalsmay vary by table depending on how well the geographic layer aligns with actual county boundaries.
X-3
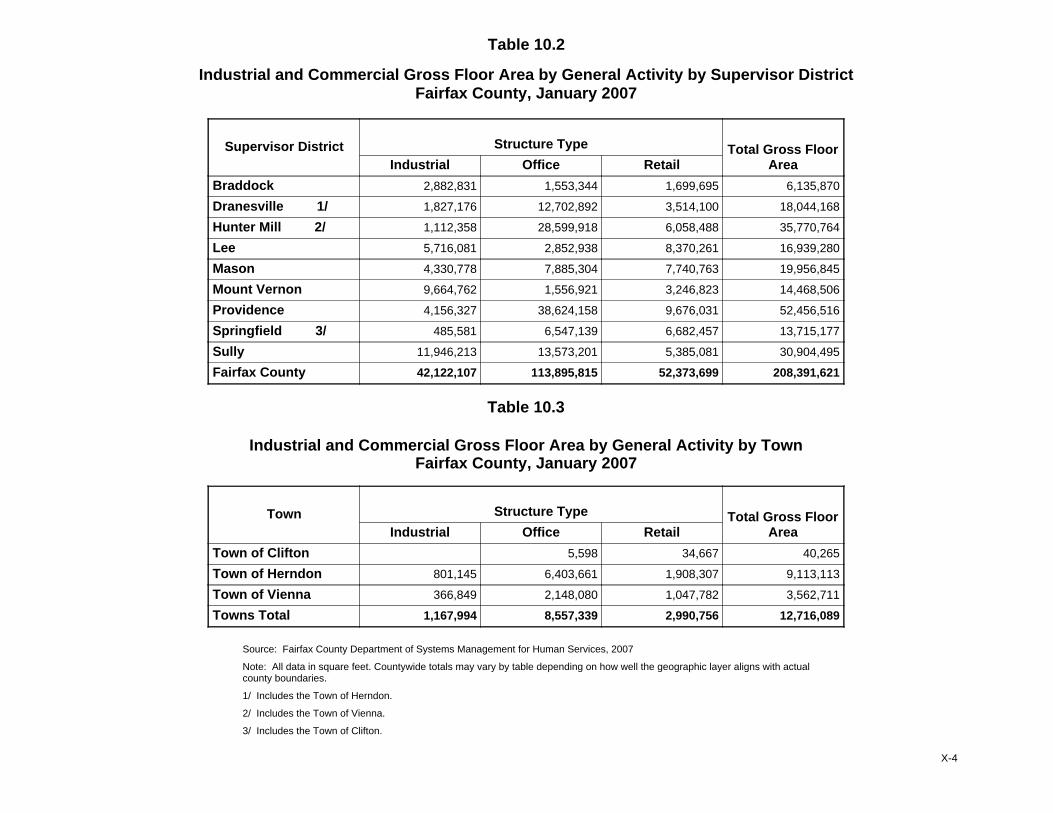
Table 10.2
Industrial and Commercial Gross Floor Area by General Activity by Supervisor DistrictFairfax County, January 2007
Supervisor District Structure Type Total Gross FloorAreaIndustrial Office Retail
Braddock 2,882,831 1,553,344 1,699,695 6,135,870
Dranesville 1/ 1,827,176 12,702,892 3,514,100 18,044,168
Hunter Mill 2/ 1,112,358 28,599,918 6,058,488 35,770,764
Lee 5,716,081 2,852,938 8,370,261 16,939,280
Mason 4,330,778 7,885,304 7,740,763 19,956,845
Mount Vernon 9,664,762 1,556,921 3,246,823 14,468,506
Providence 4,156,327 38,624,158 9,676,031 52,456,516
Springfield 3/ 485,581 6,547,139 6,682,457 13,715,177
Sully 11,946,213 13,573,201 5,385,081 30,904,495
Fairfax County 42,122,107 113,895,815 52,373,699 208,391,621
Table 10.3
Industrial and Commercial Gross Floor Area by General Activity by TownFairfax County, January 2007
Town Structure Type Total Gross FloorAreaIndustrial Office Retail
Town of Clifton 5,598 34,667 40,265
Town of Herndon 801,145 6,403,661 1,908,307 9,113,113
Town of Vienna 366,849 2,148,080 1,047,782 3,562,711
Towns Total 1,167,994 8,557,339 2,990,756 12,716,089
Source: Fairfax County Department of Systems Management for Human Services, 2007
Note: All data in square feet. Countywide totals may vary by table depending on how well the geographic layer aligns with actualcounty boundaries.
1/ Includes the Town of Herndon.
2/ Includes the Town of Vienna.
3/ Includes the Town of Clifton.
X-4
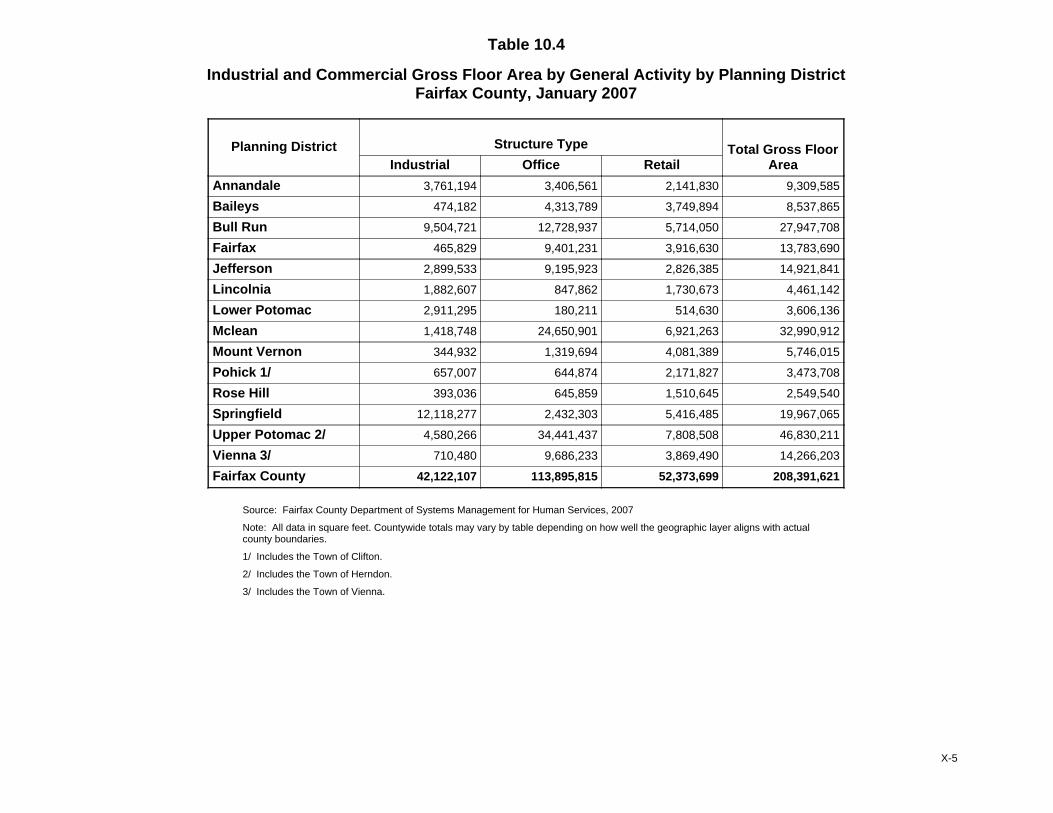
Table 10.4
Industrial and Commercial Gross Floor Area by General Activity by Planning DistrictFairfax County, January 2007
Planning District Structure Type Total Gross FloorAreaIndustrial Office Retail
Annandale 3,761,194 3,406,561 2,141,830 9,309,585
Baileys 474,182 4,313,789 3,749,894 8,537,865
Bull Run 9,504,721 12,728,937 5,714,050 27,947,708
Fairfax 465,829 9,401,231 3,916,630 13,783,690
Jefferson 2,899,533 9,195,923 2,826,385 14,921,841
Lincolnia 1,882,607 847,862 1,730,673 4,461,142
Lower Potomac 2,911,295 180,211 514,630 3,606,136
Mclean 1,418,748 24,650,901 6,921,263 32,990,912
Mount Vernon 344,932 1,319,694 4,081,389 5,746,015
Pohick 1/ 657,007 644,874 2,171,827 3,473,708
Rose Hill 393,036 645,859 1,510,645 2,549,540
Springfield 12,118,277 2,432,303 5,416,485 19,967,065
Upper Potomac 2/ 4,580,266 34,441,437 7,808,508 46,830,211
Vienna 3/ 710,480 9,686,233 3,869,490 14,266,203
Fairfax County 42,122,107 113,895,815 52,373,699 208,391,621
Source: Fairfax County Department of Systems Management for Human Services, 2007
Note: All data in square feet. Countywide totals may vary by table depending on how well the geographic layer aligns with actualcounty boundaries.
1/ Includes the Town of Clifton.
2/ Includes the Town of Herndon.
3/ Includes the Town of Vienna.
X-5
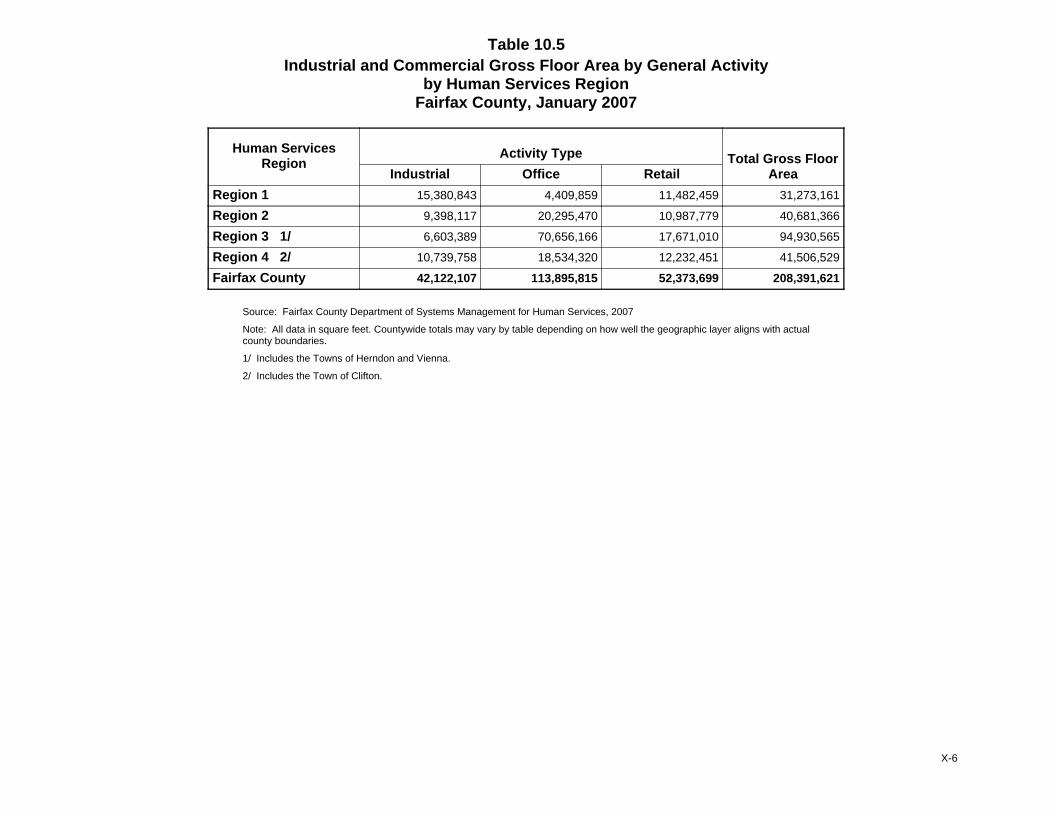
Table 10.5Industrial and Commercial Gross Floor Area by General Activity
by Human Services RegionFairfax County, January 2007
Human ServicesRegion
Activity Type Total Gross FloorAreaIndustrial Office Retail
Region 1 15,380,843 4,409,859 11,482,459 31,273,161
Region 2 9,398,117 20,295,470 10,987,779 40,681,366
Region 3 1/ 6,603,389 70,656,166 17,671,010 94,930,565
Region 4 2/ 10,739,758 18,534,320 12,232,451 41,506,529
Fairfax County 42,122,107 113,895,815 52,373,699 208,391,621
Source: Fairfax County Department of Systems Management for Human Services, 2007
Note: All data in square feet. Countywide totals may vary by table depending on how well the geographic layer aligns with actualcounty boundaries.
1/ Includes the Towns of Herndon and Vienna.
2/ Includes the Town of Clifton.
X-6
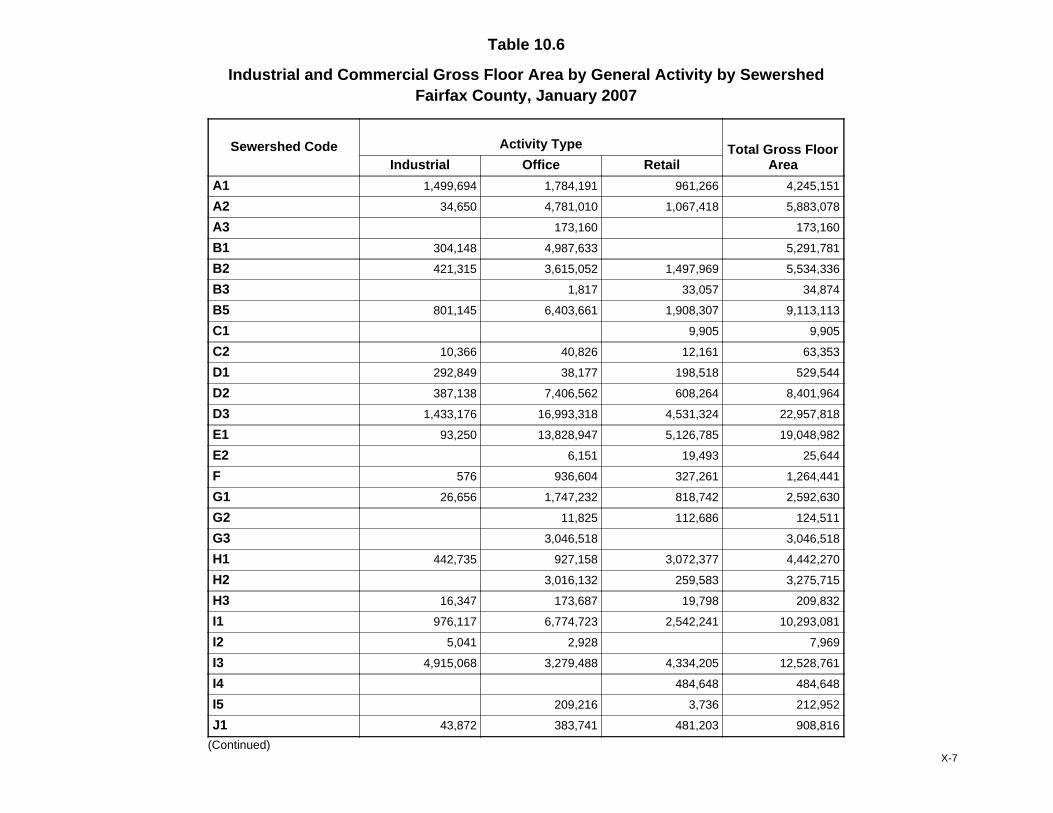
Table 10.6
Industrial and Commercial Gross Floor Area by General Activity by SewershedFairfax County, January 2007
Sewershed Code Activity Type Total Gross FloorAreaIndustrial Office Retail
A1 1,499,694 1,784,191 961,266 4,245,151
A2 34,650 4,781,010 1,067,418 5,883,078
A3 173,160 173,160
B1 304,148 4,987,633 5,291,781
B2 421,315 3,615,052 1,497,969 5,534,336
B3 1,817 33,057 34,874
B5 801,145 6,403,661 1,908,307 9,113,113
C1 9,905 9,905
C2 10,366 40,826 12,161 63,353
D1 292,849 38,177 198,518 529,544
D2 387,138 7,406,562 608,264 8,401,964
D3 1,433,176 16,993,318 4,531,324 22,957,818
E1 93,250 13,828,947 5,126,785 19,048,982
E2 6,151 19,493 25,644
F 576 936,604 327,261 1,264,441
G1 26,656 1,747,232 818,742 2,592,630
G2 11,825 112,686 124,511
G3 3,046,518 3,046,518
H1 442,735 927,158 3,072,377 4,442,270
H2 3,016,132 259,583 3,275,715
H3 16,347 173,687 19,798 209,832
I1 976,117 6,774,723 2,542,241 10,293,081
I2 5,041 2,928 7,969
I3 4,915,068 3,279,488 4,334,205 12,528,761
I4 484,648 484,648
I5 209,216 3,736 212,952
J1 43,872 383,741 481,203 908,816
(Continued)X-7
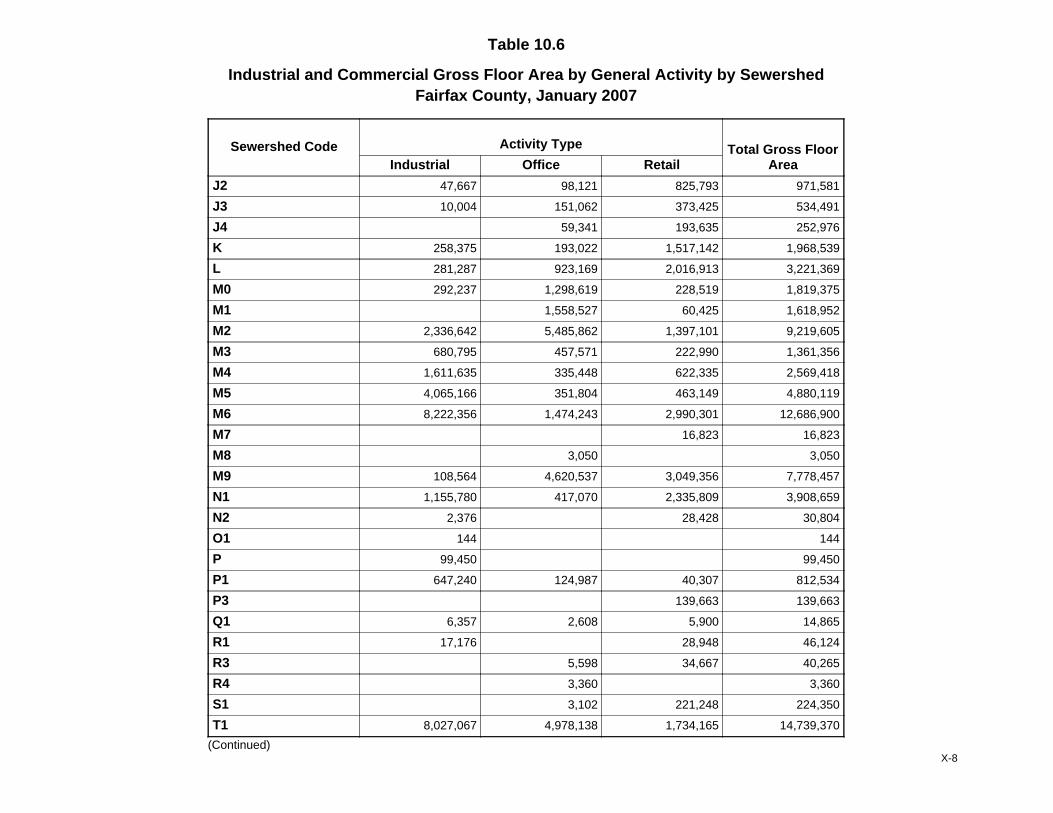
Table 10.6
Industrial and Commercial Gross Floor Area by General Activity by SewershedFairfax County, January 2007
Sewershed Code Activity Type Total Gross FloorAreaIndustrial Office Retail
J2 47,667 98,121 825,793 971,581
J3 10,004 151,062 373,425 534,491
J4 59,341 193,635 252,976
K 258,375 193,022 1,517,142 1,968,539
L 281,287 923,169 2,016,913 3,221,369
M0 292,237 1,298,619 228,519 1,819,375
M1 1,558,527 60,425 1,618,952
M2 2,336,642 5,485,862 1,397,101 9,219,605
M3 680,795 457,571 222,990 1,361,356
M4 1,611,635 335,448 622,335 2,569,418
M5 4,065,166 351,804 463,149 4,880,119
M6 8,222,356 1,474,243 2,990,301 12,686,900
M7 16,823 16,823
M8 3,050 3,050
M9 108,564 4,620,537 3,049,356 7,778,457
N1 1,155,780 417,070 2,335,809 3,908,659
N2 2,376 28,428 30,804
O1 144 144
P 99,450 99,450
P1 647,240 124,987 40,307 812,534
P3 139,663 139,663
Q1 6,357 2,608 5,900 14,865
R1 17,176 28,948 46,124
R3 5,598 34,667 40,265
R4 3,360 3,360
S1 3,102 221,248 224,350
T1 8,027,067 4,978,138 1,734,165 14,739,370
(Continued)X-8
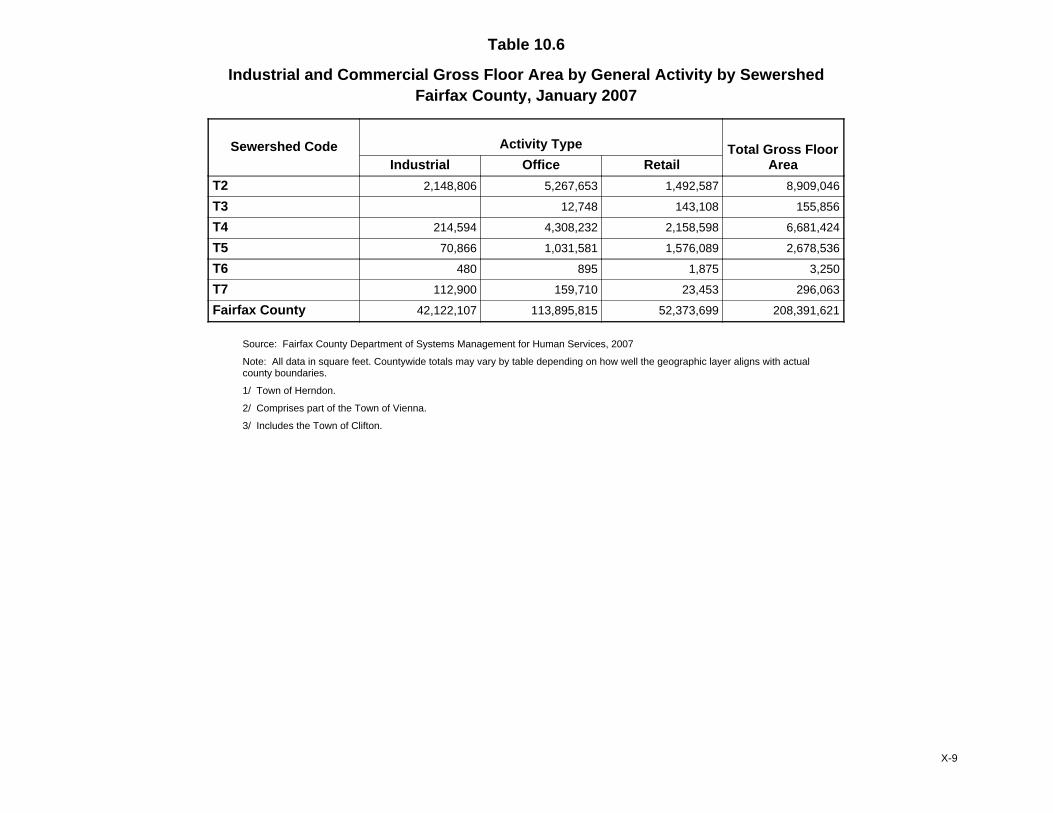
Table 10.6
Industrial and Commercial Gross Floor Area by General Activity by SewershedFairfax County, January 2007
Sewershed Code Activity Type Total Gross FloorAreaIndustrial Office Retail
T2 2,148,806 5,267,653 1,492,587 8,909,046
T3 12,748 143,108 155,856
T4 214,594 4,308,232 2,158,598 6,681,424
T5 70,866 1,031,581 1,576,089 2,678,536
T6 480 895 1,875 3,250
T7 112,900 159,710 23,453 296,063
Fairfax County 42,122,107 113,895,815 52,373,699 208,391,621
Source: Fairfax County Department of Systems Management for Human Services, 2007
Note: All data in square feet. Countywide totals may vary by table depending on how well the geographic layer aligns with actualcounty boundaries.
1/ Town of Herndon.
2/ Comprises part of the Town of Vienna.
3/ Includes the Town of Clifton.
X-9
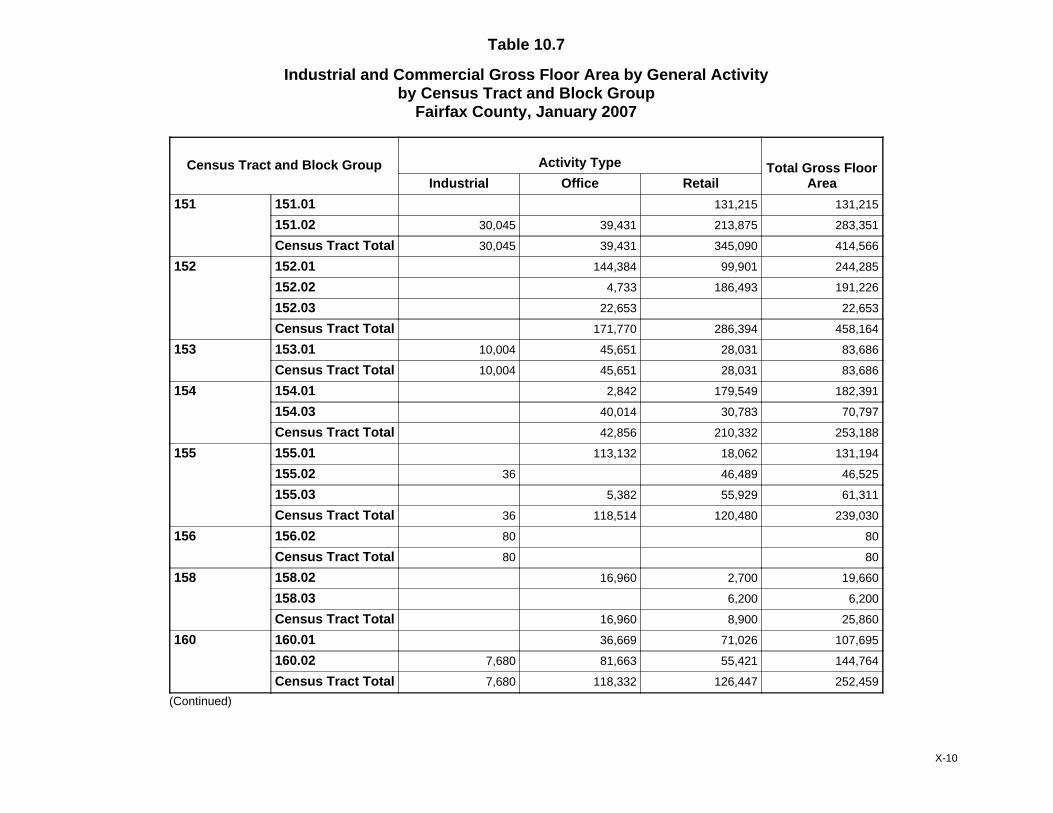
Table 10.7
Industrial and Commercial Gross Floor Area by General Activityby Census Tract and Block Group
Fairfax County, January 2007
Census Tract and Block Group Activity Type Total Gross FloorAreaIndustrial Office Retail
151 151.01 131,215 131,215
151.02 30,045 39,431 213,875 283,351
Census Tract Total 30,045 39,431 345,090 414,566
152 152.01 144,384 99,901 244,285
152.02 4,733 186,493 191,226
152.03 22,653 22,653
Census Tract Total 171,770 286,394 458,164
153 153.01 10,004 45,651 28,031 83,686
Census Tract Total 10,004 45,651 28,031 83,686
154 154.01 2,842 179,549 182,391
154.03 40,014 30,783 70,797
Census Tract Total 42,856 210,332 253,188
155 155.01 113,132 18,062 131,194
155.02 36 46,489 46,525
155.03 5,382 55,929 61,311
Census Tract Total 36 118,514 120,480 239,030
156 156.02 80 80
Census Tract Total 80 80
158 158.02 16,960 2,700 19,660
158.03 6,200 6,200
Census Tract Total 16,960 8,900 25,860
160 160.01 36,669 71,026 107,695
160.02 7,680 81,663 55,421 144,764
Census Tract Total 7,680 118,332 126,447 252,459
(Continued)
X-10
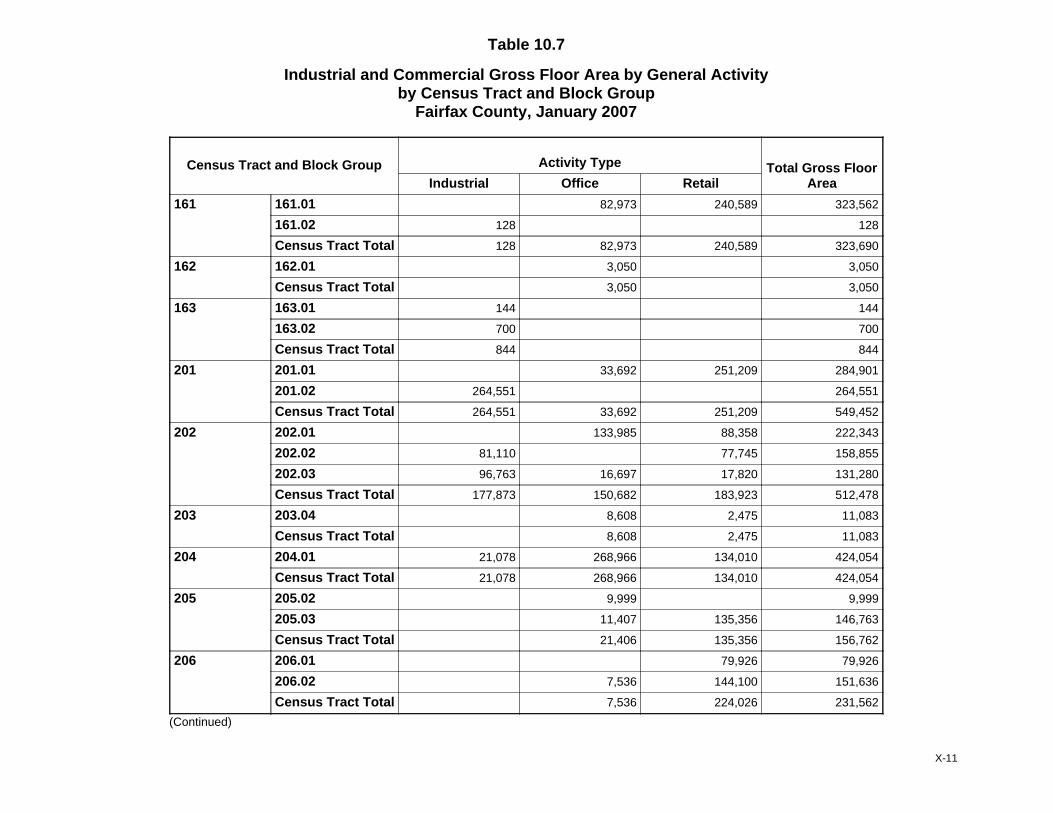
Table 10.7
Industrial and Commercial Gross Floor Area by General Activityby Census Tract and Block Group
Fairfax County, January 2007
Census Tract and Block Group Activity Type Total Gross FloorAreaIndustrial Office Retail
161 161.01 82,973 240,589 323,562
161.02 128 128
Census Tract Total 128 82,973 240,589 323,690
162 162.01 3,050 3,050
Census Tract Total 3,050 3,050
163 163.01 144 144
163.02 700 700
Census Tract Total 844 844
201 201.01 33,692 251,209 284,901
201.02 264,551 264,551
Census Tract Total 264,551 33,692 251,209 549,452
202 202.01 133,985 88,358 222,343
202.02 81,110 77,745 158,855
202.03 96,763 16,697 17,820 131,280
Census Tract Total 177,873 150,682 183,923 512,478
203 203.04 8,608 2,475 11,083
Census Tract Total 8,608 2,475 11,083
204 204.01 21,078 268,966 134,010 424,054
Census Tract Total 21,078 268,966 134,010 424,054
205 205.02 9,999 9,999
205.03 11,407 135,356 146,763
Census Tract Total 21,406 135,356 156,762
206 206.01 79,926 79,926
206.02 7,536 144,100 151,636
Census Tract Total 7,536 224,026 231,562
(Continued)
X-11
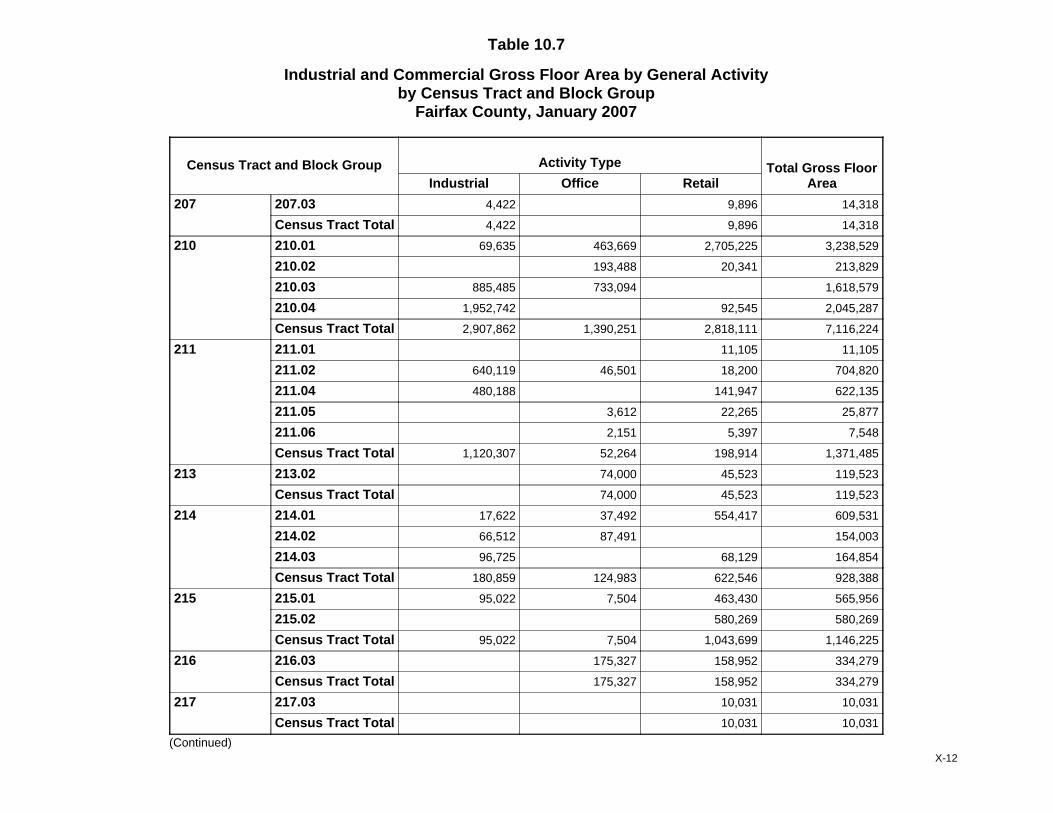
Table 10.7
Industrial and Commercial Gross Floor Area by General Activityby Census Tract and Block Group
Fairfax County, January 2007
Census Tract and Block Group Activity Type Total Gross FloorAreaIndustrial Office Retail
207 207.03 4,422 9,896 14,318
Census Tract Total 4,422 9,896 14,318
210 210.01 69,635 463,669 2,705,225 3,238,529
210.02 193,488 20,341 213,829
210.03 885,485 733,094 1,618,579
210.04 1,952,742 92,545 2,045,287
Census Tract Total 2,907,862 1,390,251 2,818,111 7,116,224
211 211.01 11,105 11,105
211.02 640,119 46,501 18,200 704,820
211.04 480,188 141,947 622,135
211.05 3,612 22,265 25,877
211.06 2,151 5,397 7,548
Census Tract Total 1,120,307 52,264 198,914 1,371,485
213 213.02 74,000 45,523 119,523
Census Tract Total 74,000 45,523 119,523
214 214.01 17,622 37,492 554,417 609,531
214.02 66,512 87,491 154,003
214.03 96,725 68,129 164,854
Census Tract Total 180,859 124,983 622,546 928,388
215 215.01 95,022 7,504 463,430 565,956
215.02 580,269 580,269
Census Tract Total 95,022 7,504 1,043,699 1,146,225
216 216.03 175,327 158,952 334,279
Census Tract Total 175,327 158,952 334,279
217 217.03 10,031 10,031
Census Tract Total 10,031 10,031
(Continued)X-12
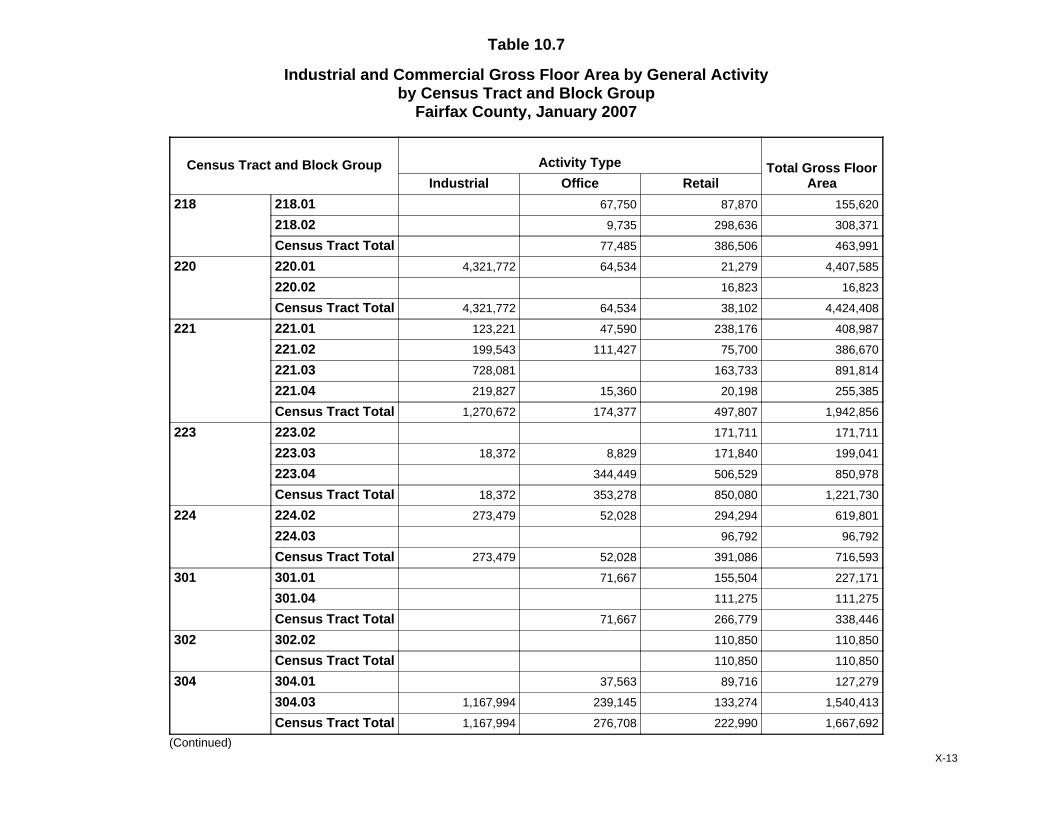
Table 10.7
Industrial and Commercial Gross Floor Area by General Activityby Census Tract and Block Group
Fairfax County, January 2007
Census Tract and Block Group Activity Type Total Gross FloorAreaIndustrial Office Retail
218 218.01 67,750 87,870 155,620
218.02 9,735 298,636 308,371
Census Tract Total 77,485 386,506 463,991
220 220.01 4,321,772 64,534 21,279 4,407,585
220.02 16,823 16,823
Census Tract Total 4,321,772 64,534 38,102 4,424,408
221 221.01 123,221 47,590 238,176 408,987
221.02 199,543 111,427 75,700 386,670
221.03 728,081 163,733 891,814
221.04 219,827 15,360 20,198 255,385
Census Tract Total 1,270,672 174,377 497,807 1,942,856
223 223.02 171,711 171,711
223.03 18,372 8,829 171,840 199,041
223.04 344,449 506,529 850,978
Census Tract Total 18,372 353,278 850,080 1,221,730
224 224.02 273,479 52,028 294,294 619,801
224.03 96,792 96,792
Census Tract Total 273,479 52,028 391,086 716,593
301 301.01 71,667 155,504 227,171
301.04 111,275 111,275
Census Tract Total 71,667 266,779 338,446
302 302.02 110,850 110,850
Census Tract Total 110,850 110,850
304 304.01 37,563 89,716 127,279
304.03 1,167,994 239,145 133,274 1,540,413
Census Tract Total 1,167,994 276,708 222,990 1,667,692
(Continued)X-13
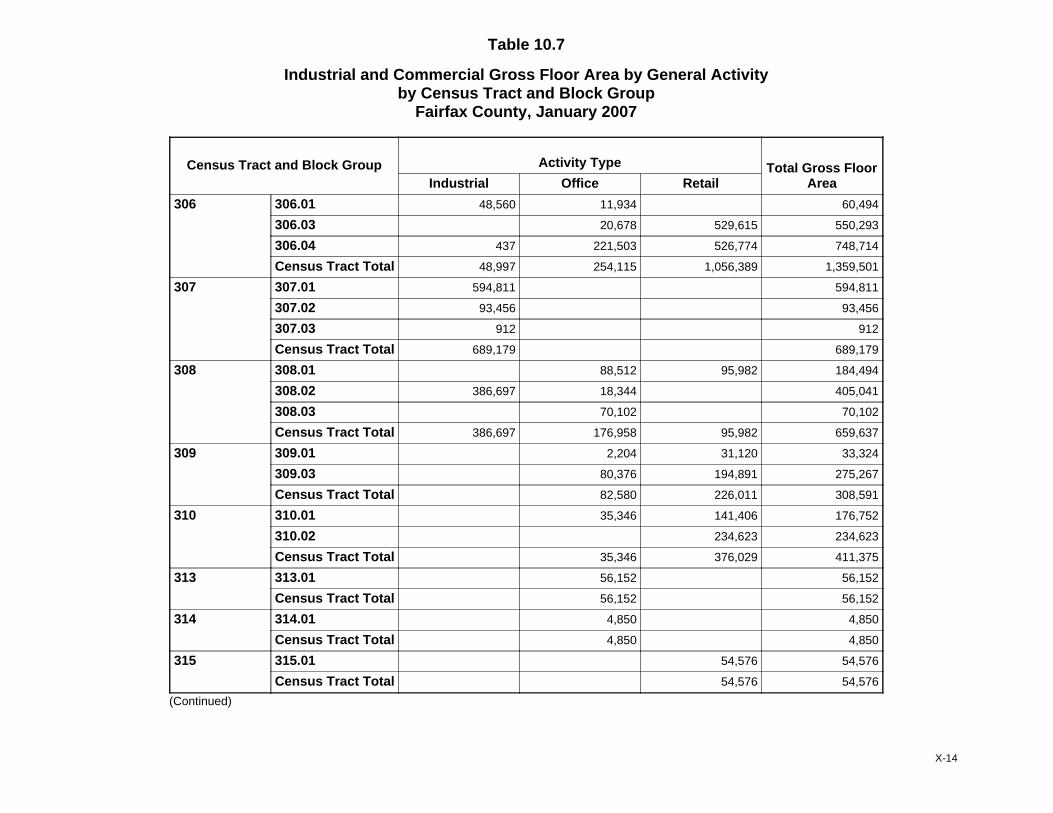
Table 10.7
Industrial and Commercial Gross Floor Area by General Activityby Census Tract and Block Group
Fairfax County, January 2007
Census Tract and Block Group Activity Type Total Gross FloorAreaIndustrial Office Retail
306 306.01 48,560 11,934 60,494
306.03 20,678 529,615 550,293
306.04 437 221,503 526,774 748,714
Census Tract Total 48,997 254,115 1,056,389 1,359,501
307 307.01 594,811 594,811
307.02 93,456 93,456
307.03 912 912
Census Tract Total 689,179 689,179
308 308.01 88,512 95,982 184,494
308.02 386,697 18,344 405,041
308.03 70,102 70,102
Census Tract Total 386,697 176,958 95,982 659,637
309 309.01 2,204 31,120 33,324
309.03 80,376 194,891 275,267
Census Tract Total 82,580 226,011 308,591
310 310.01 35,346 141,406 176,752
310.02 234,623 234,623
Census Tract Total 35,346 376,029 411,375
313 313.01 56,152 56,152
Census Tract Total 56,152 56,152
314 314.01 4,850 4,850
Census Tract Total 4,850 4,850
315 315.01 54,576 54,576
Census Tract Total 54,576 54,576
(Continued)
X-14
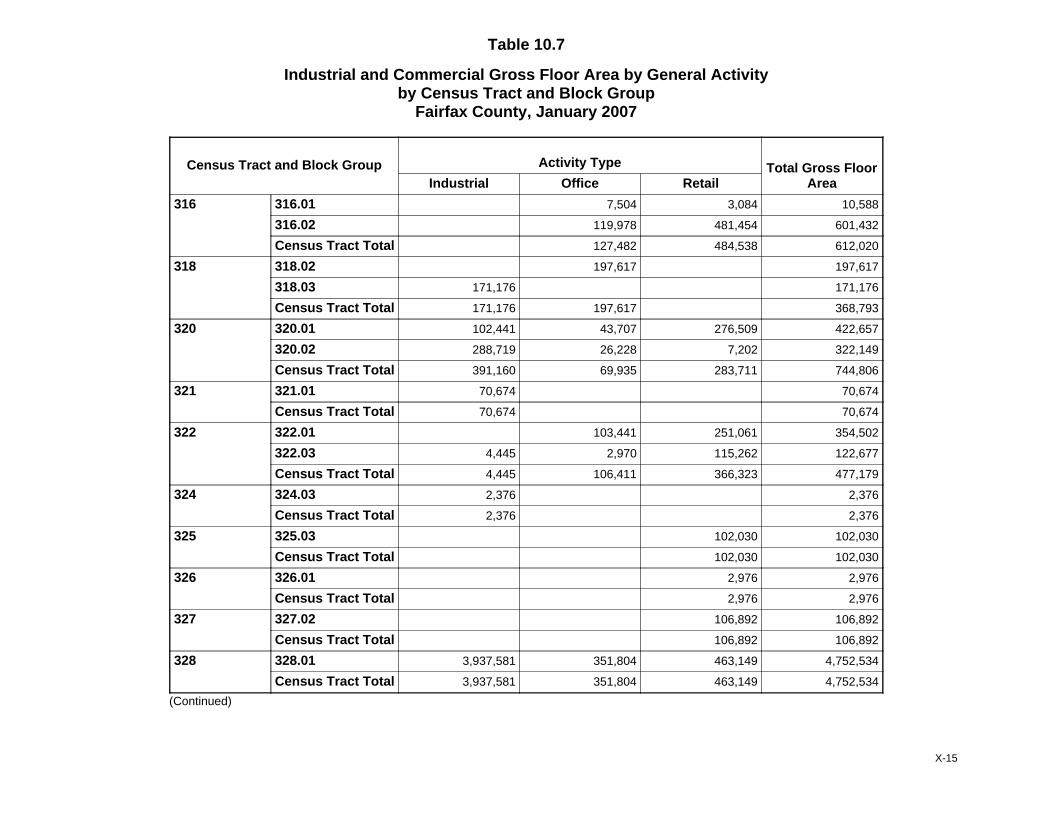
Table 10.7
Industrial and Commercial Gross Floor Area by General Activityby Census Tract and Block Group
Fairfax County, January 2007
Census Tract and Block Group Activity Type Total Gross FloorAreaIndustrial Office Retail
316 316.01 7,504 3,084 10,588
316.02 119,978 481,454 601,432
Census Tract Total 127,482 484,538 612,020
318 318.02 197,617 197,617
318.03 171,176 171,176
Census Tract Total 171,176 197,617 368,793
320 320.01 102,441 43,707 276,509 422,657
320.02 288,719 26,228 7,202 322,149
Census Tract Total 391,160 69,935 283,711 744,806
321 321.01 70,674 70,674
Census Tract Total 70,674 70,674
322 322.01 103,441 251,061 354,502
322.03 4,445 2,970 115,262 122,677
Census Tract Total 4,445 106,411 366,323 477,179
324 324.03 2,376 2,376
Census Tract Total 2,376 2,376
325 325.03 102,030 102,030
Census Tract Total 102,030 102,030
326 326.01 2,976 2,976
Census Tract Total 2,976 2,976
327 327.02 106,892 106,892
Census Tract Total 106,892 106,892
328 328.01 3,937,581 351,804 463,149 4,752,534
Census Tract Total 3,937,581 351,804 463,149 4,752,534
(Continued)
X-15
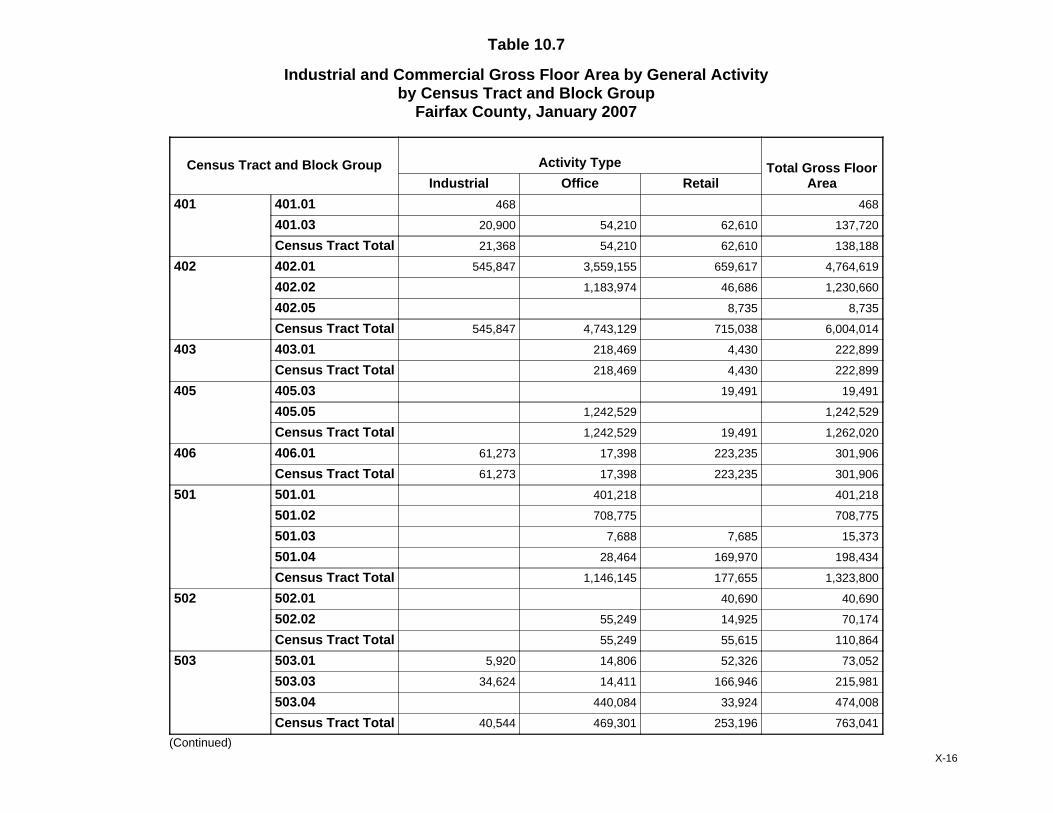
Table 10.7
Industrial and Commercial Gross Floor Area by General Activityby Census Tract and Block Group
Fairfax County, January 2007
Census Tract and Block Group Activity Type Total Gross FloorAreaIndustrial Office Retail
401 401.01 468 468
401.03 20,900 54,210 62,610 137,720
Census Tract Total 21,368 54,210 62,610 138,188
402 402.01 545,847 3,559,155 659,617 4,764,619
402.02 1,183,974 46,686 1,230,660
402.05 8,735 8,735
Census Tract Total 545,847 4,743,129 715,038 6,004,014
403 403.01 218,469 4,430 222,899
Census Tract Total 218,469 4,430 222,899
405 405.03 19,491 19,491
405.05 1,242,529 1,242,529
Census Tract Total 1,242,529 19,491 1,262,020
406 406.01 61,273 17,398 223,235 301,906
Census Tract Total 61,273 17,398 223,235 301,906
501 501.01 401,218 401,218
501.02 708,775 708,775
501.03 7,688 7,685 15,373
501.04 28,464 169,970 198,434
Census Tract Total 1,146,145 177,655 1,323,800
502 502.01 40,690 40,690
502.02 55,249 14,925 70,174
Census Tract Total 55,249 55,615 110,864
503 503.01 5,920 14,806 52,326 73,052
503.03 34,624 14,411 166,946 215,981
503.04 440,084 33,924 474,008
Census Tract Total 40,544 469,301 253,196 763,041
(Continued)X-16
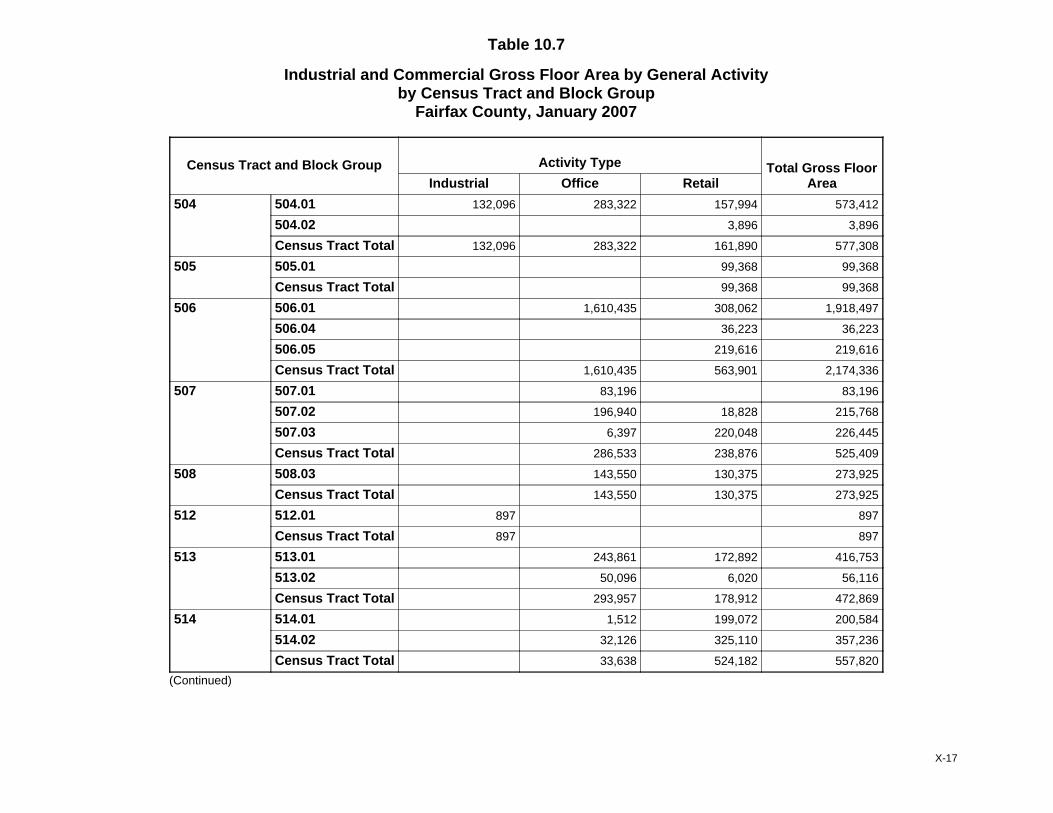
Table 10.7
Industrial and Commercial Gross Floor Area by General Activityby Census Tract and Block Group
Fairfax County, January 2007
Census Tract and Block Group Activity Type Total Gross FloorAreaIndustrial Office Retail
504 504.01 132,096 283,322 157,994 573,412
504.02 3,896 3,896
Census Tract Total 132,096 283,322 161,890 577,308
505 505.01 99,368 99,368
Census Tract Total 99,368 99,368
506 506.01 1,610,435 308,062 1,918,497
506.04 36,223 36,223
506.05 219,616 219,616
Census Tract Total 1,610,435 563,901 2,174,336
507 507.01 83,196 83,196
507.02 196,940 18,828 215,768
507.03 6,397 220,048 226,445
Census Tract Total 286,533 238,876 525,409
508 508.03 143,550 130,375 273,925
Census Tract Total 143,550 130,375 273,925
512 512.01 897 897
Census Tract Total 897 897
513 513.01 243,861 172,892 416,753
513.02 50,096 6,020 56,116
Census Tract Total 293,957 178,912 472,869
514 514.01 1,512 199,072 200,584
514.02 32,126 325,110 357,236
Census Tract Total 33,638 524,182 557,820
(Continued)
X-17
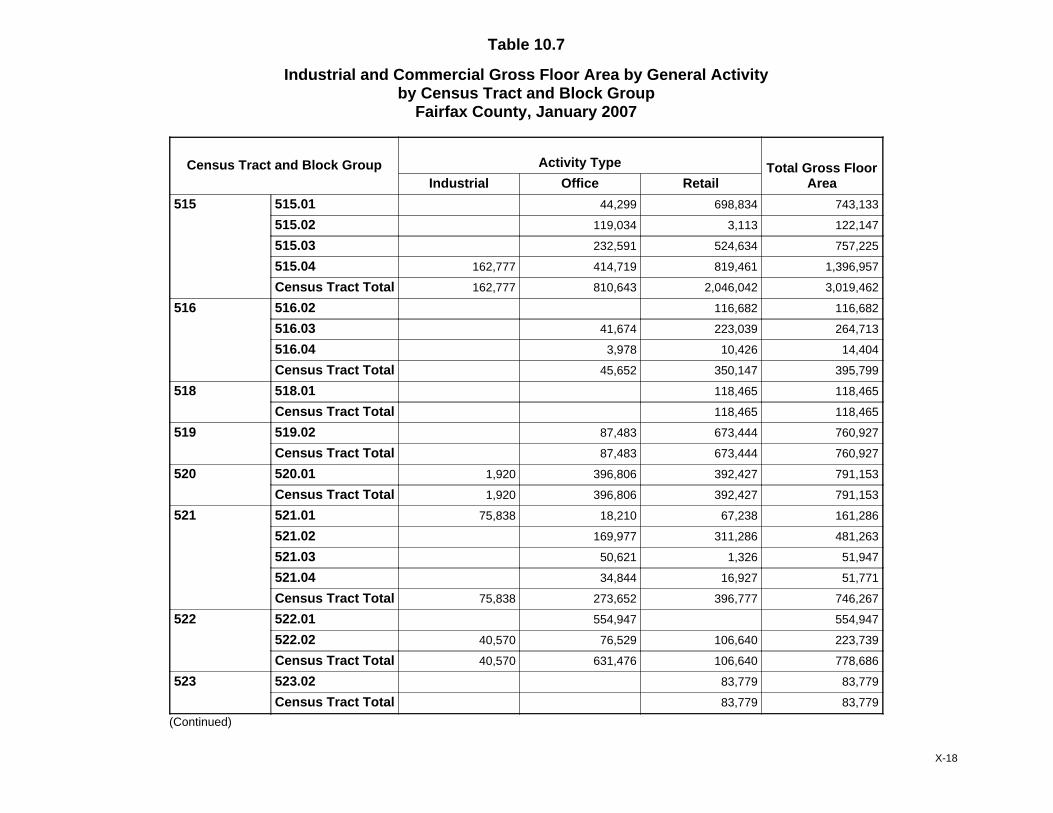
Table 10.7
Industrial and Commercial Gross Floor Area by General Activityby Census Tract and Block Group
Fairfax County, January 2007
Census Tract and Block Group Activity Type Total Gross FloorAreaIndustrial Office Retail
515 515.01 44,299 698,834 743,133
515.02 119,034 3,113 122,147
515.03 232,591 524,634 757,225
515.04 162,777 414,719 819,461 1,396,957
Census Tract Total 162,777 810,643 2,046,042 3,019,462
516 516.02 116,682 116,682
516.03 41,674 223,039 264,713
516.04 3,978 10,426 14,404
Census Tract Total 45,652 350,147 395,799
518 518.01 118,465 118,465
Census Tract Total 118,465 118,465
519 519.02 87,483 673,444 760,927
Census Tract Total 87,483 673,444 760,927
520 520.01 1,920 396,806 392,427 791,153
Census Tract Total 1,920 396,806 392,427 791,153
521 521.01 75,838 18,210 67,238 161,286
521.02 169,977 311,286 481,263
521.03 50,621 1,326 51,947
521.04 34,844 16,927 51,771
Census Tract Total 75,838 273,652 396,777 746,267
522 522.01 554,947 554,947
522.02 40,570 76,529 106,640 223,739
Census Tract Total 40,570 631,476 106,640 778,686
523 523.02 83,779 83,779
Census Tract Total 83,779 83,779
(Continued)
X-18

Table 10.7
Industrial and Commercial Gross Floor Area by General Activityby Census Tract and Block Group
Fairfax County, January 2007
Census Tract and Block Group Activity Type Total Gross FloorAreaIndustrial Office Retail
524 524.04 710,737 710,737
524.05 86,996 20,126 107,122
Census Tract Total 710,737 86,996 20,126 817,859
525 525.01 1,687,587 466,181 540,582 2,694,350
525.02 76,548 626,190 4,828 707,566
525.03 94,936 156,273 251,209
525.04 113,722 113,722
525.05 72,946 72,946
Census Tract Total 1,764,135 1,301,029 774,629 3,839,793
526 526.01 1,371,607 509,865 828,010 2,709,482
526.02 41,856 41,856
526.03 511,000 511,000
Census Tract Total 1,882,607 551,721 828,010 3,262,338
527 527.01 310,508 84,475 164,698 559,681
527.02 8,450 14,660 23,110
Census Tract Total 310,508 92,925 179,358 582,791
528 528.03 68,078 23,436 91,514
528.04 2,968,896 329,352 3,298,248
Census Tract Total 3,036,974 352,788 3,389,762
601 601.02 3,120 3,120
601.03 289,020 289,020
Census Tract Total 292,140 292,140
602 602.01 3,238 3,238
Census Tract Total 3,238 3,238
604 604.02 2,234,127 1,717,256 3,951,383
Census Tract Total 2,234,127 1,717,256 3,951,383
(Continued)X-19
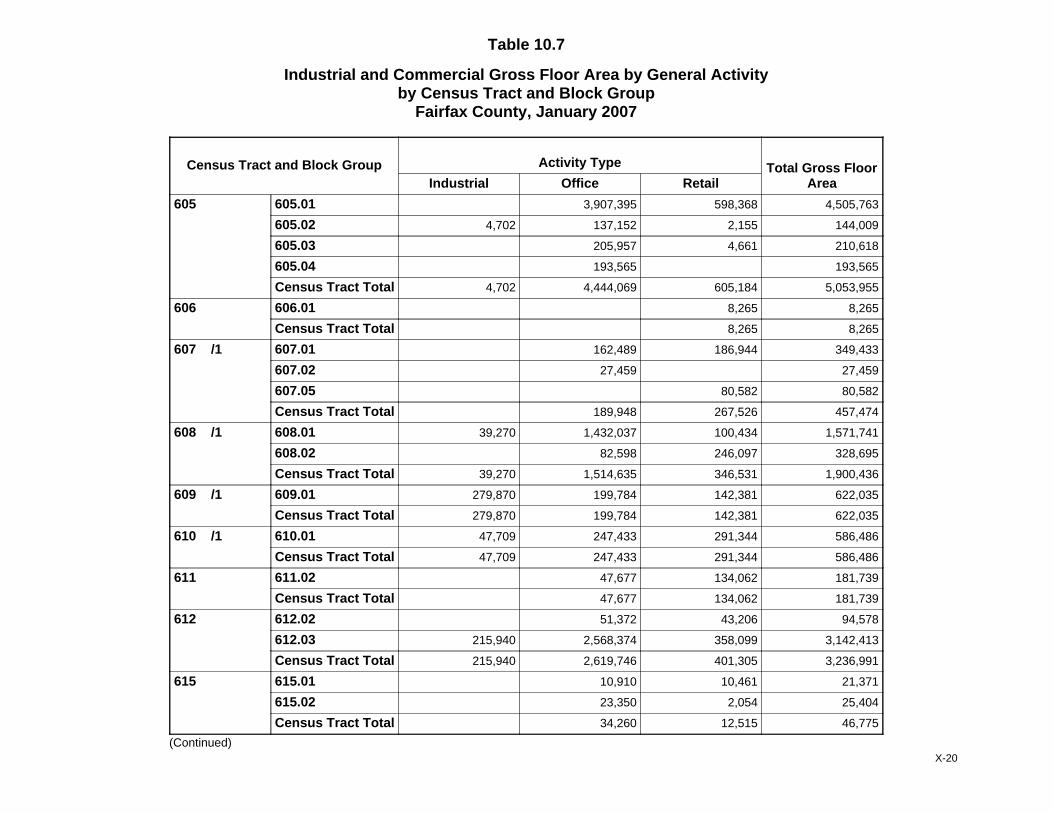
Table 10.7
Industrial and Commercial Gross Floor Area by General Activityby Census Tract and Block Group
Fairfax County, January 2007
Census Tract and Block Group Activity Type Total Gross FloorAreaIndustrial Office Retail
605 605.01 3,907,395 598,368 4,505,763
605.02 4,702 137,152 2,155 144,009
605.03 205,957 4,661 210,618
605.04 193,565 193,565
Census Tract Total 4,702 4,444,069 605,184 5,053,955
606 606.01 8,265 8,265
Census Tract Total 8,265 8,265
607 /1 607.01 162,489 186,944 349,433
607.02 27,459 27,459
607.05 80,582 80,582
Census Tract Total 189,948 267,526 457,474
608 /1 608.01 39,270 1,432,037 100,434 1,571,741
608.02 82,598 246,097 328,695
Census Tract Total 39,270 1,514,635 346,531 1,900,436
609 /1 609.01 279,870 199,784 142,381 622,035
Census Tract Total 279,870 199,784 142,381 622,035
610 /1 610.01 47,709 247,433 291,344 586,486
Census Tract Total 47,709 247,433 291,344 586,486
611 611.02 47,677 134,062 181,739
Census Tract Total 47,677 134,062 181,739
612 612.02 51,372 43,206 94,578
612.03 215,940 2,568,374 358,099 3,142,413
Census Tract Total 215,940 2,619,746 401,305 3,236,991
615 615.01 10,910 10,461 21,371
615.02 23,350 2,054 25,404
Census Tract Total 34,260 12,515 46,775
(Continued)X-20
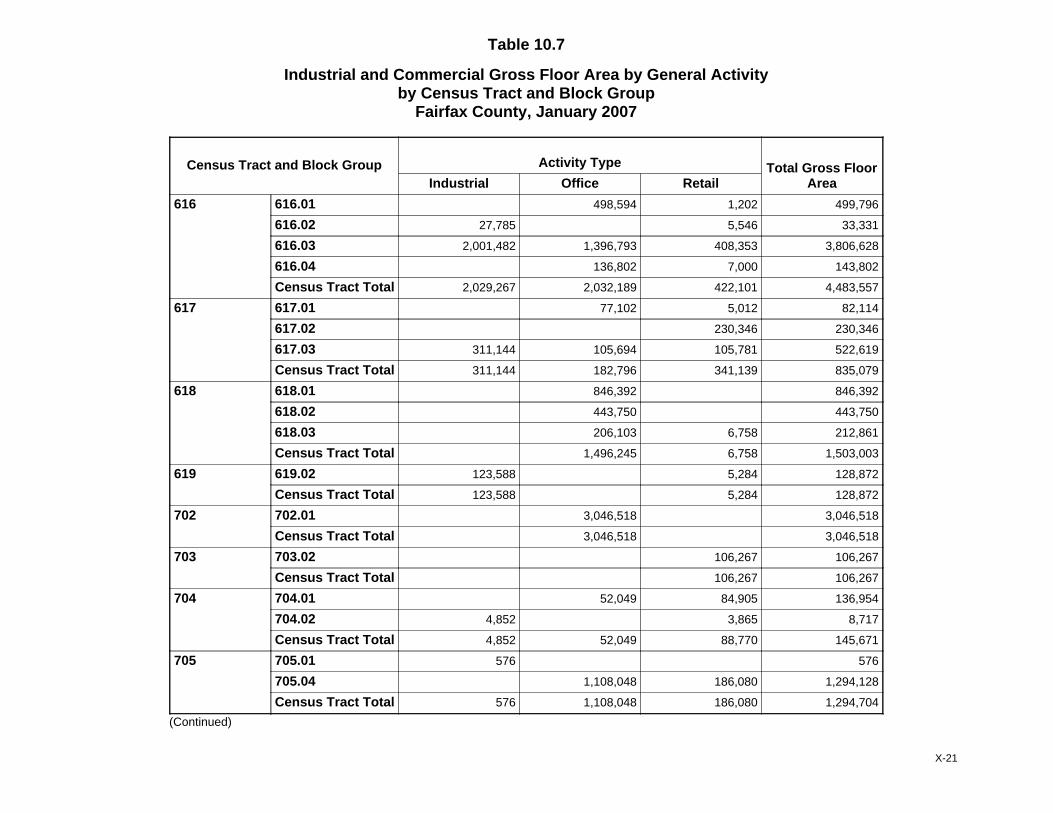
Table 10.7
Industrial and Commercial Gross Floor Area by General Activityby Census Tract and Block Group
Fairfax County, January 2007
Census Tract and Block Group Activity Type Total Gross FloorAreaIndustrial Office Retail
616 616.01 498,594 1,202 499,796
616.02 27,785 5,546 33,331
616.03 2,001,482 1,396,793 408,353 3,806,628
616.04 136,802 7,000 143,802
Census Tract Total 2,029,267 2,032,189 422,101 4,483,557
617 617.01 77,102 5,012 82,114
617.02 230,346 230,346
617.03 311,144 105,694 105,781 522,619
Census Tract Total 311,144 182,796 341,139 835,079
618 618.01 846,392 846,392
618.02 443,750 443,750
618.03 206,103 6,758 212,861
Census Tract Total 1,496,245 6,758 1,503,003
619 619.02 123,588 5,284 128,872
Census Tract Total 123,588 5,284 128,872
702 702.01 3,046,518 3,046,518
Census Tract Total 3,046,518 3,046,518
703 703.02 106,267 106,267
Census Tract Total 106,267 106,267
704 704.01 52,049 84,905 136,954
704.02 4,852 3,865 8,717
Census Tract Total 4,852 52,049 88,770 145,671
705 705.01 576 576
705.04 1,108,048 186,080 1,294,128
Census Tract Total 576 1,108,048 186,080 1,294,704
(Continued)
X-21
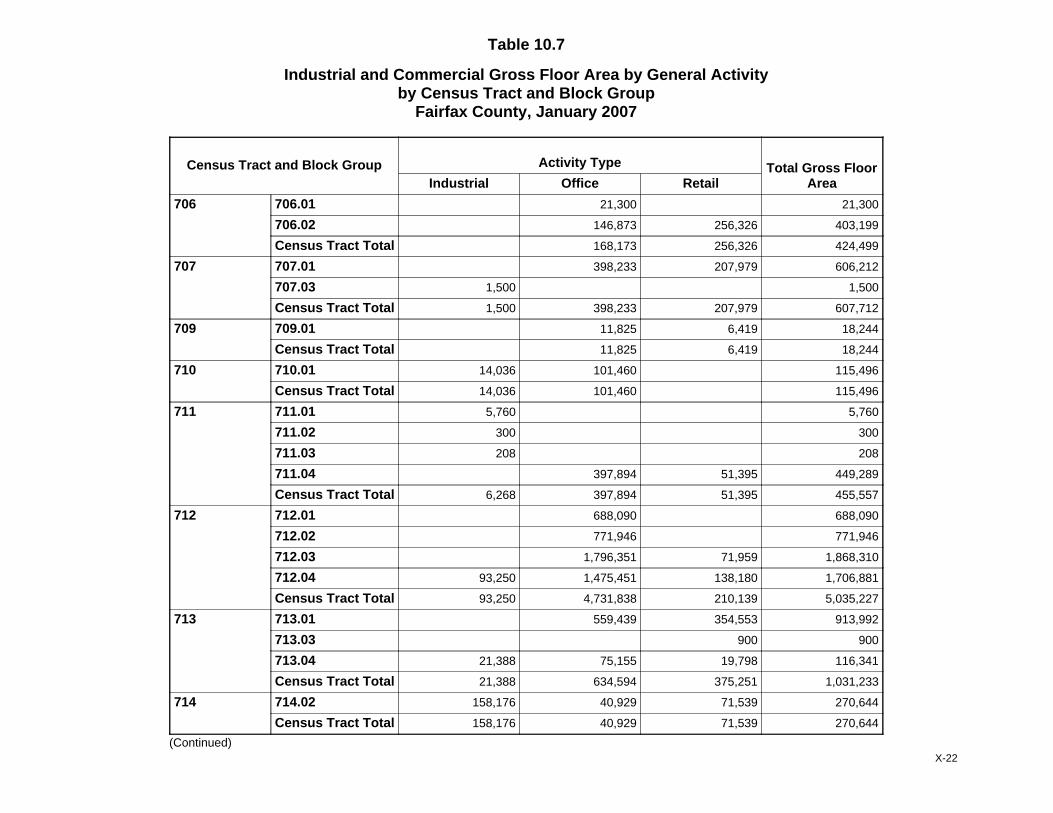
Table 10.7
Industrial and Commercial Gross Floor Area by General Activityby Census Tract and Block Group
Fairfax County, January 2007
Census Tract and Block Group Activity Type Total Gross FloorAreaIndustrial Office Retail
706 706.01 21,300 21,300
706.02 146,873 256,326 403,199
Census Tract Total 168,173 256,326 424,499
707 707.01 398,233 207,979 606,212
707.03 1,500 1,500
Census Tract Total 1,500 398,233 207,979 607,712
709 709.01 11,825 6,419 18,244
Census Tract Total 11,825 6,419 18,244
710 710.01 14,036 101,460 115,496
Census Tract Total 14,036 101,460 115,496
711 711.01 5,760 5,760
711.02 300 300
711.03 208 208
711.04 397,894 51,395 449,289
Census Tract Total 6,268 397,894 51,395 455,557
712 712.01 688,090 688,090
712.02 771,946 771,946
712.03 1,796,351 71,959 1,868,310
712.04 93,250 1,475,451 138,180 1,706,881
Census Tract Total 93,250 4,731,838 210,139 5,035,227
713 713.01 559,439 354,553 913,992
713.03 900 900
713.04 21,388 75,155 19,798 116,341
Census Tract Total 21,388 634,594 375,251 1,031,233
714 714.02 158,176 40,929 71,539 270,644
Census Tract Total 158,176 40,929 71,539 270,644
(Continued)X-22
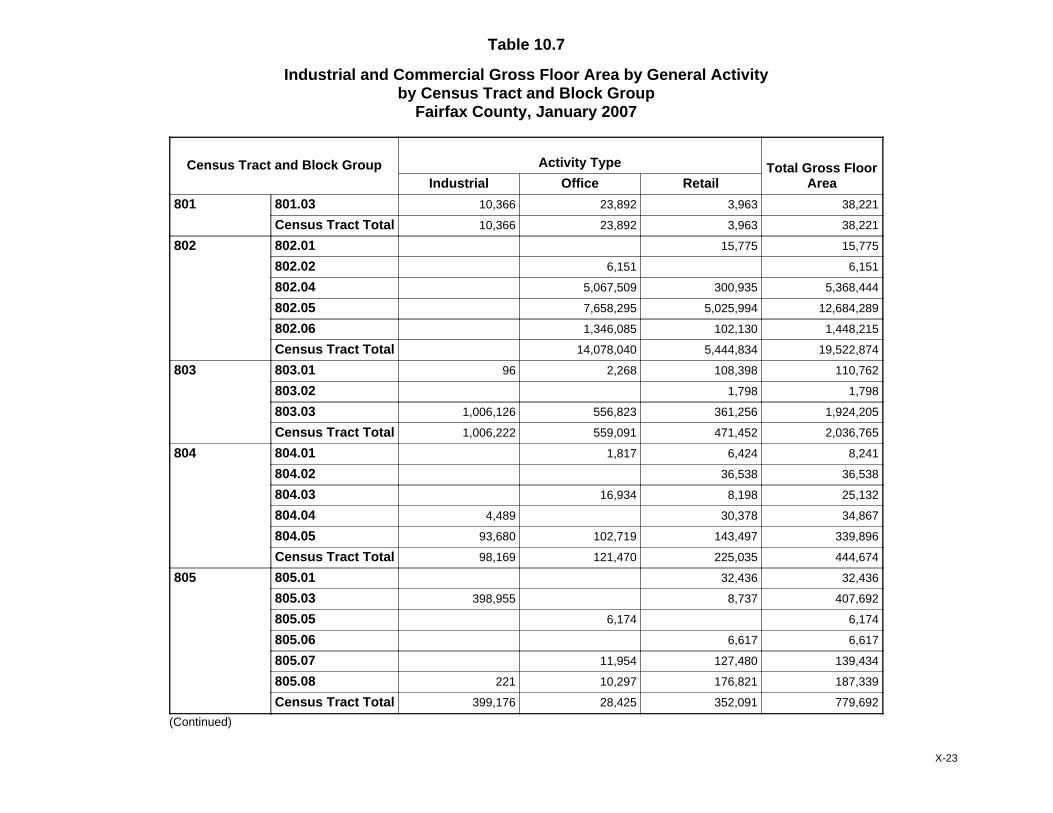
Table 10.7
Industrial and Commercial Gross Floor Area by General Activityby Census Tract and Block Group
Fairfax County, January 2007
Census Tract and Block Group Activity Type Total Gross FloorAreaIndustrial Office Retail
801 801.03 10,366 23,892 3,963 38,221
Census Tract Total 10,366 23,892 3,963 38,221
802 802.01 15,775 15,775
802.02 6,151 6,151
802.04 5,067,509 300,935 5,368,444
802.05 7,658,295 5,025,994 12,684,289
802.06 1,346,085 102,130 1,448,215
Census Tract Total 14,078,040 5,444,834 19,522,874
803 803.01 96 2,268 108,398 110,762
803.02 1,798 1,798
803.03 1,006,126 556,823 361,256 1,924,205
Census Tract Total 1,006,222 559,091 471,452 2,036,765
804 804.01 1,817 6,424 8,241
804.02 36,538 36,538
804.03 16,934 8,198 25,132
804.04 4,489 30,378 34,867
804.05 93,680 102,719 143,497 339,896
Census Tract Total 98,169 121,470 225,035 444,674
805 805.01 32,436 32,436
805.03 398,955 8,737 407,692
805.05 6,174 6,174
805.06 6,617 6,617
805.07 11,954 127,480 139,434
805.08 221 10,297 176,821 187,339
Census Tract Total 399,176 28,425 352,091 779,692
(Continued)
X-23
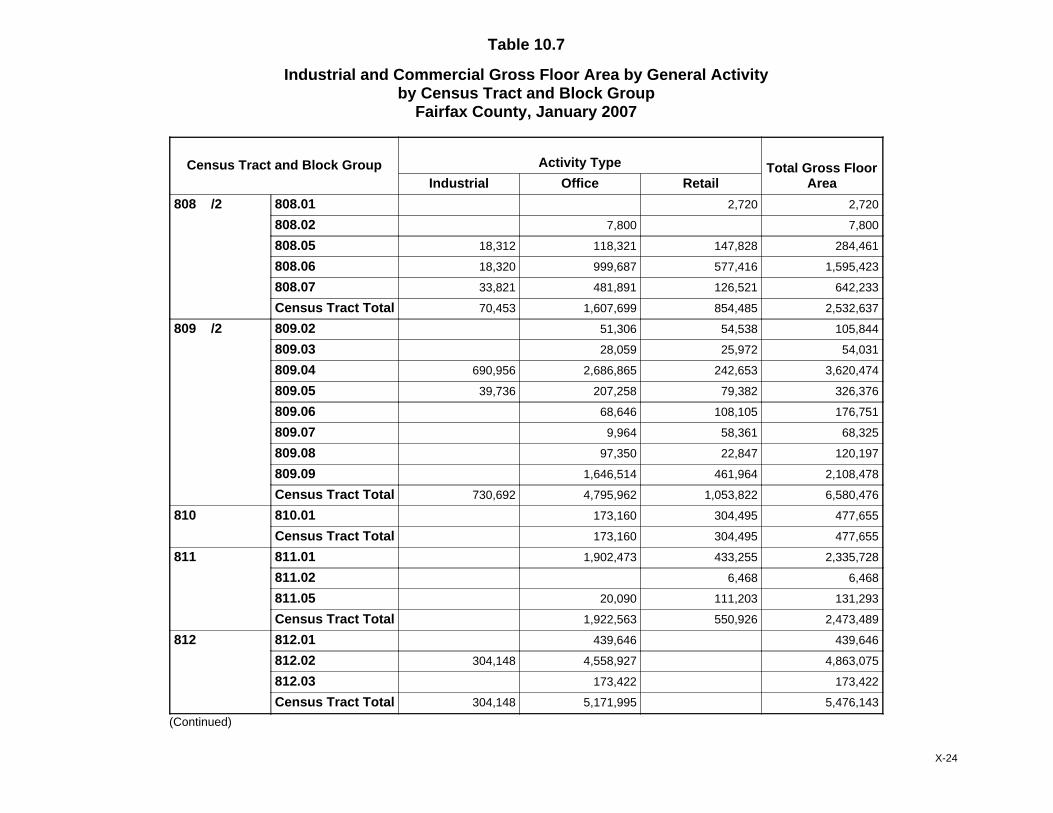
Table 10.7
Industrial and Commercial Gross Floor Area by General Activityby Census Tract and Block Group
Fairfax County, January 2007
Census Tract and Block Group Activity Type Total Gross FloorAreaIndustrial Office Retail
808 /2 808.01 2,720 2,720
808.02 7,800 7,800
808.05 18,312 118,321 147,828 284,461
808.06 18,320 999,687 577,416 1,595,423
808.07 33,821 481,891 126,521 642,233
Census Tract Total 70,453 1,607,699 854,485 2,532,637
809 /2 809.02 51,306 54,538 105,844
809.03 28,059 25,972 54,031
809.04 690,956 2,686,865 242,653 3,620,474
809.05 39,736 207,258 79,382 326,376
809.06 68,646 108,105 176,751
809.07 9,964 58,361 68,325
809.08 97,350 22,847 120,197
809.09 1,646,514 461,964 2,108,478
Census Tract Total 730,692 4,795,962 1,053,822 6,580,476
810 810.01 173,160 304,495 477,655
Census Tract Total 173,160 304,495 477,655
811 811.01 1,902,473 433,255 2,335,728
811.02 6,468 6,468
811.05 20,090 111,203 131,293
Census Tract Total 1,922,563 550,926 2,473,489
812 812.01 439,646 439,646
812.02 304,148 4,558,927 4,863,075
812.03 173,422 173,422
Census Tract Total 304,148 5,171,995 5,476,143
(Continued)
X-24

Table 10.7
Industrial and Commercial Gross Floor Area by General Activityby Census Tract and Block Group
Fairfax County, January 2007
Census Tract and Block Group Activity Type Total Gross FloorAreaIndustrial Office Retail
814 814.01 3,055 122,570 125,625
814.02 5,114 5,114
Census Tract Total 3,055 127,684 130,739
819 819.01 72,959 72,959
819.02 65,587 2,395,142 10,986 2,471,715
Census Tract Total 65,587 2,395,142 83,945 2,544,674
820 820.04 15,704 15,704
Census Tract Total 15,704 15,704
821 821.01 2,295 2,295
821.02 80,101 45,950 126,051
Census Tract Total 80,101 48,245 128,346
822 822.01 17,650 3,586,627 1,119,500 4,723,777
822.02 321,551 3,220,523 181,163 3,723,237
822.03 9,730 9,730
Census Tract Total 339,201 6,816,880 1,300,663 8,456,744
823 823.03 1,689,277 380,871 2,070,148
823.05 7,785 7,785
Census Tract Total 1,689,277 388,656 2,077,933
824 824.01 1,702 2,621,268 2,622,970
Census Tract Total 1,702 2,621,268 2,622,970
825 825.01 88,300 85,018 5,424 178,742
825.02 27,668 221,398 249,066
825.08 2,385,976 5,883,219 1,232,481 9,501,676
Census Tract Total 2,474,276 5,995,905 1,459,303 9,929,484
(Continued)
X-25
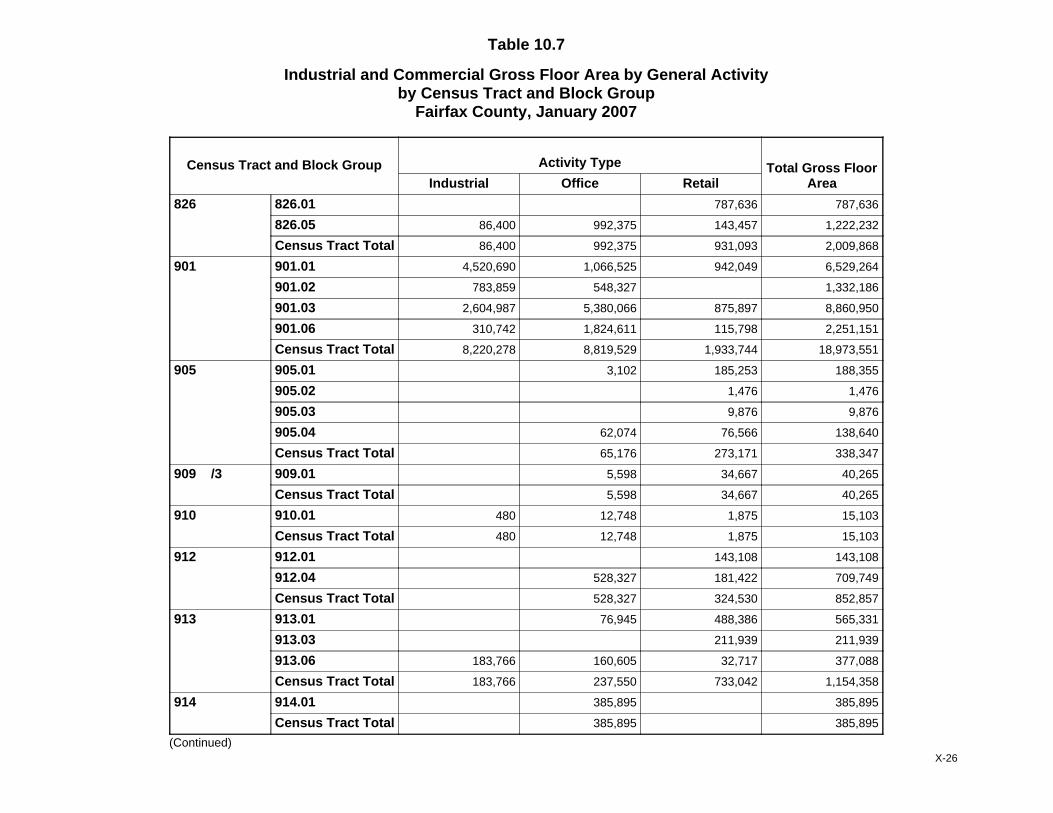
Table 10.7
Industrial and Commercial Gross Floor Area by General Activityby Census Tract and Block Group
Fairfax County, January 2007
Census Tract and Block Group Activity Type Total Gross FloorAreaIndustrial Office Retail
826 826.01 787,636 787,636
826.05 86,400 992,375 143,457 1,222,232
Census Tract Total 86,400 992,375 931,093 2,009,868
901 901.01 4,520,690 1,066,525 942,049 6,529,264
901.02 783,859 548,327 1,332,186
901.03 2,604,987 5,380,066 875,897 8,860,950
901.06 310,742 1,824,611 115,798 2,251,151
Census Tract Total 8,220,278 8,819,529 1,933,744 18,973,551
905 905.01 3,102 185,253 188,355
905.02 1,476 1,476
905.03 9,876 9,876
905.04 62,074 76,566 138,640
Census Tract Total 65,176 273,171 338,347
909 /3 909.01 5,598 34,667 40,265
Census Tract Total 5,598 34,667 40,265
910 910.01 480 12,748 1,875 15,103
Census Tract Total 480 12,748 1,875 15,103
912 912.01 143,108 143,108
912.04 528,327 181,422 709,749
Census Tract Total 528,327 324,530 852,857
913 913.01 76,945 488,386 565,331
913.03 211,939 211,939
913.06 183,766 160,605 32,717 377,088
Census Tract Total 183,766 237,550 733,042 1,154,358
914 914.01 385,895 385,895
Census Tract Total 385,895 385,895
(Continued)X-26
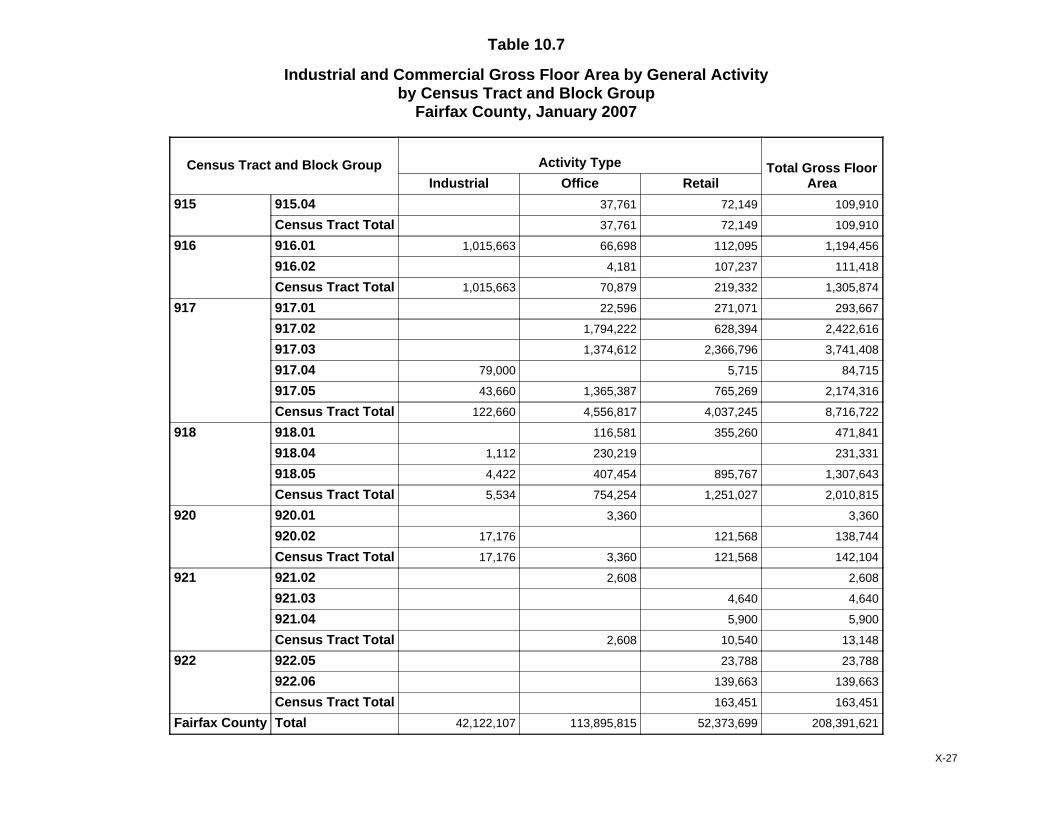
Table 10.7
Industrial and Commercial Gross Floor Area by General Activityby Census Tract and Block Group
Fairfax County, January 2007
Census Tract and Block Group Activity Type Total Gross FloorAreaIndustrial Office Retail
915 915.04 37,761 72,149 109,910
Census Tract Total 37,761 72,149 109,910
916 916.01 1,015,663 66,698 112,095 1,194,456
916.02 4,181 107,237 111,418
Census Tract Total 1,015,663 70,879 219,332 1,305,874
917 917.01 22,596 271,071 293,667
917.02 1,794,222 628,394 2,422,616
917.03 1,374,612 2,366,796 3,741,408
917.04 79,000 5,715 84,715
917.05 43,660 1,365,387 765,269 2,174,316
Census Tract Total 122,660 4,556,817 4,037,245 8,716,722
918 918.01 116,581 355,260 471,841
918.04 1,112 230,219 231,331
918.05 4,422 407,454 895,767 1,307,643
Census Tract Total 5,534 754,254 1,251,027 2,010,815
920 920.01 3,360 3,360
920.02 17,176 121,568 138,744
Census Tract Total 17,176 3,360 121,568 142,104
921 921.02 2,608 2,608
921.03 4,640 4,640
921.04 5,900 5,900
Census Tract Total 2,608 10,540 13,148
922 922.05 23,788 23,788
922.06 139,663 139,663
Census Tract Total 163,451 163,451
Fairfax County Total 42,122,107 113,895,815 52,373,699 208,391,621
X-27

Source: Fairfax County Department of Systems Management for Human Services, 2007
Note: All data in square feet. All census tracts in Fairfax County begin with thenumber 4. To conserve space, the leading 4 is dropped from
the census tract name in the information contained in this table. Countywide totals may vary by table depending on how well the
geographic layer aligns with actual county boundaries.
1/ Comprises part of the Town of Vienna.
2/ Comprises part of the Town of Herndon.
3/ Town of Clifton.
X-28

To request this information in an alternate format, call 703-324-5438 or TTY: 711 (Virginia Relay.)
A Fairfax County, Va., publication