delivering major projects in government: a briefing for ... · william rollo and annie parsons, ......
TRANSCRIPT

Reportby the Comptroller and Auditor General
Cross-government
Delivering major projects in government: a briefing for the Committee of Public Accounts
HC 713 SESSION 2015-16 6 JANUARY 2016

Our vision is to help the nation spend wisely.
Our public audit perspective helps Parliament hold government to account and improve public services.
The National Audit Office scrutinises public spending for Parliament and is independent of government. The Comptroller and Auditor General (C&AG), Sir Amyas Morse KCB, is an Officer of the House of Commons and leads the NAO, which employs some 810 people. The C&AG certifies the accounts of all government departments and many other public sector bodies. He has statutory authority to examine and report to Parliament on whether departments and the bodies they fund have used their resources efficiently, effectively, and with economy. Our studies evaluate the value for money of public spending, nationally and locally. Our recommendations and reports on good practice help government improve public services, and our work led to audited savings of £1.15 billion in 2014.

Report by the Comptroller and Auditor General
Ordered by the House of Commons to be printed on 5 January 2016
This report has been prepared under Section 6 of the National Audit Act 1983 for presentation to the House of Commons in accordance with Section 9 of the Act
Sir Amyas Morse KCB Comptroller and Auditor General National Audit Office
22 December 2015
HC 713 | £10.00
Cross-government
Delivering major projects in government: a briefing for the Committee of Public Accounts

This report summarises key issues for the Committee of Public Accounts to consider when it examines major projects and programmes.
© National Audit Office 2016
The material featured in this document is subject to National Audit Office (NAO) copyright. The material may be copied or reproduced for non-commercial purposes only, namely reproduction for research, private study or for limited internal circulation within an organisation for the purpose of review.
Copying for non-commercial purposes is subject to the material being accompanied by a sufficient acknowledgement, reproduced accurately, and not being used in a misleading context. To reproduce NAO copyright material for any other use, you must contact [email protected]. Please tell us who you are, the organisation you represent (if any) and how and why you wish to use our material. Please include your full contact details: name, address, telephone number and email.
Please note that the material featured in this document may not be reproduced for commercial gain without the NAO’s express and direct permission and that the NAO reserves its right to pursue copyright infringement proceedings against individuals or companies who reproduce material for commercial gain without our permission.
Links to external websites were valid at the time of publication of this report. The National Audit Office is not responsible for the future validity of the links.
10890 01/16 NAO

The National Audit Office study team consisted of: Sandy Gordon, Joanna Lewis, William Rollo and Annie Parsons, under the direction of Geraldine Barker.
This report can be found on the National Audit Office website at www.nao.org.uk
For further information about the National Audit Office please contact:
National Audit Office Press Office 157–197 Buckingham Palace Road Victoria London SW1W 9SP
Tel: 020 7798 7400
Enquiries: www.nao.org.uk/contact-us
Website: www.nao.org.uk
Twitter: @NAOorguk
Contents
Key facts 4
Summary 5
Part OneThe challenge of delivering projects in government 10
Part TwoRecent performance 20
Part ThreeImproving performance 29
Appendix OneOur audit approach 36
Appendix TwoOur evidence base 38
Appendix ThreeNational Audit Office and Committee of Public Accounts reports referenced in the report 40
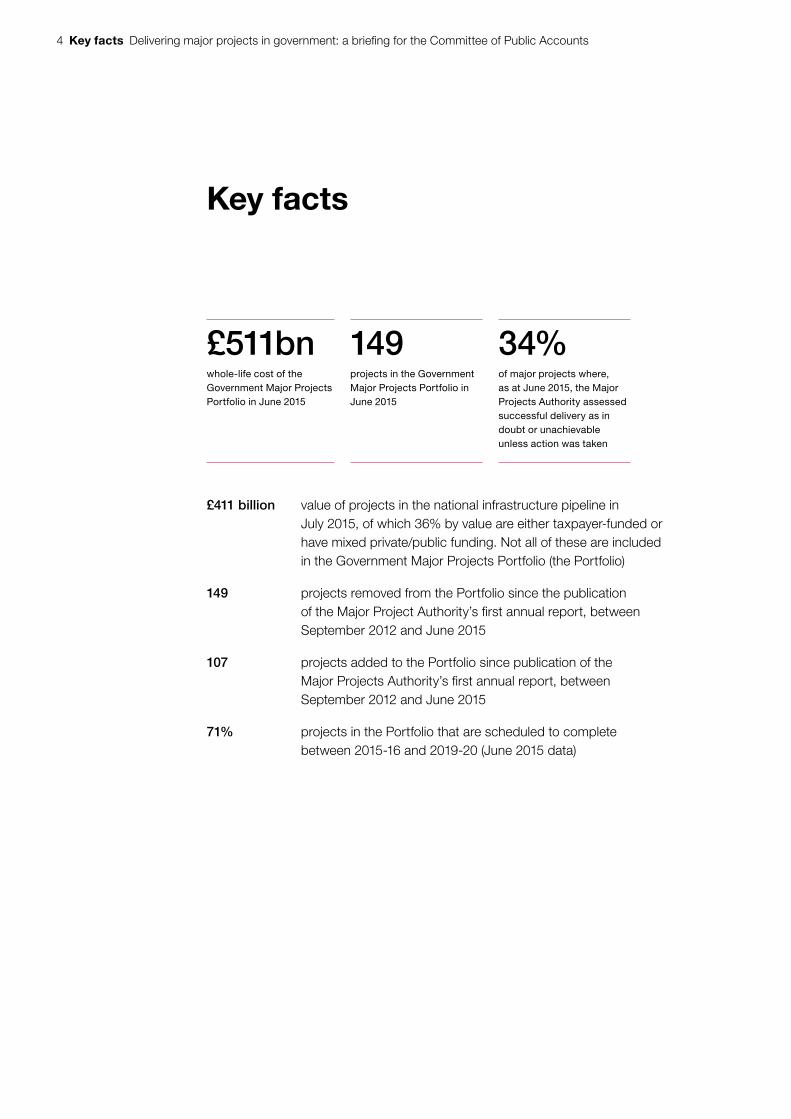
4 Key facts Delivering major projects in government: a briefing for the Committee of Public Accounts
Key facts
£511bnwhole-life cost of the Government Major Projects Portfolio in June 2015
149projects in the Government Major Projects Portfolio in June 2015
34%of major projects where, as at June 2015, the Major Projects Authority assessed successful delivery as in doubt or unachievable unless action was taken
£411 billion value of projects in the national infrastructure pipeline in July 2015, of which 36% by value are either taxpayer-funded or have mixed private/public funding. Not all of these are included in the Government Major Projects Portfolio (the Portfolio)
149 projects removed from the Portfolio since the publication of the Major Project Authority’s fi rst annual report, between September 2012 and June 2015
107 projects added to the Portfolio since publication of the Major Projects Authority’s fi rst annual report, between September 2012 and June 2015
71% projects in the Portfolio that are scheduled to complete between 2015-16 and 2019-20 (June 2015 data)

Delivering major projects in government: a briefing for the Committee of Public Accounts Summary 5
Summary
1 It is not possible to estimate with any degree of certainty how much of the government’s business is delivered through projects. The Government Major Projects Portfolio (the Portfolio), which includes central government’s biggest and riskiest projects, had an estimated whole-life value of £511 billion in June 2015. This report focuses mainly on those projects. Other bodies are involved in the delivery of projects for government. Quantifying public sector project delivery outside the Portfolio is not possible, but:
• capital spend estimates suggest there may be nearly twice as much spend on capital projects outside the Portfolio, in 2015-16, including all devolved and some local government spend, that of arm’s-length bodies,1 and departmental spend on projects that are not included in the Portfolio; and
• the national infrastructure plan in July 2015 included infrastructure projects costing an estimated £411 billion from 2015-16, of which 36% by value are either taxpayer-funded or have mixed private/public funding, some of which are not included in the Portfolio.
2 Government projects play a crucial role in delivering strategic objectives such as defence capability, new infrastructure and improving the efficiency of public services. Traditionally, infrastructure projects attract much attention, but projects to transform or change the way that public services are delivered or accessed are of increasing importance. For example, 95 out of 149 projects in the Portfolio in June 2015 were transformation, ICT or service delivery projects.
1 An arm’s-length body is an organisation that delivers a public service, is not a ministerial government department and which operates to a greater or lesser extent at a distance from ministers. The term can include non-departmental public bodies (NDPBs), executive agencies, non-ministerial departments, public corporations, NHS bodies and inspectorates.
6 Summary Delivering major projects in government: a briefing for the Committee of Public Accounts
3 There are a number of challenges in delivering government projects including:
• timescales, which can arise either from being particularly long or being overly ambitious. Four of the projects in the Portfolio are expected to take more than 30 years, making it difficult to manage continuity and making them more likely to be subject to external changes in their lifetime. Conversely, transformation projects can suffer from setting short deadlines given the outcomes they are trying to achieve, as shown in the early history of Universal Credit;
• the size of individual programmes: for example, Crossrail is reputed to be the largest infrastructure project currently under construction in Europe;
• the ambition and complexity of projects that aim to achieve multiple policy objectives and that cross departmental boundaries; and
• the volume of projects to be delivered by individual departments and collectively by government: for example, 71% of the projects in the Portfolio are to be delivered by 2019-20.
4 Given the scale, importance and complexity of government projects, successful delivery is key to providing value for money. However, the track record in delivering government projects successfully has been poor. In the last Parliament, while we reported on improvements in the way aspects of programmes in some departments were managed, we also reported regularly on project failures and on ongoing projects that were experiencing considerable difficulties. We and the Committee of Public Accounts identified a number of recurring issues across departments that were contributing to poor performance:
• an absence of portfolio management at both departmental and government level;
• lack of clear, consistent data with which to measure performance;
• poor early planning;
• lack of capacity and capability to undertake a growing number of projects; and
• a lack of clear accountability for leadership of a project.
5 Over the years, successive governments have tried to improve project delivery. These initiatives gathered pace during the last Parliament with the establishment of the Major Projects Authority (the Authority; now the Infrastructure and Projects Authority). This briefing gives an overview of:
• key trends in the performance of project delivery in government;
• progress that central bodies and departments have made in addressing the underlying issues listed in paragraph 4; and
• key challenges in improving project delivery in this parliament.

Delivering major projects in government: a briefing for the Committee of Public Accounts Summary 7
Key findings
6 There have been a number of welcome developments to address the issues identified by us and the Committee of Public Accounts. These include:
• improvements to accountability with greater clarity about the roles of senior responsible owners (paragraphs 3.15 to 3.16);
• investment by the Authority and departments to improve the capability of staff to deliver major projects, with departments reporting to us that they are seeing benefits from these initiatives (paragraphs 3.1 to 3.8);
• increased assurance and recognition of the role that assurance plays in improving project delivery (paragraphs 3.9 to 3.12); and
• initiatives such as one-day workshops before HM Treasury approval to prevent departments from getting locked into solutions too early (paragraphs 3.13 to 3.14).
7 However, challenges remain and new challenges have emerged which could undermine or lessen the impact of these initiatives. For example, turnover of senior responsible owners has been high, with only 4 of the 73 programmes that had been in the Portfolio for 4 years having had a single senior responsible owner during that time (paragraphs 3.17 to 3.18). Likewise, there are still concerns around shortages of skills in specific areas such as risk management and behaviour change, which is worrying given the volume of transformation projects being undertaken (paragraph 3.4).
8 It is too soon to see the impact of some initiatives. For others, the impact seems to be variable.
• In some cases, changes have only been introduced relatively recently, as in the case of the one-day workshops prior to approval.
• In the case of assurance, the Authority has not yet established a link between review recommendations and project performance. Our earlier reports showed that departments’ responses to assurance recommendations varied, being positive on Thameslink and Crossrail, but slow in the early stages of High Speed 2 and Universal Credit, for example (paragraphs 3.11 to 3.12).
9 The Authority does not publish full information on the size and cost of the Portfolio. The published whole-life cost is lower than the total cost because the Cabinet’s transparency policy exempts some data from disclosure. However, both the aggregate and disclosed costs were higher in 2015 than in 2012. This is largely due to changes to the composition of the Portfolio, more of the costs being disclosed, the inclusion of costs previously unknown or uncertain and changes in methodology. There is still uncertainty about costs and it is reasonable to expect that the value of the Portfolio will change further (paragraphs 2.4 to 2.6 and paragraph 2.11).

8 Summary Delivering major projects in government: a briefing for the Committee of Public Accounts
10 Without reliable and consistent measures of project success, it is difficult to state whether performance is improving. Our previous reports highlighted progress on making information about major projects transparent in the Authority’s annual report. The most recent annual report gives a more complete picture, but there are still a number of issues which make it difficult to form conclusions about trends in performance across the Portfolio. These include: the amount of turnover in the Portfolio; the limited data published by departments; inconsistent reporting of costs, with some departments reporting costs in real terms and some in nominal terms, or others using different index years; and because there is no systematic monitoring of benefit realisation (paragraphs 2.1 to 2.3, 2.6 and 2.7, 2.17 to 2.19).
11 However, delivery confidence, which the Authority does measure, shows a mixed picture with high risks to delivery in the next 5 years. The number of projects where successful delivery was in doubt or unachievable unless action was taken (rated red and amber-red) has increased since 2012 as more risky projects have entered the Portfolio. These ratings reflect uncertainty and risk as well as the performance of projects. Uncertainty reduces through the project lifecycle, but our analysis shows that not all project ratings improve over time. Of 56 projects which remained on the Portfolio from 2012 to 2015, 17 had red or amber-red ratings in June 2015 compared with 12 in 2012, although the number of projects considered highly likely to deliver on time and on budget (rated green or amber-green) also increased from 16 in 2012 to 25 in 2015. Of particular concern is that 35% of projects due to deliver in the next 5 years are rated as red or amber-red (paragraphs 2.12 to 2.16).
12 This is worrying given the number of projects to be delivered within this Parliament, and the large proportion of these which are transformation projects. Our report on lessons learnt from welfare reform commented that the Department for Work & Pensions took on an unprecedented number of reforms, and any large portfolio was likely to experience problems. Nearly 80% of the Portfolio projects due to be delivered by 2019-20 are to either transform or change the way that services are delivered or accessed. We commented in our briefing note on Lessons for major service transformation that transformation programmes can present the greatest risk of failure and that there is a need to balance ambition and realism in setting goals. For instance, the Better Care Fund, which is within the Department of Health’s portfolio, was a challenging initiative which ministers paused and redesigned after the early planning and preparations did not match its scale of ambition (paragraphs 1.6, 1.11 and 1.12).
Delivering major projects in government: a briefing for the Committee of Public Accounts Summary 9
13 Moreover, progress in improving portfolio management is disappointing. There is increased assurance through the Portfolio and other central departments have an increased role in assuring, approving and improving quality of delivery. But an effective mechanism still needs to be developed for prioritising projects across government or judging whether individual departments have the capacity and capability to deliver them. We have reported in the past on the difficulties caused for government projects by unrealistic expectations and over-optimism. The National Infrastructure Commission will make recommendations about future priorities for infrastructure. But there is also a need to prioritise transformation projects where, as for infrastructure, the impact of change may be felt in other parts of the system or on other projects (paragraphs 1.6 and 1.8 to 1.10).
Concluding comments
14 It is welcome that the Authority and departments have taken so many positive steps to develop capability and provide greater assurance and it is clear that the Authority has carried out the activities that it was established to do. However, it has not set out clearly the outcomes those activities were designed to achieve, or how it would measure success. If its purpose was to improve the success rate of project delivery, it cannot yet prove that it has done so. It is also a cause of concern that so many projects are due to be delivered within this Parliament but have been initiated without any process to assess whether such a scale of delivery is achievable across government. Many of these predate the new arrangements for testing that early planning has been robust.
15 The three key challenges for the Authority and departments during this Parliament are to:
• prevent departments making firm commitments on cost and timescales for delivery before their plans have been properly tested;
• develop an effective mechanism whereby all major projects are prioritised according to strategic importance and capability is deployed to priority areas; and
• put in place the systems and data which allow proper performance measurement.

10 Part One Delivering major projects in government: a briefing for the Committee of Public Accounts
Part One
The challenge of delivering projects in government
1.1 The government implements many of its objectives through projects. The Government’s Major Projects Portfolio (the Portfolio), is made up of the projects that require HM Treasury approval, reflecting their size, risk and impact (Figure 1). In June 2015, the Portfolio’s 149 projects had a combined value of £511 billion. These consisted mainly of government transformation and service delivery projects, ICT projects and infrastructure and construction projects. The government funds most of the projects (£392 billion), with the remainder funded by consumers or business (£119 billion). Most of the value of the latter is made up of Department of Energy & Climate Change projects (£99 billion) funded largely through consumer levies. Departments planned to spend £25 billion on the projects in the Portfolio in 2015-16.
Figure 1There are four main types of project in the Portfolio
Category Number of projects as of June 2015
Whole-life cost as of June 2015
Characteristic
Government transformation and service delivery projects
55 projects (37%)
£175 billion(34%)
Projects to change how the government operates, modernising government ‘back office’ activities and improving delivery of services to the public.
Infrastructure and construction projects
30 projects (20%)
£170 billion(33%)
Projects involving new building and engineering.
Defence equipment projects 24 projects (16%)
£146 billion(29%)
Ministry of Defence’s equipment projects.
ICT projects 40 projects (27%)
£20 billion(4%)
Projects to develop new digital information and communication technologies to reduce costs and provide better access to services. These are central to the government’s digital strategy to transform the way it provides public services.
Source: Analysis of June 2015 departmental data provided to the Major Projects Authority

Delivering major projects in government: a briefing for the Committee of Public Accounts Part One 11
It is not possible to quantify the total number and value of projects in the public sector
1.2 The public sector as a whole delivers many more projects than those central government major projects included in the Portfolio. It is difficult to estimate the total number and value of public sector projects. However, the following sources suggest that the total is likely to be much larger than the figures given in the Portfolio, although there is some duplication between them. For example:
• In July 2015, the national infrastructure pipeline covered 564 infrastructure projects, worth £411 billion of planned public and private investment from 2015-16. It included 17 projects that were in the Portfolio with a whole-life cost of £177 billion; it also included other public sector projects that were not in the Portfolio, such as local transport and Network Rail projects.
• HM Treasury’s capital spend data for the public sector as a whole shows that planned departmental capital spend for 2015-16 is £42 billion, most of which will be managed as projects. Given that the capital element of budgeted spend on the Portfolio is £16 billion in the same period, this indicates that there may be nearly twice as much capital project spend outside the portfolio. This includes all devolved and some local government spend, arm’s-length bodies and departmental capital spend on projects that are not monitored by the Infrastructure and Projects Authority, formerly the Major Projects Authority (the Authority). It does not include Network Rail and locally financed capital spend.
• Most departments track projects in addition to those in the Portfolio, for instance HM Revenue & Customs has an estimated change budget of £490.9 million for 2015-16 and the Department of Energy & Climate Change monitors 19 initiatives outside the Portfolio.
• In addition, the government could potentially be financially liable for projects where it has provided a contingent liability arising from guarantees, indemnities, and letters of comfort or similar legal obligations.
12 Part One Delivering major projects in government: a briefing for the Committee of Public Accounts
Many strategically important projects are delivered outside the Portfolio
1.3 The Portfolio is created using a definition of a major project as a central government project that requires HM Treasury approval during its life, as set out in a letter of delegation from HM Treasury to each department. There are areas where HM Treasury authority cannot be delegated, so the Authority assumes that projects with other characteristics should be included, such as those which could create pressures leading to breaches in financial expenditure limits; make contractual commitments to significant levels of future spend; could set an expensive precedent; are novel and contentious or potentially repercussive; or require primary legislation. This does not necessarily capture all programmes of strategic importance. For example:
• The Department for International Development told us that it has a portfolio of 1,600 programmes with whole-life costs of £67.2 billion and their own assurance processes to ensure value for money and aid impact. It commissions many of these programmes from global partners and only one (the development of an airport in St Helena) is on the Portfolio.
• The Department for Business, Innovation & Skills has a project team working on the transatlantic trade negotiations. While this is not valuable in terms of costs and the Authority does not regard it as a project, a successful outcome is of prime importance to the economy.
These examples indicate that project delivery is a bigger part of government business and the work of most departments than is indicated by the Portfolio alone.
Three departments deliver most of the largest government projects
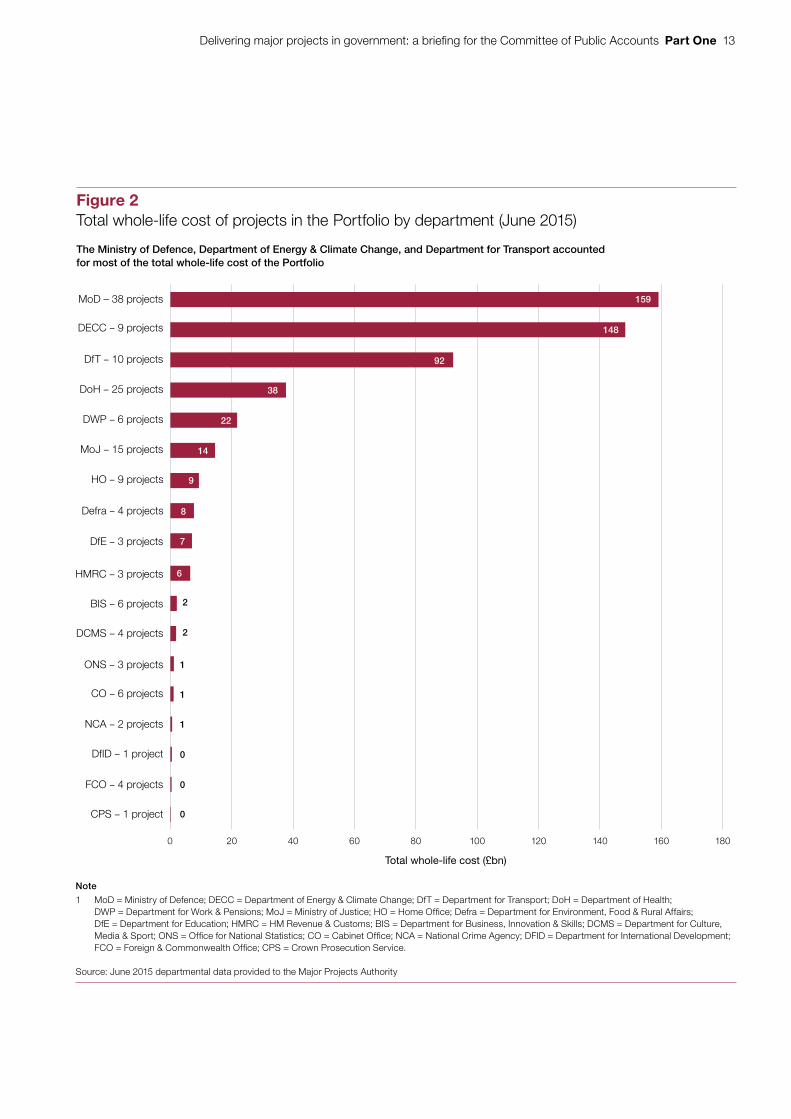
1.4 Individual government departments and arm’s-length bodies are responsible for delivering specific projects. The extent to which their work is delivered through projects varies by department. For example, the Ministry of Defence has the most projects in the Portfolio, followed by the Department of Health and the Ministry of Justice. The Ministry of Defence together with the Department of Energy & Climate Change and the Department for Transport also account for most of the total whole-life cost of the Portfolio (78% – £400 billion) with 57 projects between the three departments (Figure 2).
The public sector has not had a good track record in project delivery
1.5 Given the likely scale and value of government projects undertaken at any one time, delivering projects successfully is key to achieving value for money. However, in the past the public sector has not had a good track record in doing this. We have reported frequently on projects not being delivered on time, going over budget or not achieving their intended outcomes.
Delivering major projects in government: a briefing for the Committee of Public Accounts Part One 13
0
0
0
1
1
1
2
2
6
7
8
9
14
22
38
92
148
159
0 40 60 80 100 120 140 160 18020
CPS – 1 project
FCO – 4 projects
DfID – 1 project
NCA – 2 projects
CO – 6 projects
ONS – 3 projects
DCMS – 4 projects
BIS – 6 projects
HMRC – 3 projects
DfE – 3 projects
Defra – 4 projects
HO – 9 projects
MoJ – 15 projects
DWP – 6 projects
DoH – 25 projects
DfT – 10 projects
DECC – 9 projects
MoD – 38 projects
Figure 2Total whole-life cost of projects in the Portfolio by department (June 2015)
Total whole-life cost (£bn)
The Ministry of Defence, Department of Energy & Climate Change, and Department for Transport accounted for most of the total whole-life cost of the Portfolio
Note
1 MoD = Ministry of Defence; DECC = Department of Energy & Climate Change; DfT = Department for Transport; DoH = Department of Health;DWP = Department for Work & Pensions; MoJ = Ministry of Justice; HO = Home Office; Defra = Department for Environment, Food & Rural Affairs; DfE = Department for Education; HMRC = HM Revenue & Customs; BIS = Department for Business, Innovation & Skills; DCMS = Department for Culture, Media & Sport; ONS = Office for National Statistics; CO = Cabinet Office; NCA = National Crime Agency; DFID = Department for International Development; FCO = Foreign & Commonwealth Office; CPS = Crown Prosecution Service.
Source: June 2015 departmental data provided to the Major Projects Authority

14 Part One Delivering major projects in government: a briefing for the Committee of Public Accounts
1.6 In the previous Parliament we published 56 reports on government projects. We found that progress had been made in some areas: for example, our reports on the Defence Equipment Plan and Major Projects show that in-year costs have stabilised, and our report on major rail programmes showed that the Department for Transport has learned lessons from these programmes. Some underlying issues remain, which prevent more general improvement across government:
• Measuring costs and benefits – departments often could not track costs and benefits or measure the impact of their projects.
• Early planning – projects did not appraise options against realistic alternatives, made unrealistic performance projections, and could have used piloting and testing more effectively. For example, the Better Care Fund was a challenging initiative that ministers paused and redesigned after the early planning and preparations did not match the scale of its ambition.
• Portfolio management – departments did not have integrated strategies to give them a clearer view of the interdependencies between projects and how to prioritise them. For example, the Committee of Public Accounts found that the value for money of new train procurements was undermined by lack of certainty at the start of the procurement process. As a result, it asked the Department for Transport to develop an integrated strategy covering infrastructure, rolling stock and franchising. The Committee looked for HM Treasury to take ownership and responsibility for overseeing the Portfolio, and ensure that decisions about whether, and how, an individual project should proceed would be based on the project’s impact on the Portfolio’s value and risk, and the relevant department’s delivery capability and existing portfolio of projects.
• Capability – our 2011 report on central government’s skills requirements identified very significant shortages in project and programme management skills. Since then, we have found that some of the departments with the largest portfolios have gaps in commercial and digital expertise and senior project leadership, and rely on contractors to fill these gaps.
• Accountability – projects sometimes lacked a senior responsible owner with beginning-to-end responsibility for the projects. The senior responsible owner was sometimes responsible for a range of different projects, and did not always have full responsibility for delivering the project within an agreed budget, or the authority to direct those involved in delivering the project.2
2 See Appendix Three.

Delivering major projects in government: a briefing for the Committee of Public Accounts Part One 15
Government has sought to improve project delivery
1.7 Successive governments have implemented several initiatives to improve project delivery (Figure 3 overleaf). One initiative was the creation of the Authority in 2011, which had a prime ministerial mandate to improve the delivery of major projects in government by:
• commissioning the assurance of all major projects and ensuring that assurance is planned for them;
• maintaining the Portfolio, including collecting data on project performance from departments and producing an annual report;
• developing skills and capability; and
• providing support and advice and intervening directly to improve project performance.
On 1 January 2016, Infrastructure UK and the Major Projects Authority merged to form the Infrastructure and Projects Authority.
Many government bodies play a role in project delivery
No one organisation has a view of the whole portfolio of government projects
1.8 Departments have a number of responsibilities for approving, assuring and seeking improvements in the delivery of major projects. For example:
• Above certain limits, departments need to get approval from HM Treasury to proceed with projects. The limits are specific to each department and range between £5 million and £600 million for the main government departments.
• For the highest-profile projects (typically, those costing more than £1 billion), HM Treasury and the Authority jointly run the Major Projects Review Group to advise ministers on funding decisions.
• The Government Digital Service and the Crown Commercial Service promote policies in their areas of expertise, advise on specific aspects of projects and in some cases approve spending (Figure 4 on page 17).
1.9 The scale and complexity of the projects that the government undertakes mean their implementation often cuts across departmental boundaries; they also raise issues about capacity and capability. The Committee of Public Accounts therefore looked to HM Treasury to take responsibility for overseeing the Portfolio to ensure that decisions about whether, and how, individual projects should proceed were based on their impact on the total Portfolio’s value and risk, the relevant department’s delivery capability and its existing portfolio of projects.3 The government accepted this recommendation in 2014 and has worked with departments to improve their portfolio management.
3 See Appendix Three.

16 Part One Delivering major projects in government: a briefing for the Committee of Public Accounts
Fig
ure
3Ti
mel
ine
of d
evel
opm
ents
to im
prov
e go
vern
men
t pro
ject
del
iver
y
1995
–20
00
2001
–20
0420
05–2
009
2010
2011
2014
2012
2015
2013
2016
Sou
rce:
Nat
iona
l Aud
it O
ffi ce
rev
iew
of g
over
nmen
t ann
ounc
emen
ts, p
olic
y d
ocum
enta
tion
and
othe
r p
ublic
doc
umen
ts
1999
Rev
iew
of C
ivil
Pro
cure
men
t in
Cen
tral
Gov
ernm
ent
is p
ublis
hed,
whi
ch in
200
0 le
d to
the
crea
tion
of
the
Offi
ce o
f Gov
ernm
ent C
omm
erce
(OG
C) w
ith
Sir
Pet
er G
ersh
on a
s C
hief
Exe
cutiv
e
The
Com
mitt
ee o
f Pub
lic A
ccou
nts
publ
ishe
s Im
pro
ving
the
Del
iver
y of
Gov
ernm
ent I
T p
roje
cts
200
0
Offi
ce o
f the
e-E
nvoy
pu
blis
hed
Suc
cess
ful
IT: M
oder
nisi
ng
Gov
ernm
ent i
n A
ctio
n
2001
Laun
ch o
f OG
C
Gat
eway
Rev
iew
for
Pro
ject
Ass
uran
ce
2003
Sen
ior
resp
onsi
ble
owne
rs m
anda
ted
for
the
riski
est
proj
ects
2007
Pub
licat
ion
of T
rans
form
ing
Gov
ernm
ent P
rocu
rem
ent
The
Maj
or P
roje
cts
Rev
iew
G
roup
– a
scr
utin
y pa
nel f
or
maj
or p
roje
cts
is c
reat
ed
2009
Dav
id P
itchf
ord
appo
inte
d he
ad
of O
GC
’s M
ajor
P
roje
cts
Dire
ctor
ate
2012
Maj
or P
roje
cts
Lead
ersh
ip
Aca
dem
y fo
r pr
ojec
t lea
ders
of
the
top
200
maj
or
proj
ects
acr
oss
gove
rnm
ent
Pub
licat
ion
of th
e C
ivil
Ser
vice
Ref
orm
Pla
n
2014
Osm
othe
rly R
ules
up
date
d to
mak
e se
nior
re
spon
sibl
e ow
ners
pe
rson
ally
acc
ount
able
to
Par
liam
enta
ry
Sel
ect C
omm
ittee
s
John
Man
zoni
ap
poin
ted
head
of
Maj
or P
roje
cts
Aut
horit
y
Pub
licat
ion
of M
ajor
P
roje
cts
Aut
horit
y’s
seco
nd a
nnua
l rep
ort
2015
Laun
ch o
f Pro
ject
Lea
ders
hip
Pro
gram
me
Tony
Meg
gs a
ppoi
nted
hea
d of
Maj
or P
roje
cts
Aut
horit
y
Pub
licat
ion
of M
ajor
Pro
ject
s A
utho
rity’
s th
ird a
nnua
l rep
ort
1 Ja
n 20
16
Cre
atio
n of
the
Infr
astr
uctu
re a
nd
Pro
ject
s A
utho
rity,
form
ed fr
om a
m
erge
r of
Infr
astr
uctu
re U
K a
nd th
e M
ajor
Pro
ject
s A
utho
rity.
Its
Chi
ef
Exe
cutiv
e is
Ton
y M
eggs
2015
Pro
ject
del
iver
y fa
st s
trea
m
open
s fo
r ap
plic
atio
ns
Nat
iona
l inf
rast
ruct
ure
pipe
line
cove
red
564
infr
astr
uctu
re
proj
ects
wor
th £
411
billi
on
of p
ublic
and
priv
ate
inve
stm
ent i
n Ju
ly 2
015,
of
whi
ch 3
6% b
y va
lue
are
eith
er
taxp
ayer
-fun
ded
or h
ave
mix
ed
priv
ate/
publ
ic fu
ndin
g. T
he
bulk
of t
his
is in
the
ener
gy
and
tran
spor
t sec
tors
2010
OG
C c
ondu
cts
its M
ajor
Pro
ject
s re
view
of c
irca
40 m
ajor
pro
ject
s to
take
a v
iew
on
stop
ping
or
redu
cing
sco
pe
Nat
iona
l Inf
rast
ruct
ure
Pla
n ca
lled
for
£200
bill
ion
of in
vest
men
t ove
r 5 y
ears
to
red
ress
his
toric
und
erin
vest
men
t
2013
Pub
licat
ion
of L
ord
Bro
wne
’s r
epor
t Get
ting
a G
rip: H
ow to
imp
rove
m
ajor
pro
ject
exe
cutio
n an
d co
ntro
l in
gove
rnm
ent
Dav
id P
itchf
ord
step
s do
wn
Pub
licat
ion
of M
ajor
P
roje
cts
Aut
horit
y’s
first
ann
ual r
epor
t20
11
Cre
atio
n of
the
Maj
or P
roje
cts
Aut
horit
y

Delivering major projects in government: a briefing for the Committee of Public Accounts Part One 17
Fig
ure
4S
ever
al d
iffer
ent c
entr
al b
odie
s ar
e in
volv
ed in
impr
ovin
g th
e pe
rform
ance
of m
ajor
pro
ject
s bu
t non
e ha
s a
cent
ral o
verv
iew
Sou
rce:
Nat
iona
l Aud
it O
ffi ce
rev
iew
of p
ublic
ly a
vaila
ble
info
rmat
ion
and
info
rmat
ion
from
inte
rvie
ws
HM
Tre
asu
ryC
abin
et O
ffic
e
Cen
tral
bo
die
s
Dep
artm
ents
Trea
sury
Sp
end
Tea
ms
Ro
le
Maj
or in
vest
men
t dec
isio
ns
(bus
ines
s ca
se a
ppro
val).
Vis
ibili
ty/o
vers
ight
of
pro
ject
s
All
proj
ects
abo
ve
depa
rtm
enta
l spe
nd li
mit.
Go
vern
men
t D
igit
al S
ervi
ce
Ro
le
App
rove
s di
gita
l an
d te
chno
logy
spe
nd a
bove
ag
reed
thre
shol
ds.
Qua
lity
assu
res
digi
tal s
ervi
ces.
Vis
ibili
ty a
nd o
vers
ight
of
pro
ject
s
All
digi
tal a
nd
tech
nolo
gy s
pend
.
Cro
wn
Co
mm
erci
al S
ervi
ce
(Exe
cuti
ve A
gen
cy)
Ro
le
Ens
ure
valu
e fo
r m
oney
on
com
mer
cial
tran
sact
ions
.
Lead
ing
on
proc
urem
ent p
olic
y.
Vis
ibili
ty a
nd o
vers
ight
of
pro
ject
s
Pro
ject
s w
ith
proc
urem
ent e
lem
ent.
Infra
stru
ctur
e U
K (I
UK
) and
the
Maj
or
Pro
ject
s A
utho
rity
mer
ged
to c
reat
e th
e In
frast
ruct
ure
and
Pro
ject
s A
utho
rity
on 1
Jan
uary
201
6. It
is
not y
et c
lear
the
role
and
ove
rsig
ht
the
new
Infra
stru
ctur
e an
d P
roje
cts
Aut
horit
y w
ill pr
ovid
e.
Ro
le/f
unct
ion
Prio
r to
the
mer
ger
the
role
s w
ere
as fo
llow
s:
• IU
K: F
ocus
ed o
n pl
anni
ng a
nd
prio
ritis
atio
n of
inve
stm
ent
in U
K in
fras
truc
ture
; en
sure
d va
lue
for
mon
ey
of in
fras
truc
ture
pro
ject
s;
and
secu
red
priv
ate
sect
or
inve
stm
ent i
n in
fras
truc
ture
.
• M
ajor
Pro
ject
s A
utho
rity:
C
omm
issi
oned
inde
pend
ent
assu
ranc
e on
maj
or p
roje
cts;
su
ppor
ted
depa
rtm
ents
to
build
pro
ject
del
iver
y ca
pabi
lity;
co
llate
d qu
arte
rly p
erfo
rman
ce
data
on
the
Por
tfolio
and
pu
blis
hed
the
Maj
or P
roje
cts
Aut
horit
y A
nnua
l Rep
ort.
Vis
ibili
ty a
nd o
vers
ight
of p
roje
cts
Prio
r to
the
mer
ger,
IUK
focu
sed
on th
e to
p 40
infr
astr
uctu
re p
roje
cts
in th
e N
atio
nal I
nfra
stru
ctur
e P
lan
and
the
Maj
or P
roje
cts
Aut
horit
y fo
cuse
d on
the
proj
ects
in
the
Por
tfolio
.
Infr
astr
uct
ure
an
d P
roje
cts
Au
tho
rity
Ro
le
• S
ubm
it bu
sine
ss c
ases
for
appr
oval
• A
dher
e to
cen
tral
con
trol
s an
d po
licie
s
• D
eliv
er p
roje
cts
• R
epor
t to
depa
rtm
enta
l boa
rds
on p
roje
ct p
erfo
rman
ce
• S
ubm
it qu
arte
rly r
etur
ns to
the
Aut
horit
y fo
r pr
ojec
ts in
the
Por
tfolio
• M
onito
r lo
ng-t
erm
ben
efits
Vis
ibili
ty a
nd o
vers
ight
of p
roje
cts
• A
ll pr
ojec
ts w
ithin
dep
artm
enta
l por
tfolio
incl
udin
g th
ose
on th
e P
ortfo
lio

18 Part One Delivering major projects in government: a briefing for the Committee of Public Accounts
1.10 There is still a lack of central oversight around prioritisation between departments. Spending Reviews are the main mechanism through which funds are allocated and prioritised between departments, but we found in 2012 that the system was less effective at supporting informed prioritisation and that mechanisms to compare the value of spending between departments were weak.4 While the National Infrastructure Commission will recommend future priorities for infrastructure, there will still be a gap in relation to service delivery projects.
The scale of challenge is increasing
1.11 Government faces several challenges in delivering its projects. These include:
• The number of projects being delivered in this Parliament
For example, 71% of the Portfolio’s current projects (106 out of 149 projects) are scheduled to be completed by 2019-20. This inevitably puts pressure on departments and creates demand, both in government and in the supply chain, for scarce skills including digital, specialist engineering, commercial and project management skills and resources. Nearly 80% of these 106 projects are to either transform or change the way services are delivered, or accessed through the use of new technologies.
• The length of some projects
While most (70%) of the projects in the Portfolio in June 2015 were expected to take fewer than 10 years to complete, 4 are expected to take more than 30 years. This makes it difficult to maintain management continuity and makes them more likely to be affected by changes in their operating environment.
• The size of individual programmes
For example, the Crossrail project is reputed to be the largest infrastructure project currently under construction in Europe. More ambitious projects are in the pipeline.
• The ambition and complexity of both transformation and infrastructure programmes
Some departments are delivering several transformation and service delivery projects at the same time; the Ministry of Defence had 14 of their transformation projects in the Portfolio in June 2015 and the Department of Health had 10. We have already commented in our briefing note Lessons for major service transformation that transformation projects raise the greatest risk of failure and require the department to balance ambition and realism in setting goals. Delivering multiple projects increases these risks.5
4 See Appendix Three.5 See Appendix Three.

Delivering major projects in government: a briefing for the Committee of Public Accounts Part One 19
Programmes such as High Speed 2 are complex. They have multiple elements to be delivered in parallel by a diverse supply chain; many external interdependencies; and multiple policy objectives, such as transport objectives that involve increasing capacity in the railway, and economic objectives that involve generating growth and rebalancing the economy. These require governance structures that span traditional departmental boundaries.
• The financing required
The government expects private sources to raise 64% of the £411 billion required for the National Infrastructure Plan, covering government-sponsored projects and profit-making private sector investments. This includes funding through corporate balance sheets, especially in regulated sectors, but in March 2014 Infrastructure UK estimated that up to £52 billion might require project financing. Recent experience of financing new trains and nuclear power indicates that securing such finance can be a long process, which has an impact on how quickly projects can be delivered.
1.12 The factors that require departments to start more major programmes – scarce resources, the need for more investment in infrastructure and the opportunities to take advantage of new technologies – increase the demands on their limited capacity. This means the environment for delivering major public programmes is increasingly challenging and will require departments to:
• prioritise effectively;
• make good investment decisions, ensuring that the projects and programmes given priority offer the best value for money;
• secure the skills to deliver programmes in different ways, including agile development techniques and the capability to lead business and service transformation programmes; and
• respond flexibly to developments and change direction when new approaches do not deliver results.
1.13 This briefing provides an overview of:
• the key trends in the performance of project delivery in government;
• the progress that central bodies and departments have made in tackling the underlying issues we have identified; and
• what we see as the key challenges for improvement in this Parliament.

20 Part Two Delivering major projects in government: a briefing for the Committee of Public Accounts
Part Two
Recent performance
2.1 There are two dimensions to measuring success in a project: whether the project was delivered on time, to budget and to scope; and whether the project achieved its objectives, usually expressed as benefits. Departments do not report against these measures consistently. Where departments measure performance, they generally emphasise how efficiently they delivered the output to time and cost and even then this is problematic as performance is often measured against early estimates, which are not robust and based on an incomplete understanding of the scope of the project. Departments often overlook whether the project has realised the intended benefits.
2.2 In terms of the information that is available, the Major Projects Authority (the Authority, now the Infrastructure and Projects Authority) publishes an annual snapshot of project delivery across the Government’s Major Projects Portfolio (the Portfolio) alongside its annual report, which is based on data provided by departments. The annual report provides an overview of the Authority’s work and some high-level findings on project performance, focusing mainly on delivery confidence. In accordance with the Cabinet Office’s transparency policy, the data are published at least 6 months in arrears.6 Departments are permitted to exempt data from publication under exceptional circumstances, such as in the interests of national security or commercial confidentiality. Departments provide a significant amount of data to the Authority that is not reported on in its annual reports in accordance with the transparency policy.
2.3 The extent to which departments collect additional data on their projects beyond what the Authority requires depends on how significant project delivery is to their business and the scope of their portfolio management. Most departments now have a central programme team or portfolio office function that monitors performance and progress of its priority projects and reports to senior management. Some are managing risk and interdependencies across the portfolio and some are linked in to departmental investment committees. Capability matters and development of the project management profession are typically managed by other teams. We spoke to 14 departments about their portfolios and 10 monitored the whole-life costs of their projects. The Department for Education was awaiting the Spending Review before confirming the content of its portfolio and the Department for Communities and Local Government does not currently operate on a portfolio basis.
6 Cabinet Office, Transparency policy on the Government’s Major Projects Portfolio (GMPP) and guidance for departments on exemptions, May 2013, available at: www.gov.uk/government/uploads/system/uploads/attachment_data/file/203091/Transparency_policy_and_exemptions_guidance_text_for_publication_230513.pdf

Delivering major projects in government: a briefing for the Committee of Public Accounts Part Two 21
While the Authority has improved transparency in its annual reports, there are still limitations
2.4 Our reviews of the Authority’s annual reports to date have focused on progress in making major project data transparent. In February 2014 we concluded that the Authority should present more useful and comprehensive data including:
• total project costs incurred;
• progress against goals and benefits achieved;
• disclosing reasons for the deliverability ratings;7 and
• analysis of project data at a portfolio level.
2.5 The Authority published its third annual report in June 2015 reporting on data as at September 2014. In the 2015 annual report less data have been exempt, which gives a more complete picture. However, total project costs incurred and progress against milestones and benefits remain unpublished in line with the transparency policy. The report contains additional analysis on the types of project but does not include information on common issues across the Portfolio.
2.6 We analysed data from this third report and the most recent data reported by departments to the Authority to see if we could identify whether performance of project delivery in relation to cost, deliverability and benefits is improving. We could not conclude clearly from this analysis whether project performance is improving. The following paragraphs set out the trends that we could discern and the problems that prevent us from drawing firm conclusions. The main problems are that the data do not allow costs to be compared with a consistent baseline, or outturn costs and delivery dates to be compared with forecasts. There are also inconsistencies in how whole-life costs are reported by departments, for example whether costs are reported in real terms or nominal terms, or whether different index years are used.
The reported cost of the Portfolio is higher than in 2012
2.7 In September 2012 the Portfolio consisted of 191 projects. The 2013 annual report states that the budgeted whole-life costs of these projects was £354 billion but the total costs disclosed in the supporting data published by departments was only £306 billion because departments withheld whole-life cost data for 36 projects. In June 2015 the Portfolio consisted of 149 projects with a budgeted whole-life cost of £511 billion. Nine of these projects are deemed to have information that is not disclosable, leaving a budgeted portfolio of £436 billion for which supporting information is available and can be compared with the £306 billion above. This supports our conclusion in paragraph 2.5 above that more information has become available. The majority of the increase in reported costs occurred between September 2012 and September 2013.
7 The delivery confidence ratings published in the Authority’s third annual report are the Authority’s assessment of projects in September 2014. These may differ from departments’ own assessments or those awarded by review teams when carrying out assurance reviews.

22 Part Two Delivering major projects in government: a briefing for the Committee of Public Accounts
2.8 It is difficult to make comparisons at a portfolio level between years because of changes in the composition of the Portfolio, changes in the amount of exempted data, and the use of different cost bases. We have tried to establish the reasons for changes in whole-life costs for those projects for which we have data. Figure 5 shows that the changes are due to:
a 107 new projects joining the portfolio (£102 billion);
b reduction in the non-disclosure of project costs (£51 billion);
c a net increase of 81% in reported costs of the 59 projects remaining on the portfolio across all 4 years from £159 billion in 2012 to £288 billion in 2015.8 Of these, 40 projects’ costs increased by a total of £147 billion and 19 projects’ costs decreased by a total of £19 billion; and
d net increases in the whole-life costs of projects which have not been in the Portfolio for the whole 4-year period that we analysed (£74 billion).
The increases listed above more than offset the effect of the 149 projects with whole-life costs of £206 billion leaving the Portfolio.
2.9 Projects are removed when they become operational or are otherwise deemed no longer to require the Authority’s oversight. Of the 149 projects removed from the Portfolio, 39% were moved to ‘business as usual’; 26% were completed; 12% merged with another project or disaggregated into separate projects; 7% were cancelled; and 16% were removed for a variety of other reasons.
2.10 In June 2015, 65 projects with a whole-life cost of £147 billion left the Portfolio. The cost change is largely accounted for by 4 projects:
• Department of Energy & Climate Change’s Renewable Heat Incentive (£44 billion) left the Portfolio as the project has been completed.
• Department of Energy & Climate Change’s Final Investment Decision Enabling for Renewables (£22 billion) left the Portfolio after the contracts were let.
• The Ministry of Defence’s Typhoon project (£18.8 billion) moved to business as usual as the final tranche of aircraft entered service.
• The Ministry of Defence’s Mounted Close Combat project (£17 billion) was disaggregated into 4 programmes, of which two immediately entered the Portfolio.
8 This excludes projects where costs have not been disclosed.

Delivering major projects in government: a briefing for the Committee of Public Accounts Part Two 23
436
206
19
306
128
102
74
51
0
100
200
300
400
500
600
700
Who
le-li
fe c
ost
of th
e P
ortfo
lio in
Sep
tem
ber
2012
Net
incr
ease
inre
port
ed c
osts
of
the
59 p
roje
cts
rem
aini
ng o
n th
epo
rtfo
lio a
cros
s al
l 4 y
ears
New
pro
ject
s jo
inin
g th
e P
ortfo
lio
Net
incr
ease
s to
th
e w
hole
-life
co
sts
of p
roje
cts
whi
ch h
ave
not
been
in th
e P
ortfo
lio
for
the
who
le
4-ye
ar p
erio
d
Red
uctio
n in
the
non-
disc
losu
re o
fpr
ojec
t cos
ts
Exi
stin
g pr
ojec
tsle
avin
g th
e P
ortfo
lio
Exi
stin
g pr
ojec
tsw
here
the
proj
ect
cost
s ar
e no
lo
nger
dis
clos
ed
Who
le-li
fe c
ost
of th
e P
ortfo
lio
in J
une
2015
Fig
ure
5B
reak
dow
n of
how
cos
ts h
ave
chan
ged
betw
een
2012
and
201
5
Who
le-l
ife c
ost
(£b
n)
The
Po
rtfo
lio’s
net
cha
nge
in w
hole
-life
co
st b
etw
een
2012
and
201
5 w
as £
130
bill
ion.
The
re w
as a
n o
vera
ll in
crea
se o
f £3
55 b
illio
n an
d r
educ
tion
of
£226
bill
ion
No
tes
1 Th
ere
are
und
iscl
osed
pro
ject
cos
ts th
at h
ave
not b
een
incl
uded
in t
he a
bov
e an
alys
is. I
n S
epte
mb
er 2
012,
this
am
ount
ed to
£48
bill
ion
and
in J
une
2015
, £75
bill
ion.
2 S
even
ty-t
hree
pro
ject
s re
mai
n in
the
Por
tfol
io a
cros
s al
l 4 y
ears
. The
59
pro
ject
s ex
clud
e p
roje
cts
whe
re c
osts
are
und
iscl
osed
.
3 A
tota
l of 1
49 p
roje
cts
have
left
the
por
tfol
io s
ince
201
2. In
201
3, 3
6 p
roje
cts
wer
e re
mov
ed; i
n 20
14, 4
8 p
roje
cts
wer
e re
mov
ed; a
nd in
201
5, 6
5 p
roje
cts
wer
e re
mov
ed.
Sou
rce:
Nat
iona
l Aud
it O
ffice
ana
lysi
s of
dep
artm
enta
l dat
a p
ublis
hed
alon
gsid
e th
e M
ajor
Pro
ject
s A
utho
rity
annu
al r
epor
ts 2
012-
13, 2
013-
14, 2
014-
15, a
nd J
une
2015
dep
artm
enta
ld
ata
pro
vid
ed to
the
Aut
horit
y
Dec
reas
e
Incr
ease
Agg
rega
te c
ost
24 Part Two Delivering major projects in government: a briefing for the Committee of Public Accounts
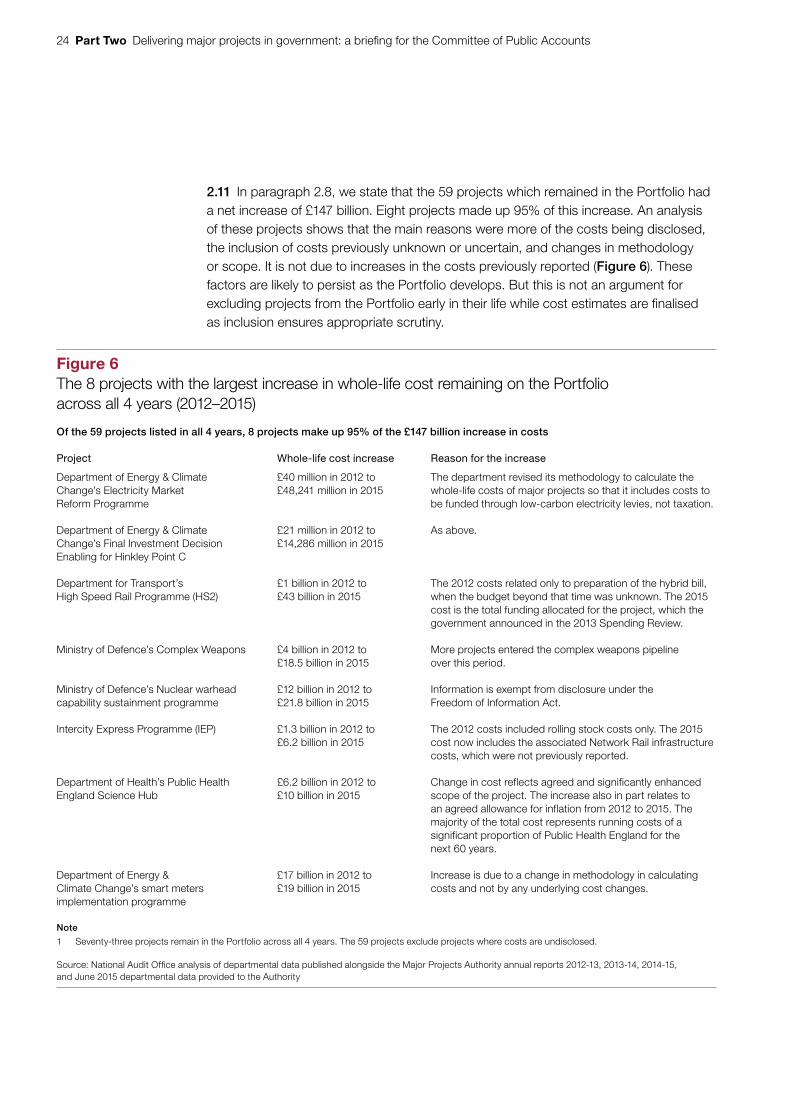
2.11 In paragraph 2.8, we state that the 59 projects which remained in the Portfolio had a net increase of £147 billion. Eight projects made up 95% of this increase. An analysis of these projects shows that the main reasons were more of the costs being disclosed, the inclusion of costs previously unknown or uncertain, and changes in methodology or scope. It is not due to increases in the costs previously reported (Figure 6). These factors are likely to persist as the Portfolio develops. But this is not an argument for excluding projects from the Portfolio early in their life while cost estimates are finalised as inclusion ensures appropriate scrutiny.
Figure 6The 8 projects with the largest increase in whole-life cost remaining on the Portfolio across all 4 years (2012–2015)
Of the 59 projects listed in all 4 years, 8 projects make up 95% of the £147 billion increase in costs
Project Whole-life cost increase Reason for the increase
Department of Energy & Climate Change’s Electricity Market Reform Programme
£40 million in 2012 to £48,241 million in 2015
The department revised its methodology to calculate the whole-life costs of major projects so that it includes costs to be funded through low-carbon electricity levies, not taxation.
Department of Energy & Climate Change’s Final Investment Decision Enabling for Hinkley Point C
£21 million in 2012 to £14,286 million in 2015
As above.
Department for Transport’s High Speed Rail Programme (HS2)
£1 billion in 2012 to £43 billion in 2015
The 2012 costs related only to preparation of the hybrid bill, when the budget beyond that time was unknown. The 2015 cost is the total funding allocated for the project, which the government announced in the 2013 Spending Review.
Ministry of Defence’s Complex Weapons £4 billion in 2012 to £18.5 billion in 2015
More projects entered the complex weapons pipeline over this period.
Ministry of Defence’s Nuclear warhead capability sustainment programme
£12 billion in 2012 to £21.8 billion in 2015
Information is exempt from disclosure under the Freedom of Information Act.
Intercity Express Programme (IEP) £1.3 billion in 2012 to £6.2 billion in 2015
The 2012 costs included rolling stock costs only. The 2015 cost now includes the associated Network Rail infrastructure costs, which were not previously reported.
Department of Health’s Public Health England Science Hub
£6.2 billion in 2012 to £10 billion in 2015
Change in cost reflects agreed and significantly enhanced scope of the project. The increase also in part relates to an agreed allowance for inflation from 2012 to 2015. The majority of the total cost represents running costs of a significant proportion of Public Health England for the next 60 years.
Department of Energy & Climate Change’s smart meters implementation programme
£17 billion in 2012 to £19 billion in 2015
Increase is due to a change in methodology in calculating costs and not by any underlying cost changes.
Note
1 Seventy-three projects remain in the Portfolio across all 4 years. The 59 projects exclude projects where costs are undisclosed.
Source: National Audit Offi ce analysis of departmental data published alongside the Major Projects Authority annual reports 2012-13, 2013-14, 2014-15, and June 2015 departmental data provided to the Authority

Delivering major projects in government: a briefing for the Committee of Public Accounts Part Two 25
There are more concerns about the deliverability of some projects
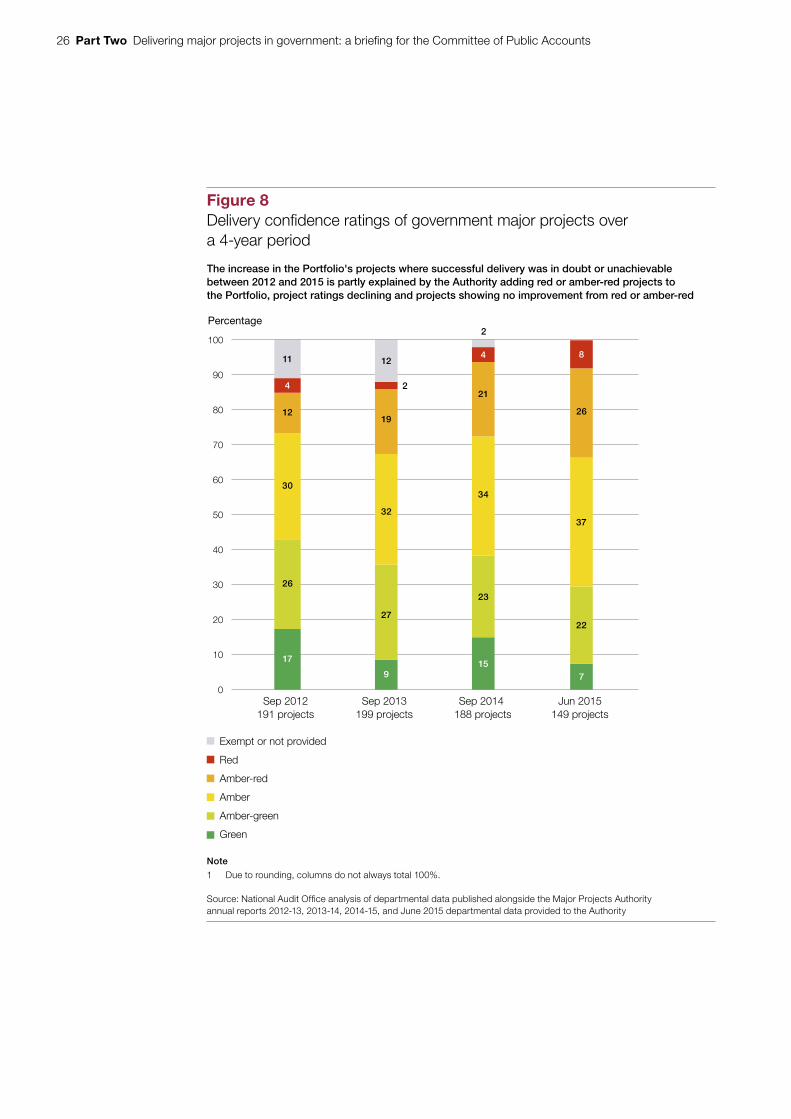
2.12 When it carries out assurance reviews, the Authority awards projects a delivery confidence rating using a ‘traffic light’ approach (Figure 7).
2.13 The most recent data available to us shows that there are 50 projects in the Portfolio where successful delivery was in doubt or unachievable (rated red or amber-red). There is no clear comparison with the data disclosed in the 2012 annual report for projects in the Portfolio at September 2012, of which 30 were rated red or amber-red (Figure 8 overleaf). The difference is partly explained by the Authority adding 21 red or amber-red projects to the Portfolio between 2012 and 2015. Eighteen other projects’ ratings declined to red or amber-red between 2012 and 2015 and 6 projects showed no improvement from red or amber-red.
2.14 The number of projects where successful delivery was highly likely or probable (rated green or amber-green) has fallen from 82 in 2012 to 44 in 2015. This is largely due to the removal of 66 projects that had green or amber-green ratings from the Portfolio and 26 existing and new projects improving their ratings to green and amber-green.
2.15 A particular concern is that the Authority has rated the delivery of one-third of projects scheduled to finish in the next 5 years as being in doubt or unachievable (Figure 9 on page 27).
Figure 7The Authority’s delivery confi dence ratings
Rating Description
Successful delivery of the project on time, budget and quality appears highly likely and there are no major outstanding issues that at this stage appear to threaten delivery significantly.
Successful delivery appears probable; however, constant attention will be needed to ensure risks do not materialise into major issues threatening delivery.
Successful delivery appears feasible but significant issues already exist, requiring management attention. These appear resolvable at this stage and, if addressed promptly, should not present a cost or schedule overrun.
Successful delivery of the project is in doubt, with major risks or issues apparent in a number of key areas. Urgent action is needed to ensure these are addressed, and whether resolution is feasible.
Successful delivery of the project appears to be unachievable. There are major issues with project definition, schedule, budget, quality or benefits delivery, or both, which at this stage do not appear to be manageable or resolvable. The project may need re-scoping or its overall viability reassessed, or both.
Source: Major Projects Authority Annual Report 2014-15
26 Part Two Delivering major projects in government: a briefing for the Committee of Public Accounts
Figure 8Delivery confidence ratings of government major projects overa 4-year period
Percentage
The increase in the Portfolio's projects where successful delivery was in doubt or unachievable between 2012 and 2015 is partly explained by the Authority adding red or amber-red projects to the Portfolio, project ratings declining and projects showing no improvement from red or amber-red
Exempt or not provided
Red
Amber-red
Amber
Amber-green
Green
Note
1 Due to rounding, columns do not always total 100%.
Source: National Audit Office analysis of departmental data published alongside the Major Projects Authority annual reports 2012-13, 2013-14, 2014-15, and June 2015 departmental data provided to the Authority
0
10
20
30
40
50
60
70
80
90
100
Sep 2012191 projects
Sep 2013199 projects
Sep 2014 188 projects
Jun 2015149 projects
2
2
11 12
32
27
19
4 8
26
21
34
37
22
23
1579
4
12
30
26
17

Delivering major projects in government: a briefing for the Committee of Public Accounts Part Two 27
2.16 The delivery confidence ratings reflect uncertainty and risk as well as the performance of projects. Uncertainty reduces through the project lifecycle, but our analysis shows that not all project ratings improve over time. When examining the 56 projects remaining on the portfolio across all 4 years between 2012 and 2015,9 we found the number of projects considered highly likely to deliver on time and on budget (rated green or amber-green) increased from 16 in 2012 to 25 in 2015 (Figure 10 overleaf). However, projects where successful delivery was in doubt or unachievable (rated red and amber-red) have also increased from 12 in 2012 to 17 in 2015.
Departmental data on benefits realisation is poor
2.17 If projects do not deliver their intended benefits they are unlikely to have provided value for money. The Authority collects information but does not report on projects’ progress towards achieving intended benefits as these data are not included in the scope of the Cabinet Office’s transparency policy.
2.18 Departments are responsible for monitoring whether projects realise their intended benefits once they are completed. We have reported in the past that they often do not do this. One issue is that of accountability as often those responsible for delivering a project are not those who will be monitoring the project once it is complete, or accountable for the end-user benefits, which can span decades into the future.10
9 Projects where delivery ratings have not been disclosed have not been included in this analysis.10 See Appendix Three.
Figure 9Delivery confidence rating of 106 projects scheduled to finish between 2015-16 and 2019-20
Amber 36%
Amber-red 27%
Amber-green 22%
Red 8% Green 8%
Source: National Audit Office analysis of departmental data provided to the Major Projects Authority
The Authority has rated more than one third of the 106 projects scheduled to finish by the end of the financial year 2019-20 as red or amber-red – successful delivery is in doubt or unachievable

28 Part Two Delivering major projects in government: a briefing for the Committee of Public Accounts
2.19 The Authority is not in a position to monitor whether the benefits of a project are realised once it is complete and activities have become ‘business as usual’. According to its 2012 guidance to departments, the Authority should carry out a Gate 5 assurance review or an exit review before a project is removed from the Portfolio to ensure it is on track to deliver its benefits.11 However, the Authority told us that the decision about whether a project should have a Gate 5 review before it leaves the Portfolio is made jointly with the department and depends upon the specific facts of the project. Between September 2012 and June 2015, the Authority conducted 80 Gate 5 or exit reviews and removed 96 projects from the Portfolio that were either completed or transferred to ‘business as usual’. The Authority now views removal from the Portfolio as a judgement and focuses on the readiness of the business operations to accept the change, which may be better assessed in other ways. However, it has recognised that assessing whether projects have realised their benefits is an area of weakness in project delivery. It has taken the lead on work to raise the level of awareness across government.
11 A review to confirm that the desired benefits of the project are being achieved, and business changes are operating smoothly.
5 3 5 7
11 14
20 18
28 23
1814
8 1412
12
42 1
5
0
10
20
30
40
50
60
Sep 2012 Sep 2013 Sep 2014 Jun 2015
Figure 10Delivery confidence ratings of the 56 projects present in thePortfolio across all 4 years, where all data have been disclosed
Number of projects
The number of projects considered highly likely to deliver on time and on budget and where successful delivery was in doubt or unachievable has increased between 2012 and 2015
Red
Amber-red
Amber
Amber-green
Green
Source: National Audit Office analysis of departmental data published alongside the Major Projects Authority annual reports 2012-13, 2013-14, 2014-15, and June 2015 departmental data provided to the Authority

Delivering major projects in government: a briefing for the Committee of Public Accounts Part Three 29
Part Three
Improving performance
Steps have been taken to improve capability but there are barriers
3.1 When it was first formed, one of the Major Projects Authority’s (the Authority; now the Infrastructure and Projects Authority) main roles was to improve the capability of project leaders. It introduced the Major Projects Leadership Academy to build the skills of senior leaders to deliver complex projects. The Civil Service Reform Plan (2012) set a target for the senior responsible owner and project director of all projects in the Government Major Projects Portfolio (the Portfolio) to commence training at the Major Projects Leadership Academy or have equivalent qualifications or experience by December 2014.
3.2 The Authority launched the Project Leadership Programme in June 2015 for project leads working on projects that fall just outside the Portfolio. It is facilitating a new civil service fast stream for project delivery professionals and a number of fast-track apprenticeships. We have also seen evidence of the Authority intervening directly to support 14 projects. This includes identifying experts to join the project team, and recruiting interim senior responsible owners and project directors for 6- to 9-month periods where departments are unable to recruit the right individual quickly for a permanent position.
3.3 Departments are also undertaking a range of activities to develop capability:
• Each department has appointed a head of profession for project delivery although most are not full-time in this role.
• Departments are issuing internal guidance and delivering a variety of training events to improve project delivery capability. For example, HM Revenue & Customs runs a Programme Delivery Leadership Academy that is offered across government at a cost of £6,000 per participant; the Department for Communities and Local Government offers, among other courses, an introduction to project and programme management aimed at policy professionals; the Department for Business, Innovation & Skills told us it is offering commercial skills training to around 200 staff; and the Department of Energy & Climate Change has a programme of capability-building events including courses on business cases, benefits management and risk management.

30 Part Three Delivering major projects in government: a briefing for the Committee of Public Accounts
• Civil Service Learning now has a project delivery curriculum.
• Departments have established project delivery communities and are starting to conduct skills assessments within these. In the run-up to the Spending Review, they were not yet able to quantify the project delivery skills they would need for the future.
3.4 Despite this work, departments and the Authority told us there were still a number of barriers to progress.
• There is no formalised competency framework in project delivery yet. Clearly defined roles and competencies would allow more transferability of project delivery professionals across departments and the civil service.
• Attracting talent from the private sector is still a challenge as remuneration is typically lower in the civil service.
• Departments are not resourced for this activity – for instance, heads of profession typically have full-time leadership roles on specific projects.
• There are shortages of skills in specific areas needed to deliver the complex infrastructure and transformational change projects now in departments’ portfolios such as digital, legal, analytical, risk management and behaviour change skills.
3.5 At 1 October 2015, 380 project leaders had been enrolled in the Major Projects Leadership Academy and 161 of these had graduated. A further 197 project leaders working on projects just outside the Portfolio had enrolled in the Project Leadership Programme. We examined whether the senior responsible owners and project directors of the Portfolio projects as at June 2015 were attending the two programmes, and found that most had been enrolled or were committed to attending, or had equivalent experience (Figure 11).
3.6 Around a quarter of senior responsible owners and project directors will not attend the Major Projects Leadership Academy or Project Leadership Programme. This group includes contractors, those who are leaving the role shortly and those with limited capacity to attend. There is sufficient capacity on the programmes to meet the Civil Service Reform Plan target, but the high level of change in the Portfolio (paragraph 2.8) means it is likely that there will be a continuing need to train new project leaders to maintain this position.

Delivering major projects in government: a briefing for the Committee of Public Accounts Part Three 31
3.7 The cost of the Major Projects Leadership Academy is £30,000 per participant – a total cost of £11 million to September 2015. The cost of the Project Leadership Programme is significantly lower at £8,600 per student (£1.3 million to September 2015). The Authority has told us that this reflects differences in the duration of the respective programmes. Feedback from the Academy participants we interviewed is largely positive: they cited wider benefits of attendance including mentoring, participation in assurance reviews, running learning events, establishing networks across government for sharing best practice and talking a common language, and movement of project leaders between departments. Evaluating a return on investment is difficult but the Academy asks participants to complete an assignment reporting on the impact it has had on their project. As well as improvements in leadership and their ability to deal with external stakeholders, some have cited substantial improvements in the financial position of their project.
37
58
6 15
7
3
8
24
18
14
8
0 10 20 30 40 50 60 70 80 90 100
143 project directors
122 senior responsible owners
Percentage
Figure 11Senior responsible owners and project directors of the Portfolio’s projects in June 2015 and their attendance at the Major Projects Leadership Academyand Project Leadership Programme
Most senior responsible owners and project directors had been enrolled or were committed to attending the two programmes, or had equivalent experience
Notes
1 Senior responsible owners ‘other’ includes: 3 where it is still to be determined whether they will attend the Major Projects Leadership Academy; 1 participated for selected modules in the Major Projects Leadership Academy; 1 programme has no senior responsible owner as it has been completed; and 3 are not known.
2 Project directors ‘other’ includes: 17 where the status is not known; 1 project lead was being recruited; 1 project was awaiting organisational restructure; 1 had not applied at this time.
3 Figures do not sum due to rounding.
Source: National Audit Office analysis of departmental data provided to the Major Projects Authority
Attending Major Project Leadership Academy
Attending Project Leadership Programme
Eligible, awaiting sign-up to Major Project Leadership Academy or Project Leadership Programme
Have the equivalent experience and does not need to attendMajor Project Leadership Academy or Project Leadership Programme
Will not attend the Major Project Leadership Academy or Project Leadership Programme
Other
32 Part Three Delivering major projects in government: a briefing for the Committee of Public Accounts
3.8 The Authority runs events for Major Projects Leadership Academy graduates but does not have up-to-date information on the whereabouts of every graduate. However, departments have told us that numbers of Major Projects Leadership Academy graduates leaving the civil service is very low. The Ministry of Defence, which has more attendees on the Major Projects Leadership Academy than any other department, has retained the majority of its attendees and graduates. Of the 76 attendees who enrolled while in the Ministry of Defence, 7 have left the Department, 4 have transferred to other government departments and 3 no longer work in government. Of the remaining 69, all but 2 work in a leadership position in the department that will influence significant projects or programmes. For other departments that provided information, 1 of the Department of Energy & Climate Change’s 13 graduates, 1 of the Department for Work & Pensions’ 26 graduates and none of the Ministry of Justice’s 14 graduates have since left the civil service.
Assurance is recognised as valuable but its impact is variable
3.9 In 2012 we concluded that the Authority’s reviews were more exacting than under the previous system, but organisations varied in their compliance with the system, learning systems were informal and the pool of reviewers was too limited.12 There has been no significant change in the system since then, except for the introduction of project validation reviews (paragraph 3.13 below). More than 675 Authority reviews have now taken place since September 2012.
3.10 The impact of the assurance regime on project delivery is variable. HM Treasury’s investment decisions should draw on the Authority’s recommendations, but the Authority cannot stop projects or withdraw funding. Departments have said that the assurance process does add value to its projects, but that some review teams lack the seniority to influence experienced project teams. The Authority is dealing with this issue by matching individuals with relevant experience to partner with the review team. The Authority is making efforts to build the pool of assurance reviewers. The Major Projects Leadership Academy programme requires candidates to conduct assurance reviews. The size of the reviewer pool has increased by some 40% since our 2012 review, but there remains a shortage of specialist skills in ICT and construction.
12 See Appendix Three.

Delivering major projects in government: a briefing for the Committee of Public Accounts Part Three 33
3.11 The Authority has been unable to identify whether there is a relationship between review recommendations and project performance, although it is currently conducting research on this. Our reports show some variability in major projects’ responses to the review recommendations made by the Authority and its predecessor the Major Projects Directorate:
• Reviews made a positive impact on the Thameslink and Crossrail programmes.
• High Speed 2 and Universal Credit had been slow to respond to review recommendations in their early stages.
• The e-borders programme was re-scoped and the Universal Credit programme reset following the Authority’s recommendations; the Authority also made several recommendations not to proceed with these programmes until certain conditions were met.
• Other reviews have resulted in the Authority seconding senior staff to projects or helping to reconfigure them.13
3.12 The Authority analysed the review recommendations for a 12-month period from October 2013 to September 2014. It found the most common causes for concern occurred early in projects, as the Committee of Public Accounts has raised in the past (paragraph 1.6): defining options, scope and requirements, planning how to deliver the project and identifying and managing risk. The next section discusses progress on improving early planning.
Improving early planning is work in progress
3.13 The government has recognised that the approval process does not always prevent departments from becoming locked into solutions too early. The Authority introduced project validation reviews – one-day workshops to assess projects before they progress to HM Treasury approval. Forty-nine such reviews have been carried out since 2013. However, as the projects reviewed are at an early stage we cannot say how effective the reviews are. For instance, the process did not exist at a time to allow e-Borders or High Speed 2 to have such a review, but future options for the Sellafield contract and for the Common Agricultural Policy Delivery Programme have had reviews.
3.14 The Prime Minister wrote to departments on 21 May 2015 highlighting the need for better initial planning of major projects before ministers announce delivery dates. He tasked the Cabinet Office and HM Treasury with developing a pre-announcement deliverability assessment process, building on existing HM Treasury spending processes. This new process is not yet in place.
13 See Appendix Three.

34 Part Three Delivering major projects in government: a briefing for the Committee of Public Accounts
Accountability for projects is clearer but could be undermined by turnover of senior responsible owners
3.15 There is now clearer accountability to Parliament following the Cabinet Office’s revision of guidance (the Osmotherly rules) in October 2014. This means senior responsible owners for major projects are expected to appear before select committees to account for their decisions and actions on projects for which they have personal responsibility. In addition, former accounting officers can now be called to give evidence about their previous responsibilities within a reasonable time period.
3.16 Departments have issued revised appointment letters to senior responsible owners to reflect this. We found that senior responsible owners have largely received the new responsibilities positively and welcomed clarification of the role. HM Revenue & Customs told us that they considered the change meant senior responsible owners needed to be more senior, and were therefore likely to be responsible for several projects.
3.17 However, we are concerned that this increased clarity is reduced by turnover of senior responsible owners. It is not normal practice for them to be responsible for a project from beginning to end. Our analysis of senior responsible owners’ turnover for the 73 projects that have remained in the Portfolio shows that only 4 projects (5%) have had a single senior responsible owner responsible for the project over a 4-year period (Figure 12). Some 56% of projects have had at least 2 changes in senior responsible owner.
3.18 The Committee of Public Accounts has raised concerns about senior responsible owners having responsibility for several projects (paragraph 1.6). In June 2015, we found that while most senior responsible owners (84%) are responsible for a single project in the Portfolio, a small number (16%) are still responsible for 2 or more projects. This was mainly in the Ministry of Defence where, given the large numbers of defence projects in the Portfolio, it was not unusual for senior responsible owners to have more than one project in the Portfolio. The Authority told us that in some cases the senior responsible owner has programme responsibility for 2 or more related projects in the Portfolio.

Delivering major projects in government: a briefing for the Committee of Public Accounts Part Three 35
Figure 12The number of senior responsible owner (SRO) changes for the 73 projects listed in the Portfolio between September 2012 and June 2015
Only 4 projects (5%) have had a single SRO responsible for the project over a 4-year period, and 56% of projects have had at least 2 changes in SRO
Note
1 There is a single SRO for the three projects in the broadband programme within the Department for Culture, Media & Sports. A new SRO was appointed in April 2014.
Source: National Audit Offi ce analysis of the Major Projects Authority’s and Ministry of Defence data
Number of projects
30
25
20
15
10
5
00
SRO changes1
SRO change2
SRO changes3
SRO changes4
SRO changes5
SRO changes
National Crime Agency
Department for International Development
Department for Environment, Food & Rural Affairs
Cabinet Office
Office for National Statistics
Foreign & Commonwealth Office
Department of Health
Home Office
Department for Work & Pensions
Department for Culture, Media & Sport
Department for Business, Innovation & Skills
Ministry of Justice
Department for Transport
Department of Energy & Climate Change
Ministry of Defence

36 Appendix One Delivering major projects in government: a briefing for the Committee of Public Accounts
Appendix One
Our audit approach
1 This briefing provides an overview of progress in improving the delivery of major government projects. We reviewed:
• data on time, cost and risk which is used to measure project performance; and
• the initiatives designed to improve the oversight and delivery of projects.
2 Our audit approach is summarised in Figure 13. Our evidence base is described in Appendix Two.
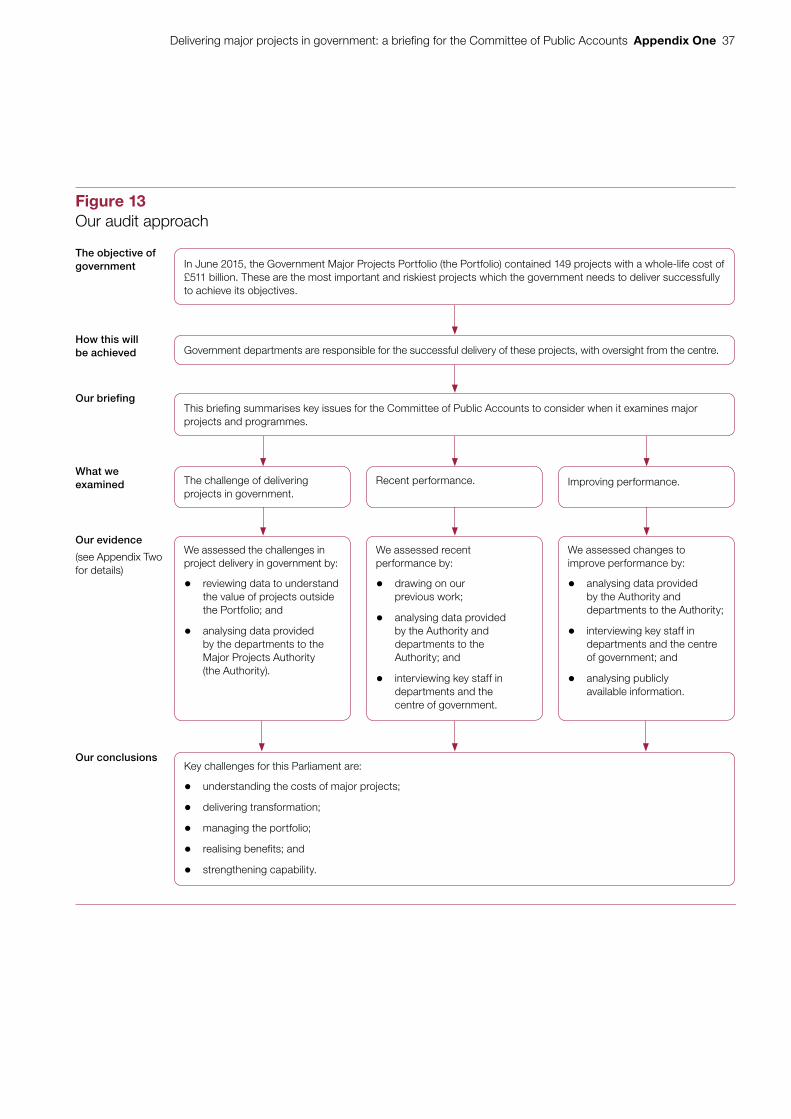
Delivering major projects in government: a briefing for the Committee of Public Accounts Appendix One 37
Figure 13Our audit approach
The objective of government
How this will be achieved
Our briefing
What we examined
Our evidence
(see Appendix Two for details)
Our conclusions
We assessed the challenges in project delivery in government by:
• reviewing data to understand the value of projects outside the Portfolio; and
• analysing data provided by the departments to the Major Projects Authority (the Authority).
We assessed changes to improve performance by:
• analysing data provided by the Authority and departments to the Authority;
• interviewing key staff in departments and the centre of government; and
• analysing publicly available information.
The challenge of delivering projects in government.
Improving performance.Recent performance.
We assessed recent performance by:
• drawing on our previous work;
• analysing data provided by the Authority and departments to the Authority; and
• interviewing key staff in departments and the centre of government.
In June 2015, the Government Major Projects Portfolio (the Portfolio) contained 149 projects with a whole-life cost of £511 billion. These are the most important and riskiest projects which the government needs to deliver successfully to achieve its objectives.
Government departments are responsible for the successful delivery of these projects, with oversight from the centre.
This briefing summarises key issues for the Committee of Public Accounts to consider when it examines major projects and programmes.
Key challenges for this Parliament are:
• understanding the costs of major projects;
• delivering transformation;
• managing the portfolio;
• realising benefits; and
• strengthening capability.

38 Appendix Two Delivering major projects in government: a briefing for the Committee of Public Accounts
Appendix Two
Our evidence base
1 We formed our conclusions based on findings from our analysis of evidence reviewed between June and October 2015. Our audit approach is at Appendix One. Our study focused on major project delivery and reporting across government and covers the bodies involved.
2 We assessed the challenge in delivering projects in government.
• We carried out an analysis of data provided by departments and HM Treasury’s capital spend data for the public sector as a whole to understand the value of projects outside the Government Major Projects Portfolio (the Portfolio).
• We drew on Infrastructure UK’s national infrastructure pipeline to identify the types of projects not included in the Portfolio.
• We analysed departments’ June 2015 submissions to the Major Projects Authority (the Authority) to identify the type, number and whole-life cost of projects in the Portfolio by department.
• We discussed the challenges of project delivery with senior responsible owners, and project delivery heads of the profession, other stakeholders in central government and other project delivery professionals, and reviewed recent relevant literature on project delivery in the public and private sectors.
3 We assessed recent performance.
• We drew on our past work, for example our report on Major Projects Authority Annual Report 2013-14.
• We analysed the data the Authority used to support its three annual reports in 2013, 2014 and 2015 and the departments’ most recent submission to the Authority in June 2015. We used the data to understand:
• how the Portfolio’s whole-life costs changed over time and the underlying reasons for the change;
• how the Portfolio’s delivery confidence ratings changed over time; and
• the benefits data submitted by departments to the Authority.
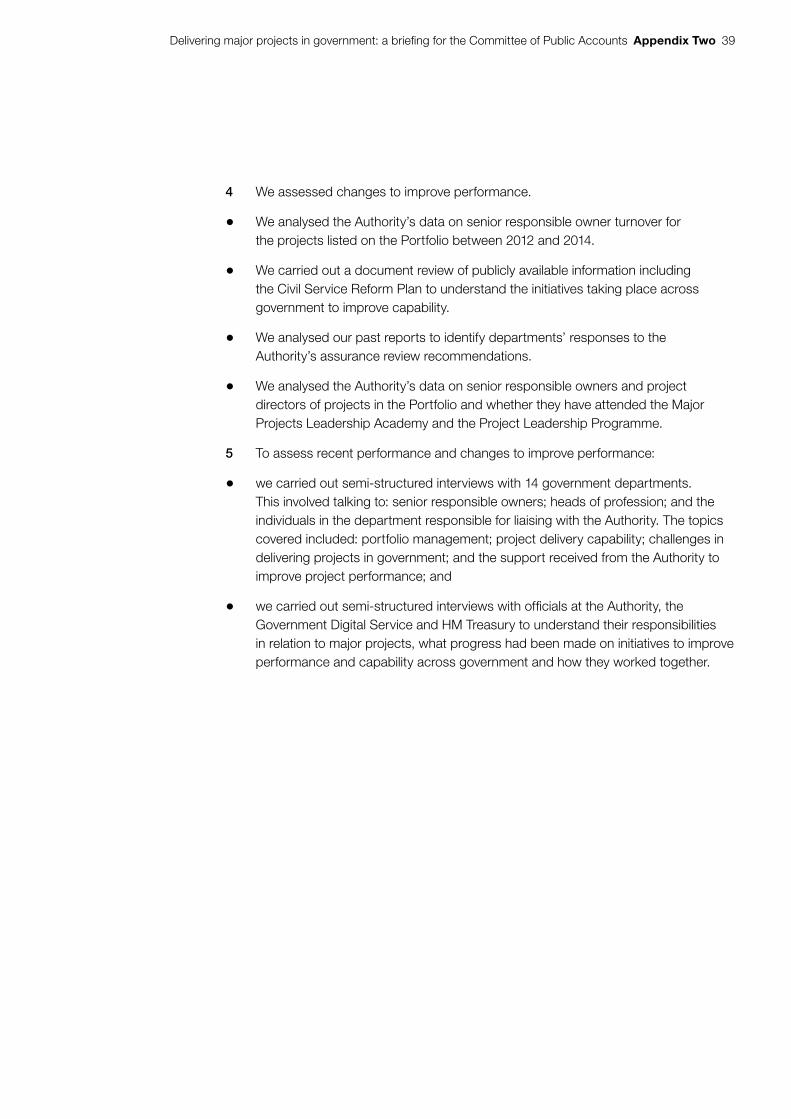
Delivering major projects in government: a briefing for the Committee of Public Accounts Appendix Two 39
4 We assessed changes to improve performance.
• We analysed the Authority’s data on senior responsible owner turnover for the projects listed on the Portfolio between 2012 and 2014.
• We carried out a document review of publicly available information including the Civil Service Reform Plan to understand the initiatives taking place across government to improve capability.
• We analysed our past reports to identify departments’ responses to the Authority’s assurance review recommendations.
• We analysed the Authority’s data on senior responsible owners and project directors of projects in the Portfolio and whether they have attended the Major Projects Leadership Academy and the Project Leadership Programme.
5 To assess recent performance and changes to improve performance:
• we carried out semi-structured interviews with 14 government departments. This involved talking to: senior responsible owners; heads of profession; and the individuals in the department responsible for liaising with the Authority. The topics covered included: portfolio management; project delivery capability; challenges in delivering projects in government; and the support received from the Authority to improve project performance; and
• we carried out semi-structured interviews with officials at the Authority, the Government Digital Service and HM Treasury to understand their responsibilities in relation to major projects, what progress had been made on initiatives to improve performance and capability across government and how they worked together.
40 Appendix Three Delivering major projects in government: a briefing for the Committee of Public Accounts
Appendix Three
National Audit Office and Committee of Public Accounts reports referenced in the report
Paragraph 1.6
Progress made
Comptroller and Auditor General, Ministry of Defence, Major Projects Report 2015 and the Equipment Plan 2015 to 2025, Session 2015-16, HC 488-1, October 2015.
Comptroller and Auditor General, Department for Transport, Lessons from major rail infrastructure programmes, Session 2014-15, HC 267, January 2015.
Measuring costs and benefits
Comptroller and Auditor General, Department for Transport, The completion and sale of High Speed 1, Session 2010–2012, HC 1834, March 2012.
Comptroller and Auditor General, Department for Transport, Crossrail, Session 2013-14, HC 965, January 2014.
Comptroller and Auditor General, Department for Transport, High Speed 2: A review of early programme preparation, Session 2013-14, HC 124, May 2013.
Comptroller and Auditor General, Department of Energy & Climate Change, Update on preparations for Smart Metering, Session 2014-15, HC 167, June 2014.
Comptroller and Auditor General, Ministry of Defence, Army 2020, Session 2014-15, HC 263, June 2014.
Comptroller and Auditor General, Department for Transport, Lessons from major rail infrastructure programmes, Session 2014-15, HC 267, January 2015.
Comptroller and Auditor General, Department for Work & Pensions, Universal Credit: progress update, Session 2014-15, HC 786, November 2014.

Delivering major projects in government: a briefing for the Committee of Public Accounts Appendix Three 41
Early planning
HC Committee of Public Accounts, Ministry of Defence: The Major Projects Report 2011, Sixty-eighth Report of Session 2010–2012, HC 1678, February 2012.
Comptroller and Auditor General, Department for Work & Pensions, Support to incapacity benefits claimants through Pathways to Work, Session 2010-11, HC 21, May 2010.
Comptroller and Auditor General, Department for Transport, Lessons from cancelling the InterCity West Coast franchise competition, Session 2012-13, HC 796, December 2012.
Comptroller and Auditor General, Department for Work & Pensions, Personal Independence Payment: early progress, Session 2013-14, HC 1070, February 2014.
Comptroller and Auditor General, Department for Work & Pensions, Universal Credit: progress update, Session 2014-15, HC 786, November 2014.
Comptroller and Auditor General, Department of Health, Department for Communities and Local Government and NHS England, Planning for the Better Care Fund, Session 2014-15, HC 781, November 2014.
Portfolio management
HC Committee of Public Accounts, Major Projects Authority, Tenth Report of Session 2014-15, HC 147, July 2014.
Comptroller and Auditor General, Funding and structures for local economic growth, Session 2013-14, HC 542, December 2013.
Comptroller and Auditor General, Department of Health, Emergency admissions to hospital: managing the demand, Session 2013-14, HC 739, October 2013.
Comptroller and Auditor General, Department for Transport, Lessons from major rail infrastructure programmes, Session 2014-15, HC 267, January 2015.
Capability
Comptroller and Auditor General, Identifying and meeting central government’s skills requirements, Session 2010–2012, HC 1276, July 2011.
Comptroller and Auditor General, Department for Transport, Lessons from major rail infrastructure programmes, Session 2014-15, HC 267, January 2015.
Comptroller and Auditor General, Ministry of Defence, Defence Equipment and Support, Reforming defence acquisition, Session 2014-15, HC 946, February 2015.
HC Committee of Public Accounts, Update on preparations for smart metering, Twelfth Report of Session 2014-15, HC 103, September 2014.
HC Committee of Public Accounts, Procuring new trains, Twenty-fourth Report of Session 2014-15, HC 674, December 2014.

42 Appendix Three Delivering major projects in government: a briefing for the Committee of Public Accounts
Accountability
Comptroller and Auditor General, Department for Transport, Lessons from cancelling the InterCity West Coast franchise competition, Session 2012-13, HC 796, December 2012.
HC Committee of Public Accounts, Ministry of Defence: The Major Projects Report 2011, Sixty-eighth Report of Session 2010–2012, HC 1678, February 2012.
Comptroller and Auditor General, Department for Work & Pensions, Child maintenance 2012 scheme: early progress, Session 2014-15, HC 173, June 2014.
HC Committee of Public Accounts, Transforming contract management, Twenty-third Report of Session 2014-15, HC 585, November 2014.
Paragraph 1.9
HC Committee of Public Accounts, Major Projects Authority, Tenth Report of Session 2014-15, HC 147, July 2014.
Paragraph 1.10
Comptroller and Auditor General, Cross-government, Managing budgeting in government, Session 2012-13, HC 597, October 2012.
Paragraph 1.11
Comptroller and Auditor General, Lessons for major service transformation, National Audit Office, May 2015.
Paragraph 2.18
Comptroller and Auditor General, Department for Transport, The completion and sale of High Speed 1, Session 2010–2012, HC 1834, March 2012.
Comptroller and Auditor General, Cross-government, Evaluation in government, December 2013.
Paragraph 3.9
Comptroller and Auditor General, HM Treasury and Cabinet Office, Assurance for major projects, Session 2010–2012, HC 1698, May 2012.

Delivering major projects in government: a briefing for the Committee of Public Accounts Appendix Three 43
Paragraph 3.11
Comptroller and Auditor General, Department for Work & Pensions, Universal Credit: early progress, Session 2013-14, HC 621, September 2013.
Comptroller and Auditor General, Department for Transport, High Speed 2 – A review of early programme preparation, Session 2013-14, HC 124, May 2013.
Comptroller and Auditor General, Department for Transport, Progress in delivering the Thameslink programme, Session 2013-14, HC 227, June 2013.
Comptroller and Auditor General, Department for Transport, Crossrail, Session 2013-14, HC 965, January 2014.

This report has been printed on Evolution Digital Satin and contains material sourced from responsibly managed and sustainable forests certified in accordance with the FSC (Forest Stewardship Council).
The wood pulp is totally recyclable and acid-free. Our printers also have full ISO 14001 environmental accreditation, which ensures that they have effective procedures in place to manage waste and practices that may affect the environment.

£10.00
9 781786 040206
ISBN 978-1-78604-020-6
Design and Production by NAO Communications DP Ref: 10890-001