delineating hydrocarbon bearing zones using elastic impedance inversion...
TRANSCRIPT
Iranian Journal of Oil & Gas Science and Technology, Vol. 2 (2013), No. 2, pp. 8-19
http://ijogst.put.ac.ir
Delineating Hydrocarbon Bearing Zones Using Elastic Impedance
Inversion: A Persian Gulf Example
H. Karbalaali1, S. R. Shadizadeh
2*, and M. Ali Riahi
3
1,2 Department of Petroleum Engineering, Petroleum University of Technology (PUT), Abadan, Iran 3 Institute of Geophysics, University of Tehran, Tehran, Iran
Abstract
Reservoir characterization plays an important role in different parts of an industrial project. The
results from a reservoir characterization study give insight into rock and fluid properties which can
optimize the choice of drilling locations and reduce risk and uncertainty. Delineating hydrocarbon
bearing zones within a reservoir is the main objective of any seismic reservoir characterization
study. In the current study, using limited well control and seismic data, an attempt was made to
predict the productive zones of a reservoir using elastic impedance inversion. Elastic impedance logs
at near and far angles of incidence have been crossplotted to find the desired productive parts of the
formation. Two partial angle stack seismic data have been inverted using a model-based post-stack
seismic inversion. The crossplot of the two inverted volumes is interpreted based on the results from
the well location. Finally, the hydrocarbon bearing zones of the reservoir was delineated according
to the seismic crossplot analysis.
Keywords: Elastic Impedance Inversion, Partial Angle Stack, Elastic Impedance Log, Crossplot
Analysis.
1. Introduction
A detailed study of the static behavior of a producing hydrocarbon reservoir is essential for the
development planning of the reservoir and to reduce risk and uncertainty in choosing new drilling
locations (Torres and Sen, 2004). The discrimination of lithology and fluid within the reservoir is an
important objective in any seismic reservoir characterization studies. As the reflected seismic wave
amplitudes are functions of acoustic/elastic impedances, they can be interpreted in terms of rock
properties (lithology, fluid type, and saturation) and even used as direct hydrocarbon indicators
(Prskalo, 2007).
Full angle stack seismic data often fail to maintain the fluid information and therefore result in an
inaccurate reservoir characterization. The effort to recover information regarding incidence angles and
compressional and shear wave velocities through elastic impedance inversion may aggravate our
understanding of the reservoir properties particularly lithology and fluid content (Zhou et al., 2009).
The current study is on an oilfield in Persian Gulf. The field is a NW-SE trending anticline dipping by
1-1.5 degrees. Hydrocarbon is produced from the Oligocene-Miocene Ghar formation having a
vertical closure of 62 meters. The reservoir consists of three units: upper Asmari carbonate, Ghar
sandstone, and lower Asmari carbonate. The target in this study is the Ghar formation which consists
dominantly of sandstone with interbedded dolomite, shale, and nodular anhydrite. Ghar formation is
* Corresponding Author
Email: [email protected]

H. Karbalaali et al. / Delineating Hydrocarbon Bearing Zones … 9
equivalent to onshore Ahwaz member (Asgharzadeh, 2006). The stratigraphy column of Persian Gulf
is demonstrated in Figure 2. Pre-stack time migrated (PSTM) seismic data, seismic horizons, and the
well log data of one well is used herein.
However, like all seismic derived approaches, this technique is not one of a kind and needs to be
validated with other methods and data (Prakash et al., 2012).
Figure1
The stratigraphy column of Persian Gulf (Fugro-Jason report, 2003)
2. Theory
It is possible to process 3D data sets as partial offset/angle stacks. However, there should be a great
caution where these near- and far-offset stacks are calibrated and inverted. The amplitudes of far-offset
stack data can be tied to well logs using synthetics based on a function called elastic impedance (EI),
which is similar in nature to acoustic impedance (AI). EI provides a new approach to calibrate and
invert variable incidence angle seismic data in a fashion analogous to zero-offset data. Like acoustic
impedance (AI), EI has been introduced as a linearization to Zoeppritz equations. For small changes of
elastic parameters for subcritical angles (Shuey, 1985), one has:
( ) 2 2 2sin sin tanR A B Cθ θ θ θ= + + (1)
where, θ is incidence angle and A, B, and C are defined as follows:
1 2
p
p
VA
Vρρ
∆ ∆= +
2 2
4 2 2
p s s s
p p s p
V V V VB
V V V Vρρ
∆ ∆ ∆= − −
1 2
p
p
VC
V
∆=
where, Vp, Vs and � are the average values of P-wave, S-wave, and density respectively.
A function f(t), similar to acoustic impedance in characteristics, is required so that for any incidence
angle �, reflectivity can be derived from Equations 1-2. Calling this function elastic impedance and
using log derivation for reflectivity which is accurate for small to moderate changes in impedance
(Connolly, 1999), one may obtain:

10 Iranian Journal of Oil & Gas Science and Technology, Vol. 2 (2013), No. 2
( ) ( ) ( )( ) ( )
1
1
i i
i i
f t t
t
fR
f t fθ −
++−
= (2)
( ) 1 2
EIREI
θ ∆= (3)
As might be expected, EI is a function of compressional and shear wave velocities, density, and
incidence angle. By considering the incidence angle � fixed for any layer throughout the reflection
sequence, an angle-dependent EI can be defined by an analogy from AI.
Assuming this K to be constant, the following equation for EI was obtained (Connolly, 1999):
( ) ( ) ( ) ( )2 2 21 tan 8 sin 1 4 sin. .
K K
P SEI V Vθ θ θ
θ ρ+ − −
= (4)
where, Vp is P-wave velocity;Vs stands for S-wave velocity; ρ and K represent density and Vs/Vp)2
respectibvely.
The accuracy of lithology, fluid, and porosity discrimination based on EI was an outstanding
achievement in the use of seismic AVO attributes (Maver and Rasmussen, 2004).
The first step in elastic impedance inversion is the construction of appropriate angle stacks. For this
reason, traces reflecting at a common midpoint are gathered and sorted by offset. The processing
sequence needs to remove the NMO effect while preserving the true amplitudes (Li-deng et al., 2009).
Proper conditioning needs to be applied to the pre-stack seismic data so as to remove unwanted effects
and enhance the SNR in order to obtain more accurate results from the study (Veeken and Silva, 2004;
Anderson, 2009; Singleton, 2009). For isotropic layer cake geometry, an offset less than depth and an
incidence angle less than 35 degrees, the following expression relates incidence angle to offset domain
(Connolly, 1999):
( ) ( )2 2
2
2 2 2 20
sin i
r r
x v
v x v tθ =
+ (5)
where, vi is interval velocity; vr stands for RMS velocity; x and t0 represent offset and zero-offset two
way time respectively.
A recent approach to inversion introduced by Russell and Hampson (1991) is a model-based inversion
in which an initial low frequency model is updated iteratively to give the best match to seismic data
(Russell et al., 2006). Prior to performing inversion, well log data should be correlated to seismic data.
Whitecombe et al. (2002), Mercado et al. (2003), Gomez and Castagna (2005), Francis (2006),
Jinghua et al. (2007), Daxing et al. (2009) and Swisi (2009) used elastic impedance inversion for
predicting rock and fluid properties.
Rock and fluid properties obtained in the well location can be generalized (deterministically or
geostatistically) throughout the whole seismic volume in case a reliable match is observed between
well log and seismic data (Pelletier and Gunderson, 2004). Simm et al., (2002), Perez and Tonn
(2003), Quijada (2009) and Silva and Garcia (2011) used the crossplot analysis of elastic attributes in
well locations to determine cut-off values for delineating different lithofacies. Abdollahi Fard and
Riazi (2012) used crossplot analysis to define the relationship between the lame attribute of
incompressibility (λρ) and water saturation.

H. Karbalaali et al. / Delineating Hydrocarbon Bearing Zones … 11
3. Methodology
First of all, two partial angle stacks, one at near angle of incidence and the other at far angle are
constructed. The appropriate angle range for producing the partial angle stacks has been determined by
investigating the amplitude coverage at the horizon of interest. Second, an appropriate wavelet needs
to be extracted from each partial stack in order to correlate the time-based seismic data to depth-driven
logs. These wavelets will be used in the inversion process as well. The model-based seismic inversion
approach is used in this study using two elastic impedance logs at near and far incidence angles and
two interpreted horizons. In the next phase, elastic impedance log at near incidence angle is
crossplotted against elastic impedance log at far incidence angle to delineate the productive zones
within the reservoir. Finally, the results of the crossplot analysis in the well location can be
generalized to the whole volume of study through seismic crossplot analysis.
4. Case study
Figures 2 a-f illustrate the crossplot of elastic impedance (EI) versus P-impedance (PI) at different
angles of incidence. As it is obvious from the figures, there is no separation up to 30 degrees.

12 Iranian Journal of Oil & Gas Science and Technology, Vol. 2 (2013), No. 2
Figure 2
The crossplot of elastic impedance versus P-impedance in the well location; the elastic impedance logs are
computed at (a) 5°, (b) 10°, (c) 15°,(d) 20°, (e) 25°, and (f) 30°. The color key is vertical depth.
Figure 3, however, demonstrates the capability of elastic impedance at 35 degrees to specify the
producing trend within the reservoir with respect to P-impedance. This is a three-dimensional
crossplots in which water saturation is the color key. This figure confirms that elastic impedance
inversion at far incidence angles outweighs conventional post-stack seismic inversion.
Figure 3
The crossplot of elastic impedance versus P-impedance in the well location. The color key is water saturation;
Note the ability of this crossplot to specify producing trend.
To perform elastic impedance inversion, partial angle stacks are required. As it is displayed in Figure
4, the analysis for obtaining a proper angle range for generating partial angle stacks of seismic data
reveals two appropriate ranges one for angles between 0-28 and the other for the angle range of 28-42
degrees.

H. Karbalaali et al. / Delineating Hydrocarbon Bearing Zones … 13
Figure 4
The analysis of a proper angle range for generating partial angle stacks from seismic data. The horizontal axis is
inline number and the vertical axis is time.
Two partial angle stacks obtained for near- and far-angle ranges are shown in Figure 5 a and 5b
respectively. The higher amplitudes of reflections in the near-angle stack compared to the far-angle
stack section is obvious.
Figure 5
The range-limited stack seismic data at an inline number of 250; (a) near-angle and (b) far-angle stack. The
horizontal axis is cross-line number and the vertical axis is time.

14 Iranian Journal of Oil & Gas Science and Technology, Vol. 2 (2013), No. 2
As described before, the well logs are measured in depth while seismic data are in time domain. At
first, the sonic log is corrected using check shot data so that the log data can be shown in a time
domain. The next step is the generation of a synthetic seismogram using the sonic and density logs and
an extracted wavelet from each partial angle stack seismic data. The best wavelet length is determined
to be 200 ms with a taper of 15 ms. The phase of the wavelet is set to be constant. The correlation is
not very acceptable since the seismic data alone are used for the synthetic generation. The final step is
to define the correct phase of the wavelet using log data and then applying a minor shifting if
necessary to get an optimum match. It should be noted that applying stretch and squeeze to logs should
be done with caution. Figure 6a and 6b are the final extracted wavelets from near-angle stack seismic
data using well logs both in time and frequency domains respectively. Figure 7a and 7b are also the
final extracted wavelets from far-angle stack seismic data using well logs both in time and frequency
domains respectively. In time domains, the horizontal axis is time and the vertical axis is amplitude. In
frequency domains, the horizontal axis is frequency while the vertical axis is amplitude. The red line
illustrates the phase for each of the frequency components.
Figure 6
The final wavelet for the synthetic seismogram generation using log data for near-angle stack seismic data in (a)
time domain and (b) frequency domain.
Figure 7
The final wavelet for the synthetic seismogram generation using log data for far-angle stack seismic data in (a)
time domain and (b) frequency domain.

H. Karbalaali et al. / Delineating Hydrocarbon Bearing Zones … 15
Figures 8 and 9 are the final synthetic seismograms generated from the most recent extracted wavelets
for near- and far-angle stacks respectively. The excellent match between the synthetic and composite
trace in the figures should be noted. Moreover, the strong peak at the top of Ghar formation due to a
lithology change from upper Asmari carbonate to Ghar sandstone is notable. In fact, top Ghar should
demonstrate a reduction in acoustic impedance; however, the phase of the seismic data is negative here
and it is indicated as a peak in the section due to the negative phase of the wavelet. The same
explanation can be applied to the base horizon.
Figure 8
The final synthetic seismogram generated for the well using the latest wavelet extracted from near-angle stack
seismic volume and the logs.
Figure 9
The final synthetic seismogram generated for the well using the latest wavelet extracted from far-angle stack
seismic volume and the logs.
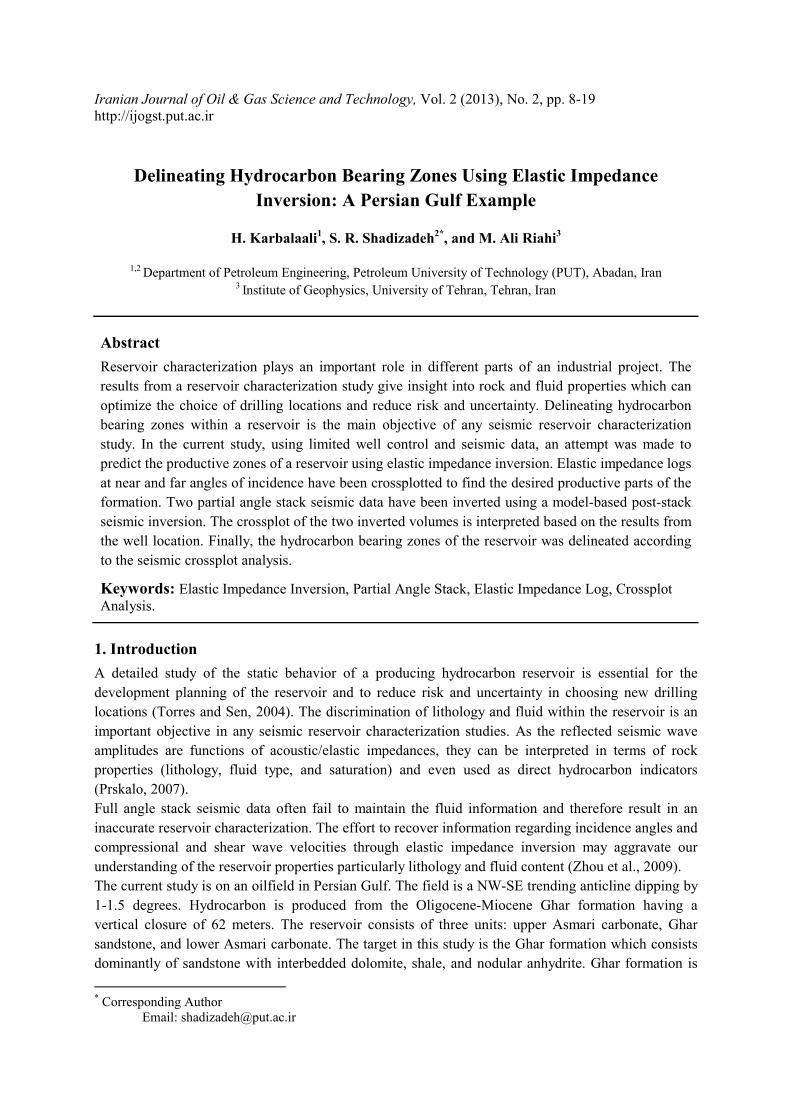
Elastic impedance logs at 14 and 35 degrees are used to build the initial low frequency models for the
inversion of near-angle and far-angle stack seismic volumes respectively. Afterwards, the inversion
parameters are analyzed in the well location. In case the parameter analysis is satisfactory, the
inversion results will be applied to the whole seismic volume. Figures 10 and 11 display the elastic
impedance inversion results applied to the near- and far-angle stack seismic volumes respectively.
This technique is successful in discriminating the low impedance reservoir zone among the higher
impedance upper and lower layers. The target reservoir is indicated in the figures. The difference in
the near and far angle inversion results should be considered in locating the hydrocarbon bearing
zones. As it is apparent from the figures, the far angle inversion result is more prosperous in defining
the hydrocarbon beating parts of the reservoir. This is reasonable since the far angle stack data contain
the information on shear wave velocity, which is helpful in differentiating the fluid effect on seismic
sections.
16 Iranian Journal of Oil & Gas Science and Technology, Vol. 2 (2013), No. 2
Figure 10
The elastic impedance inversion results applied to the whole near stack seismic volume
Figure 11
The elastic impedance inversion results applied to the whole far stack seismic volume
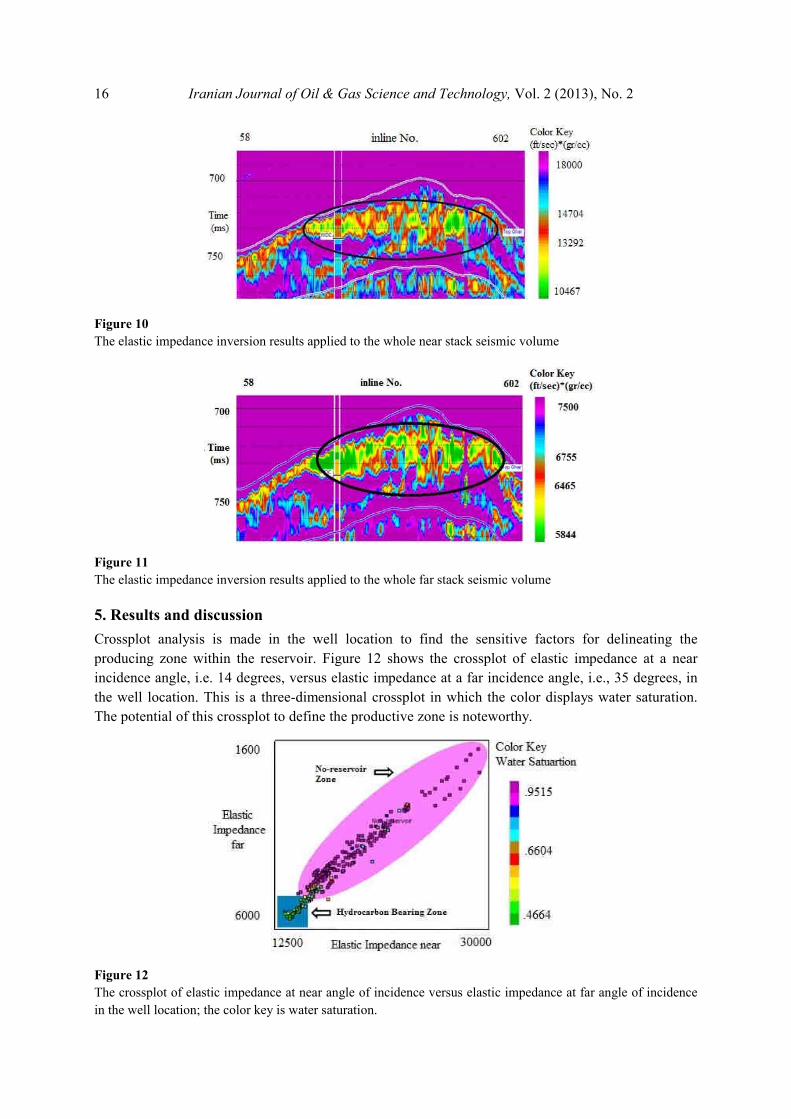
5. Results and discussion
Crossplot analysis is made in the well location to find the sensitive factors for delineating the
producing zone within the reservoir. Figure 12 shows the crossplot of elastic impedance at a near
incidence angle, i.e. 14 degrees, versus elastic impedance at a far incidence angle, i.e., 35 degrees, in
the well location. This is a three-dimensional crossplot in which the color displays water saturation.
The potential of this crossplot to define the productive zone is noteworthy.
Figure 12
The crossplot of elastic impedance at near angle of incidence versus elastic impedance at far angle of incidence
in the well location; the color key is water saturation.

H. Karbalaali et al. / Delineating Hydrocarbon Bearing Zones … 17
The results from the crossplot analysis in the well location is now applied to the whole seismic
volume. Figure 13 displays the crossplot of elastic impedance of near angle stack seismic volume
versus elastic impedance of far angle stack seismic volume. The hydrocarbon bearing sandstones are
defined as a square in the figure. The color key is TWT.
Figure 13
The crossplot of elastic impedance of near angle stack seismic volume versus elastic impedance of far angle
stack seismic volume; the color key is the TWT.
Figure 14 shows the cross section of a seismic volume at an inline number of 250 at which the
predicted hydrocarbon bearing sandstones are depicted.
Figure 14
The cross section of seismic volume at an inline number of 250 at which the hydrocarbon bearing zone is
depicted.
6. Conclusions
• In the current study, an elastic impedance inversion is carried out on the seismic data. The
maximum angular coverage on the horizon of interest is observed to be 42 degrees. In
addition, the elastic impedance inversion should be done on partial angle stacks. To do so, the
amplitude coverage on the horizon of interest has been investigated to find the proper near and
far angle ranges for generating range-limited stacks. The near angle stack is obtained from
seismic data in the range of 0-28 degrees while the far angle stack is produced from the
seismic data in the range of 28-42 degrees;
• The reduction of elastic impedance in both near and far angle ranges delineated the reservoir
zone among the high impedance upper and lower layers. However, the inversion results at a
far angle of incidence revealed more details than the near-angle volume;
• The crossplot of elastic impedance at a near incidence angle, i.e. 14 degrees, versus elastic
impedance at a far incidence angle, i.e. 35 degrees, is analyzed in the well location to specify

18 Iranian Journal of Oil & Gas Science and Technology, Vol. 2 (2013), No. 2
the hydrocarbon bearing sandstones using the water saturation logs as the third dimension.
The results are consistent with the WOC depth at the well;
• The crossplot of elastic impedance inversion results at a near incidence angle versus elastic
impedance inversion results at a far incidence angle is interpreted based on the crossplot
results in the well location to delineate the producing zone throughout the entire volume of
study;
• In this study, the attribute analysis in the well location is generalized to the whole seismic
volume, which facilitates a reconnaissance view for exploration and developing plans.
Acknowledgement
The authors would like to appreciate NIOC Exploration Directorate for providing the necessary data
set and especially Mr. Sokooti and Mr. Khoshdel for their endless supports.
References
Abdollahi Fard, I. and Riazi, N., Prediction of Hydrocarbon Saturation by Results of Simultaneous
Seismic Inversion through Lame Parameters in a Carbonate Reservoir, 15th Geophysical
Conference, Iran, 2012.
Anderson, P.F., Comparing Post-stack AVO Inversion to Pre-stack Inversion for Estimating Rock
Properties, CPS/CSEG Convention, Calgary, Canada, 2009.
Asgharzadeh, M., The Offshore Iranian Oil Company Report, 2006.
Barclay F., Bruun A., Alfaro J., Cooke A., Cooke D., Godfrey R., Volterrani S., Roberts R., Seismic
Inversion: Reading between the Lines, Oilfield Review, p. 42-63, 2008.
Connolly P., Elastic Impedance, the Leading Edge, Vol. 18, No. 4, p. 438-452, 1999.
Daxing W., Mengbo, Z., Mengli, Z., Application of Pre-stack Elastic Parameter Crossplot Technology
in Gas Bearing Reservoir Prediction, 1039, CPS/SEG Beijing International Conference &
Exposition, Beijing, China, 24-27 April, 2009.
Francis A. M., Porosity and Shale Volume Estimation for the Ardmore Field Using Extended Elastic
Impedance, EAGE 68th Conference and Exhibition, 12-15 June, 2006.
Gomez and Castagna, P., Lithology and Fluid Seismic Determination for the ACAE Area, Colombia,
CT&F Ciencia Technologia Futuro, p. 35-44, 2005.
Jinghua, Y., Guofa, L., Yang, L., and Weidong J., The Application of Elastic Impedance Inversion in
Reservoir Prediction at the Jinan Area of Tarim Oilfield, Applied Geophysics, Vol. 4, p. 201-
206, 2007.
Li-deng, G., Xiao-feng D. and Ling-gao L., Application of Petrophysics Base Pre-stack Inversion to
Volcanic Gas Reservoir Prediction in Songliao Basin, CPS/SEG International Geophysical
Conference and Exposition, Beijing, 2009.
Maver, K. G. and Rasmussen K.B., Simultaneous AVO Inversion for Accurate Prediction of Rock
Properties, Offshore Technology Conference (OTC), 16925, Houston, US, 3-6 May, 2004.
Mercado, V., Uribe, R.M., Mendez, J., Francucci, E., Fernandez, F., Piccioni, L. and Graham, D.,
Fluid and Lithology Identification Using Simultaneous Angle Dependent Inversion, Burgos
Basin, Mexico, SEG Annual Meeting , Dallas, Texas ,October 2003.
Pelletier, H. and Gunderson, J., Application of Rock Physics to an Exploration Play: A Carbonate
Case Study from the Brazeau River 3D, The Leading Edge, Vol. 24, No. 5, p. 516-519, 2005.
Perez M. A. and Tonn R., Reservoir Modeling and Interpretation with Lame’s Parameters, The
Leading Edge, Vol. 68, No. 1, p. 29-39, 2003.

H. Karbalaali et al. / Delineating Hydrocarbon Bearing Zones … 19
Prakash P., Singh S.K., Chetia B., Chaudhuri P. K., Mohan S., and Das S.K., 2012, Application of
Advanced Tools for Reservoir Characterization-EEI and Poisson Impedance: a Case Study,
GEOHORIZONS, p. 50-55, January 2012.
Prskalo, S., Application of Relation between Seismic Amplitude, Velocity and Lithology in
Geological Interpretation of Seismic data, Journal of Hungarian Geomathematics, Vol. 2, p. 51-
68, 2007.
Quijada, M. F., Estimating Elastic Properties of Sandstone Reservoirs Using Well Logs and Seismic
Inversion, Msc. Thesis, Department of Geoscience, University of Calgary, Alberta, 160 p, 2009.
Russell, B. and Hampson D., A Comparison of Post-stack Seismic Inversion, 61th Annual
International Meeting, SEG, p. 876-878, 1991.
Russell, B. H., Hampson D. and Bankhead B., an Inversion Primer, CSEG Reorder, Special Edition, p.
96-103, 2006.
Shuey, R. T., A Simplification of the Zoeppritz’s Equations, Geophysics, Vol. 50, No. 4, p. 609-614,
1985.
Silva, J. and Garcia, G., Joint Estimation of Reservoir Saturation and Porosity from Seismic Inversion
Using Stochastic Rock Physics Simulation and Bayesian Inversion, 12th International Congress
of Brazilian Geophysical Society, Brazil, 15-18 August, 2011.
Simm R., Kemper M. and Deo J., AVO Impedance: a New Attribute for Lithology and Fluid
Discrimination, Petex Conference, London, 20-24 December, 2002.
Singleton S., The Effects of Seismic Data Conditioning on Pre-stack Simultaneous Inversion, SEG
Technical Program, Extended Abstract, p. 1506-1510, 2008.
Swisi A., Post- and Pre-stack Attribute Analysis and Inversion of Blackfoot 3D Seismic Data Set,
Msc. Thesis, Department of Geological Sciences, University of Saskatchewan, Saskatoon,154 p,
2009.
Torres C. and Sen M., Integrated Approach for the Petrophysical Interpretation of Post- and Pre-stack
3D Seismic Data, Well Log and Core Data, Geological Information and Production Data via
Bayesian Stochastic Inversion, Third Annual Report, Institute of Geophysics, Texas, 2004.
Veeken, P. C. H. and Silva M. D., Seismic Inversion Methods and Some of Their Constraints, First
Break, Vol. 22, No. 10, p. 47-70, 2004.
Whitcombe, D., Connolly, P., Reagan, R. and Redshaw T., Extended Elastic Impedance for Fluid and
Lithology Prediction, Geophysics, Vol. 67, No. 1, p. 63-67, 2002.
Zhou J. Y., Tao J. Q., Guo Y. B., Zhang X. H. and Qiang M., Rock Physics Based Pre-stack Seismic
Reservoir Characterization-application to Thin Bed, 71th EAGE Conference and Exhibition,
Amsterdam, The Netherlands, 8-11June, 2009.