delineating and assessing saline ground water resources · delineating and assessing saline ground...
TRANSCRIPT

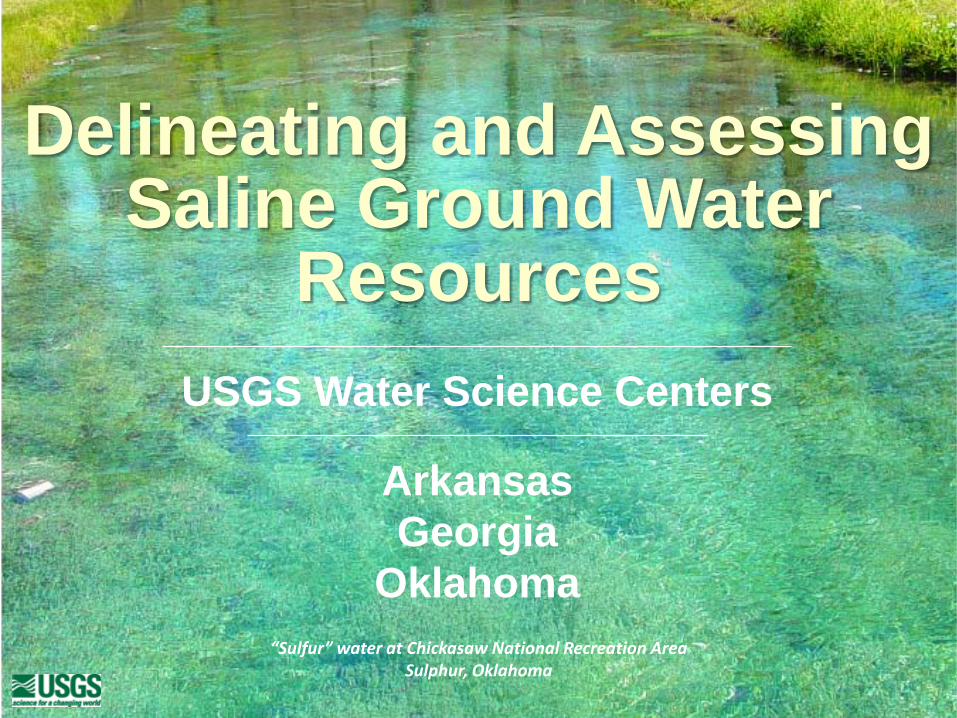
Delineating and Assessing Saline Ground Water
ResourcesUSGS Water Science Centers
ArkansasGeorgia
OklahomA“Sulfur” water at Chickasaw National Recreation Area
Sulphur, Oklahoma
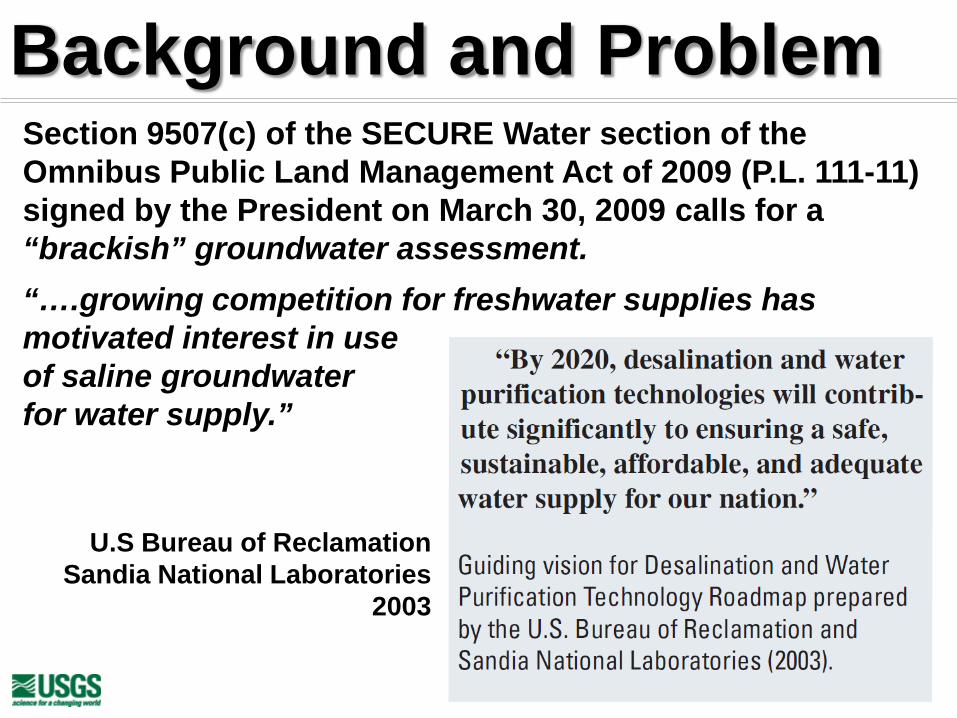
Background and ProblemSection 9507(c) of the SECURE Water section of the Omnibus Public Land Management Act of 2009 (P.L. 111-11) signed by the President on March 30, 2009 calls for a “brackish” groundwater assessment.“….growing competition for freshwater supplies has motivated interest in useof saline groundwaterfor water supply.”
U.S Bureau of ReclamationSandia National Laboratories
2003
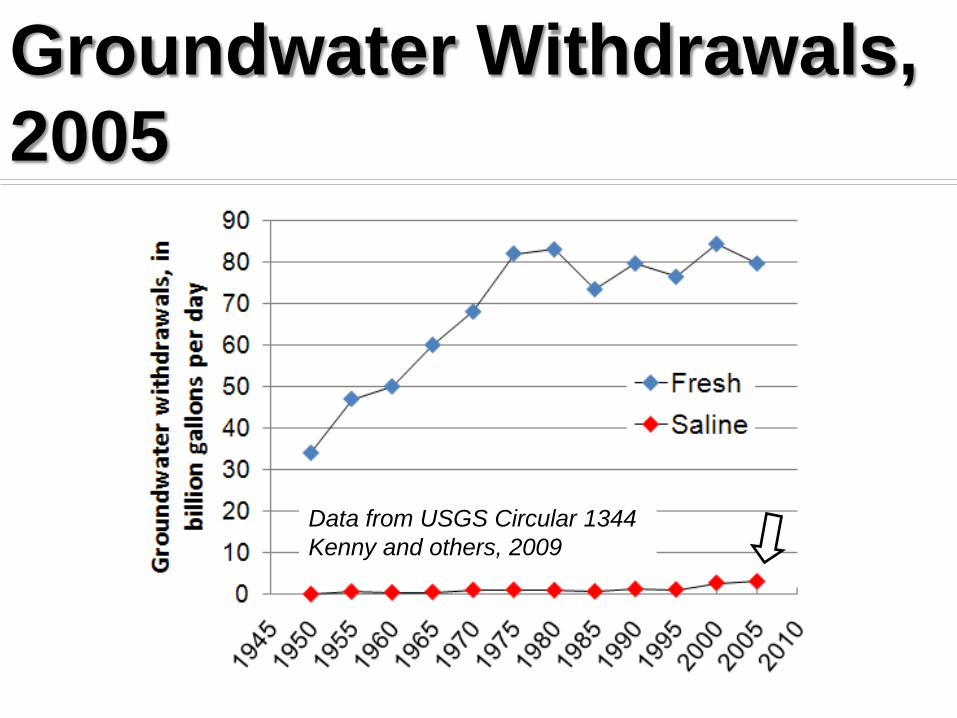
Groundwater Withdrawals, 2005
Data from USGS Circular 1344Kenny and others, 2009
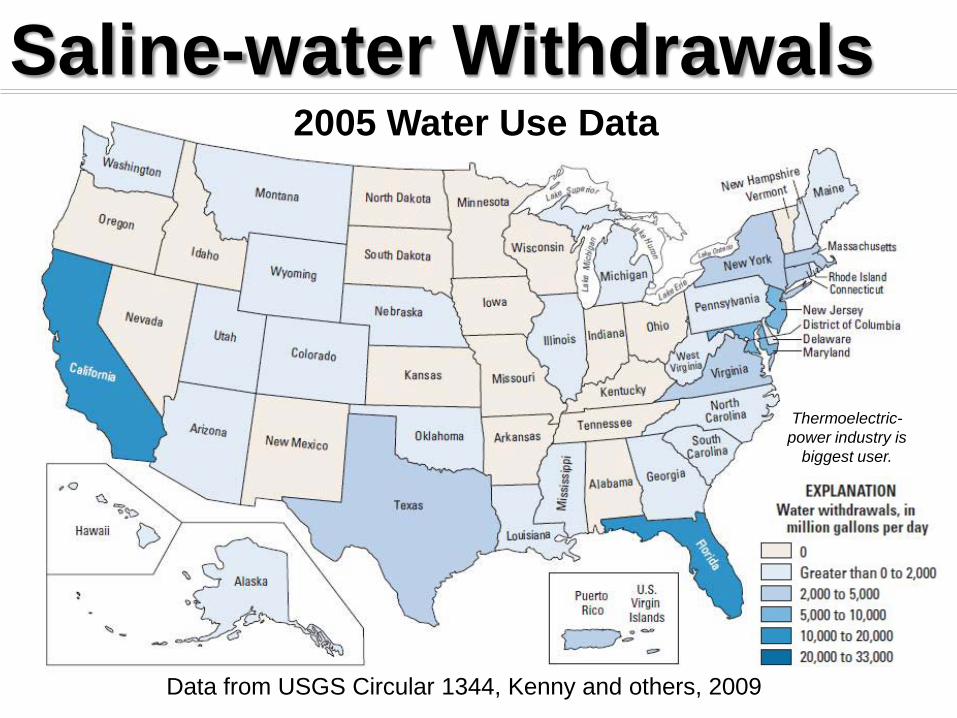
Saline-water Withdrawals
Data from USGS Circular 1344, Kenny and others, 2009
2005 Water Use Data
Thermoelectric-power industry is
biggest user.
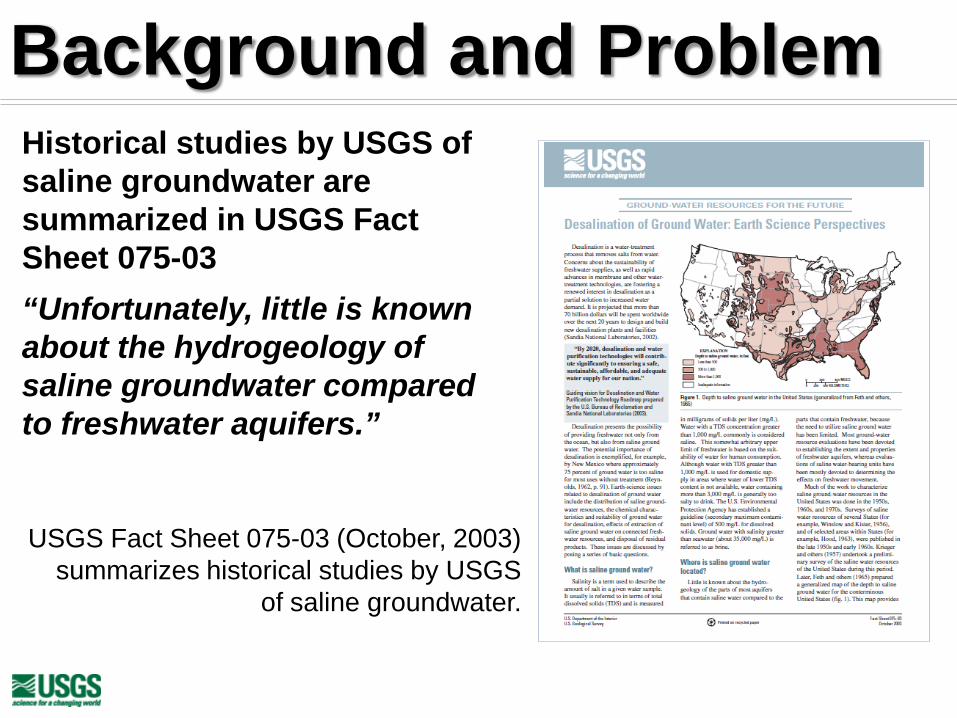
Historical studies by USGS of saline groundwater are summarized in USGS Fact Sheet 075-03“Unfortunately, little is known about the hydrogeology of saline groundwater compared to freshwater aquifers.”
Background and Problem
USGS Fact Sheet 075-03 (October, 2003) summarizes historical studies by USGS
of saline groundwater.

Background and ProblemFeth and others, 1965
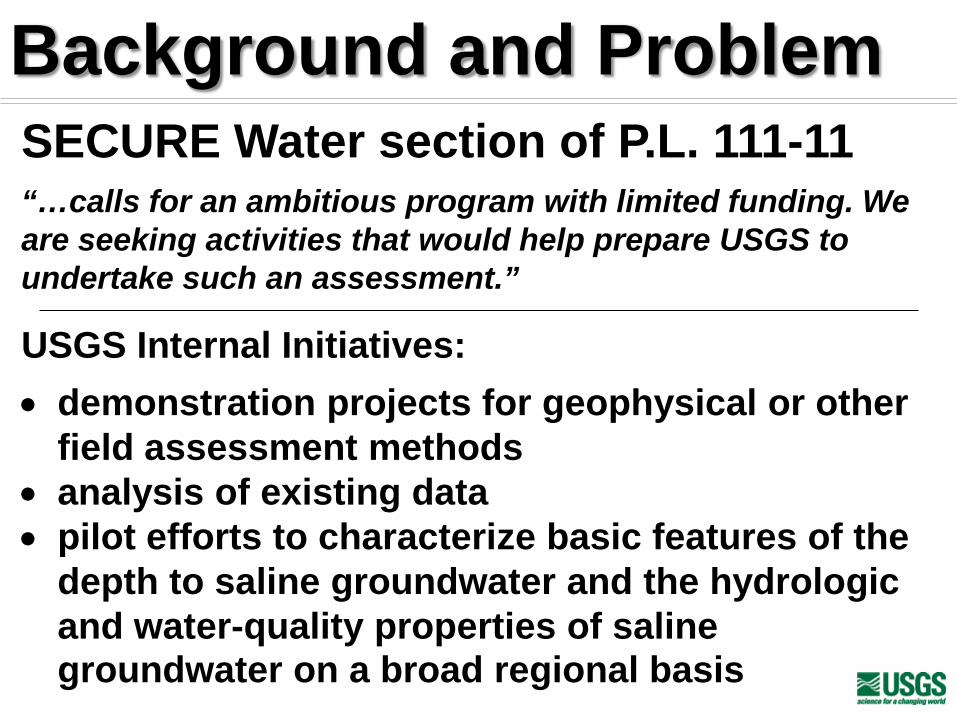
Background and ProblemSECURE Water section of P.L. 111-11 “…calls for an ambitious program with limited funding. We are seeking activities that would help prepare USGS to undertake such an assessment.”
USGS Internal Initiatives:• demonstration projects for geophysical or other
field assessment methods• analysis of existing data• pilot efforts to characterize basic features of the
depth to saline groundwater and the hydrologic and water-quality properties of saline groundwater on a broad regional basis
Delineating and Assessing Saline Ground Water Resources - Some Issues• Impact of Saline-Water Withdrawals on
Freshwater Aquifers•Deep-Well injection Practices for
Disposal of Fluids•Prospects for Subsurface Carbon
Sequestration•Others…?
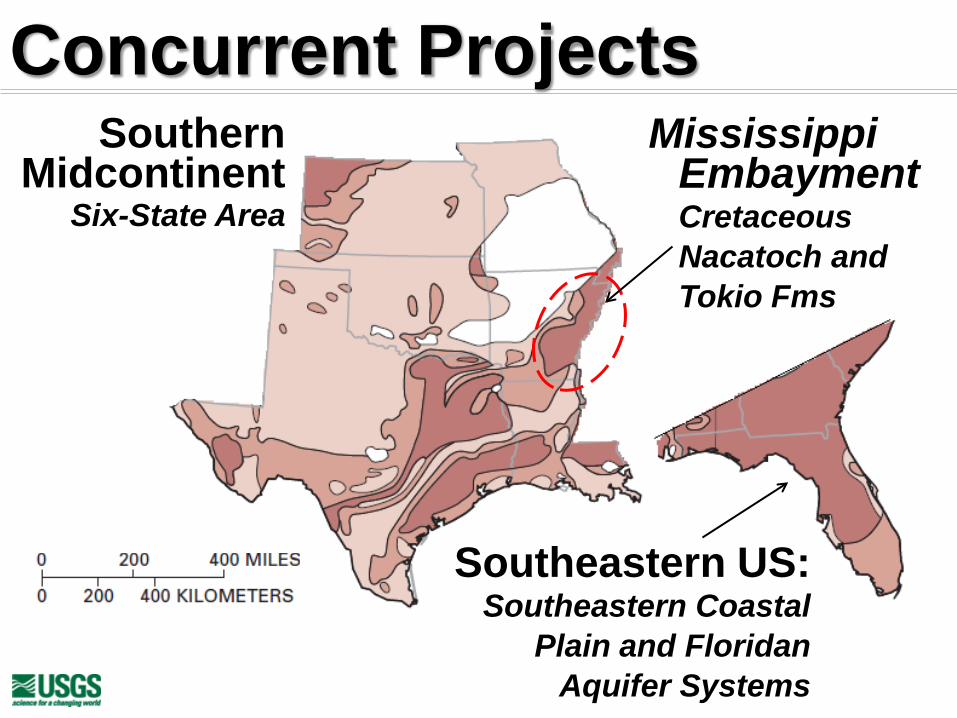
Concurrent ProjectsSouthern
MidcontinentSix-State Area
Mississippi Embayment Cretaceous Nacatoch and Tokio Fms
Southeastern US:Southeastern Coastal
Plain and Floridan Aquifer Systems

Concurrent Projects• Saline Water Aquifer Mapping in the Southeastern United
States: Southeastern Coastal Plain and Floridan Aquifer SystemsContact: Lester Williams, Georgia WSC - [email protected]
• Salinity Concentration Mapping Using Geochemical, Geophysical, and Geostatistical Methods in the Cretaceous Aquifer System in the Mississippi EmbaymentContact: Jonathan Gillip, Arkansas WSC - [email protected]
• Delineating and Assessing Saline Water Resources in the Southern-MidcontinentContacts: Marvin Abbott, Oklahoma WSC - [email protected]
or Stan Paxton [email protected]

Saline Water Aquifer Mapping -Southeastern United States•Digital database of
borehole geophysical log data
•Map the regional extent of saline aquifer systems
•Delineate salinity variations at key well sites and along section lines
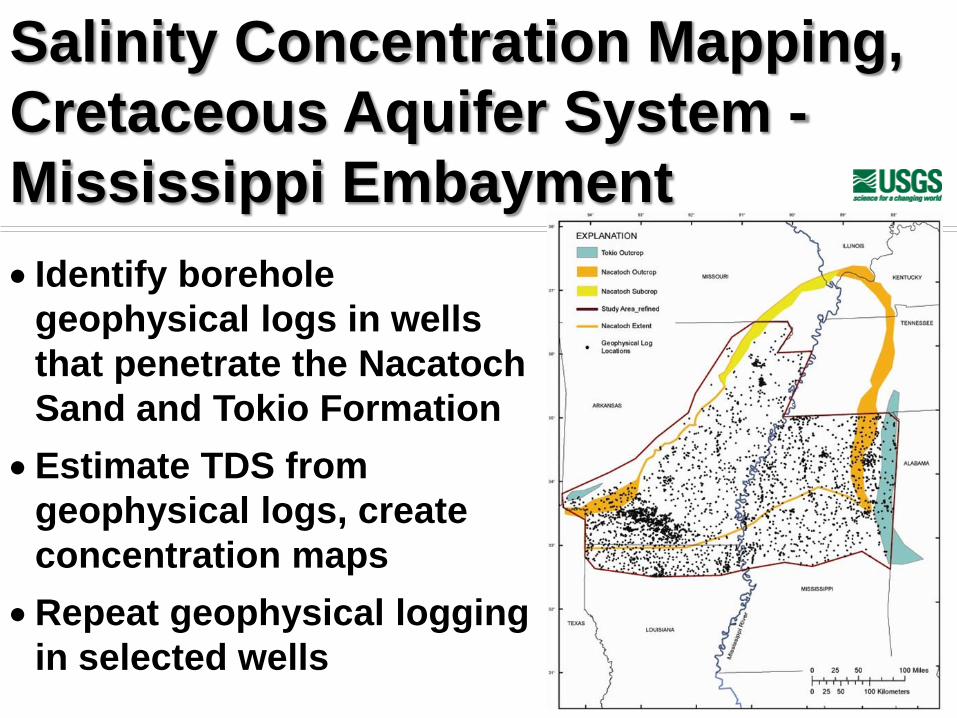
Salinity Concentration Mapping, Cretaceous Aquifer System -Mississippi Embayment• Identify borehole
geophysical logs in wells that penetrate the Nacatoch Sand and Tokio Formation
•Estimate TDS from geophysical logs, create concentration maps
•Repeat geophysical logging in selected wells

Delineating and Assessing Saline Water Resources in the Southern-Midcontinent
High Plains OzarkPlateau
CoastalLowlands
MississippiEmbayment
High Plains
Edwards-Trinity
MississippiRiver Valley
CoastalUplands
MississippiEmbayment
Blaine
CentralOK
Ada-Vamoosa
RushSprings
Antlers
Dakota

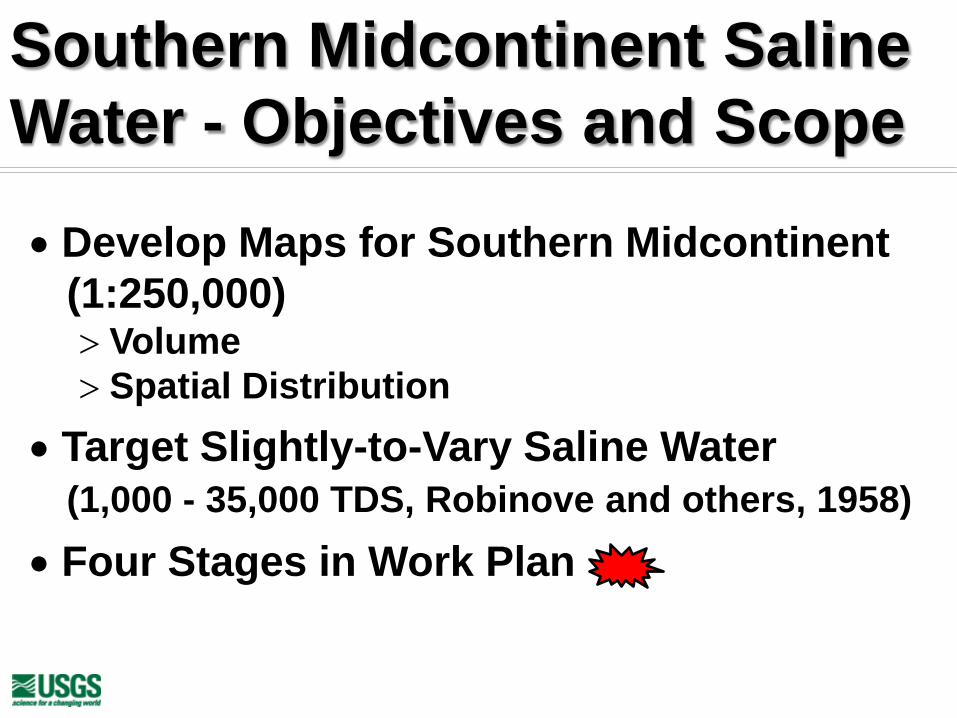
Southern Midcontinent Saline Water - Objectives and Scope
• Develop Maps for Southern Midcontinent(1:250,000)> Volume> Spatial Distribution
• Target Slightly-to-Vary Saline Water(1,000 - 35,000 TDS, Robinove and others, 1958)
• Four Stages in Work Plan

Southern Midcontinent Saline Water - Products
•Maps (1:250,000)•Cross Sections•Geodatabases•Methodologies•Scientific Investigations Reports,
Fact Sheets

Southern Midcontinent Saline Water - Objectives and Scope
• Develop Maps for Southern Midcontinent(1:250,000)> Volume> Spatial Distribution
• Target Slightly-to-Vary Saline Water(1,000 - 35,000 TDS, Robinove and others, 1958)
• Four Stages in Work Plan

Class Total Dissolved Solids(Milligrams per liter)
Fresh 0 - 1,000
Slightly Saline 1,000 - 3,000
Moderately Saline 3,000 - 10,000
Very Saline 10,000 - 35,000
Briny >35,000
From Robinove and others, 1958
Salinity Classification
Southern Midcontinent Saline Water - Objectives and Scope
• Develop Maps for Southern Midcontinent(1:250,000)> Volume> Spatial Distribution
• Target Slightly-to-Vary Saline Water(1,000 - 35,000 TDS, Robinove and others, 1958)
• Four Stages in Work Plan
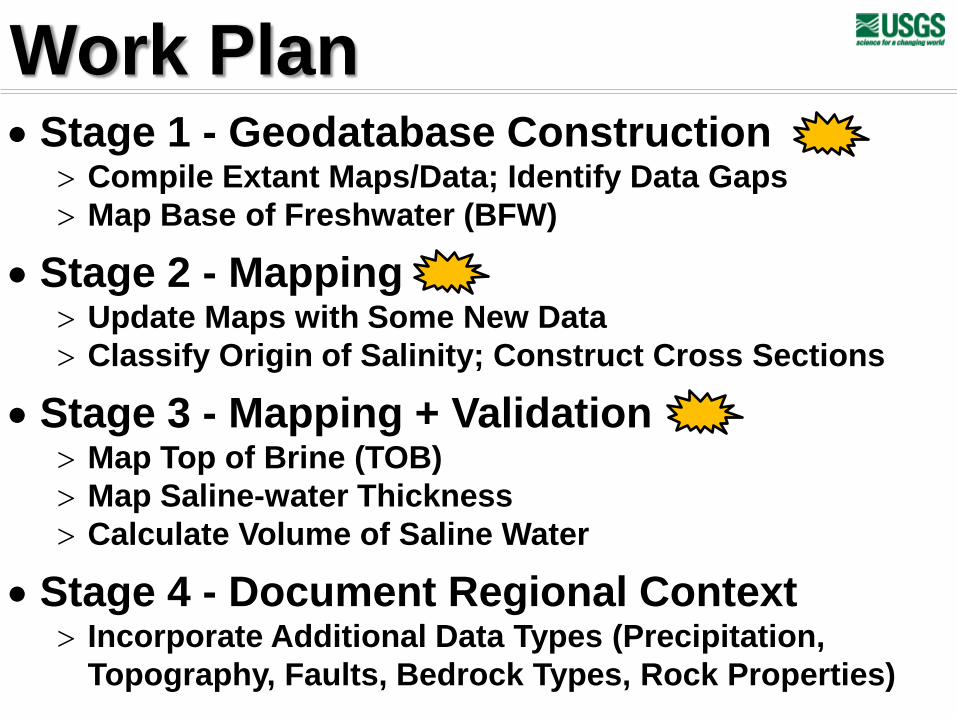
Work Plan• Stage 1 - Geodatabase Construction
> Compile Extant Maps/Data; Identify Data Gaps> Map Base of Freshwater (BFW)
• Stage 2 - Mapping> Update Maps with Some New Data> Classify Origin of Salinity; Construct Cross Sections
• Stage 3 - Mapping + Validation> Map Top of Brine (TOB)> Map Saline-water Thickness> Calculate Volume of Saline Water
• Stage 4 - Document Regional Context> Incorporate Additional Data Types (Precipitation,
Topography, Faults, Bedrock Types, Rock Properties)
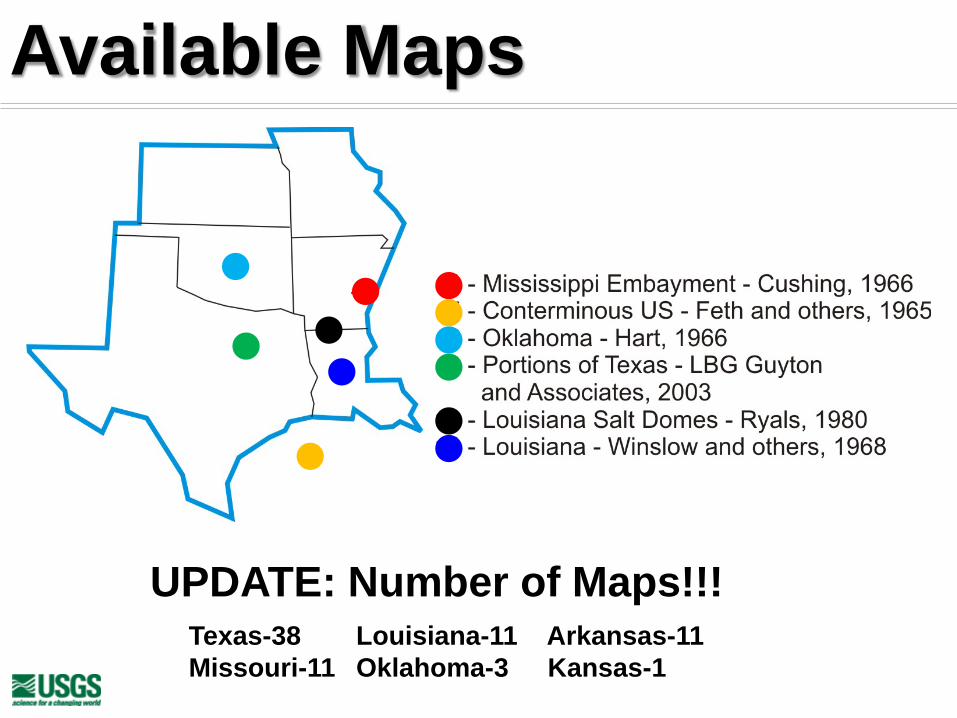
Available Maps
UPDATE: Number of Maps!!!Texas-38 Louisiana-11 Arkansas-11Missouri-11 Oklahoma-3 Kansas-1

Well-LogResponse
From Hart, 1966
Use of well-log resistivity to
identify fresh to saline-water
transition

Cross Sections
From Hart, 1966 Top of Brine
Shale
ShaleSandstonew/fresh water
Sandstonew/saline water
Base of freshwaterbody
Sandstone

Work Plan• Stage 1 - Geodatabase Construction
> Compile Extant Maps/Data; Identify Data Gaps> Map Base of Freshwater (BFW)
• Stage 2 - Mapping> Update Maps with Some New Data> Classify Origin of Salinity; Construct Cross Sections
• Stage 3 - Mapping + Validation> Map Top of Brine (TOB)> Map Saline-water Thickness> Calculate Volume of Saline Water
• Stage 4 - Document Regional Context> Incorporate Additional Data Types (Precipitation,
Topography, Faults, Bedrock Types, Rock Properties)
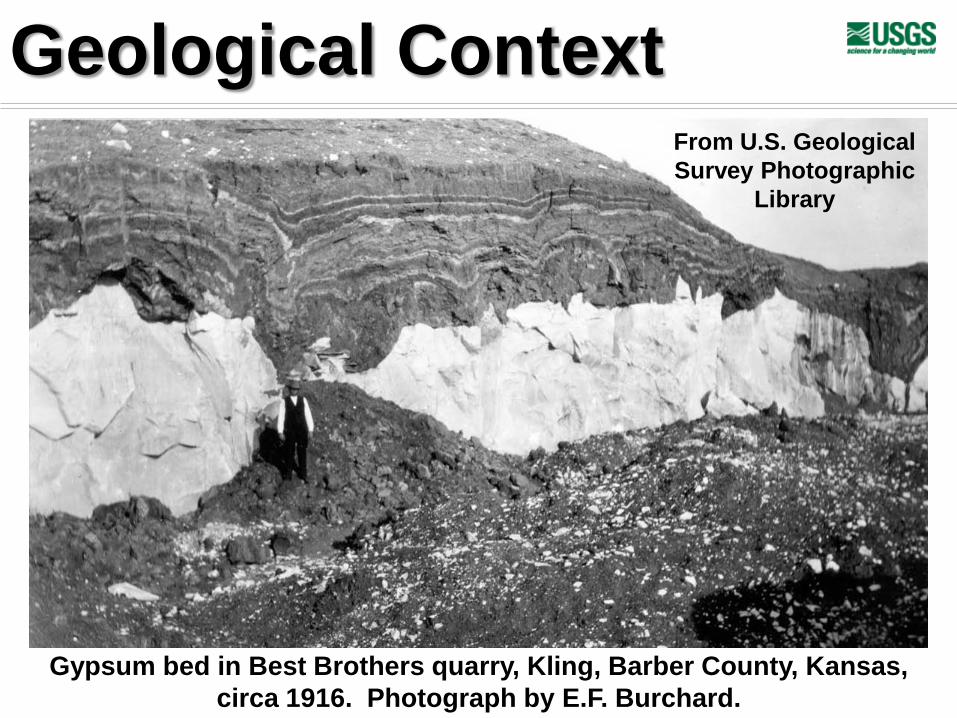
Geological Context
Gypsum bed in Best Brothers quarry, Kling, Barber County, Kansas, circa 1916. Photograph by E.F. Burchard.
From U.S. Geological Survey Photographic
Library

Human Context
Cimarron River bed operations in Cushing Oil Fieldlooking southwest, Creek County, Oklahoma.December 2, 1915. Photograph by A.E. Fath.
From U.S. Geological Survey Photographic Library

Delineating and Assessing Saline Ground Water
Resources• Saline Water Aquifer Mapping in the Southeastern United States:
Southeastern Coastal Plain and Floridan Aquifer SystemsContact: Lester Williams, Georgia WSC - [email protected]
• Salinity Concentration Mapping Using Geochemical, Geophysical, and Geostatistical Methods in the Cretaceous Aquifer System in the Mississippi EmbaymentContact: Jonathan Gillip, Arkansas WSC - [email protected]
• Delineating and Assessing Saline Water Resources in the Southern-MidcontinentContacts: Marvin Abbott, Oklahoma WSC - [email protected]
or Stan Paxton [email protected]

Tasks and CalendarTasks
Federal Fiscal Year2010 2011 2012
1 2 3 4 1 2 3 4 1 2 3 4Literature searchCompile existent maps, datasetsCompile geospatial dataMerge geospatial data
- Interpolate contours- Generate edge-joined map (base FW)- Identify data gaps
Integrate USGS Produced Waters DatabaseInfill base FW map w/data as neededEvaluate data integrity (QA/QC)Identify sources of salinityGenerate top of brine mapGenerate saline-water thickness mapCalculate water volumesTabulate saline-water volumes by fm, stratEvaluate controls on salinity distribution
- Topography- Precipitation- Bed rock / fractures / faults
Write metadata for GIS layersWrite reports to accompany mapsReview maps / reportsPublish maps / reports
Stages 1 2 3 4 CompleteDocumentation
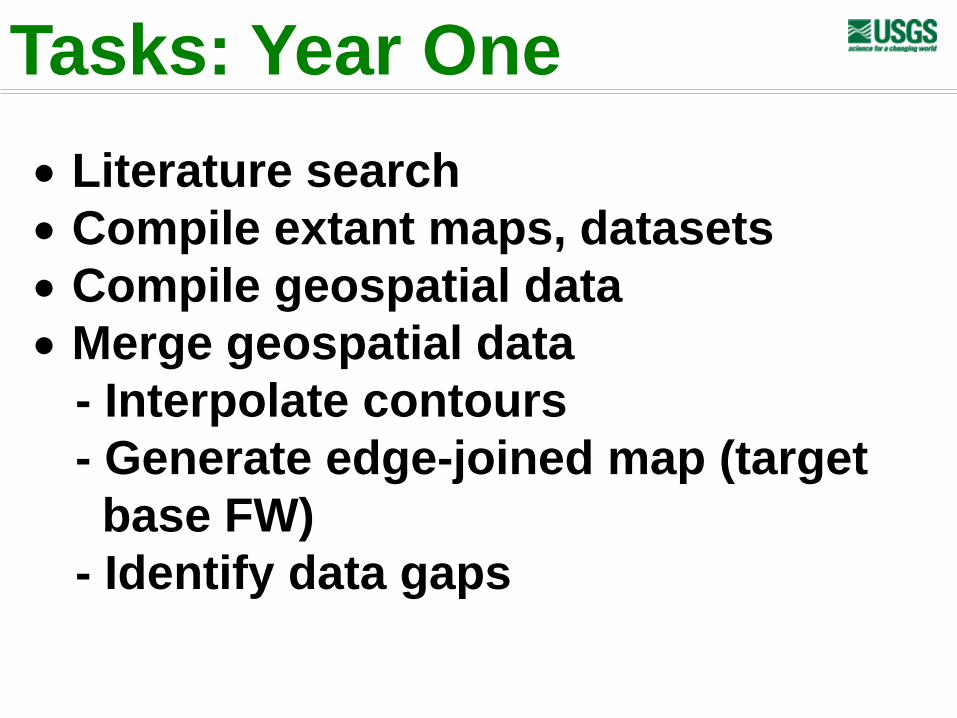
• Literature search• Compile extant maps, datasets• Compile geospatial data• Merge geospatial data
- Interpolate contours- Generate edge-joined map (target
base FW)- Identify data gaps
Tasks: Year One

• Integrate USGS Produced Waters Database• Infill base FW map w/data as needed•Evaluate data integrity (QA/QC)• Identify sources of salinity•Generate top of brine map•Generate saline-water thickness map•Calculate water volumes• Tabulate saline-water volumes by fm, strat•Evaluate controls on salinity distribution
- Topography- Precipitation- Bedrock / fractures / faults
•Begin compilation of metadata for GIS layers•Begin reports to accompany maps•Begin review of maps / reportsTa
sks:
Yea
r Tw
o
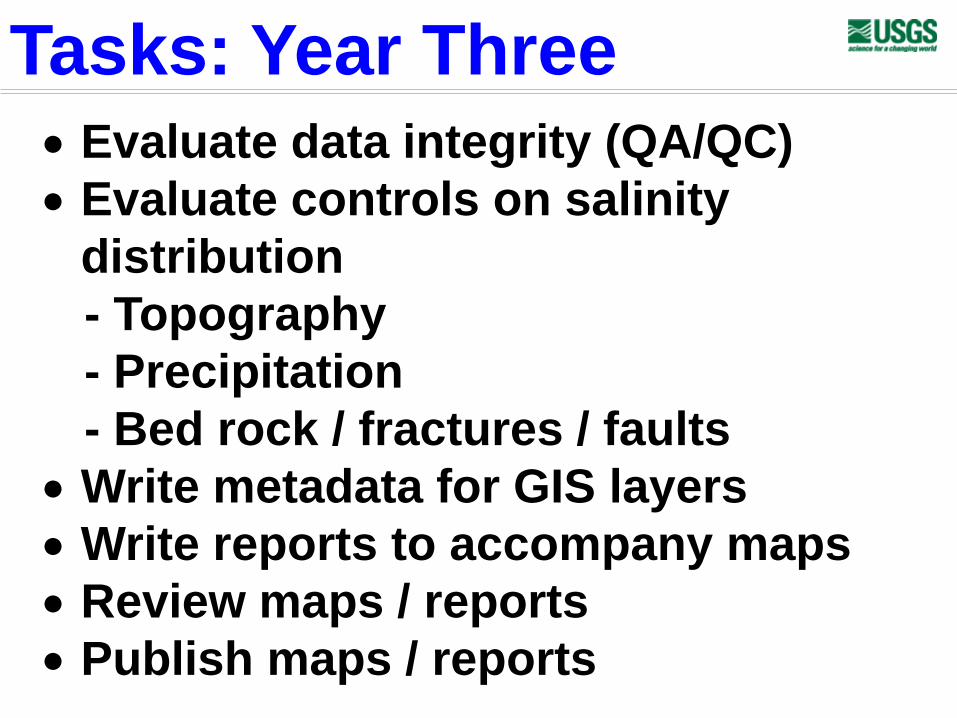
• Evaluate data integrity (QA/QC)• Evaluate controls on salinity
distribution- Topography- Precipitation- Bed rock / fractures / faults
• Write metadata for GIS layers• Write reports to accompany maps• Review maps / reports• Publish maps / reports
Tasks: Year Three
Delineating and Assessing Saline Ground Water
ResourcesUSGS Water Science Centers
ArkansasGeorgia
Oklahoma“Sulfur” water at Chickasaw National Recreation Area
Sulphur, Oklahoma