delft university of technology design trade-off and...
TRANSCRIPT
Delft University of Technology
Design trade-off and proof of concept for LOUPE, the Lunar Observatory forUnresolved Polarimetry of Earth
Hoeijmakers, H. J.; Arts, Thijs; Snik, F.; Keller, Christoph; Kuiper, Hans
DOI10.1364/OE.24.021435Publication date2016Document VersionPublisher's PDF, also known as Version of recordPublished inOptics Express
Citation (APA)Hoeijmakers, H. J., Arts, M. L. J., Snik, F., Keller, C. U., & Kuiper, J. M. (2016). Design trade-off and proof ofconcept for LOUPE, the Lunar Observatory for Unresolved Polarimetry of Earth. Optics Express, 24(19),21435-21453. DOI: 10.1364/OE.24.021435
Important noteTo cite this publication, please use the final published version (if applicable).Please check the document version above.
CopyrightOther than for strictly personal use, it is not permitted to download, forward or distribute the text or part of it, without the consentof the author(s) and/or copyright holder(s), unless the work is under an open content license such as Creative Commons.
Takedown policyPlease contact us and provide details if you believe this document breaches copyrights.We will remove access to the work immediately and investigate your claim.
This work is downloaded from Delft University of Technology.For technical reasons the number of authors shown on this cover page is limited to a maximum of 10.

Design trade-off and proof of concept forLOUPE, the Lunar Observatory for UnresolvedPolarimetry of EarthH. J. HOEIJMAKERS,1,* M. L. J. ARTS,2 F. SNIK,1 C. U. KELLER,1AND J. M. KUIPER3
1Leiden Observatory, Leiden University, Niels Bohrweg 2, 2333 CA Leiden, The Netherlands2ESTEC, Keplerlaan 1, 2200 AG Noordwijk, The Netherlands3Faculty of Aerospace Engineering, Delft Technical University, Kluyverweg 1, 2629 HA Delft, TheNetherlands*[email protected]
Abstract: We provide a proof of the technical feasibility of LOUPE, the first integral-fieldsnapshot spectropolarimeter, designed to monitor the reflected flux and polarization spectrum ofEarth. These are to be used as benchmark data for the retrieval of biomarkers and atmospheric andsurface characteristics from future direct observations of exoplanets. We perform a design trade-off for an implementation in which LOUPE performs snapshot integral-field spectropolarimetry atvisible wavelengths. We used off-the-shelf optics to construct a polarization modulator, in whichpolarization information is encoded into the spectrum as a wavelength-dependent modulation,while spatial resolution is maintained using a micro-lens array. The performance of this designconcept is validated in a laboratory setup. Our proof-of-concept is capable of measuring a gridof 50 × 50 polarization spectra between 610 and 780 nm of a mock target planet - proving themerit of this design. The measurements are affected by systematic noise on the percent level,and we discuss how to mitigate this in future iterations. We conclude that LOUPE can be smalland robust while meeting the science goals of this particular space application, and note themany potential applications that may benefit from our concept for doing snapshot integral-fieldspectropolarimetry.
c© 2016 Optical Society of America
OCIS codes: (110.0280) Remote sensing and sensors; (110.5405) Polarimetric imaging; (120.5410) Polarimetry;(120.6200) Spectrometers and spectroscopic instrumentation; (290.5855) Scattering, polarization; (300.6550) Spec-troscopy, visible; (350.1260) Astronomical optics; (350.1270) Astronomy and astrophysics.
References and links1. N. Hagen and M. W. Kudenov, “Review of snapshot spectral imaging technologies,” Opt. Eng. 52, 090901 (2013).2. E. L. Dereniak, “Infrared spectro-polarimeter,” Proc. SPIE 5957 202–211 (2005).3. M. W. Kudenov, M. E. L Jungwirth, E. L. Dereniak and G. R. Gerhart “White light Sagnac interferometer for
snapshot linear polarimetric imaging,” Opt. Express 17, 22520–22534 (2009)4. M. W. Kudenov, M. J. Escuti, E. L. Dereniak and K. Oka “White-light channeled imaging polarimeter using
broadband polarization gratings,” Appl. Opt. 50, 2283–2293 (2011)5. M. W. Kudenov and E. L. Dereniak “Compact real-time birefringent imaging spectrometer,” Opt. Express 20,
17973–17986 (2012).6. K. Oka and T. Kato, “Spectroscopic polarimetry with a channeled spectrum,” Opt. Lett. 24, 1475–1477 (1999).7. F. Snik, T. Karalidi, and C. U. Keller, “Spectral modulation for full linear polarimetry,” Appl. Opt. 48, 1337–1346
(2009).8. J. Tinbergen Astronomical Polarimetry (Cambridge University Press, 1996).9. J. Hough, “Polarimetry: a powerful diagnostic tool in astronomy,” Astron. Geophys. 47, 3.31–3.35 (2006).10. F. Snik and C. U. Keller, “Astronomical polarimetry: polarized views of stars and planets” in Planets, Stars and
Stellar Systems: Volume 2: Astronomical Techniques, Software and Data Howard E. Bond Ed. (Springer Netherlands,2013).
11. D. M. Stam, J. W. Hovenier, and L. B. F. M. Waters, “Using polarimetry to detect and characterize Jupiter-likeextrasolar planets,” A&A 428, 663–672 (2004).
12. T. Karalidi, D. M. Stam, and J. W. Hovenier, “Looking for the rainbow on exoplanets covered by liquid and icy waterclouds,” A&A 548, A90 (2012).
13. J. E. Hansen and J. W. Hovenier, “Interpretation of the polarization of Venus,” J. Atmos. Sci. 31, 1137–1160 (1974).
Vol. 24, No. 19 | 19 Sep 2016 | OPTICS EXPRESS 21435
#261339 http://dx.doi.org/10.1364/OE.24.021435 Journal © 2016 Received 25 Apr 2016; revised 6 Jul 2016; accepted 13 Jul 2016; published 7 Sep 2016
14. M. I. Mishchenko, B. Cairns, G. Kopp, C. F. Schueler, B. A. Fafaul, J. E. Hansen, R. J. Hooker, T. Itchkawich, H. B.Maring, and L. D. Travis, “Accurate monitoring of terrestrial aerosols and total solar irradiance: introducing theGlory mission,” Bull. Am. Meteorol. Soc. 88, 677 (2007).
15. E. Duursma and M. Boisson, “Global oceanic and atmospheric oxygen stability considered in relation to the carboncycle and to different time scales,” Oceanol. Acta 17, 117–141 (1994).
16. N. Narita, T. Enomoto, S. Masaoka, and N. Kusakabe, “Titania may produce abiotic oxygen atmospheres on habitableexoplanets,” Sci. Rep. 5, 13977 (2015).
17. S. Seager, E. L. Turner, J. Schafer, and E. B. Ford, “Vegetation’s red edge: a possible spectroscopic biosignature ofextraterrestrial plants,” Astrobiology 5, 372–390 (2005).
18. D. Briot, L. Arnold, S. Jacquemoud, and J. Schneider, “Present and future detection of terrestrial biomarkers onearthshine,” in proceedings of IAU Symposium 293, 65–67 (2014).
19. W. Sparks, J. Hough, L. Kolokolova, T. Germer, F. Chen, S. DasSarma, P. DasSarma, F. Robb, N. Manset, I. Reid,F. Macchetto, and W. Martin, “Circular polarization in scattered light as a possible biomarker,” J. Quant. Spectrosc.Radiat. Transfer 110, 1771–1779 (2009).
20. J. D. Carroll, “A new definition of life,” Chirality 21, 354–358 (2009).21. D. M. Stam, “Spectropolarimetric signatures of Earth-like extrasolar planets,” A&A 482, 989–1007 (2008).22. E. Pallé, “Earthshine observations of an inhabited planet,” EAS Publication Series 41, 505–516 (2010).23. M. F. Sterzik, S. Bagnulo, and E. Palle, “Biosignatures as revealed by spectropolarimetry of earthshine,” Nature 483,
64–66 (2012).24. A. Bazzon, H. M. Schmid, and D. Gisler, “Measurement of the earthshine polarization in the B, V, R, and I band as
function of phase,” A&A 556, A117 (2013).25. F. Parol, J. C. Buriez, C. Vanbauce, J. Riedi, L. C. Labonnote, M. Doutriaux-Boucher, M. Vesperini, G. Sèze,
P. Couvert, M. Viollier, and F. M. Bréon, “Review of capabilities of multi-angle and polarization cloud measurementsfrom POLDER,” Adv. Space Res. 33, 1080–1088 (2004).
26. D. Tanré, F. M. Bréon, J. L. Deuzé, O. Dubovik, F. Ducos, P. François, P. Goloub, M. Herman, A. Lifermann, andF. Waquet, “Remote sensing of aerosols by using polarized, directional and spectral measurements within the a-train:the parasol mission,” Atmos. Meas. Tech. 4, 1383–1395 (2011).
27. E. Pallé and P. R. Goode, “The Lunar Terrestrial Observatory: observing the Earth using photometers on the Moon’ssurface,” Adv. Space Res. 43, 1083–1089 (2009).
28. T. Karalidi, D. M. Stam, F. Snik, S. Bagnulo, W. B. Sparks, and C. U. Keller, “Observing the Earth as an exoplanetwith LOUPE, the lunar observatory for unresolved polarimetry of Earth,” Planet. Space Sci. 74, 202–207 (2012).
29. S. Jones, F. Iannarilli, and P. Kebabian, “Realization of quantitative-grade fieldable snapshot imaging spectropo-larimeter,” Opt. Express 12, 6559–6573 (2004).
30. F. Snik, J. H. H. Rietjens, A. Apituley, H. Volten, B. Mijling, A. Di Noia, S. Heikamp, R. C. Heinsbroek, O. P.Hasekamp, J. M. Smit, J. Vonk, D. M. Stam, G. Harten, J. Boer, and C. U. Keller, “Mapping atmospheric aerosolswith a citizen science network of smartphone spectropolarimeters,” Geophys. Res. Lett. 41, 7351–7358 (2014).
31. G. van Harten, Spectropolarimetry for planetary exploration, (Leiden University Press, 2014).32. G. van Harten, F. Snik, J. H. H. Rietjens, J. M. Smit, and C. U. Keller, “Spectral line polarimetry with a channeled
polarimeter,” Appl. Opt. 53, 4187–4194 (2014).33. C. Packham, M. Escuti, J. Ginn, C. Oh, I. Quijano, and G. Boreman, “Polarization gratings: a novel polarimetric
component for astronomical instruments,” Publ. Astron. Soc. Pac. 122, 1471–1482 (2010).34. C. U. Keller, “Design of a polarimeter for extrasolar planetary systems characterization,” Proc. SPIE 62690T (2006).35. M. Rodenhuis, H. Canovas, S. V. Jeffers, M. de Juan Ovelar, M. Min, L. Homs, and C. U. Keller,“The extreme
polarimeter: design, performance, first results and upgrades,” Proc. SPIE 84469I (2012).
1. Introduction
1.1. Multi-dimensional remote-sensing
When obtaining spectra of extended objects, we need to record light intensity as a function ofimage position and wavelength. This is challenging because it requires that three dimensions ofinformation are captured on a detector that is generally 2D. This has led to the development of e.g.scanning slit spectrographs (in which one spatial direction is scanned in time), and integral-fieldunits (in which the field of view is cropped into smaller sections, each of which is spectrallydispersed and imaged onto the detector using image slicers or fibers). For a review about thedevelopment of spectroscopy, see [1]. When measuring polarization or polarization-spectra, thisproblem is aggravated by the need to capture 2 additional quantities that describe the polarizationstate, which amounts to a 5-dimensional measurement. Therefore, imaging polarimeters orspectro-polarimeters generally require moving parts to scan through polarization directions orwavelength in time, or multiple beams, each with their own optics and detectors.
Vol. 24, No. 19 | 19 Sep 2016 | OPTICS EXPRESS 21436

Implementations using moving-parts or multiple beams lead to non-common path errors, andare not always desirable when complexity needs to be low. In recent years, several novel designconcepts have been proposed to overcome these limitations, to allow for instantaneous imagingspectroscopy (e.g. [2]), imaging-polarimetry (e.g. [3,4]) or imaging spectro-polarimetry (e.g. [5]).These devices exploit the wavelength-dependent properties of polarization optics to encodepolarization information in the spectral dimension (i.e. spectral modulation, as first proposedby [6]), and collapse the remaining dimensions onto the detector plane using interferometric ortomographic methods.
Ref. [7] presents a spectral modulator that performs snapshot spectro-polarimetry and isoptimized for measuring linear polarization. The intensity spectrum is modulated by a sinusoidalmodulation that encodes for the linear polarization fraction and angle. In the current work, wepresent a new design concept that combines this spectral modulation with a micro-lens array. Thisresults in a spectro-polarimetric integral-field unit that obtains the linear polarization spectrumof a grid of independent field-points, in a single exposure without moving parts.
We present this design in the context of an ongoing challenge in astronomy: The searchfor habitable planets around other stars and the signatures of extra-terrestrial life. However,polarization measurements are important in a wide range of fields, including medical, defense,surveillance, climate and environment, and we expect that this type of device can find manyapplications outside astronomy as well.
The scientific background is expanded upon in the remainder of this section. Section 2.3explains the science requirements and the working principles of our design. Section 3 introducesa laboratory proof-of-concept, followed by a discussion of its performance in section 4. Finally,section 5 describes the steps that we still need to take to optimize this instrument for a real-worldapplication as part of a space-mission.
1.2. Polarization of (exo)planets
Polarimetry is widely used in astronomical observations, for example to study the planets inour solar system, interstellar dust-grains, circumstellar material and the magnetic fields of stars(see [8,9] or [10] for comprehensive reviews). An enduring and important challenge in astronomyis the search for habitable planets that orbit other stars (extra-solar planets or ’exoplanets’, inshort). Much effort is directed at finding these exoplanets and studying their characteristics afterhaving been discovered. The latter is especially problematic because planets are tiny comparedto stars and they emit or reflect very little light compared to their host stars. The main challengeof exoplanet astronomy is thus to develop methods to increase the contrast between a star and itsaccompanying exoplanet. The fact that the contrast ratio (at visible wavelengths) between thebrightness of the Sun and the Earth as seen by an interstellar observer amounts to 10−10, showsthat finding and studying an Earth-like exoplanet is a formidable challenge.
The light reflected by an exoplanet may be significantly polarized, depending on the scatteringgeometry (i.e. the illumination angle or ’phase’ of the exoplanet) and the composition andstructure of the planet’s atmosphere and/or surface. This means that exoplanet observations maybenefit from polarimetry. Firstly because the contrast between the bright star and the much fainterexoplanet is enhanced by filtering out the unpolarized starlight. Secondly, because the angle oflinear polarization is determined by the on-sky position of the planet with respect to the star(position angle), a polarimeter filters all possible noise sources that emanate from directions otherthan the physical location of the planet. Thirdly, because the scattering, absorption and reflectionproperties of materials are wavelength-dependent, spectro-polarimetric information providesadditional diagnostics of an exoplanet’s atmosphere and surface [11, 12]. A good example of theuse of polarization in planetary science is provided by [13], who used the polarization spectrumof Venus to determine that its upper cloud deck is composed of sulfuric acid. This could not havebeen derived from flux measurements of Venus. Also in the case of climate research, polarization
Vol. 24, No. 19 | 19 Sep 2016 | OPTICS EXPRESS 21437

information is essential to determine the properties of the different types of aerosols in the Earth’satmosphere (see e.g. [14]).
As bigger telescopes and more advanced instruments are being constructed, the field ofexoplanet research is focusing on establishing whether particular exoplanets satisfy minimalconditions for being habitable, and on the search for so-called ’biomarkers’: observables that areuniquely indicative of extra-terrestrial life. An example of a biomarker is the spectral absorptionband of molecular oxygen (O2) between 759 and 770 nm. Molecular oxygen is regarded abiomarker because the presence of oxygen in the Earth’s atmosphere is the result of organicphotosynthesis. Photosynthesis causes the atmosphere to be in chemical disequilibrium andwithout a constant supply of oxygen from biological sources, the EarthâAZs atmospheric oxygenwould be lost to chemical and surface reactions on time-scales of 106 years [15]. Oxygenabsorption in the spectrum of an exoplanet therefore indirectly reveals the presence of extra-terrestrial organisms (though in certain cases, abiotic sources of oxygen may exist, see [16]).Vegetation also directly contributes to the reflection spectrum of an exoplanet. Chlorophyll -afamily of biomolecules responsible for the absorption of sunlight in the process of photosynthesis-reflects sunlight at green wavelengths between 500 and 600 nm and in the near-infrared beyond700 nm. These spectral features are called the ’green bump’ and the ’red edge’, are observablein the Earth’s spectrum due to the planet-wide presence of photosynthetic organisms [17, 18].It was shown by [19] that chlorophyll in photosynthetic microbes and plant-leaves inducescircular polarization upon reflection. This is attributed to the fact that chlorophyll (like manyother biological compounds) exhibit homochirality: The preferential occurrence of one particularconfiguration of an asymmetric molecule. It is believed that homochirality is a necessary attributeof the information-replicating processes which make life possible and it may even be a definingaspect of life itself [20]. Although multiple scattering of light by aerosol and cloud particles, andsingle scattering by some types of aerosol particles, are known to produce circular polarization aswell, the spectral properties of homochiral biomatter are so distinctive that circular polarizationcan be concluded to be a powerful biomarker.
1.3. Earth as a model exoplanet
Future (polarization) observations of Earth-size exoplanets will necessarily be disk-integrated,because the spatial resolution of even the largest telescopes currently conceived is insufficient toresolve them. To assess the habitability of such planets, these observations will be compared todisk-integrated models of the Earth, which represent observations of Earth as if it was observedfrom far away. At the same time, we need to understand how different surface componentscontribute to the Earth’s total polarization spectrum, so that a variety of distributions of Earth-likesurface types can be matched to observations. To reliably retrieve habitability-indicators fromfuture spectro-polarimetric data, versatile and well-tested benchmarks of the Earth must thus beavailable.
Ref. [21] calculated the Earth’s disk-integrated polarization spectrum for different diurnalphases (i.e. with major landmasses, the pacific ocean or clouds dominating the spectrum); aswell as the disk-integrated polarization strength as a function of illumination angle (phase). Theyconfirm that the polarization spectrum provides an extra dimension along which to discern cloudsfrom liquid oceans from landmasses - the latter two being especially difficult to discern by theshape of the disk-integrated spectrum alone. Another important prediction is the visibility ofthe polarization of the rainbow at ∼ 30◦, caused by high-altitude water droplets. As such, thepolarization phase-curve can reveal the presence of water vapour, a very important ingredient ofan Earth-like biosphere [12].
Attempts at measuring the Earth’s polarization spectrum have been made before. One techniqueis to use Earth-shine: Sunlight that is reflected by the dayside of the Earth, onto the dark side of theMoon, into a telescope on the night-side of the Earth. Excitingly, Earthshine measurements have
Vol. 24, No. 19 | 19 Sep 2016 | OPTICS EXPRESS 21438

revealed that the Earth’s vegetation leaves strong biomarkers in the global reflection spectrumof Earth [22] and it might also leave a trace in the global polarization spectrum [23]. However,Earthshine suffers from a number of drawbacks:
• Any telescope can only see the Earth-shine coming from the hemisphere it is located on.That means that in order to measure the Earth’s globally averaged polarization spectrum,Earth-shine observations need to be performed with telescopes spread out over the world.Measurements taken with various instruments under various circumstances would need tobe combined, introducing systematic errors.
• Earthshine is observed on the un-illuminated side of the Moon. Therefore, the rangeof Earth’s phase angles accessible to Earthshine observations is limited, because nearfull-Moon and new-Moon, Earthshine can never be observed.
• When Earth-shine is reflected off the lunar surface, it partly de-polarizes. This depolar-ization has a spectral dependence, varies across the lunar surface and is generally notwell understood. The de-polarizing behaviour of the lunar surface can not be measured bymapping the polarization of sunlight reflected from the Moon. This is because polarizationand de-polarization constitute different elements of the Mueller matrix. In the case ofpolarization, part of Stokes-I is transferred to Stokes-Q and U. However, in the case ofde-polarization, part of Stokes-Q and U leak back into Stokes-I. See [24] for an attempt attaking lunar de-polarization into account.
Besides Earthshine, the POLDER and PARASOL instruments produced polarization maps ofthe Earth’s surface in the context of climate science [25, 26]. These instruments however, arein low-Earth orbit and see only a small part of the Earth at any given instance of time. Theytherefore can’t provide a measurement that integrates the light reflected off the entire planet in asingle observation [27]. Also, these observations were exclusively broad-band, so only limitedspectral information has been obtained from orbit.
A common orbit further away from Earth is geostationary orbit, 35,786km above the surface.From this distance, the Earth has an angular diameter of 21◦ and can be imaged in one frame.However, the instrument would always see the same hemisphere of Earth, per definition ofgeostationary orbit. There are currently no spectro-polarimeters in geostationary orbit, and toobserve the Earth as if it would be an exoplanet, the instrument should be located still furtheraway.
1.4. LOUPE: Spectropolarimetry from the lunar surface
[28] propose to observe the Earth with a space-based spectropolarimeter, using the lunar surfaceas a sufficiently distant platform to produce disk-integrated polarization spectra. The surface ofthe Moon provides a stable vantage point from which the Lunar Observatory for UnresolvedPolarimetry of Earth (LOUPE) can observe the Earth at all times. The Moon is tidally lockedto the Earth, which means that the same side of the Moon always faces the Earth, and fromany point on the Earth-facing side of the Moon, the Earth is always at approximately the sameposition in the sky. The diurnal rotation of the Earth allows the entire Earth’s surface to beobserved every 24 hours, and all phase-angles are scanned during each lunar orbit.
From the lunar surface, the instrument will thus produce a full set of benchmark data after onemonth of observations, covering all configurations at which the Earth could be observed if it hadbeen an exoplanet in an edge-on orbit (note that an exoplanet in an inclined orbit will show alimited range of phase angles). A lifetime in the order of a few years would additionally makethese observations sensitive to the effect of seasonal variations.
Ref. [28] formulate conceptual requirements that these observations should minimally fulfil toproduce the necessary scientific output, and propose four possible implementations of LOUPE to
Vol. 24, No. 19 | 19 Sep 2016 | OPTICS EXPRESS 21439

accomplish this, either by measuring only linear polarization or the full Stokes vector; and with orwithout spatial resolution (i.e. imaging capability). In this paper, we present the development of alaboratory prototype of LOUPE that performs linear spectro-polarimetry with imaging capability.Although spatially resolved observations of exoplanets will not be possible in the foreseeablefuture, this implementation of LOUPE will allow the disk-integrated polarization spectrum tobe obtained while simultaneously measuring local reflection properties. This information canbe used to understand the individual contributions of the Earth’s major surface features to theglobally averaged polarization spectrum, and make the benchmark observations more flexiblewhen applied to Earth-like exoplanets with different surface distributions. We constructed aproof-of-concept using off-the-shelf optics and demonstrate that the instrument can be small,robust, and fully solid-state; and we conclude that this instrument can be a valuable addition toany lunar mission without having a large impact to the resources and complexity of the payload.
2. Design of LOUPE
2.1. Science-derived instrumental requirements
An outline of the scientific requirements of LOUPE were listed by [28]. These are adapted andexpanded below to illustrate the driving factors behind the design of our proof-of-concept forLOUPE.
1. Observations capture the entire disk of the Earth at any time.
2. Observations cover all diurnal phases and all phase angles of Earth. From the lunar surface,this translates to an instrument lifetime in excess of 1 month, with an observing frequencyof more than once per hour to resolve the Earth’s rotation.
3. Observations minimally cover known biomarker signatures in the optical part of thespectrum: The green bump between 500 − 600 nm, the vegetation red edge between700 − 760 nm and the O2A band between 750 − 770 nm.
4. The spectral resolution for polarimetry is 20 nm.
5. Considering that we wish to observe features at the level of the variations predicted bythe polarization models of Earth as shown by [21], the fraction of linear polarization PL
is measured at every wavelength with a sensitivity in the order of 0.1% and an absoluteaccuracy of 1%.
6. The instrument leaves a small footprint on the resource budget of the lander vehicle, suchas size, mass, power consumption, data transfer bandwidth. The quantification of suchparameters is beyond the scope of this paper.
Although the Earth is always visible from any point on the Earth-facing side of the Moon,the non-zero eccentricity of the lunar orbit does cause the Earth librate over the course of theorbit, with a projected extent of ± 8◦. Assuming a low level of mechanical complexity of theLOUPE instrument, we discard active pointing of the instrument to track the motion of the Earthon sky. This means that a field of view of at least ∼ 20◦ by ∼ 20◦ is needed to have the Earth(which itself has a diameter of 2◦) in view at all times. This field could be integrated as a whole,but only if the Earth is not close to the horizon, and when the Sun is not in the field-of-view (atphase-angles clouse to 180◦). Given that the parameters of the lunar mission of which LOUPEwill take part are not yet known (the lunar horizon would likely be in view on a mission to thelunar polar regions), and that we wish to observe the Earth’s polarization spectrum also at largephase angles when the angular distance between the Earth and the Sun is small, leads us todevelop a solution with imaging capability. This has the major benefit that spatial resolution
Vol. 24, No. 19 | 19 Sep 2016 | OPTICS EXPRESS 21440

enables the independent characterization of the Earth’s major surface features. By sampling thefield of view with a grid of ∼ 50 × 50 spatial elements, the angular resolution of LOUPE is∼ 0.4◦, equivalent to the angular scale of Earth’s continents as seen from the Moon. For eachsuch spatial point we then obtain a polarization spectrum, and any spatial point that sees the lunarhorizon, the Sun or black space, will in principle not affect the measurement of Earth’s disk.
Fig. 1. Schematic layout of LOUPE. Light enters through the aperture on the left. The threedifferent beams are three examples of the N × N beams generated by the MLA, each ofwhich will see a slightly different direction on the sky. Spectral dispersion is not shown.
2.2. IFU design
Our design is shown schematically in Fig. 1. The field-of-view is determined by an entranceaperture in the focus of a telecentric lens. This aperture is small compared to the focal length F1of the lens, so all rays passing through the aperture exit the lens in parallel. The parallel beamthen passes through the polarization modulation optics described in section 2.3 below.
To achieve imaging capability, we place a micro-lens array (MLA) at the back focus ofthe telecentric lens. An MLA is a two-dimensional grid of N × N lenslets, each of whichsees a different part of the field of view and creates its own image of the entrance aperture afocal distance F2 away from the array. The image plane of the MLA thus consists of a gridof N × N micro-images of the entrance aperture, referred to as micro-apertures. This grid ofmicro-apertures is subsequently imaged onto a detector using a pair of achromats with focallengths F3 and F4 so the detector sees a grid of N × N images of the entrance pupil. The FOV isdetermined by F1, the magnification of the field is determined by the ratio of F3 and F4, and themagnification of each micro-pupil is determined by the ratio of F2 and F3. We place a dispersionelement in the middle of the 4 f re-imaging system to spectrally disperse each of the N × Nmicro-pupils into a micro-spectrum.
2.3. Spectral polarization modulation
We use polarization modulation to simultaneously encode the intensity and polarization measure-ment along the wavelength axis of the spectrum. This can be accomplished by exploiting thestrong wavelength-dependence of some polarization optics, which cause a sinusoidal intensitymodulation to be imprinted on top of the intensity spectrum. The idea of encoding the full Stokesvector into the spectral dimension of a spectrograph was first described by [6] and [29]. [7] pro-posed to use a polarization modulator (sometimes referred to as a channelled spectro-polarimeterin the literature) that only measures the linear polarization spectrum, to detect and characterizethe atmospheres of solar system planets. Since then, this scheme has also been used in iSPEX,a citizen science project aimed at measuring aerosols in the Earth’s atmosphere using smart-phones [30], and we use the same concept as the basis for our proposed implementation ofLOUPE.
Polarization modulation works by stacking a λ4 -plate (QWP), a multiple-order retarder with
retardance δ(λ) and a linear polarizer such that either axis of the QWP is aligned with the linearpolarizer, while the axis of the multiple-order retarder is at a 45◦ angle with the other two. A
Vol. 24, No. 19 | 19 Sep 2016 | OPTICS EXPRESS 21441

linearly polarized input spectrum S0(λ) will receive a modulation that is sinusoidal in frequency(see Eq. 1). The amplitude of the modulation scales with the polarization fraction PL , whilethe phase scales with the polarization angle, φL . Both can be obtained by fitting a curve to themodulated spectrum [7].
S± (λ) =12
S0(λ) ×[1 ± PL (λ) cos
(2πδ(λ)λ
+ 2φL (λ))]
(1)
Depending whether the linear polarizer is aligned with either the fast or the slow axis of theQWP, the modulation shifts by 180◦. If both these channels are obtained, they can be added toyield the original intensity spectrum without the modulation. The modulation itself is recoveredby subtracting the two channels and normalizing it with the intensity-spectrum:
S+ + S− = S0(λ) (2)
S+ − S−S+ + S−
= PL (λ) cos(
2πδ(λ)λ
+ 2πφL (λ))
(3)
Light enters the polarization modulation optics through the entrance aperture and the tele-centric lens, which together generate the desired field-of-view. As mentioned before, all rayspassing through the aperture exit the lens and pass through the polarization modulation optics inparallel. This is important, because the retardance of waveplates depends on incident angle. Also,polarization-active optics should be as close to the front of the instrument as possible to reduceinstrumental polarization induced by preceding optics. When exiting the polarization modulationoptics, the beam continues to the MLA, where it is split up into micro-images of the aperture,each of which is then individually re-imaged and dispersed.
2.4. Optical configuration
The MLA can be rotated around its optical axis, such that the dispersion direction is at an angleα with respect to the micro-pupil grid (see Fig. 2). A proper choice of α stacks the micro-spectraonto the detector in such a way that cross-talk between adjacent spectra is minimized, whilemaximizing the number of detector pixels that can be used effectively. The optimal choice for αdepends on the length, width and number of micro-spectra. This means that there is trade-off
between spectral range, spectral resolution, spatial resolution, field of view and light-gatheringpower. The available detector pixels have to be divided over the N × N micro-spectra, so ahigher spatial resolution (larger value of N) or a larger field-of-view necessarily decrease thespectral performance. Conversely, a larger spectral range and higher spectral resolution requirethe spectra to be dispersed over a larger number of detector pixels, limiting the value of N for agiven detector size. Similarly, if the light-gathering power is increased by increasing the entranceaperture, the width of the resulting micro-spectra increases accordingly, requiring a larger valuefor α, and thus shorter micro-spectra (less spectral bandwidth or dispersion). This trade-off
allows for great flexibility in the application of this design. Depending on the application, a directexchange between spatial and spectral range and resolution and light gathering power can bemade, using only robust steady-state components.
We conservatively assume that the grid of micro-spectra should fit on a 1k by 1k detectorbecause larger detectors are rare in space-based applications. This upper limit on the amountof pixels, limits the information density of the observations and the implementation of LOUPEshould thus focus on de-magnifying and re-imaging the entrance aperture as finely as possible toallow for optimal stacking of the micro-spectra onto the detector. In the case of LOUPE, lightgathering power is not a major issue because the Earth is a bright target, so LOUPE will use asmall entrance aperture. Therefore, the imaging performance of the instrument determines thepoint-spread-function of the micro-apertures which then constrains the physical pixel size of
Vol. 24, No. 19 | 19 Sep 2016 | OPTICS EXPRESS 21442

Fig. 2. A read-out of the grid of micro-apertures, overlaid with a schematic illustration ofhow micro-spectra are stacked to fill the detector array. By rotating the grid of micro-lensesby an angle α with respect to the spectral dispersion direction, the micro-spectra can bestacked side-by-side. The smaller α can be made without lateral overlap, the more spacethere is in the dispersion direction for an increase in bandwidth or spectral resolution. Thewidth of the spectra is determined by the magnification of the micro-apertures onto thedetector, or the point-spread function of the re-imaging achromats, whichever dominates.The suppression of aberrations is therefore crucial to stack the micro-spectra efficiently.
the detector: If the pixel scale of the detector does not match the point-spread-function of themicro-aperture, the image of the micro-spectrum on the detector will be under or oversampled.
If the grid of micro-spectra measures 50 × 50 elements, a total of 2500 micro-spectra shouldbe contained in a single image. In order to fully obtain the polarization modulation, eachmicro-spectrum should be imaged in two polarization channels simultaneously (see section 2.3).Therefore there are 200 pixels per individual micro-spectrum available on a 1k×1k detector. Ifwe further assume a bandwidth of 250nm, a PSF measuring 2 pixels, and a margin of 1 pixelaround all sides (to prevent lateral cross-talk between micro-spectra), the dimensions of a micro-spectrum are 50 × 4 pixels, which results in a pixel scale of 5.0nm/px and a spectral resolution of10nm/px. This is enough to sample a polarization modulation with a period of 20nm as dictatedto be a requirement in section 2.1. This pixel budget is thus theoretically sufficient to satisfythe sampling requirements. However, stacking the micro-spectra onto the detector is a seriouschallenge. This is why our proof-of-concept will be limited to the single-beam implementationof the polarization modulation scheme, and we note that the pixel budget can be relaxed greatlyby choosing a larger detector (see Section 5).
3. Proof of concept
3.1. Optics
From left to right in Fig. 1 we have chosen the following optical components: The entranceaperture is a circular pinhole with a diameter of 1 mm. It is placed in the front-focus of aplano-convex F1 = 150.5 mm lens with a diameter of 25.4 mm, made of fused silica to minimize
Vol. 24, No. 19 | 19 Sep 2016 | OPTICS EXPRESS 21443

stress birefringence. At the back focus of this lens, we place a square, 68 × 68 MLA measuring15 × 15 × 1mm3, with a focal length of 0.93 mm. The polarization modulation optics is placedbetween the lens and the MLA, and consists of a zero-order QWP, a stack of six 4λ retardingpolymer films (the same films are used in iSPEX [30]) and a 2" linear polarizer. The linearpolarizer needs to be rotated to obtain the two complementary polarization channels sequentially.It is therefore placed in a rotation mount, so that it can be aligned to either axis of the QWP (seeSection 2.3) This implementation therefore does not perform snapshot imaging polarimetry, asa sequence of two exposures is needed to capture both polarization channels. In Section 5 wediscuss how this will be addressed in future iterations.
The focal plane of the MLA is re-imaged by a pair of identical 2" achromats with a focallength of 100 mm, spaced 200 mm apart. The dispersive element is a right-angle N-BK7 prismplaced on a rotation platform in the middle between the re-imaging lenses. Because the spectraldispersion depends on the incident angle of the beam onto the prism, the dispersion can be fine-tuned by rotating this platform. The advantage of using a prism is that the dispersion increasestowards blue wavelengths. This counters the decrease in the fast periodicity of the modulation atblue wavelengths, which scales with 1
λ2 [7].At the image plane is a Point Grey Flea3 1.2 megapixel monochromatic CMOS camera. The
detector consists of 1280 × 1024 square pixels, measuring 5.3 µm × 5.3 µm, and thus spans atotal area of 6.8 × 5.4 mm2. The detector is aligned to the dispersion direction of the prism, sothat the micro-spectra are imaged horizontally on the detector. Because the magnification of thetwo achromats is unity, the image plane of the MLA matches the size of the MLA itself, whichhas an effective diameter of 14 mm. Therefore, this detector sees only a quarter of the re-imagedmicro-pupils, and thus covers only a quarter of the total FOV. The micro-spectra are dispersedin the direction of the long side of the detector, and the micro-pupil grid is rotated such thatthe spectra do not overlap, and cross-talk between adjacent micro-spectra due to the wings ofthe PSF, is minimal (see Fig. 2 and Section 2.2). In order to reduce aberrations induced by there-imaging lenses, we add a circular field stop and an 800 nm short-pass filter behind the firstachromat. Regardless, because the pixel scale of 5.3 µm2 is small, the spectral performance ofthis implementation will be limited by the imaging performance of the optics, as the spectralresolution is limited by the point-spread-function of the micro-apertures, rather than the spatialsampling of the detector array. This oversampling of the PSF is not relevant for our demonstrationof the working principle of LOUPE.
The F1 = 150.5 mm objective lens generates a circular FOV with a diameter of 9.6◦. The beamexiting the lens has a diameter of 25.4 mm, which is subsequently vignetted by the mount of theMLA which has a circular clear area 14 mm wide. This thus cuts the total FOV to a diameterof 5.3◦. Although this is much smaller than the required 20◦ FOV, we note that the FOV canbe increased trivially by reducing the focal length of the lens to ∼ 40 mm. However, we chosea slower lens because 4 cm between the lens and the MLA would have been insufficient to fitour polarization modulation optics. The image plane of the MLA is re-imaged onto the detectorwith unity magnification, so the grid of micro-spectra is circular with a diameter of 14 mm. Thedetector measures 6.8 × 5.4 mm2, so it sees only a quarter of the re-imaged micro-pupils, andthus covers only a quarter of the already vignetted FOV. This can be mitigated by choosing adetector with larger pixels.
3.2. Test observations
We have simulated science spectra with our LOUPE prototype using a Styrofoam sphere as amodel planet. The sphere (with a diameter of 7.8 cm) was illuminated by a slide projector at anangle of 10◦ < γ < 90◦ with the line of sight to the instrument, which was located at a distanceof ∼ 3 meters from the target. Observations consist of median-combined sequences of ten 1msexposures to reduce photon-noise. In each polarization channel (Eq. 3), we also obtain such a
Vol. 24, No. 19 | 19 Sep 2016 | OPTICS EXPRESS 21444

sequence of wavelength calibration frames, polarization calibration frames and dark frames.To assess how the prototype performs at retrieving the polarization of the Styrofoam target, we
obtain control-measurements using a standard imaging-polarimetry setup: The target is imagedonto the camera by a single lens that is preceded by a linear polarizer. We obtain the imageat visible wavelengths (between 400 nm and 800 nm) in a horizontal (S+) and a vertical (S−)channel, parallel respectively perpendicular to the plane in which the light is reflected off thetarget. PL is obtained by aligning and combining the two channels.
3.3. Data reduction
The detector images the grid of micro-spectra and saves them in 16-bit monochromatic TIFFimages. We start the analysis by feeding a broadband deuterium-halogen lamp into the setup usinga fiber, thereby uniformly illuminating the entrance aperture. This reveals each micro-spectrumat high contrast and allows us to establish the location and extent of all micro-spectra. The micro-spectra are surrounded by background flux, caused by aberrations, diffraction, internal reflectionsand other instrumental imperfections. In the uniformly illuminated image, we designate acollection of pixels between micro-spectra that are furthest away from the bulk of the flux ofthe surrounding micro-spectra. We fit a 3rd degree polynomial surface to all these pixels in theimage to get a measure of the background flux, which we subtract. Bad pixels are removedby interpolating pixel values that are more than 4σ away from their surroundings. Finally, themicro-spectra are cropped-out along rectangular areas, and extracted by adding the pixel rowsof the cropped region. We co-add the rows with Gaussian weights, to weigh down rows awayfrom the central pixel row, that are more sensitive to cross-talk from PSF-wings of neighbouringmicro-spectra (see Section 4 for an analysis of the cross-talk in this setup). After extraction, wehave thus obtained a 1D representation of each micro-spectrum.
3.4. Wavelength calibration
To obtain a wavelength calibration, we illuminate the entrance aperture with a HgAr line-lamp that emits 15 lines in the range between 450 to 820nm. We locate these lines in eachmicro-spectrum by obtaining the center-of-mass of each line and matching those to the knownline-positions of the mercury-argon spectrum. Not all lines are resolved by LOUPE, so wematch the center-of-mass of a group of unresolved lines to the center-of-mass of the knownwavelength-positions, while weighing for the individual line strengths. We map pixel positions towavelength by performing a 4th degree polynomial fit, also weighted to the known line strengths.This yields a wavelength-solution for each extracted micro-spectrum.
3.5. Polarization calibration
The modulation as described by Eq. 3 scales with PL (λ) between 0 and 1. However in practise,our prototype is not able to produce a modulation with an amplitude of 1 when illuminatedwith fully polarized light. This is because the performance of the polarization optics is notperfect and wavelength dependent. Though the wavelength dependence of the multiple-orderretarder was exploited to produce the polarization modulation, similar wavelength dependenceof the QWP and the linear polarizer results in reduced efficiency at wavelengths away fromthe rated optimum wavelength of the optics. Similarly, the imaging performance of the lensesdeteriorates near the edges of the wavelength range. This means that spectral resolution of theinstrument decreases accordingly so that light from a maximum of the modulation may leak intothe surrounding minima, decreasing the observed amplitude of the polarization modulation. Thiseffect is especially relevant towards blue wavelengths, because the frequency of the polarizationmodulation increases with decreasing wavelength [7].
The wavelength-dependence of the efficiency of the instrument is calibrated by fully polarizingthe deuterium-halogen input (see Section 3.3) using a linear polarizer. In our case, only a single
Vol. 24, No. 19 | 19 Sep 2016 | OPTICS EXPRESS 21445

reflection geometry is relevant (see Section 3.2). Ideally however, we would calibrate Stokes-Qand U independently because the retardance of the QWP is not exactly 1
4λ, which reduces theability of the polarization modulator to register polarization in the direction of U [7, 31].
The calibration spectrum also yields a measurement of the retardance δ(λ) of the multiple-order retarder and the zero-point angle of the input polarization φL . These are represented by thefrequency and the phase of the modulation, and are obtained by fitting the modulation (Eq. 3) toeach calibration spectrum.
3.6. Demodulation
Equation 3 assumes that the transmission in both polarization channels is identical, in whichcase the modulation function oscillates around 0. However in practise, the throughput of theinstrument will be slightly dependent on the input polarization, which means that both channelsneed to be normalized independently. We adopt the procedure outlined by [32], who iterativelycorrect the wavelength-dependent transmission for each channel t± (λ) by requiring that theintegral over any period of the modulation is 0. The deviation from 0 is measured for ∼ 200steps in phase (i.e. wavelength), which is then fit with a 4th degree polynomial to obtain thewavelength-dependent transmission correction on t± (λ) (see Fig. 3).
Fig. 3. Step-wise reduction of a single micro-spectrum from the two calibration channels(i.e. fully polarized input either in the horizontal or vertical direction). The top panel showsboth channels of a single micro-spectrum after dark subtraction, background correction andextraction. In the middle panel, the two have been modulated such that the transmission inboth channels is equalized. The bottom panel shows the extracted polarization modulationsas described by Eq. 3. In order to obtain a polarization measurement from these, we fit themodulation (Eq. 3) to a ±15 nm range around each point. The measured amplitudes arethen divided by the modulation amplitudes of the respective (fully polarized) calibrationmicro-spectra, the result of which yields PL for each point. Note that the wavelength rangeis cut during the analysis. On the one hand, this is because of low signal-to-noise of thecalibration spectra. On the other, chromatic aberrations deteriorate the spectral resolutiontowards shorter wavelengths, causing the polarization modulation to become unresolved.Also note that the efficiency of the spectral polarization modulation-optics at producing thepolarization modulation (amplitude of the modulation), diminishes long-ward of 700 nm.This is due to the break-down of the linear polarizer at red wavelengths.
Vol. 24, No. 19 | 19 Sep 2016 | OPTICS EXPRESS 21446

The corrected modulation is fit within bins of 20px (on average ∼ 30nm) wide betweenwavelengths of 610 and 800 nm (as the efficiency of the modulation diminishes blueward of610 nm), while keeping the retardance δ(λ) fixed to the value as measured by fitting the entirecalibration spectrum. This provides a measurement of the average amplitude of the modulationper wavelength-bin, for both the “science” micro-spectra as well as their associated calibrationmicro-spectra (see Fig. 3). These are divided to yield the polarization spectrum of each field-point. The angle of polarization is obtained by subtracting the measured phases of the calibrationspectra from those of the “science” spectra.
Fig. 4. A readout of a single LOUPE exposure while observing the Styrofoam test-sphere,illuminated to simulate a planet at close to 90◦ phase. Microspectra #1 to 3 are separatelyshown in figure 5, for illustrative purposes. Significant linear polarization is caused in thisscattering configuration as evidenced by the fact that the polarization modulation can beobserved by eye in the zoomed-in section in the upper-right.
4. Performance of the LOUPE prototype
Figure 4 shows a readout of the prototype, with the polarization modulations of three micro-spectra illustrated in Fig. 5, along with the resulting measurements of PL (λ). Each point of PL
is obtained by fitting the modulation curve in a range of ±15 pixels from that point, and thereforerepresents a ∼ 23 − 42 nm bin (at 610 and 800nm respectively) within which PL is measured.These measurements are subsequently smoothed to the bin-size [7], producing bin-averagedmeasurements of PL with a typical scatter of a few %. This level of noise scatter is fully accountedfor by photon noise in the micro-spectra (primarily noise in the science-frames because fluxlevels are low), readout noise and photon-noise in the background that was subtracted.
With a measurement of PL for each micro-spectrum, we re-construct the spatial dependenceof the polarization fraction across the image, and compare it with control measurements obtainedwith the linear polarimetry setup (see Section 3.2). Figure 6 shows this comparison for the
Vol. 24, No. 19 | 19 Sep 2016 | OPTICS EXPRESS 21447
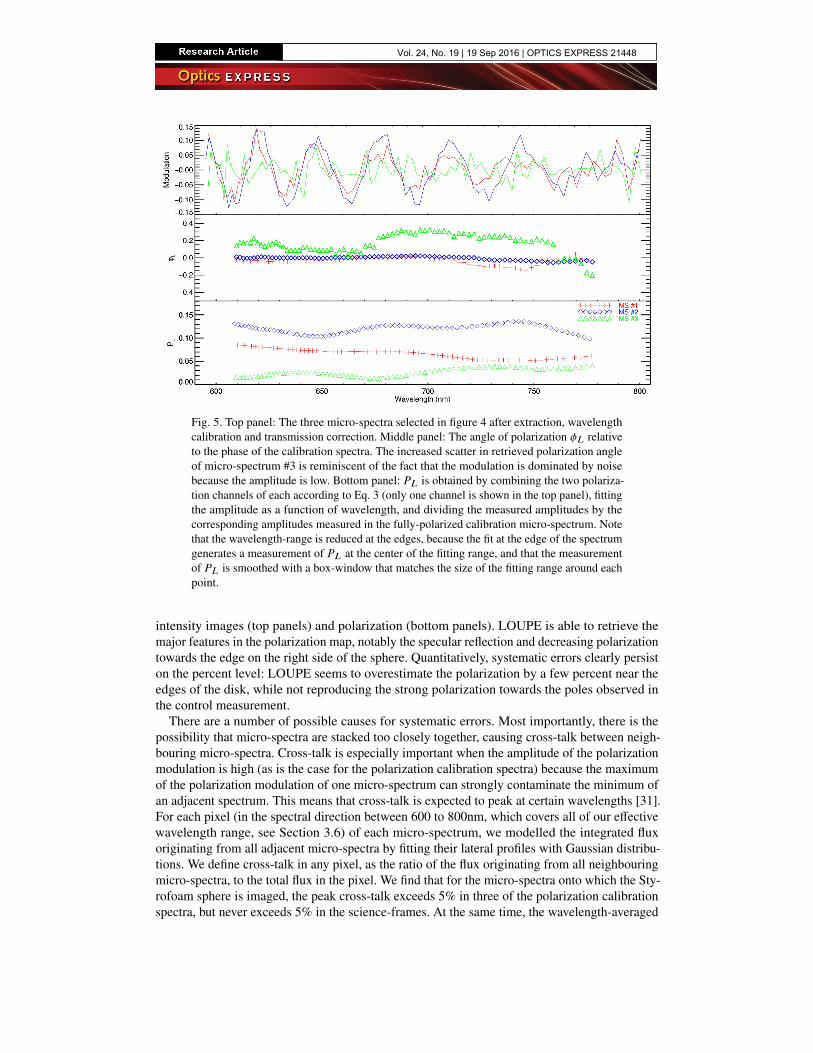
Fig. 5. Top panel: The three micro-spectra selected in figure 4 after extraction, wavelengthcalibration and transmission correction. Middle panel: The angle of polarization φL relativeto the phase of the calibration spectra. The increased scatter in retrieved polarization angleof micro-spectrum #3 is reminiscent of the fact that the modulation is dominated by noisebecause the amplitude is low. Bottom panel: PL is obtained by combining the two polariza-tion channels of each according to Eq. 3 (only one channel is shown in the top panel), fittingthe amplitude as a function of wavelength, and dividing the measured amplitudes by thecorresponding amplitudes measured in the fully-polarized calibration micro-spectrum. Notethat the wavelength-range is reduced at the edges, because the fit at the edge of the spectrumgenerates a measurement of PL at the center of the fitting range, and that the measurementof PL is smoothed with a box-window that matches the size of the fitting range around eachpoint.
intensity images (top panels) and polarization (bottom panels). LOUPE is able to retrieve themajor features in the polarization map, notably the specular reflection and decreasing polarizationtowards the edge on the right side of the sphere. Quantitatively, systematic errors clearly persiston the percent level: LOUPE seems to overestimate the polarization by a few percent near theedges of the disk, while not reproducing the strong polarization towards the poles observed inthe control measurement.
There are a number of possible causes for systematic errors. Most importantly, there is thepossibility that micro-spectra are stacked too closely together, causing cross-talk between neigh-bouring micro-spectra. Cross-talk is especially important when the amplitude of the polarizationmodulation is high (as is the case for the polarization calibration spectra) because the maximumof the polarization modulation of one micro-spectrum can strongly contaminate the minimum ofan adjacent spectrum. This means that cross-talk is expected to peak at certain wavelengths [31].For each pixel (in the spectral direction between 600 to 800nm, which covers all of our effectivewavelength range, see Section 3.6) of each micro-spectrum, we modelled the integrated fluxoriginating from all adjacent micro-spectra by fitting their lateral profiles with Gaussian distribu-tions. We define cross-talk in any pixel, as the ratio of the flux originating from all neighbouringmicro-spectra, to the total flux in the pixel. We find that for the micro-spectra onto which the Sty-rofoam sphere is imaged, the peak cross-talk exceeds 5% in three of the polarization calibrationspectra, but never exceeds 5% in the science-frames. At the same time, the wavelength-averaged
Vol. 24, No. 19 | 19 Sep 2016 | OPTICS EXPRESS 21448

Fig. 6. Comparison of a measurement obtained by LOUPE versus a higher resolution imageobtained using a standard linear polarizer. The target is the Styrophome sphere, illuminatedfrom a right angle. The top panels show the raw intensity image of the linear polarimeter(upper-left, arbitrary colour scale), and the average of the intensity in the micro-spectrabetween 600 and 700nm, as determined for each micro-spectrum obtained by LOUPE(upper-right). The bottom panels show the resulting distribution of PL on the sphere asmeasured by subtracting the two channels taken with linear polarimeter (bottom-left), andthe average of PL measured by LOUPE, also between 600 and 700nm (bottom-right). Thecontrol measurement of PL in the bottom-left panel was blurred and down-sampled to thesame angular resolution and grid-size as the measurement by LOUPE in the bottom-rightpanel. The colour scale is the same for both lower panels, which shows that LOUPE is ableto reproduce the global variations in PL , at the same qualitative level. The crosses in theright panels denote the locations of micro-spectra. This grid is slanted because the MLAis rotated with respect to the detector array. Only micro-spectra with sufficient flux wereextracted and analysed.
cross-talk is never higher than 0.5% for any of the polarization calibration spectra, and neverexceeds 0.2% for any of the science-spectra.
However, close examination of the high-contrast images used to calibrate the locations ofthe micro-spectra (Section 3.3) reveal the presence of a significant ghost associated with eachmicro-spectrum, caused by an internal reflection in the re-imaging system. These ghosts partlyoverlap with the cores adjacent micro-spectra and may cause significant cross-talk - as they canbe discerned by eye. We therefore conclude that although cross-talk from the PSF-wings ofadjacent micro-spectra cannot account for systematic errors of several percent on the measured
Vol. 24, No. 19 | 19 Sep 2016 | OPTICS EXPRESS 21449

polarization levels, it is possible that an internal reflection can.Besides cross-talk, there are a number of other sources of error that could contribute to the
observed systematic variations, and which must also be addressed in future iterations. Firstly, thelinear polarizer used to calibrate LOUPE, as well as the polarizer used in the imaging polarimeterwith which we perform the control measurements, are wavelength-dependent and not calibrated.Similarly, the light-source used to illuminate the Styrofoam sphere is not stabilized and may bevaryingly polarized.
Secondly, we have not characterized the instrumental polarization. The polarization-modulation optics are preceded only by a single objective lens which is made of fused-silica tominimize stress-birefringence. Although we expect this lens not to cause significant polarization,it was not calibrated for.
Thirdly, an incorrect extraction of large-scale background flux (the measurement of which isaffected by the presence of ghosts) will offset all micro-spectra, decreasing the amplitude of thepolarization modulation [7,31]. Fractionally, this would affect the polarization calibration spectramore strongly than the science spectra, causing an apparent excess of the derived polarizationwhich will be dependent on the location in the field.
Fourthly, detector non-linearity was not characterized, and would again mainly affect thepolarization calibration because the flux levels in these spectra were generally high.
Finally, because S+ and S− are obtained separately by manually rotating the linear polarizerof the polarization modulation optics, the two channels are not imaged on the same detectorposition, which introduces errors due to flat-field and defocussing.
We note that systematic errors on the percent-level are not unexpected, given the usage ofrotating polarizers and an un-stabilized lightsource to perform calibration measurements. Solvingthese systematic errors by using better calibration data and by addressing the issues mentionedabove with a more sophisticated data reduction method and higher quality components, is beyondthe scope of this proof-of-concept. More importantly, there are some qualitative departuresfrom the requirements stated in Section 2.1 and the design concept described in Section 2.2.These represent no fundamental barriers however, and possible avenues and considerations foraddressing these issues in future iterations are discussed in the following section.
5. Optimizing the prototype model
5.1. Beamsplitter
The notion of a snapshot linear polarimeter is defeated when the polarization channels S+ and S−need to be obtained in sequence with a rotating polarizer, as is the case with this proof-of-concept.It uses a single beam setup whereas LOUPE should measure two beams simultaneously to dofull linear spectro-polarimetry using snapshot observations. Dual-beam capability is achievedby replacing the linear polarizer with a polarizing beamsplitter. This doubles the density ofmicro-spectra on the detector array as noted in Section 2.3. We performed a trade-off analysisbetween a Wollaston prism, a Savart plate and a polarization grating.
• The Wollaston prism would be placed in the pupil-plane near the dispersive element. Thetwo polarization channels exit the prism in diverging beams, with separation angle γ. Theplane of separation is perpendicular to the dispersion direction of the dispersion element,such that the micro-spectra belonging to each channel are stacked laterally.
• The Savart plate is similar to the Wollaston prism, but would be placed in the focalplane of the MLA. It splits the two polarization channels into beams that exit the plate inparallel, with spatial separation d. The plane in which the beams are separated is againperpendicular to the dispersion direction, causing the micro-spectra to be duplicated in thelateral direction.
Vol. 24, No. 19 | 19 Sep 2016 | OPTICS EXPRESS 21450
• The polarization grating would combine the functionality of a beamspltiter and a dispersionelement [33], and be placed in the foci of the two re-imaging achromats. The polarizationgrating disperses the beam into two spectral orders, each in orthogonal polarizationdirections. The two orders lie on opposite sides of an undispersed zero-th order whichserves as a direct measurement of the total integrated flux (Stokes-I).
Of these, we consider the Savart plate to be the best option for LOUPE. The advantage of theSavart plate over the Wollaston prism is that the separation angle of the Wollaston prism variesover the field, because the beams coming from the MLA pass through the prism at differentincidence angles. The Savart plate does not have this problem because it is located in a parallelbeam. An additional disadvantage of using a Wollaston prism, is that it would be sensitive tosystematic polarization originating in the MLA and the first achromat. In contrast, the Savart plateis located one step earlier in the optical path. Finally, the separation between the exiting beamsof the Savart plate depends on the thickness of the plate. To efficiently stack the micro-spectrathe separation must be made small, which can be achieved by choosing a thin plate. By puttingan achromatic half-wave plate (HWP) between the two parts of the Savart plate, any crystalabberations (primarily astigmatism) will be identical in both polarization directions which meansthat they can be corrected for using a cylindrical lens [34].
We favor the Savart plate over the polarization grating because in the latter implementation,optimally stacking the spectra onto a small detector is more complicated. With a polarizationgrating, the spectral dispersion and polarization splitting occur in the same direction. Ideally,spectra are stacked such that the gap between the zero-th and first order of one spectrum isfilled by the first order of a nearby micro-spectrum [35]. This reduces the stacking efficiency atthe edges of the field, where gaps between the dispersion orders will not be filled. For higherdispersion strengths, the orders will be further apart, so the total stacking efficiency will decreasewith spectral resolution. In the case of the Savart plate, the spectral dispersion is decoupled fromthe polarization separation, allowing for more efficient stacking on a small detector.
5.2. Stacking
Figure 2 shows how single-channel observations are stacked onto the detector using the Savartplate. The lateral distance between micro-spectra in the single-beam setup is ∼ 50 µm (10px,see figure 4) and if we assume the same margin in the dual-beam implementation, the length ofeach micro-spectrum should be halved in order to double the available space needed to imagethe second channel. Now the trade-off described in Section 2.2 is particularly relevant: Reducingthe spectral dispersion reduces the bandwidth and/or the spectral resolution, provided that thedetector pixels are shrunk accordingly. This has implications for the dimensions of the detectorand the accessible field-of-view. Conversely, maintaining bandwidth and spectral resolutionmeans that a smaller amount of micro-spectra can be fit onto the detector, resulting in a reducedspatial resolution or increased cross-talk, if spectra are to be stacked more closely to each-other.
We made a MATLAB simulation to optimize dual-channel stacking on a 1k by 1k detectorconsidering the application of both a hexagonal and a square MLA. We assume square pixelswith a size of 10×10 µm2 and micro-spectra with a length of 64 pixels (slightly longer thantheorized in Section 2.2), a width of 2 pixels and a lateral margin of 3 pixels (giving a totallateral distance of 5 × 10 µm = 50 µm between spectra). As argued before, better spectralcharacteristics can be achieved by reducing aberrations (which decreases the margin neededbetween adjacent micro-spectra) and by increasing the resolution and size of the detector array.From the MATLAB simulation it was found that optimal stacking with a hexagonal MLA occursat a rotation angle of α = 12.5◦, in which case a maximum of 44×35 spectra can be fully imagedon the detector. In contrast, a square MLA allows a maximum of 32×34 spectra at a rotationangle of α = 26.5◦ (see Fig. 7). A hexagonal MLA therefore provides better stacking efficiencythan a square MLA, which serves to show that the choise of micro-lens configuration is important
Vol. 24, No. 19 | 19 Sep 2016 | OPTICS EXPRESS 21451

when designing an IFU using an MLA.
Fig. 7. Stacking using a square MLA (left), compared to a hexagonal MLA (right). Thered and blue spectra denote the two polarization channels. For mictro-spectra with thesedimensions, a hexagonal MLA grid allows for more efficient stacking than a square MLAgrid.
Fig. 8. The dual beam concept for LOUPE. The red and black beams emerging from theSavart plate represent the two orthogonal polarization channels. Dispersion is not shown.
5.3. Proposed design implementation and further considerations
Our proposal for the dual beam concept for LOUPE is shown in Fig. 8. The system has a one-to-one re-imaging pair behind the MLA with focal lengths of f = 50 mm. The hexagonal MLAcontains 44 × 35 lenslets with a focal length of fMLA = 1.2 mm and a lens diameter of 290 µm.To obtain a field of view with of 20◦, the field lens should have a focal length of f = 30 mm,giving an f /4 system and a spatial resolution of 0.6◦ (3 × 3 samples over the Earth’s disk). Theimage of the 0.5 mm entrance aperture will then have a diameter of 20 µm, corresponding to2×2 pixels on a detector with 10 µm pixels. To achieve a lateral distance of 5 pixels between thespectra of the two channels, the Savart plate needs to be made of 12 mm thick quartz. As followsfrom Fig. 8, the dimensions of this design are approximately 26×2×2 cm, which can be furthercompressed by folding the optical path, possibly using a Littrow configuration and if necessary,a three-mirror anastigmat.
In this design, micro-spectra have a length of 64px and a PSF size of 2 pixels, which canprovide 32 independent spectral measurements between 500 − 800 nm, equivalent to a spectralresolution of 9 nm, enough to sample a polarization modulation with a period of 20 nm, in linewith the science requirements stated in Section 2.1. We do stress that an increase of the detector
Vol. 24, No. 19 | 19 Sep 2016 | OPTICS EXPRESS 21452

size beyond 1k × 1k as well as a reduction of the spot size, would directly result in better spectraland spatial performance of this design.
Further issues that need to be addressed are the shielding of the instrument against extremefluxes when the Sun is in view, the calibration of the instrument (either before the start of themission or by adding the capability to calibrate the instrument after launch), the possibilityof active-pointing (which would radically relax the field-of-view requirements and improveperformance, but would involve moving parts which would increase the risk of failure), the(thermo-)mechanical and electrical design, power (power usage will be low owing to the solid-state design) and data handling (considering the possibility of on-board processing).
6. Conclusion
This paper presents a proof-of-concept for the Lunar Observatory for Unresolved spectro-Polarimetry of Earth (LOUPE). From the Earth-facing side of the Moon, LOUPE will measurethe polarization spectrum of Earth over all phase-angles and diurnal phases, to generate abenchmark for future polarization observations of exoplanets, as initially proposed by [28]. Suchbenchmarks are needed to verify the polarization models that will be used to infer physicalcharacteristics of the exoplanet environment from their polarization spectra and phase-curves, andto optimize instrumentation for direct observations. The design we propose is the first snapshotspectro-polarimetric integral-field unit: A linear spectro-polarimeter with spatial resolution. Thisis accomplished using a robust solid state design without moving parts and the polarizationmodulation principle in combination with a micro-lens array.
We constructed a prototype using off-the-shelf components, and prove that this design forLOUPE is able to retrieve spatially resolved spectro-polarimetric observations of a mock planettarget. These observations are affected by systematics on the percent level, which we mainlyattributed to a combination of ghost images and instrumental polarization caused by the opticsand the light-source. The main shortcoming of our proof-of-concept is that it relies on a rotatinglinear polarizer to obtain both polarization channels S+ and S− in sequence. However, we havediscussed the most important avenues for solving this shortcoming by incorporating dual-beamfunctionality using a Savart plate, and modelled how the micro-spectra can optimally be stackedonto the detector using a hexagonal micro-lens array. Finally, we have identified the issues thatremain to be addressed to reach a fully capable flight-model.
Due to its low level of complexity and small size, this design is ideal for application in space,and we are in the process of designing a flight-model for LOUPE. In addition, we note that theflexibility in its optical and spectral characteristics allow applying our design to a wide range ofproblems in which spatially resolved spectro-polarimetry is required.
Funding
Netherlands Organisation for Scientific Research (NWO); Project 639.043.503.
Vol. 24, No. 19 | 19 Sep 2016 | OPTICS EXPRESS 21453