deep learning fundus image analysis for diabetic
TRANSCRIPT

This is an electronic reprint of the original article.This reprint may differ from the original in pagination and typographic detail.
Powered by TCPDF (www.tcpdf.org)
This material is protected by copyright and other intellectual property rights, and duplication or sale of all or part of any of the repository collections is not permitted, except that material may be duplicated by you for your research use or educational purposes in electronic or print form. You must obtain permission for any other use. Electronic or print copies may not be offered, whether for sale or otherwise to anyone who is not an authorised user.
Sahlsten, Jaakko; Jaskari, Joel; Kivinen, Jyri; Turunen, Lauri; Jaanio, Esa; Hietala, Kustaa;Kaski, KimmoDeep Learning Fundus Image Analysis for Diabetic Retinopathy and Macular Edema Grading
Published in:Scientific Reports
DOI:10.1038/s41598-019-47181-w
Published: 01/12/2019
Document VersionPublisher's PDF, also known as Version of record
Published under the following license:CC BY
Please cite the original version:Sahlsten, J., Jaskari, J., Kivinen, J., Turunen, L., Jaanio, E., Hietala, K., & Kaski, K. (2019). Deep LearningFundus Image Analysis for Diabetic Retinopathy and Macular Edema Grading. Scientific Reports, 9(1), 1-11.[10750]. https://doi.org/10.1038/s41598-019-47181-w
1Scientific RepoRts | (2019) 9:10750 | https://doi.org/10.1038/s41598-019-47181-w
www.nature.com/scientificreports
Deep Learning Fundus Image Analysis for Diabetic Retinopathy and Macular edema GradingJaakko sahlsten1, Joel Jaskari1, Jyri Kivinen1, Lauri turunen2, esa Jaanio2, Kustaa Hietala3 & Kimmo Kaski1
Diabetes is a globally prevalent disease that can cause visible microvascular complications such as diabetic retinopathy and macular edema in the human eye retina, the images of which are today used for manual disease screening and diagnosis. This labor-intensive task could greatly benefit from automatic detection using deep learning technique. Here we present a deep learning system that identifies referable diabetic retinopathy comparably or better than presented in the previous studies, although we use only a small fraction of images (<1/4) in training but are aided with higher image resolutions. We also provide novel results for five different screening and clinical grading systems for diabetic retinopathy and macular edema classification, including state-of-the-art results for accurately classifying images according to clinical five-grade diabetic retinopathy and for the first time for the four-grade diabetic macular edema scales. these results suggest, that a deep learning system could increase the cost-effectiveness of screening and diagnosis, while attaining higher than recommended performance, and that the system could be applied in clinical examinations requiring finer grading.
Diabetic retinopathy is the most common microvascular complication in diabetes1, for the screening of which the retinal imaging is the most widely used method due to its high sensitivity in detecting retinopathy2. The evalua-tion of the severity and degree of retinopathy associated with a person having diabetes, is currently performed by medical experts based on the fundus or retinal images of the patient’s eyes3. As the number of patients with diabe-tes is rapidly increasing, the number of retinal images produced by the screening programmes will also increase, which in turn introduces a large labor-intensive burden on the medical experts as well as cost to the healthcare services. This could be alleviated with an automated system either as support for medical experts’ work or as full diagnosis tool. There are two recent studies that have investigated the use of deep learning systems in automated detection of diabetic retinopathy4,5. Both show that an automated system, based on the deep learning artificial neural network approach, can achieve high sensitivity with high specificity in detecting the referable diabetic retinopathy, defined as moderate or worse diabetic retinopathy. There are also other referable eye complications that have recently been investigated with this approach, such as diabetic macular edema4, and possible glaucoma and age-related macular degeneration5.
For an automated system to be clinically viable, it should be able to classify retinal images based on clinically used severity scales, such as the proposed international clinical diabetic retinopathy and diabetic macular edema disease scales6, which are also used in Finland7. In the literature one can find recent experiments8,9 for the former case of diabetic retinopathy scale, but there are no experiments yet to classify macular changes with the latter scale. Another substantial barrier to broader and more effective use of deep learning system is thought to be the large quantity of annotated images needed for the model to learn10.
In this study, our aim is to identify retinopathy using five different diabetic retinopathy and macular edema classification systems. In addition to the earlier studies of referable diabetic retinopathy classification system we also present state-of-the-art results for the clinically used five grade classification and for the first time four grade macular edema classification. Moreover, we present what preprocessing and regularization steps to the images needs to be done for the good functionality of the deep learning system and investigate systematically how the size with much smaller number of images used in training affects its performance.
1Dept. of Computer Science, Aalto University School of Science, Espoo, 00076, Finland. 2Digifundus Ltd., tietotie 2, 90460, Oulunsalo, Finland. 3Central Finland Central Hospital, Keskussairaalantie 19, 40620, Jyväskylä, Finland. correspondence and requests for materials should be addressed to K.K. (email: [email protected])
Received: 13 March 2019
Accepted: 10 July 2019
Published: xx xx xxxx
opeN
2Scientific RepoRts | (2019) 9:10750 | https://doi.org/10.1038/s41598-019-47181-w
www.nature.com/scientificreportswww.nature.com/scientificreports/
Methodsoriginal fundus image dataset. The research of present study was done in collaboration with Digifundus Ltd, an ISO 9001:2015 certified provider of diabetic retinopathy screening and monitoring services in Finland. Digifundus Ltd provided a non-open, anonymized retinal image dataset of patients with diabetes, including 41122 graded retinal color images from 14624 patients. The images were taken with Canon CR2 retinal camera after inducing mydriasis with tropicamide 5 mg/ml eyedrops. Two 45 degree color fundus photographs, centered on fovea and optic disc were taken from the patient’s both eyes. The output images were of variable resolutions, ranging from 3888 × 2592 to 5184 × 3456 pixels.
The present study is a methodological study with anonymized medical data and without any intervention in the integrity of a person such as contact with a person. In Finnish law this is not considered as a medical study requiring approval by an ethics committee or a written consent of a person11.
Retinal image grading systems and gradability. Each of the retinal images had been graded with respect to three different criteria, (i) diabetic retinopathy, (ii) macular edema, and (iii) gradability. Images are graded with the proposed international clinical diabetic retinopathy and macular edema disease severity scales6, denoted later as PIRC and PIMEC, respectively. The image gradability is a two-stage system, which considers an image to be either gradable or not. All personnel participating in retinopathy assessment had over 10 years’ experience in diabetic retinopathy grading. Retinal images with no lesions or mild diabetic lesions were graded by an optometrist and an M.D. trained for retinopathy grading. All images with moderate or worse changes were graded by two ophthalmologist both with more than 10 years of experience in grading fundus images. If there was a disagreement in grading, such an image was not included in this study.
PIRC and PIMEC grades were further used to obtain additional three types of grading systems: (i) a binary system of nonreferable/referable diabetic retinopathy (NRDR/RDR), (ii) a binary system of nonreferable/referable diabetic macular edema (NRDME/RDME), and (iii) three-class system of ungradable/NRDR/RDR. The NRDR/RDR system considers the cases with no diabetic retinopathy and mild diabetic retinopathy as nonreferable diabetic retinopathy, and the cases with moderate or worse diabetic retinopathy as referable diabetic retinop-athy. This system has been used in recent works investigating automated detection of diabetic retinopathy4,5. The NRDME/RDME system here is defined such that the absence of macular edema is defined as nonreferable diabetic macular edema and any level of macular edema as referable diabetic macular edema. Note that only the gradable images were graded for diabetic retinopathy and macular edema. Ungradable images were included in a single task, in combination with referable diabetic retinopathy classification, which constitutes the grading system QRDR, in which each image is considered to be either ungradable, depicting nonreferable diabetic retinopathy, or depicting referable diabetic retinopathy (ungradable/NRDR/RDR).
Image preprocessing and dataset division. In the model training and subsequent primary validation, we used preprocessed versions of the original images. The preprocessing consisted of image cropping followed by resizing. Each image was cropped to a square shape which included the most tightly contained circular area of fundus. The procedure removed most of the black borders and all of the patient related annotations from the image data. Each of the cropped images were then resized to five different standard input image sizes of 256 × 256, 299 × 299, 512 × 512, 1024 × 1024, and 2095 × 2095 pixels. The largest image size was the smallest native resolu-tion of the retinal cameras after the preprocessing steps. Here the creation of multiple resolutions was done for the purposes of analyzing the effect of the input image resolution on the classification performance.
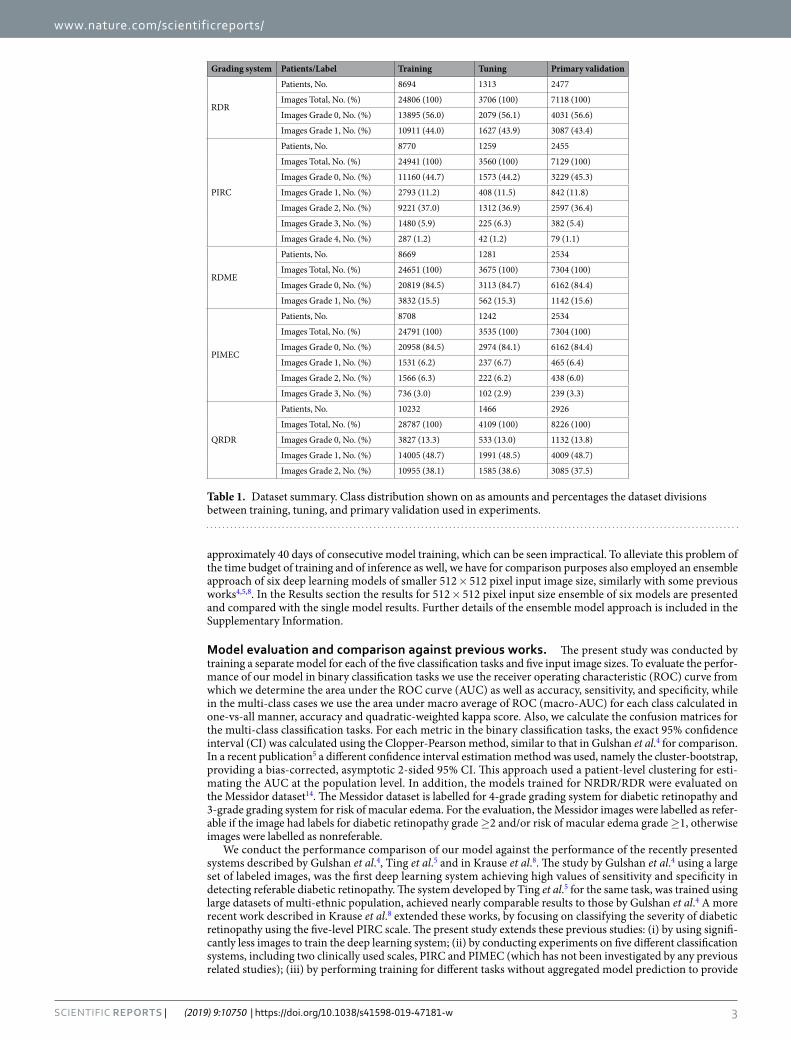
The obtained processed datasets were divided into three sets: training, tuning, and primary validation set in the 70%, 10% and 20% proportions of the whole image dataset, respectively, separately for each of the grading systems used in the experiments. In the division per a particular grading system, the different sets were to have similar grade distributions, and that the dataset data per patient to not reside in multiple but only in one of the three sets (of training, tuning, and primary validation), in order to prevent the possibility of obtaining over-optimistic results due to data memorization. Table 1 shows the statistics of the resulting divisions that were used in the experiments. Note that the grade distributions across the different sets were similar, with respect to each grading system, for example, when we consider the NRDR/RDR-system, the proportion of images associated with refer-able diabetic retinopathy in the training, tuning and primary validation set 44%, 43.9% and 43.4%, respectively.
Deep learning model. In order to distinguish features related to diabetic retinopathy and macular edema in the color images of patients’ fundi we chose to use a deep convolutional neural network. The neural networks are mathematical models, which consist of parameters used in specific calculations, such as convolutions and summations. Here the neural network can be constructed in such a way, that it receives an input which is used in calculating an output12, such as class or grade of diabetic retinopathy. The parameters used in the calculation of the output can be modified in a data-driven manner, by minimizing the error between neural network produced detections of classes and the manual annotations.
The network architecture, we selected, is based on the Inception-v3 architecture13 that was pretrained on ImageNet dataset14, and is similar to the base model used for the classification of referable diabetic retinopathy by Gulshan et al.4. Due to the memory constraints, the models trained on 2095 × 2095 pixels input images were trained using mini-batch size of 1, their batch normalization layers were replaced by instance normalization layers, and parameter updates were accumulated across 15 mini-batches. A detailed description of the neural network training and design is presented in the Supplementary Information.
In this study we are basing our classification tasks on a single model for each task and input image resolution or size. However, for the largest input image size there are, apart from the memory constraints, intense com-putational requirements which translates to long training as well as inference times. For example the training time on our workstation hardware with Graphical Processing Units for 2095 × 2095 pixels input images takes
3Scientific RepoRts | (2019) 9:10750 | https://doi.org/10.1038/s41598-019-47181-w
www.nature.com/scientificreportswww.nature.com/scientificreports/
approximately 40 days of consecutive model training, which can be seen impractical. To alleviate this problem of the time budget of training and of inference as well, we have for comparison purposes also employed an ensemble approach of six deep learning models of smaller 512 × 512 pixel input image size, similarly with some previous works4,5,8. In the Results section the results for 512 × 512 pixel input size ensemble of six models are presented and compared with the single model results. Further details of the ensemble model approach is included in the Supplementary Information.
Model evaluation and comparison against previous works. The present study was conducted by training a separate model for each of the five classification tasks and five input image sizes. To evaluate the perfor-mance of our model in binary classification tasks we use the receiver operating characteristic (ROC) curve from which we determine the area under the ROC curve (AUC) as well as accuracy, sensitivity, and specificity, while in the multi-class cases we use the area under macro average of ROC (macro-AUC) for each class calculated in one-vs-all manner, accuracy and quadratic-weighted kappa score. Also, we calculate the confusion matrices for the multi-class classification tasks. For each metric in the binary classification tasks, the exact 95% confidence interval (CI) was calculated using the Clopper-Pearson method, similar to that in Gulshan et al.4 for comparison. In a recent publication5 a different confidence interval estimation method was used, namely the cluster-bootstrap, providing a bias-corrected, asymptotic 2-sided 95% CI. This approach used a patient-level clustering for esti-mating the AUC at the population level. In addition, the models trained for NRDR/RDR were evaluated on the Messidor dataset14. The Messidor dataset is labelled for 4-grade grading system for diabetic retinopathy and 3-grade grading system for risk of macular edema. For the evaluation, the Messidor images were labelled as refer-able if the image had labels for diabetic retinopathy grade ≥2 and/or risk of macular edema grade ≥1, otherwise images were labelled as nonreferable.
We conduct the performance comparison of our model against the performance of the recently presented systems described by Gulshan et al.4, Ting et al.5 and in Krause et al.8. The study by Gulshan et al.4 using a large set of labeled images, was the first deep learning system achieving high values of sensitivity and specificity in detecting referable diabetic retinopathy. The system developed by Ting et al.5 for the same task, was trained using large datasets of multi-ethnic population, achieved nearly comparable results to those by Gulshan et al.4 A more recent work described in Krause et al.8 extended these works, by focusing on classifying the severity of diabetic retinopathy using the five-level PIRC scale. The present study extends these previous studies: (i) by using signifi-cantly less images to train the deep learning system; (ii) by conducting experiments on five different classification systems, including two clinically used scales, PIRC and PIMEC (which has not been investigated by any previous related studies); (iii) by performing training for different tasks without aggregated model prediction to provide
Grading system Patients/Label Training Tuning Primary validation
RDR
Patients, No. 8694 1313 2477
Images Total, No. (%) 24806 (100) 3706 (100) 7118 (100)
Images Grade 0, No. (%) 13895 (56.0) 2079 (56.1) 4031 (56.6)
Images Grade 1, No. (%) 10911 (44.0) 1627 (43.9) 3087 (43.4)
PIRC
Patients, No. 8770 1259 2455
Images Total, No. (%) 24941 (100) 3560 (100) 7129 (100)
Images Grade 0, No. (%) 11160 (44.7) 1573 (44.2) 3229 (45.3)
Images Grade 1, No. (%) 2793 (11.2) 408 (11.5) 842 (11.8)
Images Grade 2, No. (%) 9221 (37.0) 1312 (36.9) 2597 (36.4)
Images Grade 3, No. (%) 1480 (5.9) 225 (6.3) 382 (5.4)
Images Grade 4, No. (%) 287 (1.2) 42 (1.2) 79 (1.1)
RDME
Patients, No. 8669 1281 2534
Images Total, No. (%) 24651 (100) 3675 (100) 7304 (100)
Images Grade 0, No. (%) 20819 (84.5) 3113 (84.7) 6162 (84.4)
Images Grade 1, No. (%) 3832 (15.5) 562 (15.3) 1142 (15.6)
PIMEC
Patients, No. 8708 1242 2534
Images Total, No. (%) 24791 (100) 3535 (100) 7304 (100)
Images Grade 0, No. (%) 20958 (84.5) 2974 (84.1) 6162 (84.4)
Images Grade 1, No. (%) 1531 (6.2) 237 (6.7) 465 (6.4)
Images Grade 2, No. (%) 1566 (6.3) 222 (6.2) 438 (6.0)
Images Grade 3, No. (%) 736 (3.0) 102 (2.9) 239 (3.3)
QRDR
Patients, No. 10232 1466 2926
Images Total, No. (%) 28787 (100) 4109 (100) 8226 (100)
Images Grade 0, No. (%) 3827 (13.3) 533 (13.0) 1132 (13.8)
Images Grade 1, No. (%) 14005 (48.7) 1991 (48.5) 4009 (48.7)
Images Grade 2, No. (%) 10955 (38.1) 1585 (38.6) 3085 (37.5)
Table 1. Dataset summary. Class distribution shown on as amounts and percentages the dataset divisions between training, tuning, and primary validation used in experiments.

4Scientific RepoRts | (2019) 9:10750 | https://doi.org/10.1038/s41598-019-47181-w
www.nature.com/scientificreportswww.nature.com/scientificreports/
independent results for each task; and (iv) by investigating the effect of image resolution to the model, in order to find out their effect on model performance and a trade-off between the number (or cost) of manually annotated images, image resolution and performance.
ResultsIn the binary classification tasks, i.e. NRDR/RDR and NRDME/RDME, our algorithm achieved the best results using the largest 2095 × 2095 pixels input image size. In the NRDR/RDR classification on our primary validation set having 7118 images, our algorithm achieved the sensitivity of 0.896 (with 95% CI: 0.885–0.907) and speci-ficity 0.974 (with 95% CI: 0.969–979) and AUC of 0.987 (with 95% CI: 0.984–0.989). Our model performance was evaluated at the operating point where the tuning set achieved 0.900 sensitivity, in a similar manner to Ting et al.5, while Gulshan et al.4 had two operating points namely at a high specificity (0.980) point and at a high sensitivity (0.975) point. In Table 2 we present the AUC values of our model, along with the AUC values reported by Gulshan et al.4 and Ting et al.5. The Table 2 also illustrates our results and the results reported by Ting et al.4 at 0.900 sensitivity operating point and results reported by Gulshan et al.4, closest to the 0.900 sensitivity operating point. Two other recent studies, Krause et al.8 and Guan et al.9, also explored the NRDR/RDR classification, but as they do not report results close to the 0.900 sensitivity point, we make a separate comparison with these studies.
As we can see from the Table 2, our result for the AUC, as determined from the ROC curve (see Fig. 1), and the specificity on a similar sensitivity point are on par with the results by Gulshan et al.4. Our model outperforms the system proposed by Ting et al.5 in AUC and specificity at the same sensitivity point, 0.900. We have also experi-mented with a similar operating point selection as Gulshan et al.4 When operating point was selected for clinical setting, having high specificity of approximately 0.980, our model scored 0.883 (0.880–0.886) sensitivity and 0.980 (0.979–0.981) specificity, in comparison to 0.903 (0.875–0.927) sensitivity and 0.981 (0.978–0.985) specificity reported in Gulshan et al.4 With the operating point chosen for screening, having high sensitivity, our model scored 0.968 (0.961–0.974) sensitivity and 0.893 (0.883–0.902) specificity, compared to 0.975 (0.958–0.987) sen-sitivity and 0.934 (0.928–0.940) specificity reported by Gulshan et al.4
The study presented in Guan et al.9 also considers the problem of classifying the stage of diabetic retinopathy as nonreferable vs. referable diabetic retinopathy (NRDR/RDR). However, the method they proposed differs considerably from ours, as it models multiple labels, one for each individual labeler (medical expert), whereas our labels are constructed based on agreement between multiple labelers such that each model predicts only one label. In their case the best performing model is trained to predict the PIRC label for an image, and NRDR/RDR label is obtained by aggregating the PIRC grade probabilities. The best results presented in their work include 0.9745 AUC and 0.9093 accuracy for the NRDR/RDR binary classification task, which are both outperformed by our best results of 0.987 AUC and an accuracy of 0.940. They also present 0.8361 specificity at 0.97 sensitivity point, which was outperformed by our model at a similar point with 0.960 sensitivity and 0.909 specificity. The dataset used in Guan et al.9 was reported to be the same as used by Gulshan et al.4, however the reported input image size was 587 × 587 pixels.
The more recent study presented in Krause et al.8 also considers NRDR/RDR classification using aggregated PIRC predictions. They report the AUC of their best model being 0.986, which is comparable to our 0.987 AUC. They also presented the specificity of 0.923 at 0.971 sensitivity, which outperforms our models specificity of 0.909 at 0.960 sensitivity value.
The highest AUC for detecting referable diabetic macular edema (RDME) achieved by our model was 0.989 (0.986–0.991) with 2095 × 2095 resolution images. In Gulshan et al.4 and Krause et al.8, the NRDME/RDME clas-sification performance is reported at specified operating points. In Gulshan et al.4 an operating point with 0.908 (0.861–0.943) sensitivity and 0.987 (0.984–0.990) specificity was reported, whereas at a similar point sensitivity of 0.905 (0.887–0.922) our model had specificity of 0.978 (0.974–0.982), slightly underperforming in comparison. In Krause et al.8 the sensitivity of 0.949 and specificity of 0.944 were reported for the detection of RDME. Our model achieved 0.954 specificity at similar sensitivity point of 0.947, thus slightly outperforming their proposed system.
In the multiclass classification tasks, i.e. PIRC, PIMEC, and QRDR, our algorithm achieved the best results, in terms of the macro-AUC, using 2095 × 2095 pixels input image size for PIRC and PIMEC tasks and for QRDR best results were achieved with 1024 × 1024 and 2095 × 2095 image sizes. In the PIRC classification task on our primary validation set having 7129 images, our algorithm achieved best performance measured in macro-AUC
Author Train samples Validation samples Input size AUC Sensitivity Specificity
Gulshan et al.4 118419 8788 299 0.991(0.988–0.993)a
0.903(0.875–0.927)a
0.981(0.978–0.985)a
Ting et al.5 76370 71896 512 0.936(0.925–0.943)b
0.905(0.873–0.930)c
0.916(0.910–0.922)c
Ours 28512 7118 2095 0.987(0.984–0.989)a
0.896(0.885–0.907)a
0.974(0.969–0.979)a
Table 2. Comparison of classification results for referable diabetic retinopathy. The train and validation samples refer to the image amounts in the respective sets, and the input size refers to the image width and height in pixels. Tuning set is included in the train sample size. Our operating point for sensitivity and specificity is calculated at 0.900 sensitivity for comparison of results at similar operating point to Gulshan et al.4 and Ting et al.5. a95% exact CI calculated with Clopper-Pearson method. b95% asymptotic, bias-corrected CI calculated with cluster-bootstrap on patient level. c95% asymptotic CI calculated for each logit with cluster sandwich using on patient level.

5Scientific RepoRts | (2019) 9:10750 | https://doi.org/10.1038/s41598-019-47181-w
www.nature.com/scientificreportswww.nature.com/scientificreports/
value of 0.962, with accuracy of 0.869 and quadratic-weighted kappa of 0.910. When the performance was meas-ured using quadratic-weighted kappa, the best performing model was achieved using 1024 × 1024 pixels input image size, with macro-AUC value of 0.961, accuracy of 0.870 and quadratic-weighted kappa of 0.915. Krause et al.8 reported their system for PIRC classification having the quadratic-weighted kappa value of 0.84, which is outperformed by all our models trained by using larger than 299 × 299 pixels input image size models. Results for multiclass classifications tasks for each image size are shown in Table 3. Additional results for aggregated RDR and RDME predictions are shown in the Supplementary Tables 1 and 2.
Our experiments also included novel results for QRDR and the clinically used PIMEC grading systems. In the QRDR task on the primary validation set of 8226 images, our algorithm achieved the best results in macro-AUC, accuracy and quadratic-weighted kappa, using the 1024 × 1024 pixels input image size. The model achieved macro-AUC of 0.991, accuracy of 0.938 and quadratic-weighted kappa of 0.932. In the PIMEC classification task the primary validation set of 7304 images, our algorithm achieved the best results for the macro-AUC and quadratic-weighted kappa using 2095 × 2095 resolution images and the best results for accuracy using 1024 × 1024 resolution images. The model with the greatest macro-AUC had the value of 0.981 with accuracy of 0.934 and quadratic-weighted kappa of 0.856. The ROC curves of the best performing models based on macro-AUC are shown in Fig. 2.
The effect of the input image size on the ROC curves in binary classification tasks are illustrated in Fig. 1, in which NRDR/RDR and NRDME/RDME classification systems are considered. From the subfigures and the
Figure 1. ROC curves for nonreferable vs. referable diabetic retinopathy in classifying nonreferable vs. referable macular edema on primary validation set and Messidor set. (A) NRDR/RDR classification on the primary validation set (N = 7118). (B) NRDR/RDR classification on Messidor set (N = 1200). (C) NRDME/RDME classification on the primary validation set (N = 7304). (D) NRDME/RDME classification on Messidor set (N = 1200). Referable vs. nonreferable diabetic retinopathy shown in (A,B) and referable diabetic macular edema shown in C and D. ROC curve is shown for input image sizes of 256 × 256, 299 × 299, 512 × 512, 1024 × 1024 and 2095 × 2095 pixels. AUC shown in parentheses in the legend.

6Scientific RepoRts | (2019) 9:10750 | https://doi.org/10.1038/s41598-019-47181-w
www.nature.com/scientificreportswww.nature.com/scientificreports/
tables we can see that increasing the input image resolution from 256 × 256 to 512 × 512 clearly improved the results, and even better results were obtained as the resolution was further increased; note that the modeling setup was slightly different for the 2095 × 2095 sized input images than for the others, as mentioned earlier. A similar observation was also made by Krause et al.8, however their analysis was constrained in the context of PIRC clas-sification, whereas we have systematically analyzed the effect of image resolution for five different classification systems.
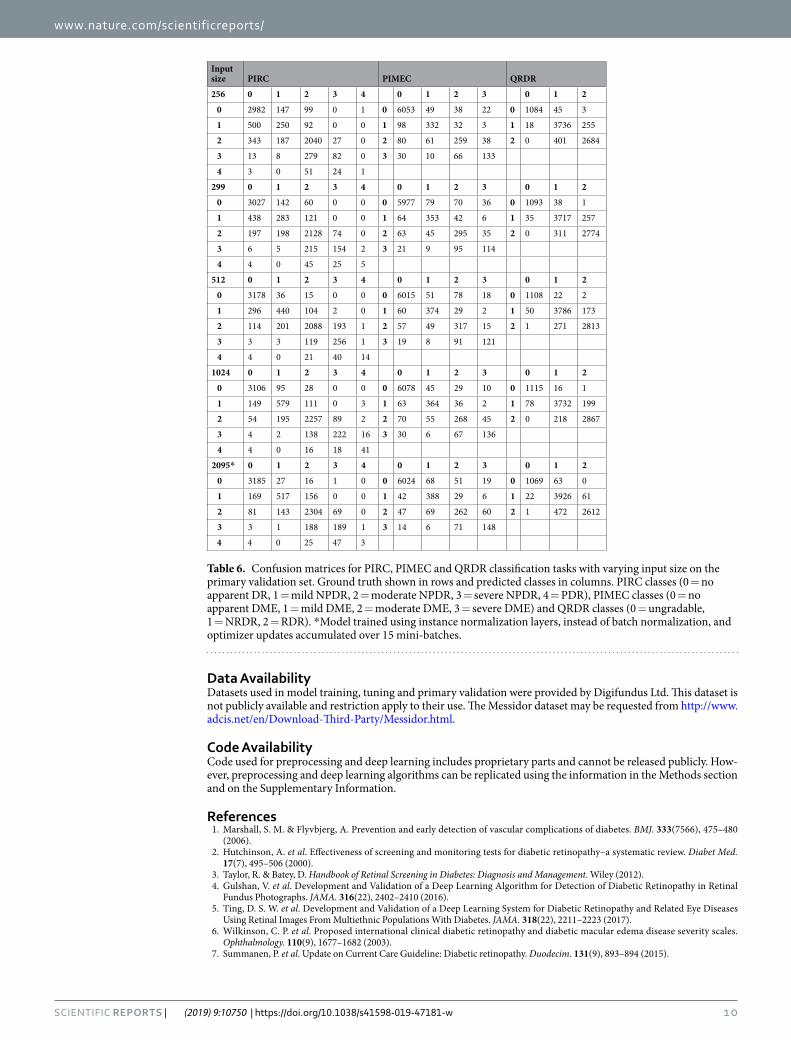
In Fig. 1 we provide illustrations of the ROC curves on the Messidor dataset14. From these curves we can see that the dependence of the model performance on the input image size is not as clear for the Messidor dataset. This is possibly in part due to the fact that Messidor images have multiple different resolutions, the smallest being of 900 × 900 pixels, which were resized into the sizes shown in Fig. 1. In addition, the imaging equipment used in capturing the Messidor dataset and out primary dataset differ, and it is reported by Decencière et al.15 that one third of the Messidor images were captured without Tropicamide induced pupil dilation. The detailed numerical results for each input image size on the multi-class and binary classification tasks are presented in Tables 3–5. Confusion matrices for multiclass tasks are shown in Table 6.
In order to investigate the issue of the time budget of training/inference vs. model performance, using an ensemble of smaller input retinal image size models against the single image sized models, we have done addi-tional experiments using an ensemble of six deep learning models with 512 × 512 sized retinal images. These experiments show improved performance in comparison to a single model with the same input image size for all the classification tasks and in some cases improved performance compared to single models using larger ret-inal input image sizes. On our primary validation set, the ensemble model achieved 0.984 (0.981–0.987) AUC in the task of NRDR/RDR classification being slightly below the best result of 0.987 (0.984–0.989) for the sin-gle 2095 × 2095 image size model; 0.992 (0.989–0.994) AUC in the NRDME/RDME classification being slightly above the best result of 0.989 (0.986–0.991) for the single 2095 × 2095 image size model; 0.904 quadratic-weighted kappa in the PIRC classification being slightly below the best result of 0.915 for the single 1024 × 1024 image size model; 0.938 quadratic-weighted kappa in QRDR classification being slightly above the best result of 0.932 for the single 1024 × 1024 image size model and 0.904 quadratic-weighted kappa in PIMEC classification being some-what above the best result of 0.856 for the single 2095 × 2095 image size model. On the Messidor image dataset, the ensemble model achieved 0.965 (0.953–0.974) AUC in the NRDR/RDR classification being slightly below the best result of 0.967 (0.955–0.976) for the single 2095 × 2095 image size model and 0.953 (0.940–0.965) AUC in the NRDME/RDME classification being slightly above the best result of 0.946 (0.932–0.958) for the single 2095 × 2095 image size model. Further performance measures, analysis and description on the ensemble model are presented in the Supplementary Information. Overall we see that the performance of using an ensemble of six deep learning models with 512 × 512 sized retinal images is more or less the same as the best performance of a single model, usually with larger input image size. However, the main gain of the ensemble-based approach is in the time budget, as training the ensemble of six deep learning models with 512 × 512 sized retinal images took about 102 minutes while training a single model with 2095 × 2095 sized retinal images took about 383 minutes, i.e. nearly four times longer.
The Messidor results reported by Gulshan et al.4 were obtained on larger Messidor-2 dataset, whereas we use the standard Messidor set, which is a subset of Messidor-2. In addition, it was reported that the Messidor-2
Grading system Input size Macro-AUC Accuracy Quadratic-Weighted Kappa
PIRC 256 0.901 0.751 0.772
PIRC 299 0.919 0.785 0.834
PIRC 512 0.951 0.838 0.894
PIRC 1024 0.961 0.870 0.915
PIRC 2095* 0.962 0.869 0.910
PIRC 6 × 512a 0.958 0.944 0.904
QRDR 256 0.977 0.912 0.901
QRDR 299 0.981 0.922 0.914
QRDR 512 0.989 0.937 0.930
QRDR 1024 0.991 0.938 0.932
QRDR 2095* 0.991 0.925 0.914
QRDR 6 × 512a 0.991 0.962 0.938
PIMEC 256 0.959 0.928 0.813
PIMEC 299 0.970 0.923 0.803
PIMEC 512 0.979 0.935 0.832
PIMEC 1024 0.978 0.937 0.846
PIMEC 2095* 0.981 0.934 0.856
PIMEC 6 × 512a 0.983 0.973 0.871
Table 3. Classification results for PIRC, QRDR and PIMEC with varying input image sizes on the primary validation set. Macro-AUC refers to area under macro average of ROC for each class one-vs-all manner. *Trained with model using instance normalization layers and an optimizer with accumulation of 15 mini-batches. aEnsemble of six classifiers trained on same data with same input size.

7Scientific RepoRts | (2019) 9:10750 | https://doi.org/10.1038/s41598-019-47181-w
www.nature.com/scientificreportswww.nature.com/scientificreports/
dataset was annotated for NRDR/RDR by Gulshan et al.4, whereas our labels were derived from the provided Messidor labels to be as close as possible counterparts of the NRDR/RDR system. The labels used in this study are thus not guaranteed to have translated correctly. For the aforementioned reasons, our results on the Messidor dataset are not directly comparable. In addition, it should be noted that our model was trained using only 24% (28512) of the number of images used by Gulshan et al.4 (118419), 37% of the number of images used by Ting et al.5 (76370) and only 1.7% of images used by Krause et al.8 (1662646). However, we trained and evaluated different models using multiple image sizes ranging from 256 × 256 pixels to 2095 × 2095 pixels, whereas the main results reported by Gulshan et al.4, Ting et al.5 and Krause et al.8 were for the image size of 299 × 299 pixels, 512 × 512 pixels and 779 × 779 pixels, respectively. To summarize, the results demonstrate that our proposed system obtained comparable performance to those of the state-of-the-art systems, but by using considerably less or even a small fraction of training images.
DiscussionIn this study, we have presented a systematic computational methodology for diabetic retinopathy and macular edema classification, and assessed its performance on a non-open dataset using five different diabetic retinopathy and macular edema classification systems. We have found that our deep learning model achieved comparable or better results with only a small fraction ( < 1/4) of training set images than used recently by two other groups to obtain the state-of-the-art results in the nonreferable/referable diabetic retinopathy (NRDR/RDR) classification, with similar model architecture. We have also presented state-of-the-art results for classifying retinal images
Figure 2. ROC curves for best performing model for each of the multiclass classification tasks. (A) PIRC classification on the primary validation set (N = 7129) with input size 2095 × 2095. (B) PIMEC classification on the primary validation set (N = 7304) with input size 2095 × 2095. (C) QRDR classification on the primary validation set (N = 8226) with input size 1024 × 1024. Multiclass tasks include PIRC, PIMEC and QRDR for the best performing models based on macro-AUC. ROC curves are shown for each class in one-vs-all strategy with addition of macro-average of ROC. Positive class marked in legend with AUC shown in parentheses.

8Scientific RepoRts | (2019) 9:10750 | https://doi.org/10.1038/s41598-019-47181-w
www.nature.com/scientificreportswww.nature.com/scientificreports/
using the proposed international diabetic retinopathy classification system (PIRC), when measured with Cohen’s quadratic-weighted kappa, using less than 2% of the images than previous state-of-the-art system. Our work also sets for the first time the baseline for classifying retinal images using the clinical scale of the proposed interna-tional macular edema classification system (PIMEC).
The goodness of these results can most likely be attributed on one hand to regularizing image preprocessing and on the other hand to the features in the dataset and in the experimental setting. For example, our database was prepared with class/grade-balance in mind, so that its grade-distribution when considering the NRDR/RDR classification, was aimed to be uniform and include as many severe cases as possible, thus having a grade distribu-tion which does not necessarily follow a population or a clinical distribution. Other attributing aspects possibly include the fact that the retinal images in our dataset were taken from a rather homogeneous population base in terms of ethnicity; the technical quality and the rate of standardization in the imaging setup within our images, and the quality of their gradings may also have attributed to the goodness of results.
We have also investigated the effect of the size of the images used in training, on the performance of the trained deep learning system in the fundus image classification, an assessment which was limited in previous studies to image sizes less than 779 × 779 pixels, thus excluding near native retinal camera resolutions. In our investigation, the classifier was trained on five different input image sizes, for each of the five classification sys-tems. In all tasks, the best performing model according to AUC/macro-AUC metric was the model with the larg-est resolution, namely the images of 2095 × 2095 pixels, except that under the QRDR classification the best results were achieved with image sizes of 1024 × 1024 and 2095 × 2095 pixels.
It was observed that the AUC performance overall increased with the input image size, which could be attrib-uted to the fact that the amount of information and features in the images increases with the image size. However, in our implementation, increasing the input image size without modifying the model architecture, dramatically increased the average duration of training and inference as well as memory requirements in the computations. This in fact meant that the modeling setup had to be different for the 2095 × 2095 input images than for the other ones. As an example, training a slightly modified model using the input size of 2095 × 2095 pixels with mini-batch size of 1 increased the average training time for each epoch approximately 20 times in comparison to the base model using an input size of 512 × 512 pixels with the mini-batch size of 6, but with minimal per-formance improvements in most classification tasks. This suggests that in the case of a fixed wall-clock time requirement for training and inference, it might be better to consider a smaller input image size, and do a wider (grid-)search in terms of the other hyperparameters and/or training an ensemble of classifiers, latter option also suggested by our ensemble model experiment.
Grading system
Input size AUC Sensitivity Specificity Accuracy
RDR 2560.961 0.895 0.913 0.905
(0.956–0.965) (0.884–0.906) (0.904–0.921) (0.898–0.912)
RDR 2990.97 0.896 0.946 0.924
(0.966–0.974) (0.884–0.906) (0.938–0.953) (0.918–0.930)
RDR 5120.979 0.9 0.963 0.935
(0.975–0.982) (0.888–0.910) (0.956–0.968) (0.929–0.941)
RDR 10240.984 0.91 0.97 0.944
(0.981–0.987) (0.899–0.920) (0.964–0.975) (0.938–0.949)
RDR 2095*0.987 0.896 0.974 0.94
(0.984–0.989) (0.885–0.907) (0.969–0.979) (0.935–0.946)
RDR 6 × 512a0.984 0.904 0.971 0.942
(0.981–0.987) (0.897–0.911) (0.967–0.975) (0.936–0.947)
RDME 2560.976 0.891 0.953 0.943
(0.973–0.980) (0.871–0.908) (0.948–0.958) (0.938–0.949)
RDME 2990.981 0.891 0.96 0.949
(0.977–0.984) (0.871–0.908) (0.955–0.965) (0.944–0.954)
RDME 5120.986 0.89 0.976 0.963
(0.983–0.989) (0.870–0.907) (0.972–0.980) (0.958–0.967)
RDME 10240.986 0.921 0.974 0.966
(0.983–0.989) (0.904–0.936) (0.970–0.978) (0.961–0.970)
RDME 2095*0.989 0.905 0.978 0.967
(0.986–0.991) (0.887–0.922) (0.974–0.982) (0.963–0.971)
RDME 6 × 512a0.992 0.904 0.983 0.971
(0.989–0.994) (0.897–0.910) (0.980–0.986) (0.967–0.974)
Table 4. Classification results for predicted of NRDR/RDR and NRDME/RDME with varying input image sizes on the primary validation set. Sensitivity, specificity and accuracy measured at 0.900 sensitivity operating point of tuning set. 95% exact Clopper-Pearson confidence interval in brackets. *Trained with model using instance normalization layers and an optimizer with accumulation of 15 mini-batches. aEnsemble of six classifiers trained on same data with same input size.

9Scientific RepoRts | (2019) 9:10750 | https://doi.org/10.1038/s41598-019-47181-w
www.nature.com/scientificreportswww.nature.com/scientificreports/
Our results on the primary validation dataset using the ensemble of six models trained with 512 × 512 sized retinal images, show overall improved performance in comparison to the single model on same input size, and in the cases of NRDME/RDME, QRDR and PIMEC also in comparison to the single model results using largest 2095 × 2095 sized retinal images, yet with the huge savings in the time budget of training/inference, i.e. reaching comparable performance with nearly one quarter of the wall clock time. However, the computational cost in training an ensemble model grows linearly with the number of models. For smaller than 512 × 512 sized retinal images it is natural to assume on the basis of the single model results that with the ensemble approach savings in the time budget of training/inference will increase even more but with poorer performance. The situation with ensemble approach for larger than 512 × 512 sized images is expected to be the opposite, i.e. giving rise to compa-rable or even larger time budget of training/inference but with only very marginal improvement to already very good performance of the single models. It is interesting to note that deep learning models trained on a small set of retinal images do not learn identical features, as there exists variation in the predictive performance between the single model and the ensemble model trained on same sized images, even when the neural networks are identically initialized to ImageNet pretrained weights, which is a valuable observation. Furthermore, we can state that the ensemble approach increases the robustness of the classification, as evidenced by our ensemble model experiment outperforming the single 512 × 512 retinal image based model in every classification task. These observations are of practical importance from the deep learning methodology and medical technology synthesis points of view.
Finally, we acknowledge the following limitations of our present deep learning AI-system. The first one con-cerns the image grading reference, which in our case was provided as an agreement of two experienced and qualified graders for each image, but could unavoidably include grader biases that can result in decreased general-ization performance of the model. In addition, as was expressed in Gulshan et al.4, deep learning neural networks have an inherent limitation of possibly learning features that are unknown or ignored by medical experts, when the network is only fed in an image and its grading without defining diagnostically important features such as microaneurysms and exudates as well as their numbers that are important biomarkers of diabetic retinopathy.
In our study we have demonstrated that a deep learning AI-system applied to a relatively small retinal image dataset could accurately identify the severity grades of diabetic retinopathy and macular edema and that its accu-racy was improved by using high resolution and quality images.
Grading system Input size AUC Sensitivity Specificity Accuracy
RDR 2560.905 0.826 0.872 0.853
(0.887–0.921) (0.790–0.858) (0.845–0.896) (0.831–0.872)
RDR 2990.94 0.906 0.824 0.859
(0.926–0.953) (0.877–0.930) (0.794–0.852) (0.838–0.878)
RDR 5120.966 0.945 0.811 0.868
(0.954–0.976) (0.922–0.963) (0.780–0.840) (0.848–0.887)
RDR 1024*0.957 0.853 0.955 0.912
(0.944–0.968) (0.820–0.883) (0.937–0.969) (0.894–0.927)
RDR 2095*,**0.967 0.859 0.971 0.923
(0.955–0.976) (0.826–0.888) (0.956–0.982) (0.907–0.938)
RDR 6 × 512a0.965 0.92 0.871 0.892
(0.953–0.974) (0.903–0.935) (0.851–0.889) (0.873–0.909)
RDME 2560.917 0.619 0.969 0.903
(0.900–0.932) (0.553–0.683) (0.956–0.979) (0.885–0.919)
RDME 2990.925 0.633 0.975 0.911
(0.908–0.939) (0.566–0.696) (0.964–0.984) (0.893–0.926)
RDME 5120.931 0.69 0.989 0.932
(0.915–0.944) (0.626–0.750) (0.980–0.994) (0.917–0.946)
RDME 1024*0.888 0.606 0.991 0.918
(0.869–0.905) (0.539–0.670) (0.983–0.996) (0.901–0.933)
RDME 2095*,**0.946 0.597 0.992 0.917
(0.932–0.958) (0.530–0.662) (0.984–0.996) (0.900–0.932)
RDME 6 × 512a0.953 0.575 0.995 0.916
(0.940–0.965) (0.547–0.603) (0.989–0.998) (0.899–0.931)
Table 5. Classification results for predicted of RDR and RDME with varying input image sizes on the Messidor dataset. Classification on the Messidor set15. Sensitivity, specificity and accuracy measured at 0.900 sensitivity operating point of tuning set. 95% exact Clopper-Pearson confidence interval in brackets. *Messidor images upscaled from input image size of 900 × 900 pixels using bicubic interpolation. **Trained with model using instance normalization layers and an optimizer with accumulation of 15 mini-batches. aEnsemble of six classifiers trained on same data with same input size.
1 0Scientific RepoRts | (2019) 9:10750 | https://doi.org/10.1038/s41598-019-47181-w
www.nature.com/scientificreportswww.nature.com/scientificreports/
Data AvailabilityDatasets used in model training, tuning and primary validation were provided by Digifundus Ltd. This dataset is not publicly available and restriction apply to their use. The Messidor dataset may be requested from http://www.adcis.net/en/Download-Third-Party/Messidor.html.
Code AvailabilityCode used for preprocessing and deep learning includes proprietary parts and cannot be released publicly. How-ever, preprocessing and deep learning algorithms can be replicated using the information in the Methods section and on the Supplementary Information.
References 1. Marshall, S. M. & Flyvbjerg, A. Prevention and early detection of vascular complications of diabetes. BMJ. 333(7566), 475–480
(2006). 2. Hutchinson, A. et al. Effectiveness of screening and monitoring tests for diabetic retinopathy–a systematic review. Diabet Med.
17(7), 495–506 (2000). 3. Taylor, R. & Batey, D. Handbook of Retinal Screening in Diabetes: Diagnosis and Management. Wiley (2012). 4. Gulshan, V. et al. Development and Validation of a Deep Learning Algorithm for Detection of Diabetic Retinopathy in Retinal
Fundus Photographs. JAMA. 316(22), 2402–2410 (2016). 5. Ting, D. S. W. et al. Development and Validation of a Deep Learning System for Diabetic Retinopathy and Related Eye Diseases
Using Retinal Images From Multiethnic Populations With Diabetes. JAMA. 318(22), 2211–2223 (2017). 6. Wilkinson, C. P. et al. Proposed international clinical diabetic retinopathy and diabetic macular edema disease severity scales.
Ophthalmology. 110(9), 1677–1682 (2003). 7. Summanen, P. et al. Update on Current Care Guideline: Diabetic retinopathy. Duodecim. 131(9), 893–894 (2015).
Input size PIRC PIMEC QRDR
256 0 1 2 3 4 0 1 2 3 0 1 2
0 2982 147 99 0 1 0 6053 49 38 22 0 1084 45 3
1 500 250 92 0 0 1 98 332 32 3 1 18 3736 255
2 343 187 2040 27 0 2 80 61 259 38 2 0 401 2684
3 13 8 279 82 0 3 30 10 66 133
4 3 0 51 24 1
299 0 1 2 3 4 0 1 2 3 0 1 2
0 3027 142 60 0 0 0 5977 79 70 36 0 1093 38 1
1 438 283 121 0 0 1 64 353 42 6 1 35 3717 257
2 197 198 2128 74 0 2 63 45 295 35 2 0 311 2774
3 6 5 215 154 2 3 21 9 95 114
4 4 0 45 25 5
512 0 1 2 3 4 0 1 2 3 0 1 2
0 3178 36 15 0 0 0 6015 51 78 18 0 1108 22 2
1 296 440 104 2 0 1 60 374 29 2 1 50 3786 173
2 114 201 2088 193 1 2 57 49 317 15 2 1 271 2813
3 3 3 119 256 1 3 19 8 91 121
4 4 0 21 40 14
1024 0 1 2 3 4 0 1 2 3 0 1 2
0 3106 95 28 0 0 0 6078 45 29 10 0 1115 16 1
1 149 579 111 0 3 1 63 364 36 2 1 78 3732 199
2 54 195 2257 89 2 2 70 55 268 45 2 0 218 2867
3 4 2 138 222 16 3 30 6 67 136
4 4 0 16 18 41
2095* 0 1 2 3 4 0 1 2 3 0 1 2
0 3185 27 16 1 0 0 6024 68 51 19 0 1069 63 0
1 169 517 156 0 0 1 42 388 29 6 1 22 3926 61
2 81 143 2304 69 0 2 47 69 262 60 2 1 472 2612
3 3 1 188 189 1 3 14 6 71 148
4 4 0 25 47 3
Table 6. Confusion matrices for PIRC, PIMEC and QRDR classification tasks with varying input size on the primary validation set. Ground truth shown in rows and predicted classes in columns. PIRC classes (0 = no apparent DR, 1 = mild NPDR, 2 = moderate NPDR, 3 = severe NPDR, 4 = PDR), PIMEC classes (0 = no apparent DME, 1 = mild DME, 2 = moderate DME, 3 = severe DME) and QRDR classes (0 = ungradable, 1 = NRDR, 2 = RDR). *Model trained using instance normalization layers, instead of batch normalization, and optimizer updates accumulated over 15 mini-batches.

1 1Scientific RepoRts | (2019) 9:10750 | https://doi.org/10.1038/s41598-019-47181-w
www.nature.com/scientificreportswww.nature.com/scientificreports/
8. Krause, J. et al. Grader Variability and the Importance of Reference Standards for Evaluating Machine Learning Models for Diabetic Retinopathy. Ophthalmology. 125(8), 1264–1272 (2018).
9. Guan, M. Y., Gulshan, V., Dai, A. M. & Hinton, G. E. Who Said What: Modeling Individual Labelers Improves Classification. arXiv e-prints., https://ui.adsabs.harvard.edu/\#abs/2017arXiv170308774G. (Accessed March 01, 2017).
10. Wang, F., Casalino, L. P. & Khullar, D. Deep Learning in Medicine-Promise, Progress, and Challenges. JAMA Intern Med. (2018). 11. Medical Research Act, https://www.finlex.fi/en/laki/kaannokset/1999/en19990488_20100794.pdf (2010) 12. Goodfellow, I., Bengio, Y. & Courville, A. Deep Learning. MIT Press (2016). 13. Szegedy, C., Vanhoucke, V., Ioffe, S., Shlens, J. & Wojna, Z. Rethinking the Inception Architecture for Computer Vision. arXiv
e-prints. 2015, https://ui.adsabs.harvard.edu/\#abs/2015arXiv151200567S (Accessed December 01, 2015). 14. Russakovsky, O. et al. ImageNet Large Scale Visual Recognition Challenge; 115(3):211–252 (2015) 15. Decencière, E. et al. Feedback on a publicly distributed image database: The Messidor database. Vol 02014.
AcknowledgementsJaakko Sahlsten (J.S.), Joel Jaskari (J.J.), Jyri Kivinen (J.K.), Kimmo Kaski (K.K.); Aalto University School of Science, Finland. Lauri Turunen (L.T.), Esa Jaanio (E.J.); Digifundus Ltd, Finland. Kustaa Hietala (K.H.); Central Finland Central Hospital, Finland. J.S. & JJ & JK: Digifundus Ltd KH: Silmäsäätiö. Digifundus Ltd: partial project funding; provider of the retinal image dataset (over 40000 images) and image grading by medical experts. K.K. acknowledges the Rutherford Foundation Visiting Fellowship at The Alan Turing Institute, UK.
Author ContributionsJ.S. & J.J. & J.K.: research and experiment planning, retinal image preprocessing, deep learning neural network design, experiments, results analysis, and manuscript writing; L.T. & E.J.: research and experiment planning, retinal image grading, writing parts of manuscript; K.H.: edited, revised manuscript; K.K.: research and experiment planning, results analysis and interpretation, and manuscript writing, revisions, and final polishing.
Additional InformationSupplementary information accompanies this paper at https://doi.org/10.1038/s41598-019-47181-w.Competing Interests: The authors declare no competing interests.Publisher’s note: Springer Nature remains neutral with regard to jurisdictional claims in published maps and institutional affiliations.
Open Access This article is licensed under a Creative Commons Attribution 4.0 International License, which permits use, sharing, adaptation, distribution and reproduction in any medium or
format, as long as you give appropriate credit to the original author(s) and the source, provide a link to the Cre-ative Commons license, and indicate if changes were made. The images or other third party material in this article are included in the article’s Creative Commons license, unless indicated otherwise in a credit line to the material. If material is not included in the article’s Creative Commons license and your intended use is not per-mitted by statutory regulation or exceeds the permitted use, you will need to obtain permission directly from the copyright holder. To view a copy of this license, visit http://creativecommons.org/licenses/by/4.0/. © The Author(s) 2019