automated areadetection and … v-3-3-11.pdf · one of the stages in diabetic retinopathy is non...
TRANSCRIPT
International Journal of Engineering Research ISSN: 2348-4039
& Management Technology May-2016 Volume 3, Issue-3
Email: [email protected] www.ijermt.org
[email protected] Page 55
AUTOMATED AREADETECTION AND CLASSIFICATION
TYPESINDIABETIC RETINOPATHY IN RETINAL FUNDUS
IMAGES USING NEURAL INTELLIGENCE TECHNIQUES WITH
MATHEMATICAL MORPHOLOGICAL OPERATIONS
UTKARSH SHARMA ANITA MEENA ANANT BHARDWAJ
Technical Expert B.Tech Mechanical Engineering
SO Infotech Pvt Ltd Computer Science Jamia Millia Islamia
Greater Noida Malaviya National Institute of Technology Central University
Jaipur New Delhi
ABSTRACT: This paper focuses on Artificial Neural Network (ANN) to detect diabetic retinopathy in
retinal fundus images. To develop this proposed system, a detection of micro-aneurysms, exudates and blood
vessels is done from retinal fundus images. GLCM is formed using MATLAB function and several features
like entropy, homogeneity, area of micro-aneurysms, exudates and blood vessels act as input to ANN. ANN
is used to classify retinal images as mild, moderate and higher cases of diabetic retinopathy. In order to
classify the DR images, different classes are represented using relevant and significant features.
KEYWORD: Diabetic Retinopathy (DR), fundus image, Area of Micro aneurysms, Area of exudates, Image
processing, Morphological Operations, Optic Disc, Neural Intelligence techniques, Matlab.
I.INTRODUCTION
Diabetic retinopathy is the deterioration of retinal blood vessel which is caused by the complication
of diabetes and it can eventually lead to blindness. The longer the patient has diabetes the higher are the
chances of developing diabetic retinopathy. Diabetic retinopathy is characterized by the development of
retinal Micro aneurysms, Hemorrhages and Exudates.
One of the stages in diabetic retinopathy is Non- Proliferative Diabetic Retinopathy (NPDR), which in this
stage, the proliferative of blood vessels does not occur. Lesions of diabetic retinopathy consist of dark and
bright lesions. The dark lesions comprise of micro aneurysms and hemorrhages, and the bright lesions
include exudates which are yellow deposits of lipid and protein that leak from the capillaries.
There are two levels of diabetic retinopathy namely NPDR and PDR. No proliferative diabetic retinopathy is
the early stage of diabetic retinopathy, and if the patient's blood sugar is uncontrolled it will be rise to
proliferative diabetic retinopathy. No proliferative diabetic retinopathy (NPDR) consists of three levels
which are mild, moderate, and severe NPDR. Digital retinal images which are used for automated detection
of DR contain blood vessels, optic disc, macula and fovea as main components. Any changes in structure of
retina or blood vessel is a sign of abnormality so these main components can be used to highlight the
II. DESCRIPTION OF WORK
The Area of hemorrhages, exudates and micro aneurysms increase as the degree of disease.
Pigmentations of the retina also have striking resemblance to true MAs. As a current trend,Automatic
computer based methods are proposed to assist eye specialists .An automated Micro aneurysm detector can
prove to be an effective tool for automated identification of Diabetic retinopathy in clinical practice.
International Journal Of Engineering Research & Management Technology ISSN: 2348-4039
Email: [email protected] May- 2016 Volume 3, Issue 3 www.ijermt.org
[email protected] Page 56
Automated assessment can save time of the human graders and also provide a history of changes in the
fundus using the digital images.
III. METHODOLOGY
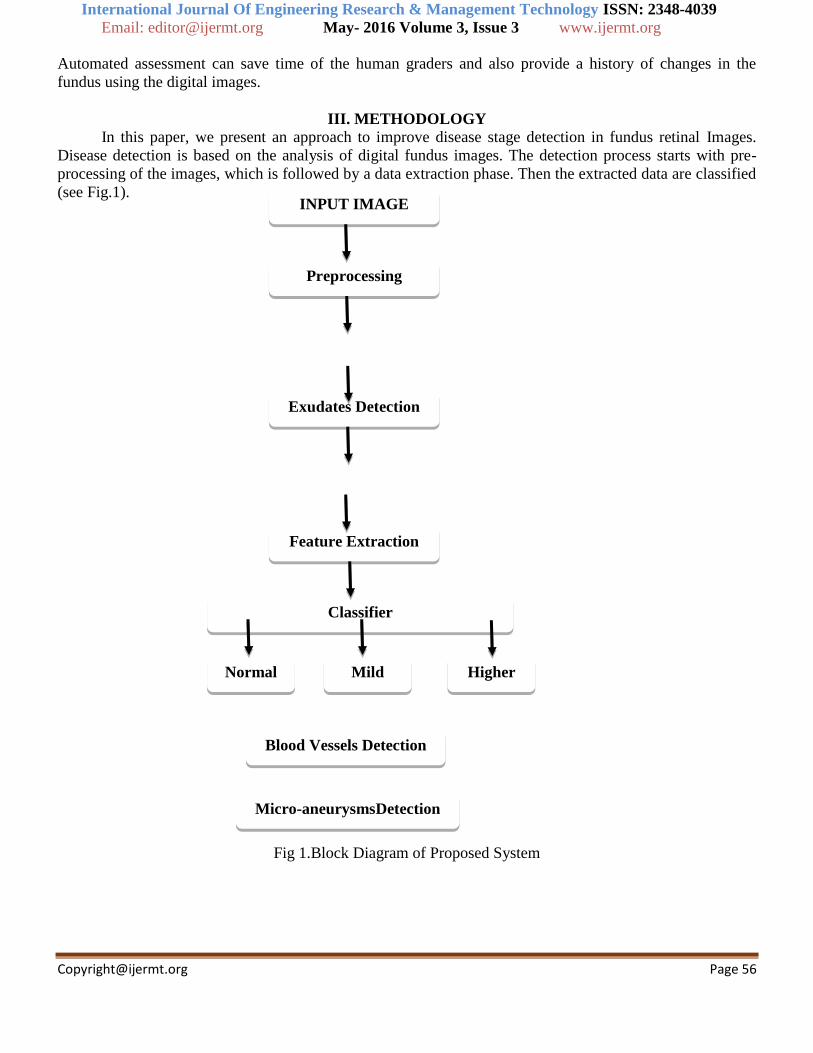
In this paper, we present an approach to improve disease stage detection in fundus retinal Images.
Disease detection is based on the analysis of digital fundus images. The detection process starts with pre-
processing of the images, which is followed by a data extraction phase. Then the extracted data are classified
(see Fig.1).
Fig 1.Block Diagram of Proposed System
INPUT IMAGE
Preprocessing
Blood Vessels Detection
Exudates Detection
Micro-aneurysmsDetection
Feature Extraction
Classifier
Normal Mild Higher
International Journal Of Engineering Research & Management Technology ISSN: 2348-4039
Email: [email protected] May- 2016 Volume 3, Issue 3 www.ijermt.org
[email protected] Page 57
A. PRE-PROCESSING
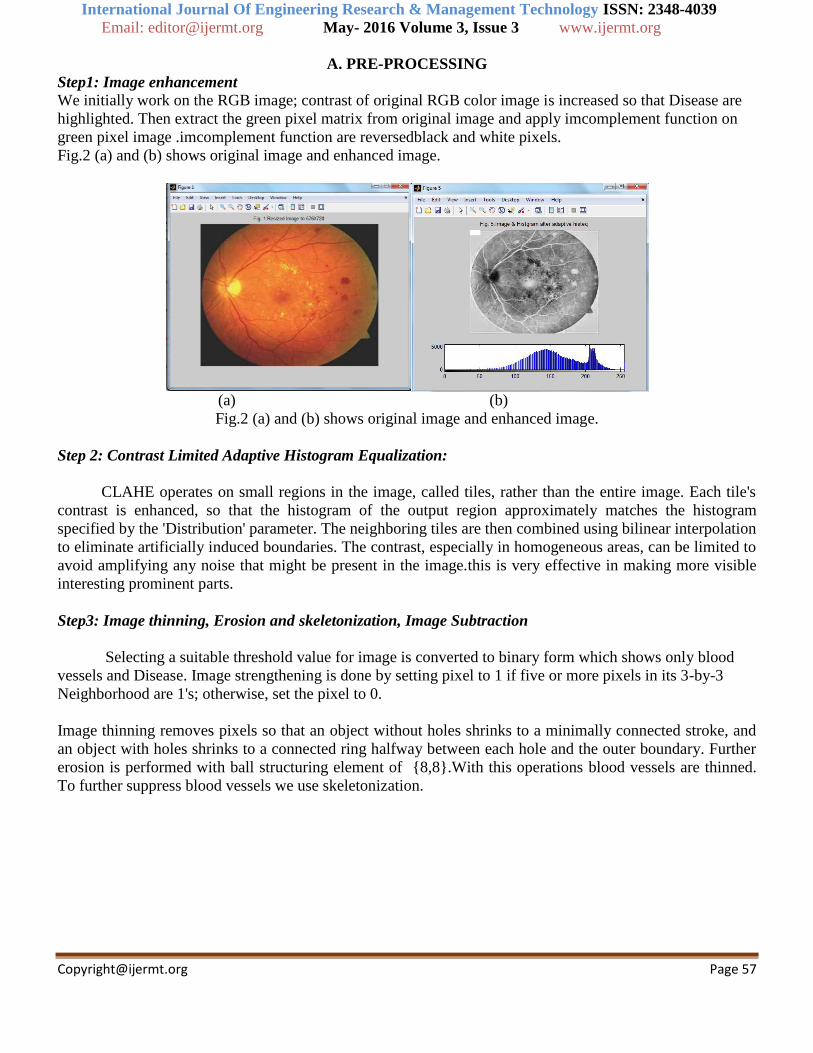
Step1: Image enhancement
We initially work on the RGB image; contrast of original RGB color image is increased so that Disease are
highlighted. Then extract the green pixel matrix from original image and apply imcomplement function on
green pixel image .imcomplement function are reversedblack and white pixels.
Fig.2 (a) and (b) shows original image and enhanced image.
(a) (b)
Fig.2 (a) and (b) shows original image and enhanced image.
Step 2: Contrast Limited Adaptive Histogram Equalization:
CLAHE operates on small regions in the image, called tiles, rather than the entire image. Each tile's
contrast is enhanced, so that the histogram of the output region approximately matches the histogram
specified by the 'Distribution' parameter. The neighboring tiles are then combined using bilinear interpolation
to eliminate artificially induced boundaries. The contrast, especially in homogeneous areas, can be limited to
avoid amplifying any noise that might be present in the image.this is very effective in making more visible
interesting prominent parts.
Step3: Image thinning, Erosion and skeletonization, Image Subtraction
Selecting a suitable threshold value for image is converted to binary form which shows only blood
vessels and Disease. Image strengthening is done by setting pixel to 1 if five or more pixels in its 3-by-3
Neighborhood are 1's; otherwise, set the pixel to 0.
Image thinning removes pixels so that an object without holes shrinks to a minimally connected stroke, and
an object with holes shrinks to a connected ring halfway between each hole and the outer boundary. Further
erosion is performed with ball structuring element of {8,8}.With this operations blood vessels are thinned.
To further suppress blood vessels we use skeletonization.
International Journal Of Engineering Research & Management Technology ISSN: 2348-4039
Email: [email protected] May- 2016 Volume 3, Issue 3 www.ijermt.org
[email protected] Page 58
3(a) 3(b)
Fig.3 (a) and (b) shows image after imerod and dilation and im2bw black and white image.
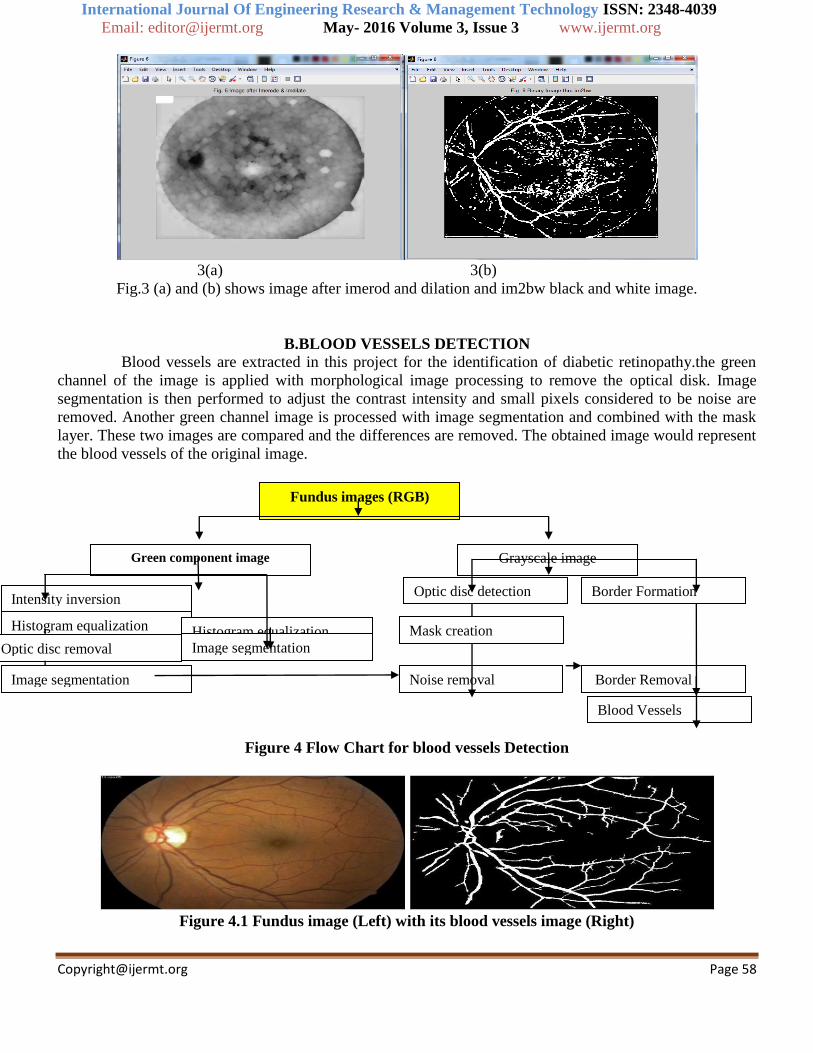
B.BLOOD VESSELS DETECTION
Blood vessels are extracted in this project for the identification of diabetic retinopathy.the green
channel of the image is applied with morphological image processing to remove the optical disk. Image
segmentation is then performed to adjust the contrast intensity and small pixels considered to be noise are
removed. Another green channel image is processed with image segmentation and combined with the mask
layer. These two images are compared and the differences are removed. The obtained image would represent
the blood vessels of the original image.
Figure 4 Flow Chart for blood vessels Detection
Figure 4.1 Fundus image (Left) with its blood vessels image (Right)
Green component image
Fundus images (RGB)
Grayscale image
Intensity inversion
Histogram equalization
Optic disc removal
Image segmentation
Histogram equalization Image segmentation
Optic disc detection
Noise removal
Mask creation
Border Formation
Border Removal
Blood Vessels
International Journal Of Engineering Research & Management Technology ISSN: 2348-4039
Email: [email protected] May- 2016 Volume 3, Issue 3 www.ijermt.org
[email protected] Page 59
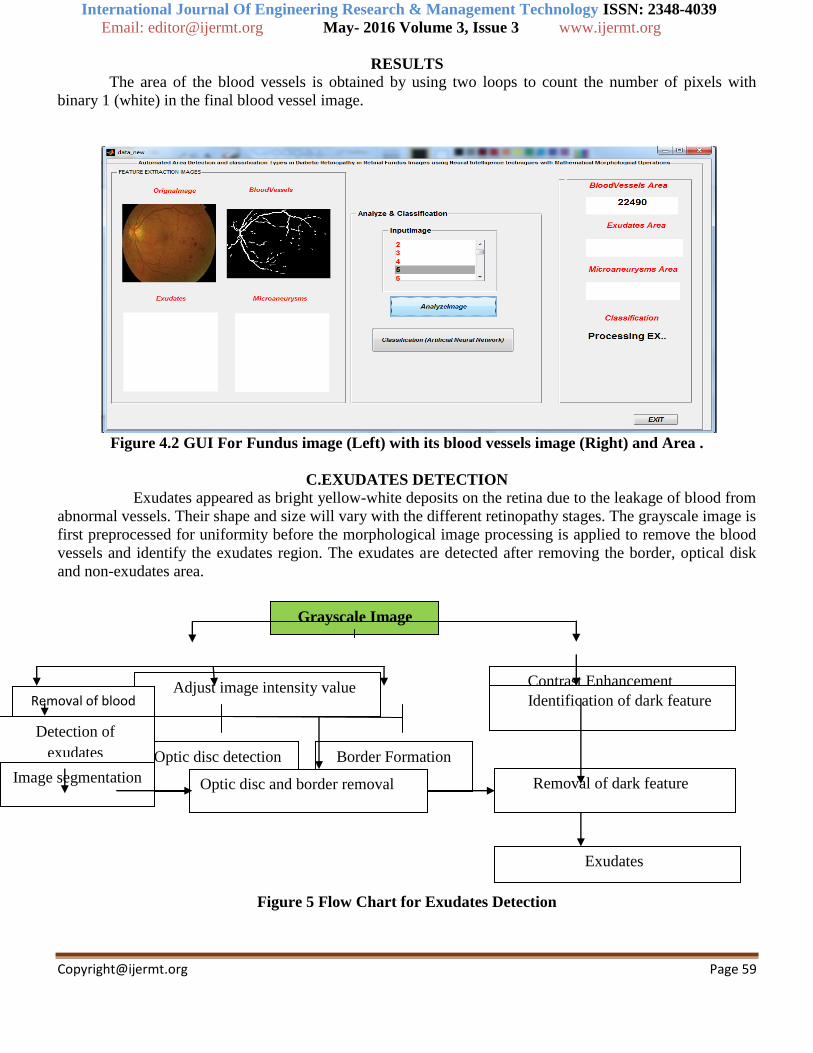
RESULTS The area of the blood vessels is obtained by using two loops to count the number of pixels with
binary 1 (white) in the final blood vessel image.
Figure 4.2 GUI For Fundus image (Left) with its blood vessels image (Right) and Area .
C.EXUDATES DETECTION
Exudates appeared as bright yellow-white deposits on the retina due to the leakage of blood from
abnormal vessels. Their shape and size will vary with the different retinopathy stages. The grayscale image is
first preprocessed for uniformity before the morphological image processing is applied to remove the blood
vessels and identify the exudates region. The exudates are detected after removing the border, optical disk
and non-exudates area.
Figure 5 Flow Chart for Exudates Detection
Grayscale Image
Adjust image intensity value Contrast Enhancement
Removal of blood
vessels
Border Formation Optic disc detection
Detection of
exudates
Image segmentation Optic disc and border removal
Identification of dark feature
Removal of dark feature
Exudates
International Journal Of Engineering Research & Management Technology ISSN: 2348-4039
Email: [email protected] May- 2016 Volume 3, Issue 3 www.ijermt.org
[email protected] Page 60
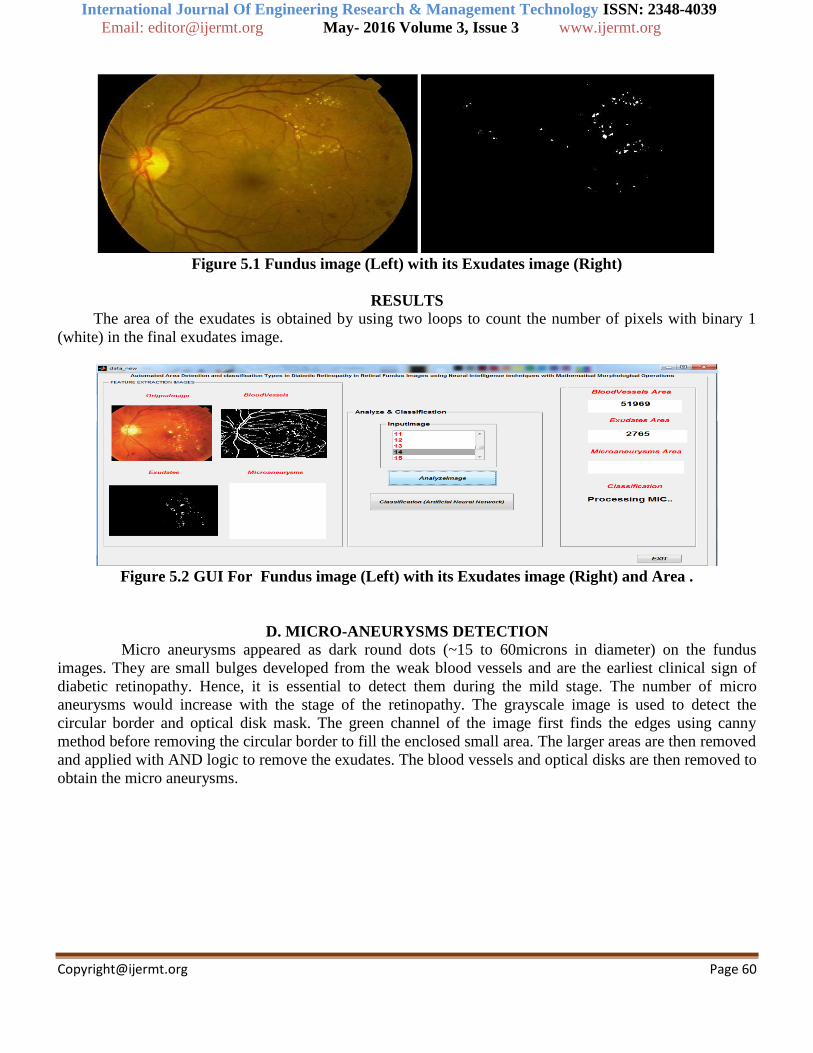
Figure 5.1 Fundus image (Left) with its Exudates image (Right)
RESULTS The area of the exudates is obtained by using two loops to count the number of pixels with binary 1
(white) in the final exudates image.
Figure 5.2 GUI For Fundus image (Left) with its Exudates image (Right) and Area .
D. MICRO-ANEURYSMS DETECTION
Micro aneurysms appeared as dark round dots (~15 to 60microns in diameter) on the fundus
images. They are small bulges developed from the weak blood vessels and are the earliest clinical sign of
diabetic retinopathy. Hence, it is essential to detect them during the mild stage. The number of micro
aneurysms would increase with the stage of the retinopathy. The grayscale image is used to detect the
circular border and optical disk mask. The green channel of the image first finds the edges using canny
method before removing the circular border to fill the enclosed small area. The larger areas are then removed
and applied with AND logic to remove the exudates. The blood vessels and optical disks are then removed to
obtain the micro aneurysms.
International Journal Of Engineering Research & Management Technology ISSN: 2348-4039
Email: [email protected] May- 2016 Volume 3, Issue 3 www.ijermt.org
[email protected] Page 61
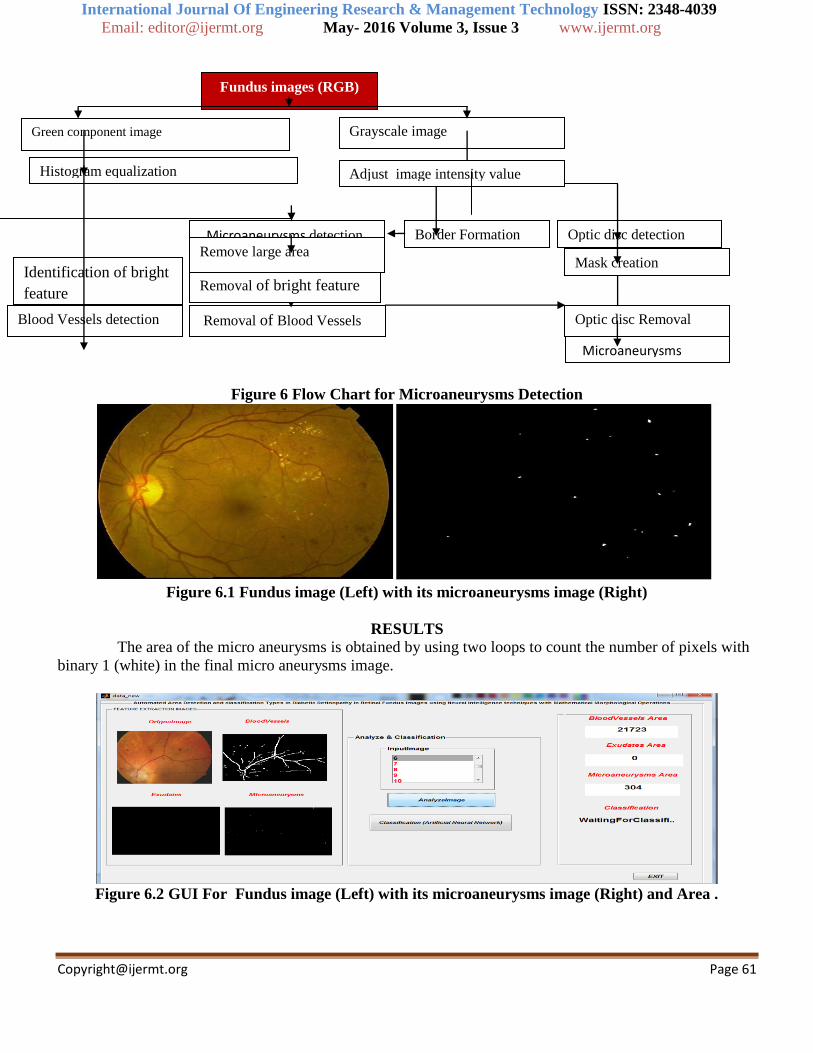
Figure 6 Flow Chart for Microaneurysms Detection
Figure 6.1 Fundus image (Left) with its microaneurysms image (Right)
RESULTS The area of the micro aneurysms is obtained by using two loops to count the number of pixels with
binary 1 (white) in the final micro aneurysms image.
Figure 6.2 GUI For Fundus image (Left) with its microaneurysms image (Right) and Area .
Green component image
Fundus images (RGB)
Grayscale image
Microaneurysms detection
Removal of Blood Vessels
Removal of bright feature
Histogram equalization
Remove large area
Border Formation
Microaneurysms
Optic disc detection
Mask creation
Optic disc Removal Blood Vessels detection
Identification of bright
feature
Adjust image intensity value
International Journal Of Engineering Research & Management Technology ISSN: 2348-4039
Email: [email protected] May- 2016 Volume 3, Issue 3 www.ijermt.org
[email protected] Page 62
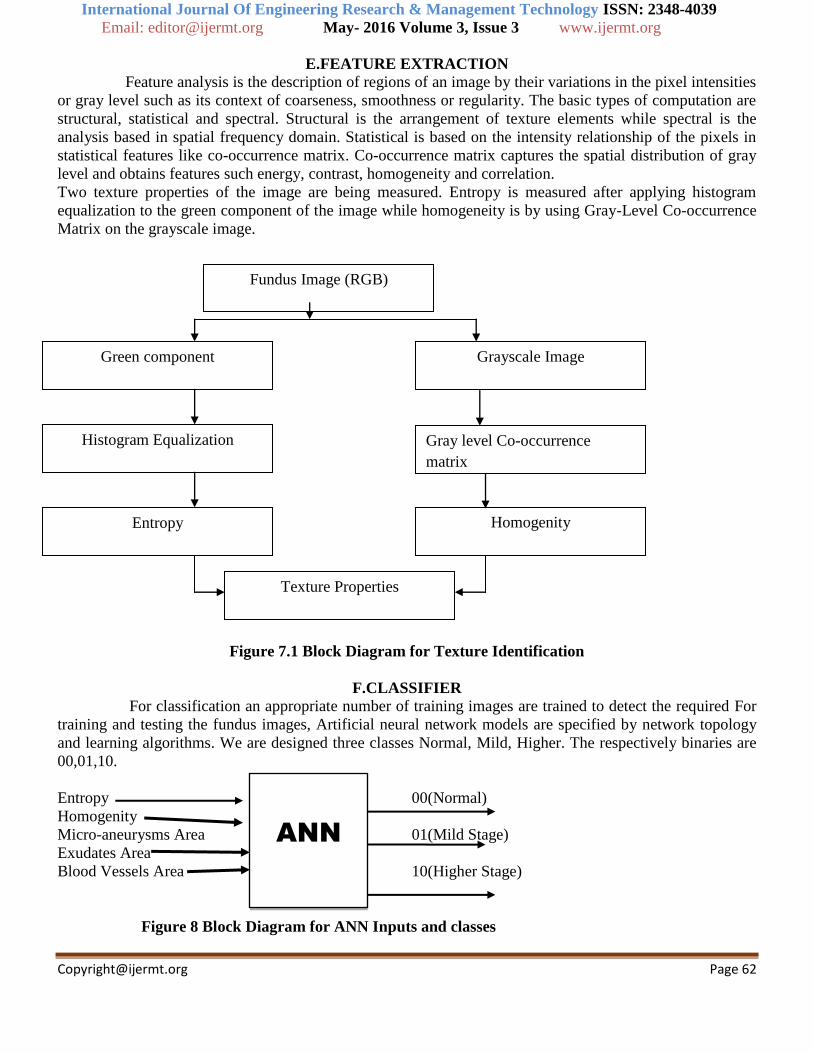
E.FEATURE EXTRACTION
Feature analysis is the description of regions of an image by their variations in the pixel intensities
or gray level such as its context of coarseness, smoothness or regularity. The basic types of computation are
structural, statistical and spectral. Structural is the arrangement of texture elements while spectral is the
analysis based in spatial frequency domain. Statistical is based on the intensity relationship of the pixels in
statistical features like co-occurrence matrix. Co-occurrence matrix captures the spatial distribution of gray
level and obtains features such energy, contrast, homogeneity and correlation.
Two texture properties of the image are being measured. Entropy is measured after applying histogram
equalization to the green component of the image while homogeneity is by using Gray-Level Co-occurrence
Matrix on the grayscale image.
Figure 7.1 Block Diagram for Texture Identification
F.CLASSIFIER
For classification an appropriate number of training images are trained to detect the required For
training and testing the fundus images, Artificial neural network models are specified by network topology
and learning algorithms. We are designed three classes Normal, Mild, Higher. The respectively binaries are
00,01,10.
Entropy 00(Normal)
Homogenity
Micro-aneurysms Area 01(Mild Stage)
Exudates Area
Blood Vessels Area 10(Higher Stage)
Figure 8 Block Diagram for ANN Inputs and classes
Fundus Image (RGB)
Green component
Histogram Equalization
Entropy
Grayscale Image
Gray level Co-occurrence
matrix
Homogenity
Texture Properties
ANN
International Journal Of Engineering Research & Management Technology ISSN: 2348-4039
Email: [email protected] May- 2016 Volume 3, Issue 3 www.ijermt.org
[email protected] Page 63
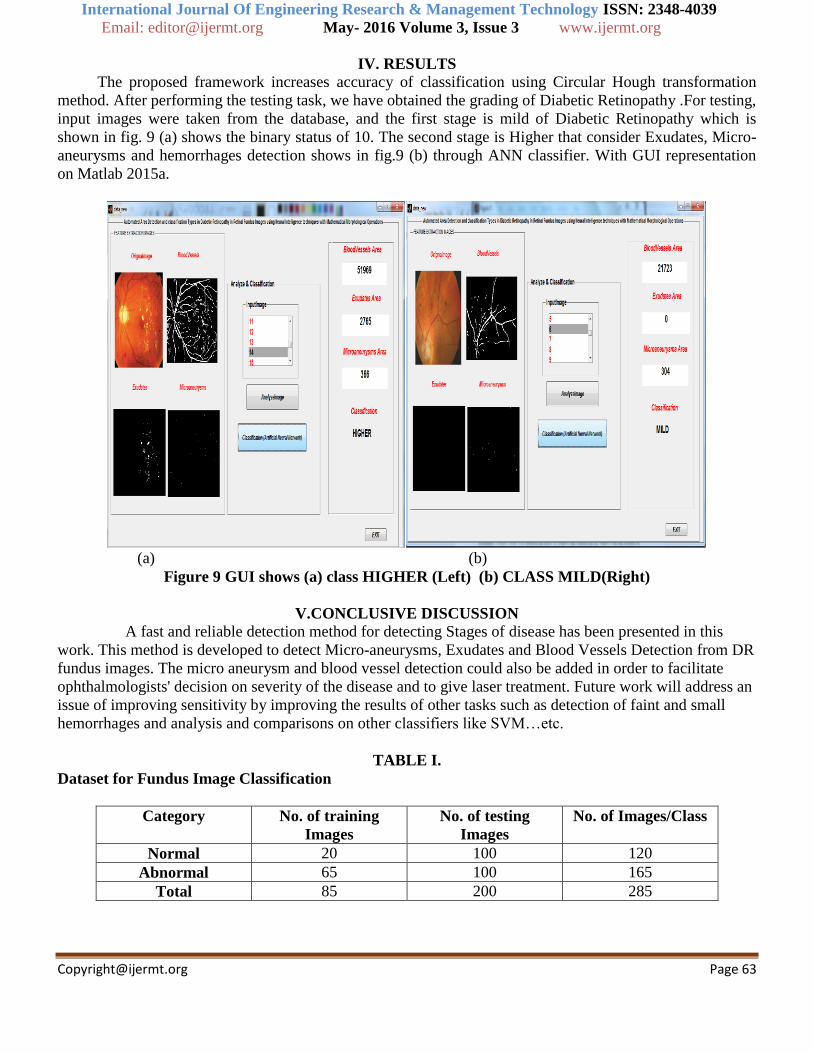
IV. RESULTS
The proposed framework increases accuracy of classification using Circular Hough transformation
method. After performing the testing task, we have obtained the grading of Diabetic Retinopathy .For testing,
input images were taken from the database, and the first stage is mild of Diabetic Retinopathy which is
shown in fig. 9 (a) shows the binary status of 10. The second stage is Higher that consider Exudates, Micro-
aneurysms and hemorrhages detection shows in fig.9 (b) through ANN classifier. With GUI representation
on Matlab 2015a.
(a) (b)
Figure 9 GUI shows (a) class HIGHER (Left) (b) CLASS MILD(Right)
V.CONCLUSIVE DISCUSSION
A fast and reliable detection method for detecting Stages of disease has been presented in this
work. This method is developed to detect Micro-aneurysms, Exudates and Blood Vessels Detection from DR
fundus images. The micro aneurysm and blood vessel detection could also be added in order to facilitate
ophthalmologists' decision on severity of the disease and to give laser treatment. Future work will address an
issue of improving sensitivity by improving the results of other tasks such as detection of faint and small
hemorrhages and analysis and comparisons on other classifiers like SVM…etc.
TABLE I.
Dataset for Fundus Image Classification
Category No. of training
Images
No. of testing
Images
No. of Images/Class
Normal 20 100 120
Abnormal 65 100 165
Total 85 200 285
International Journal Of Engineering Research & Management Technology ISSN: 2348-4039
Email: [email protected] May- 2016 Volume 3, Issue 3 www.ijermt.org
[email protected] Page 64
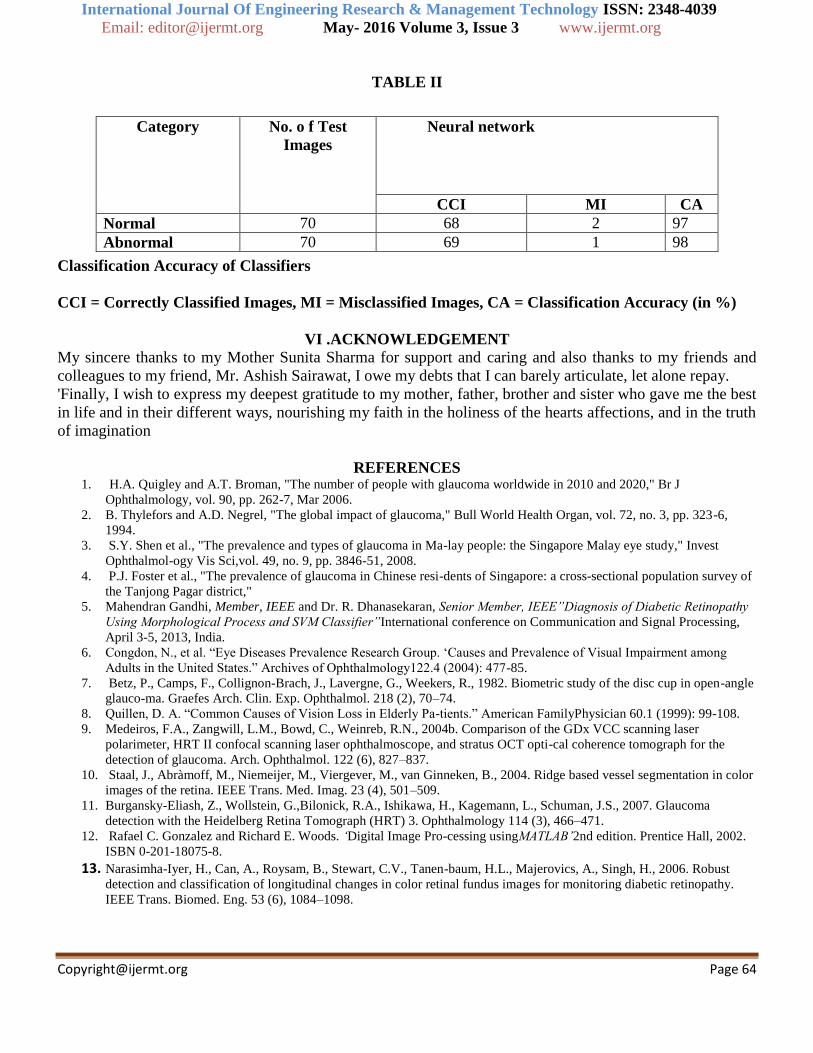
TABLE II
Classification Accuracy of Classifiers
CCI = Correctly Classified Images, MI = Misclassified Images, CA = Classification Accuracy (in %)
VI .ACKNOWLEDGEMENT
My sincere thanks to my Mother Sunita Sharma for support and caring and also thanks to my friends and
colleagues to my friend, Mr. Ashish Sairawat, I owe my debts that I can barely articulate, let alone repay.
'Finally, I wish to express my deepest gratitude to my mother, father, brother and sister who gave me the best
in life and in their different ways, nourishing my faith in the holiness of the hearts affections, and in the truth
of imagination
REFERENCES 1. H.A. Quigley and A.T. Broman, "The number of people with glaucoma worldwide in 2010 and 2020," Br J
Ophthalmology, vol. 90, pp. 262-7, Mar 2006.
2. B. Thylefors and A.D. Negrel, "The global impact of glaucoma," Bull World Health Organ, vol. 72, no. 3, pp. 323-6,
1994.
3. S.Y. Shen et al., "The prevalence and types of glaucoma in Ma-lay people: the Singapore Malay eye study," Invest
Ophthalmol-ogy Vis Sci,vol. 49, no. 9, pp. 3846-51, 2008.
4. P.J. Foster et al., "The prevalence of glaucoma in Chinese resi-dents of Singapore: a cross-sectional population survey of
the Tanjong Pagar district,"
5. Mahendran Gandhi, Member, IEEE and Dr. R. Dhanasekaran, Senior Member, IEEE”Diagnosis of Diabetic Retinopathy
Using Morphological Process and SVM Classifier”International conference on Communication and Signal Processing,
April 3-5, 2013, India.
6. Congdon, N., et al. “Eye Diseases Prevalence Research Group. „Causes and Prevalence of Visual Impairment among
Adults in the United States.” Archives of Ophthalmology122.4 (2004): 477-85.
7. Betz, P., Camps, F., Collignon-Brach, J., Lavergne, G., Weekers, R., 1982. Biometric study of the disc cup in open-angle
glauco-ma. Graefes Arch. Clin. Exp. Ophthalmol. 218 (2), 70–74.
8. Quillen, D. A. “Common Causes of Vision Loss in Elderly Pa-tients.” American FamilyPhysician 60.1 (1999): 99-108.
9. Medeiros, F.A., Zangwill, L.M., Bowd, C., Weinreb, R.N., 2004b. Comparison of the GDx VCC scanning laser
polarimeter, HRT II confocal scanning laser ophthalmoscope, and stratus OCT opti-cal coherence tomograph for the
detection of glaucoma. Arch. Ophthalmol. 122 (6), 827–837.
10. Staal, J., Abràmoff, M., Niemeijer, M., Viergever, M., van Ginneken, B., 2004. Ridge based vessel segmentation in color
images of the retina. IEEE Trans. Med. Imag. 23 (4), 501–509.
11. Burgansky-Eliash, Z., Wollstein, G.,Bilonick, R.A., Ishikawa, H., Kagemann, L., Schuman, J.S., 2007. Glaucoma
detection with the Heidelberg Retina Tomograph (HRT) 3. Ophthalmology 114 (3), 466–471.
12. Rafael C. Gonzalez and Richard E. Woods. ‘Digital Image Pro-cessing usingMATLAB’2nd edition. Prentice Hall, 2002.
ISBN 0-201-18075-8.
13. Narasimha-Iyer, H., Can, A., Roysam, B., Stewart, C.V., Tanen-baum, H.L., Majerovics, A., Singh, H., 2006. Robust
detection and classification of longitudinal changes in color retinal fundus images for monitoring diabetic retinopathy.
IEEE Trans. Biomed. Eng. 53 (6), 1084–1098.
Category No. o f Test
Images
Neural network
CCI MI CA
Normal 70 68 2 97
Abnormal 70 69 1 98