grading fundus images for diabetic...
TRANSCRIPT
I J C T A, 9(9), 2016, pp. 3883-3887© International Science Press
Grading Fundus Images forDiabetic RetinopathyR. Shelishiyah1, J. Sivaraman1, S. Vinurajkumar1,K. Manikandan1 and R. Sai Nandhini2
ABSTRACT
Diabetic Retinopathy (DR) is an anomaly, found commonly among diabetic patients, which can lead to blindness ifleft untreated for a long period of time. Early detection of the complication, leads to better probability of cure.Lesions and cotton wool spots in retinal images, are the symptoms that help in the early detection of DR. Due tothese lesions the image features will change throughout the retinal image, according to the level of the diseaseprogression. Hence, in the proposed method, these changes in features are used to grade the retinopathy. There arethree levels of disease progression and the classification method was able to classify all the three levels from thegiven retinal images. Also, Hough transform is used to detect the cotton wool spots since these spots haveapproximately the same intensity as that of the optic disc. The changes in features caused by the lesions and thecotton wool spots and exudates are the key to the detection. The feature extraction technique is Grey Level Co-occurrence Matrix (GLCM), which extracts about 44 features from the image data for further classification. Usingan unsupervised classification method we have discovered the similar instances between data. The clusters areformed using K means classification technique. The retinal images, both normal and abnormal, were obtained fromthe Messidor database and the pixel size used was 2240 � 1488.
Keywords: Optic disc, exudates, edema, Euclidian distance.
1. INTRODUCTION
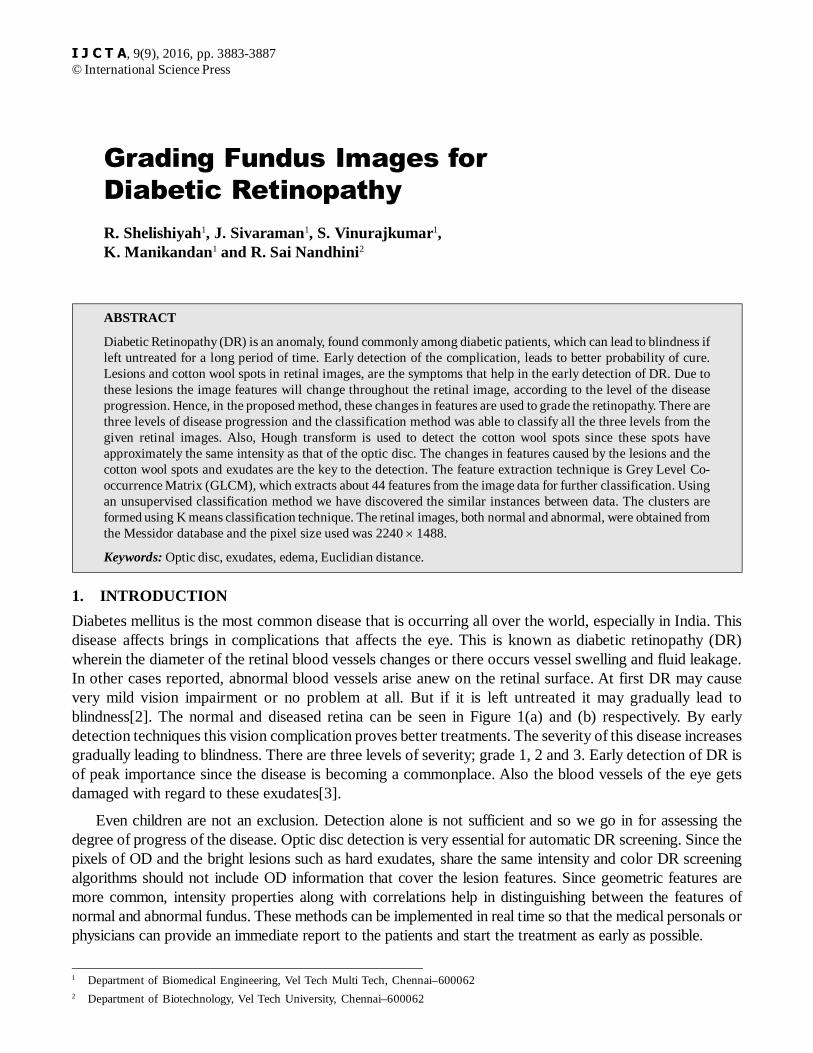
Diabetes mellitus is the most common disease that is occurring all over the world, especially in India. Thisdisease affects brings in complications that affects the eye. This is known as diabetic retinopathy (DR)wherein the diameter of the retinal blood vessels changes or there occurs vessel swelling and fluid leakage.In other cases reported, abnormal blood vessels arise anew on the retinal surface. At first DR may causevery mild vision impairment or no problem at all. But if it is left untreated it may gradually lead toblindness[2]. The normal and diseased retina can be seen in Figure 1(a) and (b) respectively. By earlydetection techniques this vision complication proves better treatments. The severity of this disease increasesgradually leading to blindness. There are three levels of severity; grade 1, 2 and 3. Early detection of DR isof peak importance since the disease is becoming a commonplace. Also the blood vessels of the eye getsdamaged with regard to these exudates[3].
Even children are not an exclusion. Detection alone is not sufficient and so we go in for assessing thedegree of progress of the disease. Optic disc detection is very essential for automatic DR screening. Since thepixels of OD and the bright lesions such as hard exudates, share the same intensity and color DR screeningalgorithms should not include OD information that cover the lesion features. Since geometric features aremore common, intensity properties along with correlations help in distinguishing between the features ofnormal and abnormal fundus. These methods can be implemented in real time so that the medical personals orphysicians can provide an immediate report to the patients and start the treatment as early as possible.
1 Department of Biomedical Engineering, Vel Tech Multi Tech, Chennai–6000622 Department of Biotechnology, Vel Tech University, Chennai–600062
3884 R. Shelishiyah, J. Sivaraman, S. Vinurajkumar, K. Manikandan and R. Sai Nandhini
2. METHODOLOGY
Figure 1: Fundus images of normal and DR.
(a) (b)
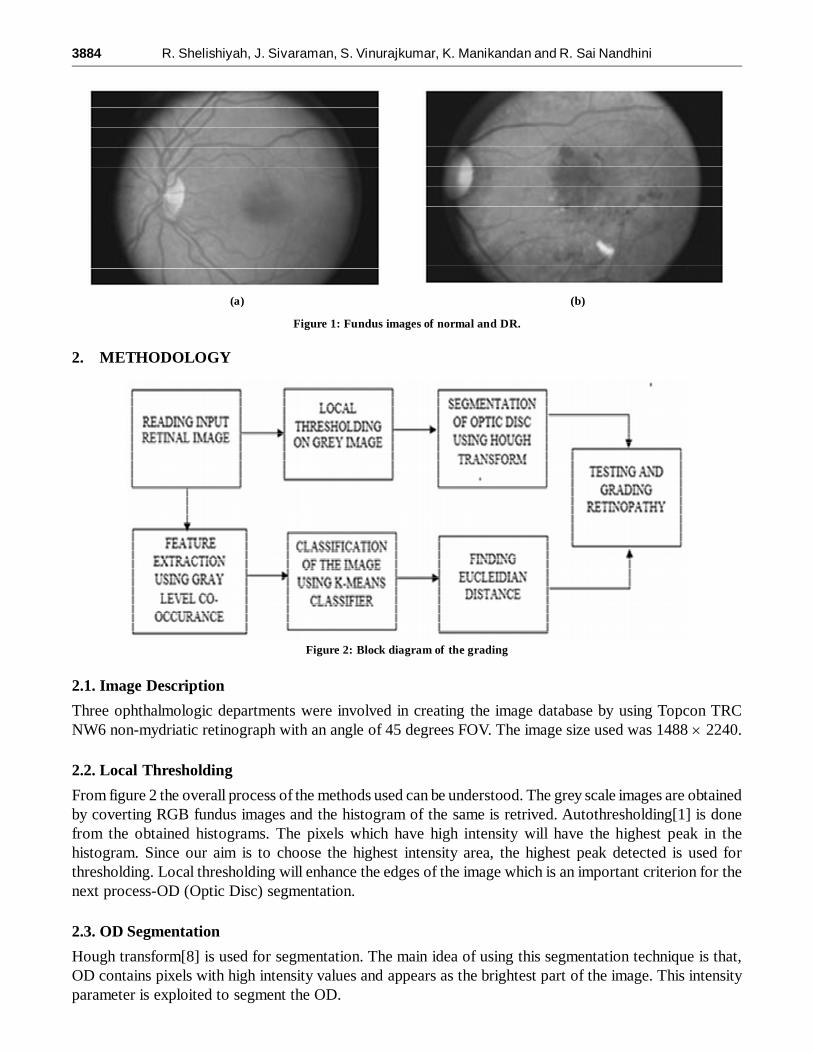
Figure 2: Block diagram of the grading
2.1. Image Description
Three ophthalmologic departments were involved in creating the image database by using Topcon TRCNW6 non-mydriatic retinograph with an angle of 45 degrees FOV. The image size used was 1488 � 2240.
2.2. Local Thresholding
From figure 2 the overall process of the methods used can be understood. The grey scale images are obtainedby coverting RGB fundus images and the histogram of the same is retrived. Autothresholding[1] is donefrom the obtained histograms. The pixels which have high intensity will have the highest peak in thehistogram. Since our aim is to choose the highest intensity area, the highest peak detected is used forthresholding. Local thresholding will enhance the edges of the image which is an important criterion for thenext process-OD (Optic Disc) segmentation.
2.3. OD Segmentation
Hough transform[8] is used for segmentation. The main idea of using this segmentation technique is that,OD contains pixels with high intensity values and appears as the brightest part of the image. This intensityparameter is exploited to segment the OD.

Grading Fundus Images for Diabetic Retinopathy 3885
Apart from OD, the exudates[10] and the cotton wool spots also share the same intensity as that of theOD. Therefore we can also find these lesions which are the symptoms used in the detection of diabeticretinopathy.
2.4. Feature Extraction
Every image has features which describes the image [7]. Also the features change for the least change in theimage. This phenomenon is extensively used to differentiate the normal from abnormal images. The normalimages will have certain feature values which will not be retained in the abnormal ones. The reason behindthis is that the captures that show abnormality, contains lesions which will deviate the feature values fromthose of the normal. Therefore feature extraction has a major role to play in differentiating the normal fromdiseased images.
The extracted features are stored in a database[9]. These are training sets. There are 44 values that areextracted from 23 features. These features are-Autocorrelation, Contrast, Correlation, Cluster Prominence,Cluster Shade, Dissimilarity, Energy, Homogeneity, Entropy, Maximum probability, Sum of sqaures: Sumaverage, Sum variance, Sum entropy, Variance, Difference entropy, Difference variance, Information measureof correlation1, Information measure of correlation2, Inverse difference normalized (INN), Inverse differencemoment normalized, Inverse difference (INV).
2.5. Image Classification
Classification leads to the grading of retinopathy. As known earlier, an unsupervised training is comparedto that of a classroom without a teacher. Therefore the classifier will not have any kind of feedbacks[5] andthe classifier will not be sure if the outcome it produces is correct or not. But this classifier itself is sufficientto grade the retinopathy, since in training phase we train all the 3 grades of retinopathy alongside normalimages. The classifier was found to perform better when the number of the training images were more, that
Figure 3: Stages of OD segmentation
3886 R. Shelishiyah, J. Sivaraman, S. Vinurajkumar, K. Manikandan and R. Sai Nandhini
is, the probability of mis-classifying was at its least. The images, after feature extraction are classified into5 clusters by an unsupervised classification method called K means clustering. This will give a distancemeasure, which determines the similarity calculation of 2 elements, and how it influences the shape of theclusters. This distance measured is commonly known as the Euclidean Distance[4].
The Euclidean distance also called 2-norm distance is given by:
1
,p
i ii
d x y x y
Since we have four different types of training images, the unknown image or the test image will placeitself under any one of these 4 types-whichever gives a closest match.
3. RESULTS AND DISCUSSION
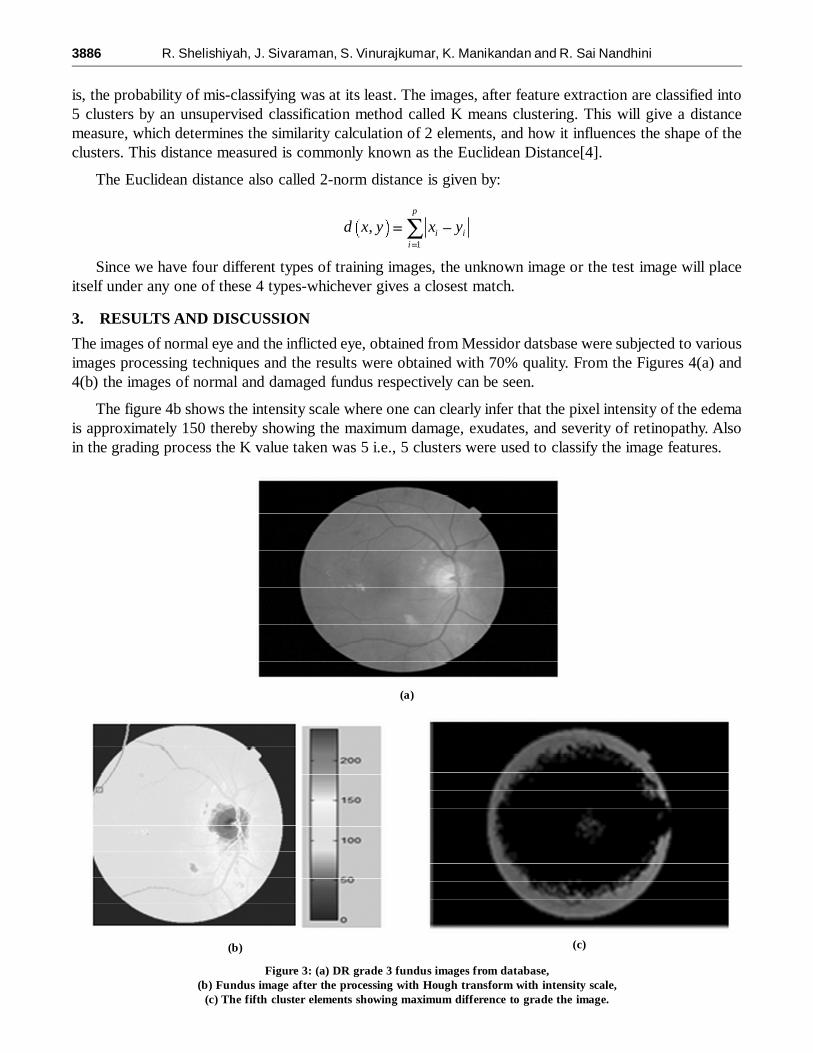
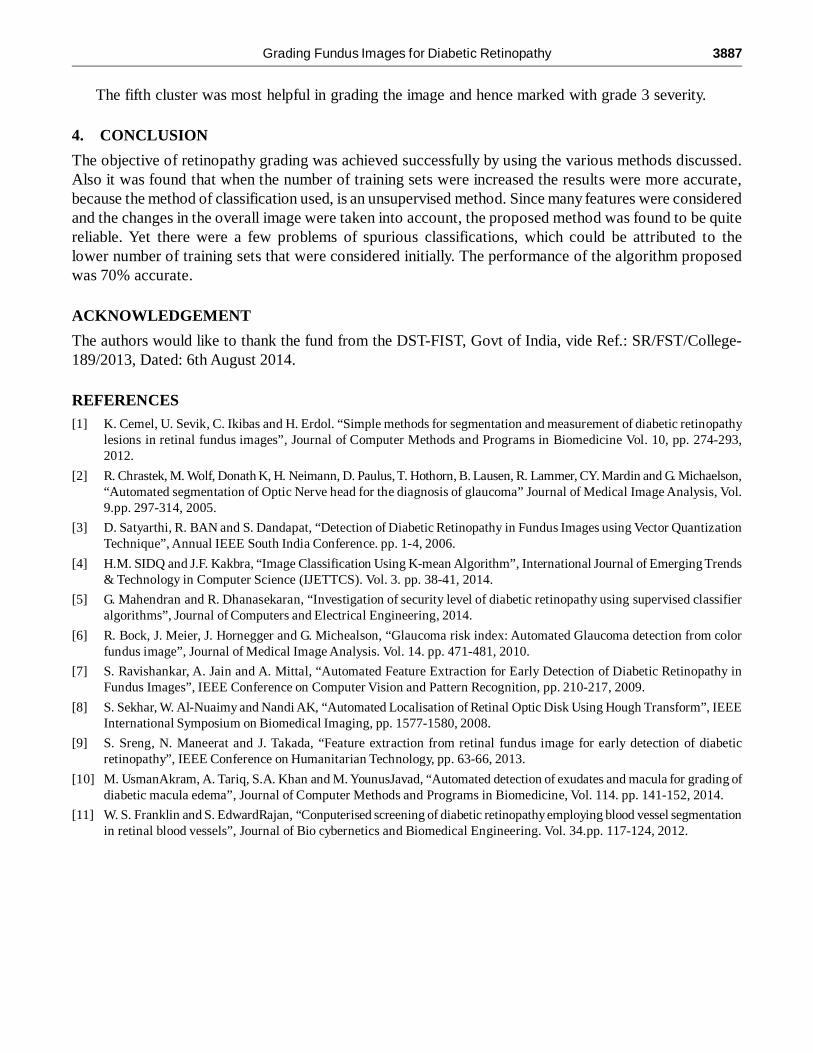
The images of normal eye and the inflicted eye, obtained from Messidor datsbase were subjected to variousimages processing techniques and the results were obtained with 70% quality. From the Figures 4(a) and4(b) the images of normal and damaged fundus respectively can be seen.
The figure 4b shows the intensity scale where one can clearly infer that the pixel intensity of the edemais approximately 150 thereby showing the maximum damage, exudates, and severity of retinopathy. Alsoin the grading process the K value taken was 5 i.e., 5 clusters were used to classify the image features.
(a)
Figure 3: (a) DR grade 3 fundus images from database,(b) Fundus image after the processing with Hough transform with intensity scale,
(c) The fifth cluster elements showing maximum difference to grade the image.
(c)(b)
Grading Fundus Images for Diabetic Retinopathy 3887
The fifth cluster was most helpful in grading the image and hence marked with grade 3 severity.
4. CONCLUSION
The objective of retinopathy grading was achieved successfully by using the various methods discussed.Also it was found that when the number of training sets were increased the results were more accurate,because the method of classification used, is an unsupervised method. Since many features were consideredand the changes in the overall image were taken into account, the proposed method was found to be quitereliable. Yet there were a few problems of spurious classifications, which could be attributed to thelower number of training sets that were considered initially. The performance of the algorithm proposedwas 70% accurate.
ACKNOWLEDGEMENT
The authors would like to thank the fund from the DST-FIST, Govt of India, vide Ref.: SR/FST/College-189/2013, Dated: 6th August 2014.
REFERENCES[1] K. Cemel, U. Sevik, C. Ikibas and H. Erdol. “Simple methods for segmentation and measurement of diabetic retinopathy
lesions in retinal fundus images”, Journal of Computer Methods and Programs in Biomedicine Vol. 10, pp. 274-293,2012.
[2] R. Chrastek, M. Wolf, Donath K, H. Neimann, D. Paulus, T. Hothorn, B. Lausen, R. Lammer, CY. Mardin and G. Michaelson,“Automated segmentation of Optic Nerve head for the diagnosis of glaucoma” Journal of Medical Image Analysis, Vol.9.pp. 297-314, 2005.
[3] D. Satyarthi, R. BAN and S. Dandapat, “Detection of Diabetic Retinopathy in Fundus Images using Vector QuantizationTechnique”, Annual IEEE South India Conference. pp. 1-4, 2006.
[4] H.M. SIDQ and J.F. Kakbra, “Image Classification Using K-mean Algorithm”, International Journal of Emerging Trends& Technology in Computer Science (IJETTCS). Vol. 3. pp. 38-41, 2014.
[5] G. Mahendran and R. Dhanasekaran, “Investigation of security level of diabetic retinopathy using supervised classifieralgorithms”, Journal of Computers and Electrical Engineering, 2014.
[6] R. Bock, J. Meier, J. Hornegger and G. Michealson, “Glaucoma risk index: Automated Glaucoma detection from colorfundus image”, Journal of Medical Image Analysis. Vol. 14. pp. 471-481, 2010.
[7] S. Ravishankar, A. Jain and A. Mittal, “Automated Feature Extraction for Early Detection of Diabetic Retinopathy inFundus Images”, IEEE Conference on Computer Vision and Pattern Recognition, pp. 210-217, 2009.
[8] S. Sekhar, W. Al-Nuaimy and Nandi AK, “Automated Localisation of Retinal Optic Disk Using Hough Transform”, IEEEInternational Symposium on Biomedical Imaging, pp. 1577-1580, 2008.
[9] S. Sreng, N. Maneerat and J. Takada, “Feature extraction from retinal fundus image for early detection of diabeticretinopathy”, IEEE Conference on Humanitarian Technology, pp. 63-66, 2013.
[10] M. UsmanAkram, A. Tariq, S.A. Khan and M. YounusJavad, “Automated detection of exudates and macula for grading ofdiabetic macula edema”, Journal of Computer Methods and Programs in Biomedicine, Vol. 114. pp. 141-152, 2014.
[11] W. S. Franklin and S. EdwardRajan, “Conputerised screening of diabetic retinopathy employing blood vessel segmentationin retinal blood vessels”, Journal of Bio cybernetics and Biomedical Engineering. Vol. 34.pp. 117-124, 2012.