deecciis siioonn tmmaakkiinngg aasssiisstaannccee fo rr oww
TRANSCRIPT

CCaattaalloogguuee ooff WWoorrkkffoorrccee
IInnffoorrmmaattiioonn SSoouurrcceess
DDeecciissiioonn MMaakkiinngg AAssssiissttaannccee
FFoorr WWoorrkkffoorrccee aanndd EEccoonnoommiicc
DDeevveellooppmmeenntt
Contents
Introduction - 6 -
Part I Review of Workforce and Labor Market Information Data Sources - 4 -
US Department of Labor
Bureau of Labor Statistics
The Current Employment Statistics (CES) - 8 -
The Quarterly Census of Employment and Wages (QCEW) - 8 -
The Local Area Unemployment Statistics (LAUS) - 9 -
The Occupational Employment Statistics (OES) - 10 -
The Mass Layoff Statistics (MLS) - 10 -
The Job Openings and Labor Turnover Survey (JOLTS) - 11 -
The Survey of Employer-Provided Training - 11 -
The National Longitudinal Surveys (NLS) - 11 -
The Current Population Survey (CPS) - 12 -
The National Compensation Survey (NCS) - 12 -
The Employment Projections (EP) - 13 -
Employment and Training Administration
ONET OnLine - 14 -
Links to State Workforce and Labor Market Information Websites and Portals - 15 -
US Department of Commerce - 16 -
Census Bureau
Survey of Income and Program Participation (SIPP) - 19 -
The National Employer Survey - 20 -
Local Employment Dynamics (LED) - 21 -
Quarterly Workforce Indicators (QWIs) Online - 21 -
Industry Focus - 22 -
LED ―OntheMap - 23 -
The Economic Census - 24 -
The American Community Survey - 25 -
Decennial Census - 25 -
Federal Assistance Award Data System (FAADS) - 25 -
Bureau of Economic Analysis (BEA)hellip- 26 -
Economic Development Administration- 27 -
EconDataNet - 28 -
TradeStatsExpress -29 -
US Patent and Trademark Office - 30 -
US Department of Defense - 31 -
Defense Manpower Data Center Statistical Information Analysis Division - 31 -
Office of Economic Adjustment (OEA) - 32 -
US Small Business Administration - 35 -
Small Business Economic Indicators - 35 -
Characteristics of Small Business Owners and Employees - 35 -
Firm Size Data by Location and Industry - 35 -
US Department of Agriculture Economic Research Service - 36 -
US Department of Education National Center for Education Statistics - 38 -
The National Assessment of Educational Progress (NAEP) - 40 -
The National Assessment of Adult Literacy (NAAL) - 41 -
The Integrated Post-secondary Education Data System (IPEDS) - 41 -
The National Household Education Surveys (NHES) - 42 -
The NCES Data on Vocational Education (DOVE) - 42 -
US Department of Transportation Bureau of Transportation Statistics - 43 -
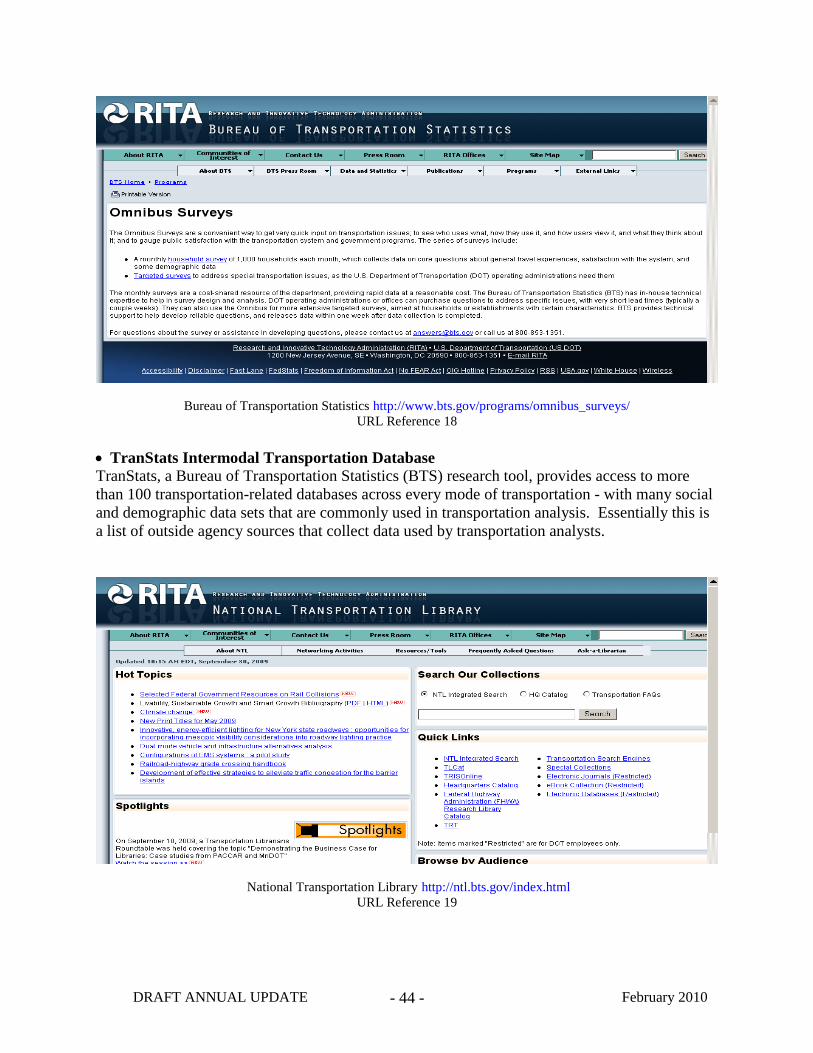
Omnibus Surveys - 43 -
TranStats Intermodal Transportation Database - 44 -
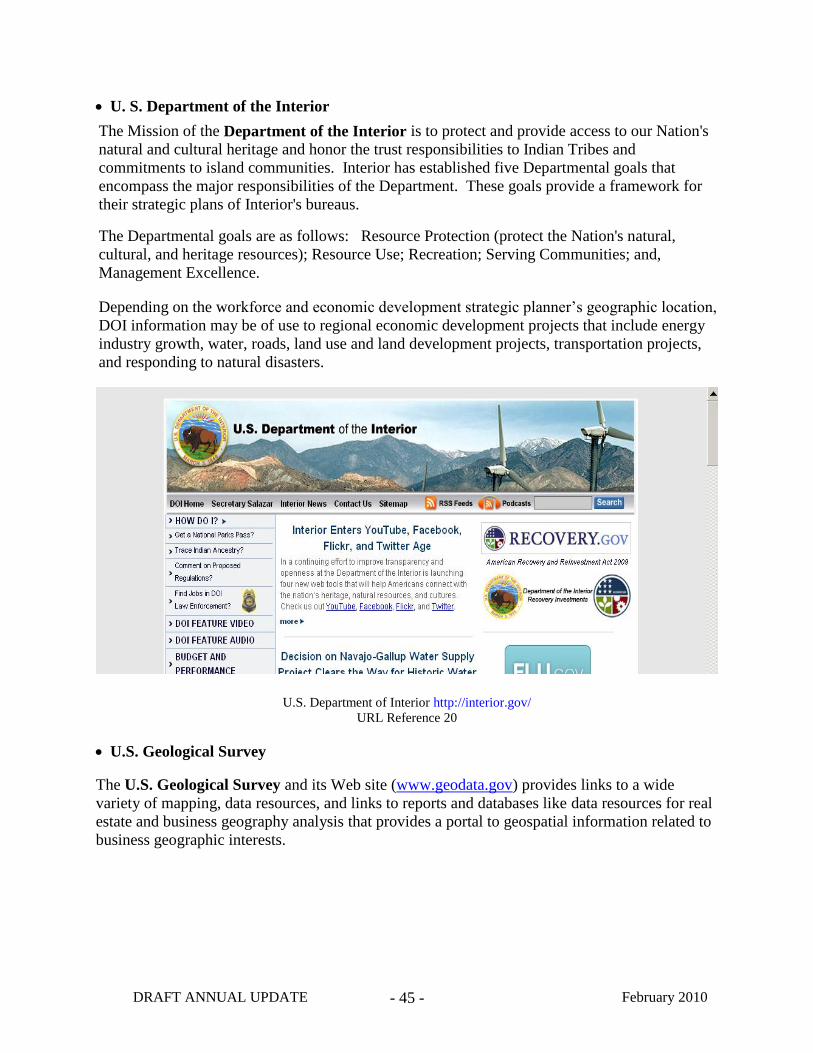
US Department of the Interior - 45 -
US Geological Survey - 45 -
US Department of EnergyEnergy Information Administration - 46 -
Energy Statistics - 46 -
US Department of Veterans Affairs - 47 -
Office of PolicyVeteran Data and Information - 47 -
Veterans Benefits Administration (VBA) - 48 -
The Interagency Council on Statistical Policy - 48 -
FedStats - 48 -
National Science Foundation - 49 -
Science Resource Statistics - 49 -
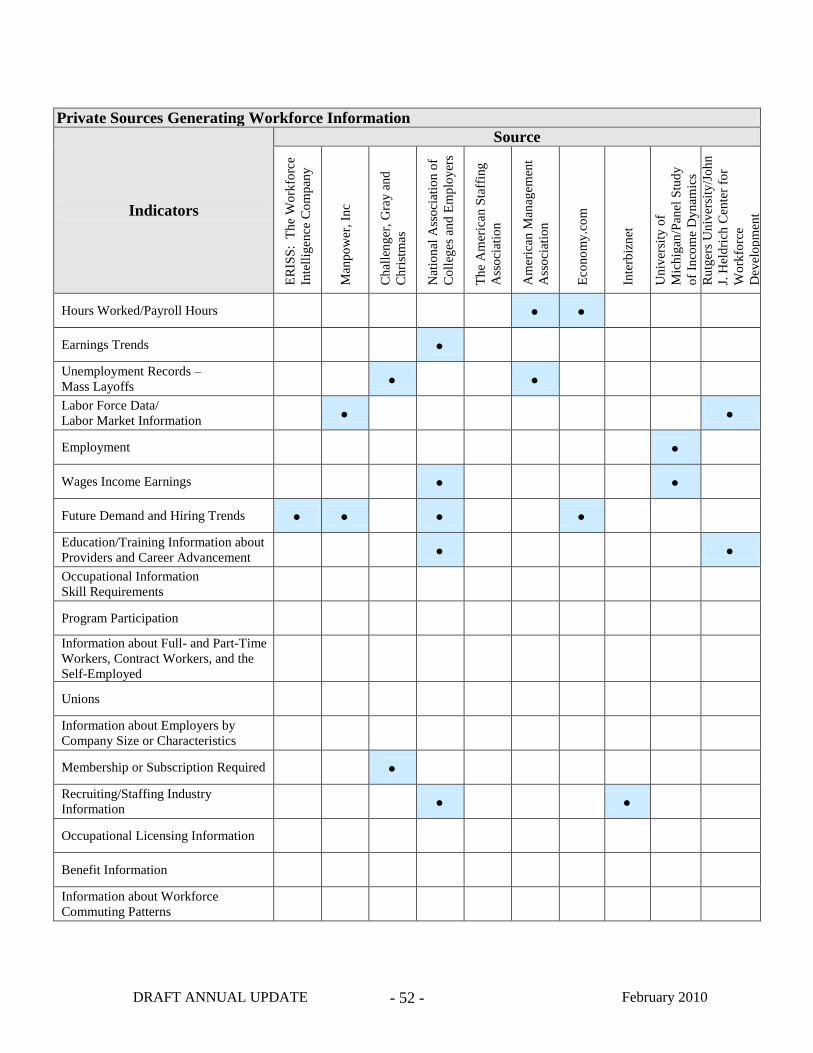
Private Sources Generating Workforce Information - 51 -
ERISS The Workforce Intelligence Company - 53 -
Manpower Inc - 53 -
Challenger Gray and Christmas - 54 -
National Association of Colleges and Employers (NACE) - 54 -
Economycom - 55 -
Interbiznet - 56 -
University of MichiganPanel Study of Income Dynamics (PSID) - 56 -
Rutgers UniversityJohn J Heldrich Center for Workforce Development - 57 -
National Venture Capital Association (NVCA) - 58 -
Part II Workforce and LMI Portals and Systems for Decision Support - 60 -
US Department of Labor - 64 -
ETA and State and Local Workforce Boards and Agencies - 63 -
Americalsquos CareerInfoNet (ACINET) - 63 -
Florida Research and Economic Database (FRED) - 64 -
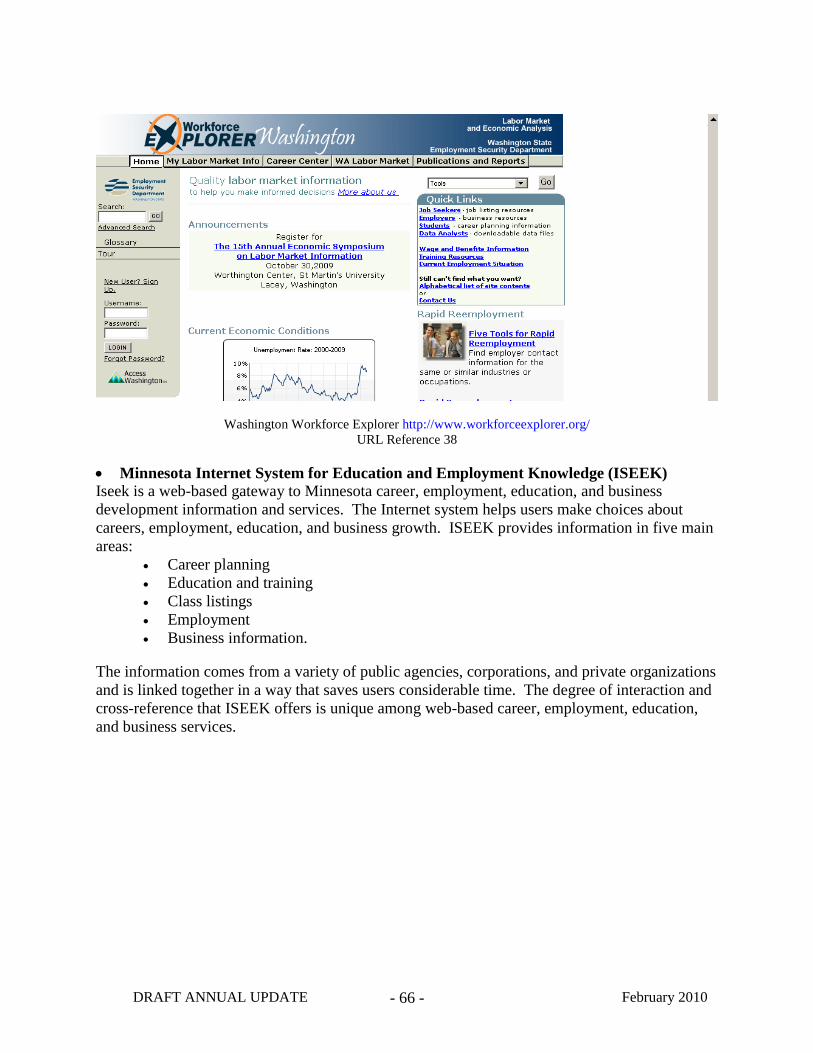
Washington Workforce Explorer - 65 -
Minnesota Internet System for Education and Employment Knowledge(ISEEK)- 67 -
Nebraska Career Compass - 67 -
Texas SOCRATES - 68 -
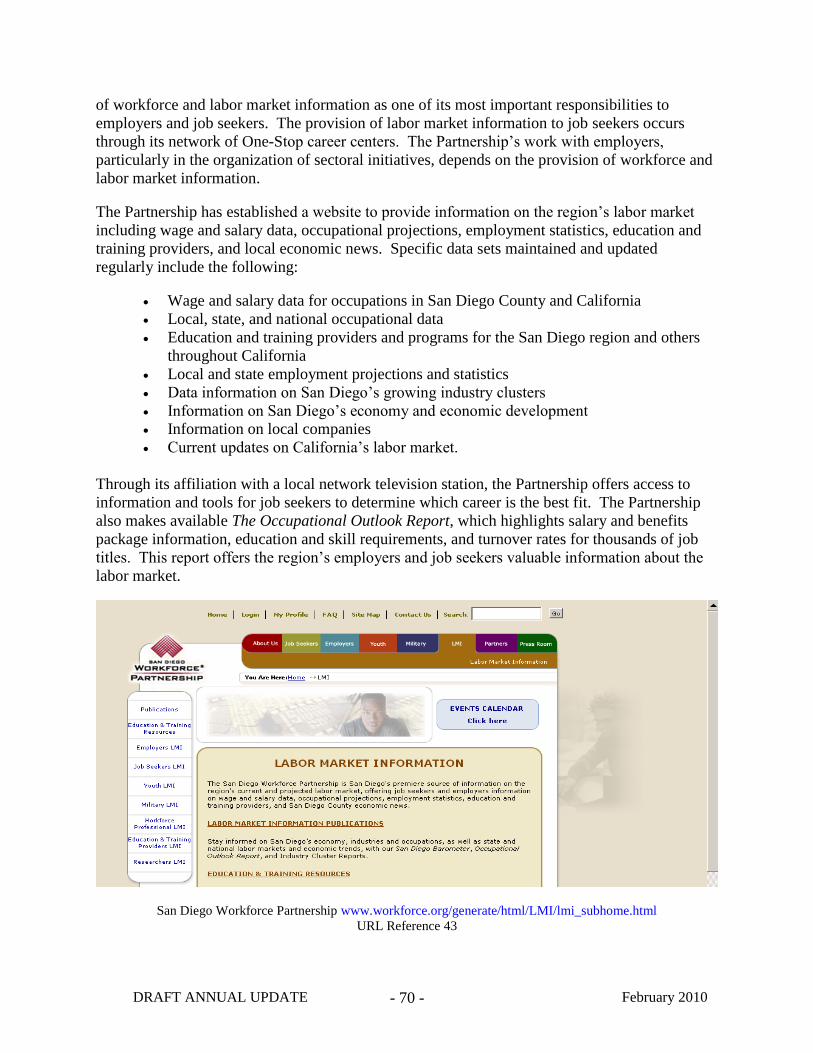
San Diego at Work San Diego Workforce Partnership - 69 -
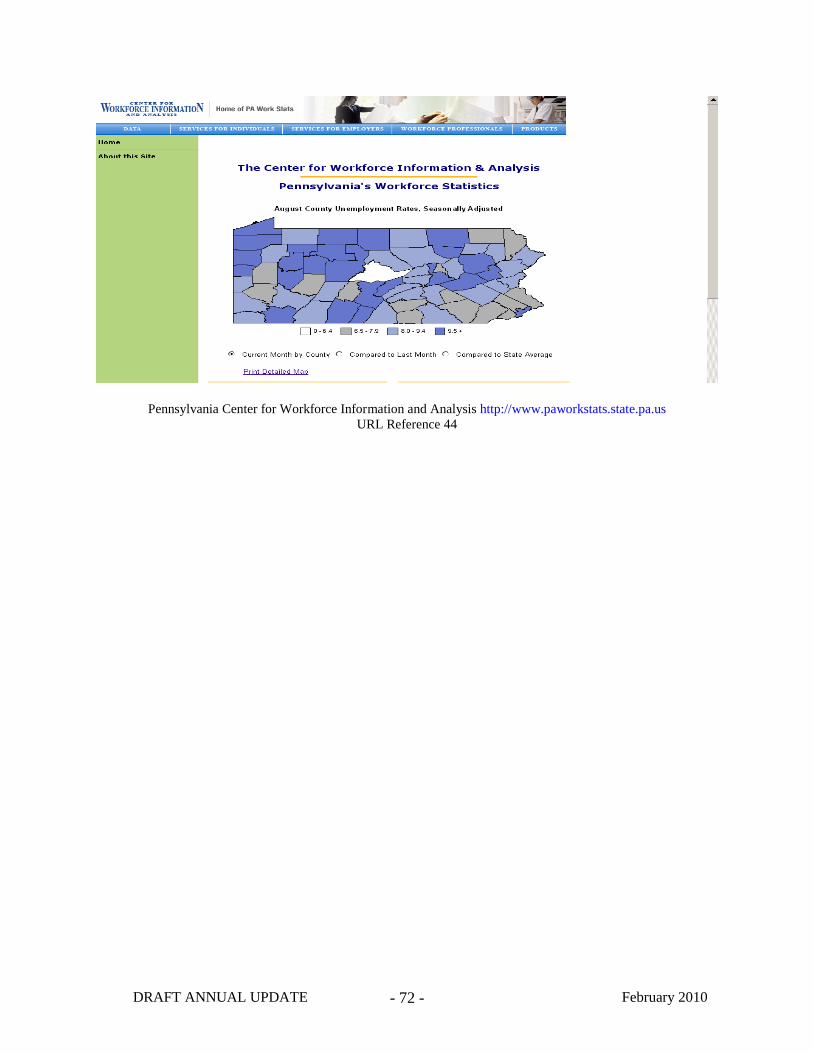
Pennsylvania Center for Workforce Information and Analysis - 71 -
Economic Development Agencies - 73 -
State of Maine Department of Economic and Community Development (DECD) - 75 -
Quad City Development Group Davenport IA - 76 -
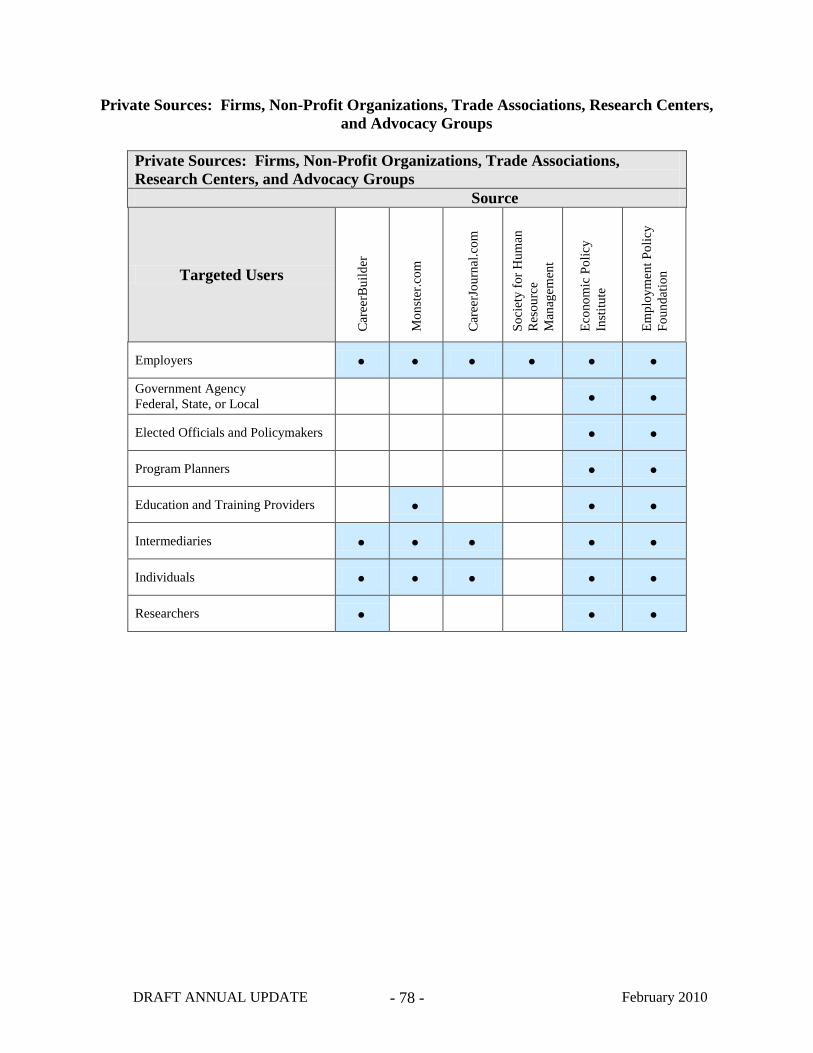
Private Sources Firms Non-Profit Organizations Trade Associations Research Centers
and Advocacy Groups - 78 -
CareerBuilder - 80 -
Monstercom - 81 -
CareerJournalCom - 81 -
Society for Human Resource Management (SHRM) - 82 -
The Economic Policy Institute (EPI) - 83 -
The Federal Reserve System - 83 -
Real-Time Workforce Information - 86 -
The Conference Board - 86 -
EmployOn LMI - 87 -
Indeed Job Trends - 87 -
Manpower Employment Outlook Survey - 87 -
Smply Hired Job Trends - 88 -
Part III Data Integration and Analysis Tools and Services - 89 -
ETA - Census Bureau Community Economic Development Hot Reports - 89 -
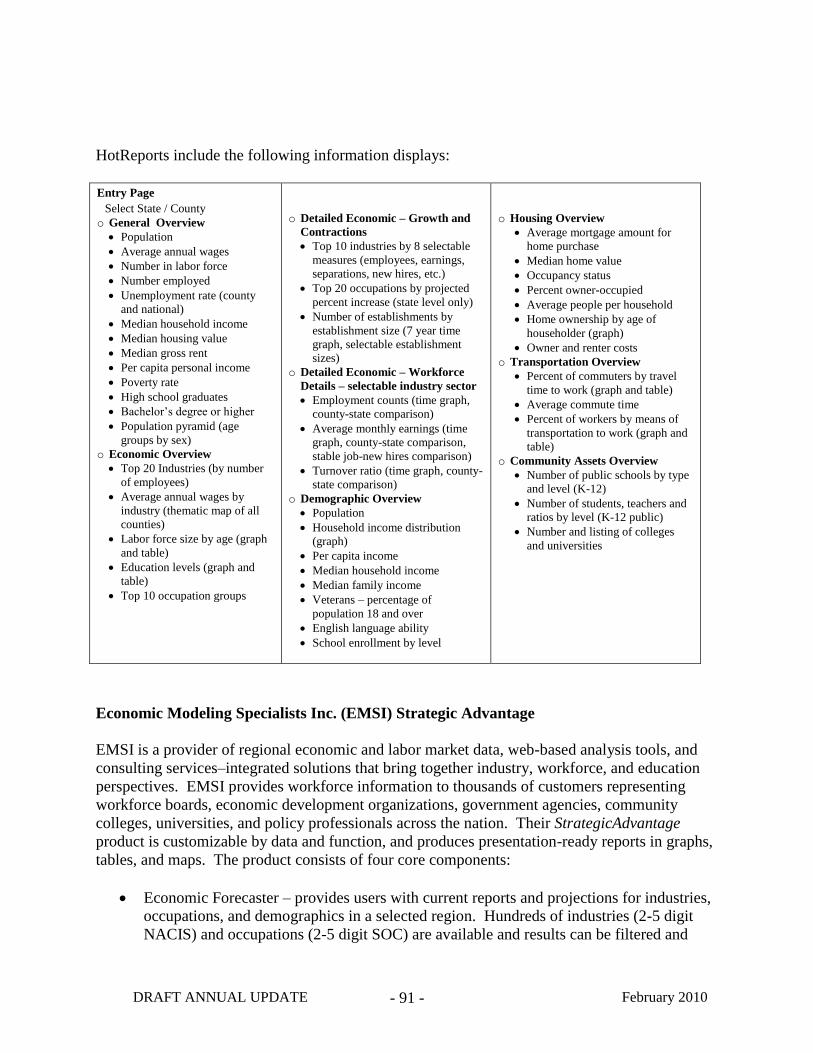
Economic Modeling Specialists Inc (EMSI) Strategic Advantage - 91 -
Acronyms - 93 -
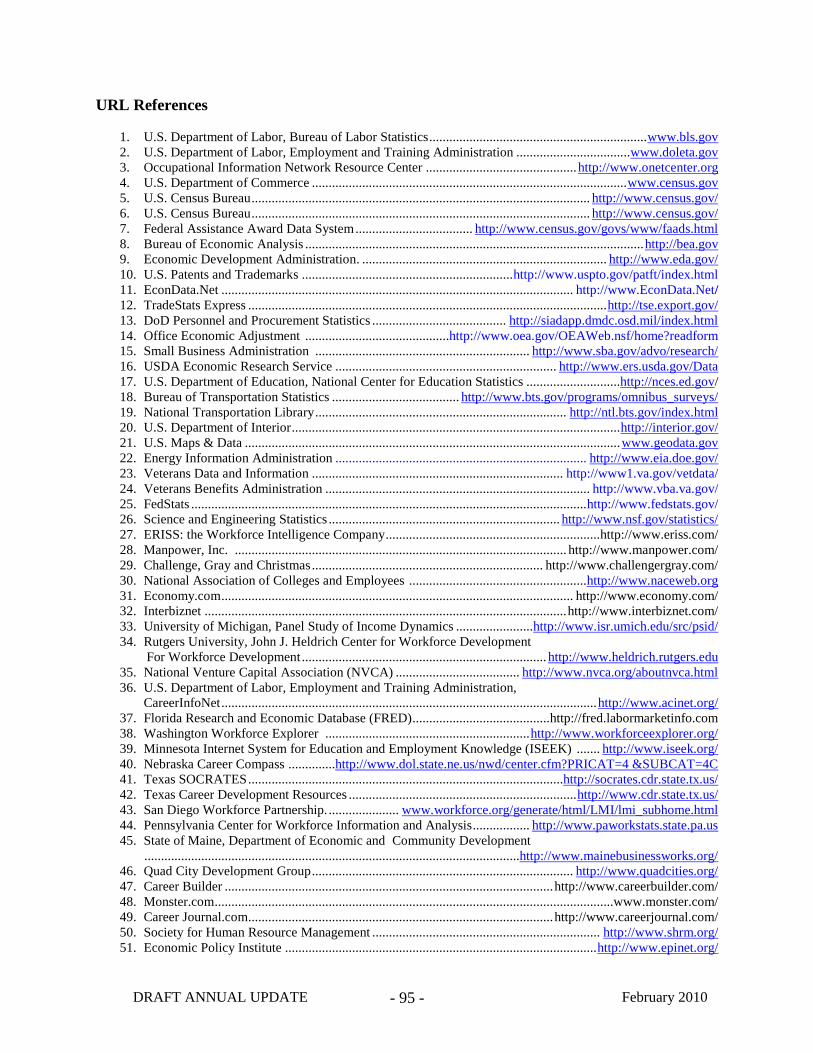
URL References - 95 -
This page has been left blank intentionally
DRAFT ANNUAL UPDATE February 2010 - 2 -
Introduction
In a global economy that is highly dependent on human capital investment and workforce quality
to achieve economic recovery and Good Jobs for Everyone improved and expanded information
about the workforce state regional and local economic conditions has become more and more
critical for policymakers to better understand and guide the direction of long-term workforce and
economic development investments The front line of global competition typically thought of as
a national challenge is actually regional where companies workers researchers entrepreneurs
and governments come together to create a competitive advantage The regions that will be
successful in meeting the challenge are those able to demonstrate the ability to network their
innovation assetslsquo ndash people institutions capital and infrastructure to generate growth and
prosperity in the regional economy
The Catalogue of Workforce Information Sources developed by the Employment and Training
Administration in 2004 as an environmental scan has been updated annually It represents
ETAlsquos effort to identify capture and organize the dynamic and expanding body of workforce
and labor market information continuously generated by public and private sources The intent
of this catalogue is to better inform various information consumer groups including workforce
talent and regional economic development specialists education and training planners and
public policy makers about the large quantity of quality workforce and labor market information
available to them The catalogue is not intended to be a comprehensive encyclopedia or
exhaustive inventory of all that is being produced at the federal state and local levels
Design and Format
The catalogue is organized into three sections The first section examines a mix of labor market
and workforce information source organizations including those most widely and commonly
consulted The US Department of Labor Bureau of Labor Statistics (BLS) and the US
Department of Commerce Census Bureau along with partnering state labor market information
units are primarily responsible for collecting and reporting data on the nationlsquos workforce and
labor market developments The Small Business Administration (SBA) and the Department of
Educationlsquos National Center for Education Statistics (NCES) also provide data related to labor
market and workforce developments Additionally private sector entities such as businesses
non-profit organizations trade associations and research institutions that generate workforce and
labor market information were identified and included Though not exhaustive the catalogue
contains a solid sampling and provides exposure to a diverse array of data sources
The second part of the catalogue examines several web-based workforce and labor market
information delivery systems With significant investment and leadership from the US
Department of Laborlsquos Employment and Training Administration major strides have been made
since the mid-1990lsquos to develop new systems to assist job seekers employers and other user
groups to better access workforce and labor market information The CarreerOneStoporg portal
that includes Americalsquos Career InfoNet Americalsquos Service Locator the employer locator and
the Occupational Information Network (ONET) are a few of the resources and tools that were
created under national guidance to improve labor market performance guide career planning
and support workforce analysis Many of the Departmentlsquos state and local workforce partner
DRAFT ANNUAL UPDATE February 2010 - 3 -
agencies have since developed and now maintain innovative web-based workforce and labor
market information systems ETAlsquos review also found that 1) Economic development agencies
are actively collecting and reporting workforce and labor market information and 2) Many
private firms also provide specialized workforce and labor market information as a feature of
their web-based career planning and job matching systems Together all of these systems
provide a highly informative and advanced environment to address workforce and labor market
data needs
The third section of the catalogue highlights new and emerging data integration and analysis
tools developed by the private-sector and federal government Impressive progress has been
made to improve access to traditional sources of workforce and labor market information and to
add new datasets and non-traditional labor-market information These new tools use integrated
relational database systems that can combine information from various sources into new data
display tools and systems resulting in faster access to more information than in the past Along
with the federal government economic development agencies trade associations university
research centers and private firms are all contributing data to improve economic analysis and
decision making ETA will continue to uncover new data sources display tools approaches and
systems which will be added to this catalogue in the future
DRAFT ANNUAL UPDATE February 2010 - 4 -
Part I Review of Workforce and Labor Market Information Data Sources
Overview
The US economy is backed by one of the most advanced statistical information systems in the
world costing billions of dollars annually to maintain Workforce and labor market information
has always been a fundamental component of this system Indicators such as the number of
unemployed number of jobs created or workers laid off are basic statistics reported regularly
and understood by most Americans These numbers convey a basic picture about the economy
and the direction in which it is moving As we continue to move toward a more complex
knowledge and information economy the statistical infrastructure and information systems that
convey static snapshots and dynamic movements must also reflect this growing complexity
In this catalogue we have identified an extensive inventory of workforce and labor market
information sources For the most part these statistical systems work fairly well in tracking
labor market and workforce developments The BLS along with its state partners and the
Census Bureau produce timely reliable and accessible information about employment
unemployment and earnings across detailed industry sectors at the labor market level The
Department of Laborlsquos ETA supplies detailed information about jobs including skill and
education requirements with the ONET system an online occupational information system
Through a combination of establishment surveys household surveys and administrative records
we learn a great deal about the state of our labor markets and changing conditions over time
The surveys conducted and the information collected through the NCES also provides us with
considerable data about the workforce including characteristics of the existing labor supply
The Department of Labor and its partners at the state and local level are making impressive
strides in consolidating organizing and reporting the most common sources of workforce and
labor market information on the Internet We explored a number of websites where workforce
and labor market information is arrayed for users groups including employers job seekers
economic development analysts and education and training planners While our search of these
types of sites was not exhaustive a significant number of them were researched Progress is
being made in making workforce and labor market information more easily available to end
users A number of promising new developments are also underway including development of
both public and private-sector web-based database integration tools and geographic information
system (GIS) mapping functionality that allows labor market economic analyst and strategic
planners an additional perspective and dimension to the information displays
In developing the catalogue a number of additional sources of workforce and labor market
information that are less well known and generally not referenced by the Department of Labor
and its state and local workforce systems partners were identified There are firms offering
research services exclusively focused on local labor market developments and others that collect
workforce information and conduct labor market research to complement their primary business
Trade associations representing human resource professionals and industry often engage in the
collection of workforce and labor market information The research included a number of
private research institutions university-based research centers and advocacy groups offering
storehouses of workforce and labor market information Their efforts include conducting
DRAFT ANNUAL UPDATE February 2010 - 5 -
surveys and panel studies resulting in large comprehensive databases to support labor market
and workforce research Private as well as government funds support these efforts While some
of these sources require payment of fees to access the data others offer access at no cost
In addition to the number of public and private databases and information sources reviewed
there is a vast pool of labor market and workforce research carried out by academic government
foundation and private researchers Research products including journal articles published
papers research reports and books have appeared with growing frequency as labor market and
workforce development policies have drawn more interest from both public officials and
business leaders Knowledge developed and insights gained from these efforts need to be better
organized and synthesized to become more accessible to those wanting to enhance their practical
understanding of labor markets and workforce development
DRAFT ANNUAL UPDATE February 2010 - 6 -
US Department of Labor Bureau of Labor Statistics Employment and
Training and Administration
US Department of Labor Bureau of Labor Statistics Employment and Training Administration
Targeted Users
Survey Name
Cu
rren
t E
mp
loy
men
t
Sta
tist
ics
Qu
arte
rly
Cen
sus
of
Em
plo
ym
ent
and
Wag
es
Lo
cal
Are
a U
nem
plo
ym
ent
Sta
tist
ics
Occ
up
atio
nal
Em
plo
ym
ent
Sta
tist
ics
Mas
s L
ayo
ff S
tati
stic
s
Job
Op
enin
g a
nd
Lab
or
Tu
rnov
er S
urv
ey
Su
rvey
of
Em
plo
yer
-
Pro
vid
ed T
rain
ing
Nat
ion
al L
on
git
ud
inal
Su
rvey
s
Cu
rren
t P
op
ula
tio
n S
urv
ey
NC
S
O
NE
T
Employers
Government Agency
Federal State or Local
Elected Officials and Policymakers
Program Planners
Education and Training Providers
Intermediaries
Individuals
Researchers
DRAFT ANNUAL UPDATE February 2010 - 7 -
US Department of Labor Bureau of Labor Statistics Employment and Training Administration
Indicators
Survey Name
Cu
rren
t E
mp
loy
men
t
Sta
tist
ics
Qu
arte
rly
Cen
sus
of
Em
plo
ym
ent
and
Wag
es
Lo
cal
Are
a
Un
emp
loy
men
t S
tati
stic
s
Occ
up
atio
nal
Em
plo
ym
ent
Sta
tist
ics
Mas
s L
ayo
ff S
tati
stic
s
Job
Op
enin
g a
nd
Lab
or
Tu
rnov
er S
urv
ey
Su
rvey
of
Em
plo
yer
-
Pro
vid
ed T
rain
ing
Nat
ion
al L
on
git
ud
inal
Su
rvey
s
Cu
rren
t P
op
ula
tio
n
Su
rvey
NC
S
O
NE
T
Hours WorkedPayroll Hours
Earnings Trends
Unemployment Records -
Mass Layoffs
Labor Force Data
Labor Market Information
Employment
Wages Income Earnings
Future Demand and Hiring
Trends
EducationTraining Information
About Providers and Career
Advancement
Occupational Information
Skills Requirements
Program Participation
Information about Full- and Part-
Time Workers Contract
Workers and the Self-Employed
Unions
Information about Employers by
Company Size or Characteristics
Membership or Subscription
Required
RecruitingStaffing Industry
Information
Occupational Licensing
Information
Benefit Information
Information about Workforce
Commuting Patterns
DRAFT ANNUAL UPDATE February 2010 - 8 -
Bureau of Labor Statistics
The BLS provides comprehensive and timely information on the labor force employment
unemployment and related labor market characteristics at the national level industrial and
occupational employment at the state and local levels and labor force and unemployment figures
at state and local levels The BLS also develops projections of the labor force economic growth
industrial output and employment by industry and occupation for 10 years into the future for the
nation as a whole
Key BLS labor market information includes monthly estimates on the numbers of separations
new hires and current job openings by major industry groupings The BLS is also engaged in a
number of efforts designed to add to and improve current workforce and labor market
information systems In conjunction with the Census Bureau the BLS began in FY 2003 to
conduct the American Time-Use Survey The focus of the survey is on how Americans divide
their time between work and leisure The BLS also implemented the conversion of all national
state and area estimates to the North American Industry Classification System (NAICS) This
system of classifying industries was adopted with the passage of the North American Free Trade
Agreement (NAFTA) and facilitates industry comparisons for the US Mexico and Canada
The core labor market information programs conducted by BLS include the following
The Current Employment Statistics (CES)
A survey of payroll records covers over 300000 (non-farm) businesses employing a third of all
payroll workers on a monthly basis and provides detailed industry data on employment levels
hours and earnings of workers on non-farm payrolls for the nation These estimates are based
on the businesseslsquo payroll records The survey is conducted by state workforce agencies in
cooperation with the BLS The survey has been underway since 1939 and provides one of the
more continuous statistical series on employment and earnings in the US Coverage includes
non-farm payroll employment in over 600 industries including major divisions and more
detailed industry levels
The CES yields important economic indicators including employment levels earnings trends
and average weekly hours worked These data are of value to policymakers who monitor overall
economic performance Planners and analysts use this information to develop business plans and
strategies including cost projections and wage negotiations
CES employment data represent the number of covered workers who worked during or received
pay for the pay period that includes the 12th
of the month Excluded are members of the armed
forces the self-employed proprietors domestic workers unpaid family workers and railroad
workers covered by the railroad unemployment insurance system
The Quarterly Census of Employment and Wages (QCEW)
QCEW is a program that produces comprehensive employment and wage data by industry and
county and state for workers covered by unemployment insurance (UI) laws The QCEW
program also known as the ES-202 program is a cooperative program involving the BLS and
the state workforce agencies (SWAs) QCEW includes data on the number of establishments
DRAFT ANNUAL UPDATE February 2010 - 9 -
monthly employment and quarterly wages by industry at the 6-digit NAICS level by county
by ownership sector for the entire US for each state and for the District of Columbia Puerto
Rico and the US Virgin Islands
The QCEW program produces a virtual economic census of employment and wages each
quarter It is based on quarterly contribution reports from the more than eight million employers
subject to state and federal unemployment insurance laws This wide base of reported data
supports the publication of monthly employment and quarterly wage information by 6-digit
NAICS at the national state and county levels At the national level the QCEW program
publishes employment and wage data for nearly every 6-digit NAICS as well as for each
industry aggregate between the base 6-digit level and the all-industry total level
QCEW wages represent total compensation paid during the calendar quarter regardless of when
services were performed As a total compensation measure QCEW wages also include non-
wage cash compensation such as tips bonuses and in many states exercised stock options
Data from the QCEW program serve as important input to many BLS programs The QCEW
data are used as the benchmark source for employment by the Current Employment Statistics
(CES) program and the Occupational Employment Statistics (OES) program The UI
administrative records collected under the QCEW program serve as a sampling frame for other
BLS establishment surveys In addition data from the QCEW program serve as input to other
federal and state programs The Bureau of Economic Analysis (BEA) of the Department of
Commerce uses QCEW data as the base for developing the wage and salary component of
personal income The Department of Laborlsquos ETA and the SWAs use QCEW data to administer
the employment security program The QCEW data accurately reflect the extent of coverage of
the state UI laws and are used to measure UI revenues national state and local area
employment and total and UI taxable wage trends
The Local Area Unemployment Statistics (LAUS)
This program produces monthly and annual employment unemployment and labor force data
for census regions and divisions states metropolitan areas small labor market areas counties
and many cities by place of residence The LAUS program is a federal-state cooperative effort
in which monthly estimates of total employment and unemployment are prepared for
approximately 6900 areas These estimates are key indicators of local economic conditions
The BLS is responsible for the concepts definitions technical procedures validation and
publication of the estimates that state workforce agencies prepare under agreement with BLS
Local area unemployment statistics are perhaps the best known and most widely used labor
market information product Monthly media reports draw attention to the state of economic
health using measures of employment and unemployment These statistics are also used by
federal programs for determining funding allocations to states and areas as well as eligibility
determinations for assistance State and local governments use the estimates for planning and
budgetary purposes and to determine the need for local employment and training services
Private industry researchers the media and other individuals use the data to assess localized
labor market developments and make comparisons across areas
DRAFT ANNUAL UPDATE February 2010 - 10 -
The Occupational Employment Statistics (OES)
This program produces employment and wage estimates for about 800 occupations These are
estimates of the number of people employed in certain occupations and estimates of the wages
paid to them The OES program produces these occupational estimates by geographic area and
by industry Estimates based on geographic areas are available at the National State and
Metropolitan Area levels Estimates based on industry are available for over 450 industry
classifications at the national level The industry classifications correspond to the sector 3 4
and 5-digit North American Industry Classification System (NAICS) industrial groups
The OES program collects its data using a mail survey sent to establishments in May and
November of each year The OES program surveys approximately 200000 establishments per
survey cycle taking three years to fully collect the sample of 12 million establishments Self-
employed persons are not included in the estimates
The OES survey is a federal-state cooperative program between the BLS and SWAs BLS
provides the procedures and technical support draws the sample and produces the survey
materials while the SWAs collect the data from establishments Occupational employment and
wage rate estimates at the national level are produced by BLSndashWashington using data from the
50 states and the District of Columbia Employers who respond to stateslsquo requests to participate
in the OES survey make these estimates possible
OES wage and employment estimates have a wide variety of uses The BLS Occupational
Employment Projections program uses OES employment data to produce national occupational
employment projections Employment data are also used by the states to produce state and local
area employment projections Wage data are an important input in the determination of the
prevailing wage for use in Alien Labor Certification OES employment and wage estimates are
also a valuable commodity to the general public whether the data are assembled in the BLS
Occupational Outlook Handbook released across the country in various occupational
information systems or released to the public through the OES publication and website
The Mass Layoff Statistics (MLS)
This program is a federal-state cooperative statistical effort which uses a standardized automated
approach to identify describe and track the effects of major job cutbacks using data from each
statelsquos UI database Establishments that have at least 50 initial claims for UI filed against them
during a consecutive five-week period are contacted by state agencies to determine whether
those separations are of at least 31 days duration and if so information is obtained on the total
number of persons separated the reasons for these separations and recall expectations
Establishments are identified according to industry classification and location and UI claimants
are identified by such demographic characteristics as age race sex ethnic group and place of
residence The program yields information on an individuallsquos entire period of unemployment to
the point when regular UI benefits are exhausted It provides databases of establishments and
claimants both of which are used for further research and analysis
MLS are used to determine sub-state allocations of federal funds for the dislocated workers
program analysis of ailing industries or geographic areas identification of the causes and scope
of worker dislocation in terms of the human and economic costs and the characteristics of
DRAFT ANNUAL UPDATE February 2010 - 11 -
dislocated workers Data are also used for the development of workforce plans and labor market
analysis and in assisting employers andor workers at the local level through the analysis of the
potentially available labor supply
The Job Openings and Labor Turnover Survey (JOLTS)
This program produces a new monthly study that has been developed to address the need for data
on job openings hires and separations Estimates from the JOLTS program are not seasonally
adjusted therefore comparisons of JOLTS estimates should be based on the same month in
different years These data serve as a demand-side indicator of labor shortages at the national
level Prior to JOLTS there was no economic indicator of the unmet demand for labor with
which to assess the presence or extent of labor shortages in the US The availability of unfilled
jobs (the ―job openings rate) is an important measure of the tightness of job markets parallel to
existing measures of unemployment Data from a sample of approximately 16000 US business
establishments are collected by the BLS through the Atlanta JOLTS Data Collection Center The
JOLTS survey covers all non-agricultural industries in the public and private sectors for the 50
states and the District of Columbia JOLTS collects data on total employment job openings
hires quits layoffs and discharges and other separations
The JOLTS survey is used for national economic policy analysis including a deeper examination
of business cycles It provides a more dynamic look at labor market performance to aid
economic research and planning including the analysis of education and job training issues
The Survey of Employer-Provided Training
Subject to funding availability the BLS also conducts specialized studies related to labor market
performance and workforce challenges facing the US economy Such studies are conducted
over a limited period of time and yield important topical findings One such survey was initially
conducted in September of 1993 The 1993 Survey of Employer-Provided Training provided
baseline information on the nature and existence of formal training provided or financed by
employers Nearly 12000 private establishments of all sizes were surveyed to determine what
types of formal training were provided during 1993 The 1995 Survey of Employer-Provided
Training provided information on the amount of formal and informal training provided by
employers as well as the amount employers spent on selected costs of training This survey was
conducted during personal visits to more than 1000 private establishments with 50 or more
employees from May through October 1995 A representative of the establishment provided
information on the hours and costs of formal training and randomly selected individual
employees provided information on their hours of both formal and informal training
The National Longitudinal Surveys (NLS)
A set of surveys designed to gather information at multiple points in time on the labor market
activities and other significant life events of several groups of men and women For more than
three decades NLS data have served as a tool for economists sociologists and other researchers
in analyzing how individuals fare and perform in the labor market over time Multiple cohorts
have been surveyed The NLS of Youth 1997 is a survey of young men and women born in the
years 1980-84 respondents were ages 12-17 when first interviewed in 1997 The NLS of Youth
1979 is a survey of men and women born in the years 1957-64 respondents were ages 14-22
when first interviewed in 1979 The NLS of 1979 Children and Young Adults is a survey of the
DRAFT ANNUAL UPDATE February 2010 - 12 -
biological children of women that were interviewed in the 1979 survey The NLS of Young
Women and Mature Women include women who were ages 14-24 when first interviewed in
1968 The Mature Womenlsquos survey includes women who were ages 30-44 when first
interviewed in 1967 These surveys are now conducted simultaneously in odd-numbered years
The NLS of Young Men and Older Men which was discontinued in 1981 include men who
were ages 14-24 when first interviewed in 1966 The Older Menlsquos survey which was
discontinued in 1990 includes men who were ages 45-59 when first interviewed in 1966 The
data available from these surveys provide a dynamic picture of how various groups fare in the
labor market over time At a time of rapid technological change and large-scale worker
dislocations monitoring the labor market experiences of different groups including exits and
entry earnings records and other aspects of labor market behavior becomes a critically
important dimension of workforce analysis
The Current Population Survey (CPS)
The CPS is a monthly survey of approximately 60000 households conducted by the Census
Bureau for the BLS It provides a comprehensive body of data on the labor force employment
unemployment and persons not in the labor force The survey covers the employment status of
the civilian non-institutional population 16 years and over by age sex race Hispanic origin
marital status family relationship veteran status women maintaining families working women
with children and educational attainment It looks at employed persons by occupation industry
class of worker hours of work full- or part-time status and reasons for working part-time Also
included are employed multiple jobholders by occupation industry numbers of jobs held and
full- or part-time status of multiple jobs The survey collects information about unemployed
persons by occupation industry class of worker of last job duration of unemployment reason
for unemployment and methods used to find employment To better gauge labor force potential
the survey includes discouraged workers and other persons not in the labor force
Special topics such as the labor force status of particular subgroups of the population (e g
displaced workers and disabled veterans) are also covered Data are also available on work
experience occupational mobility job tenure and school enrollment of workers Information is
provided on weekly and hourly earnings by detailed demographic group occupation education
union affiliation and full- and part-time employment status
The CPS is among the most comprehensive and current sources of information about the
performance of labor markets and the status of the workforce
The National Compensation Survey (NCS)
This survey provides comprehensive measures of occupational earnings trends in the costs of
employee compensation benefit incidence and detailed benefit plan provisions Estimates of
hourly weekly and annual earnings are available for up to 450 occupations in 80 metropolitan
areas 9 census geographic regions and the nation The Employment Cost Index component of
the NCS measures changes in employee compensation Separate estimates are produced to
account for seasonal fluctuations in the data The Employer Cost for Employee Compensation
component of the NCS measures the average hourly employer costs for the total compensation
packages of their employeesmdashwages and salaries and separately for employee benefits The
NCS estimates of benefit incidence measure the proportion of employees covered by most
DRAFT ANNUAL UPDATE February 2010 - 13 -
recognized employee benefit programs and the detailed benefit provision estimates describe the
plan features in force for most major benefits such as paid leave disability health and
retirement benefits All estimates are produced annually except the Employment Cost Index and
the Employer Cost for Employee Compensation which are produced quarterly
The Employment Projections (EP)
The EP program analyzes historical data and information from secondary sources and biennially
prepares projections 10 years into the future at the national level covering the future size and
composition of the labor force aggregate economic growth detailed estimates of industrial
production and industrial and occupational employment These data are a basis for developing
estimates of occupational requirements by industry evaluating the future size and quality of the
labor force and a framework for analyzing future problems of labor utilization
In addition the program produces the National Employment Matrix a unique tool that quantifies
detailed information on the distribution of occupational employment by class of worker and
industry for current and projected years Data are available for nearly 700 detailed occupations
in over 250 detailed industries that are inclusive of the entire economy Data uses include
analysis of various government and private expenditure programs in terms of their impacts on
industry and occupational employment analysis of changes in the occupational structure of
detailed industries resulting from changes in technology product mix and other factors
development of projections of occupational employment for detailed occupations by industry
and development of state and local area industry-occupation employment matrices
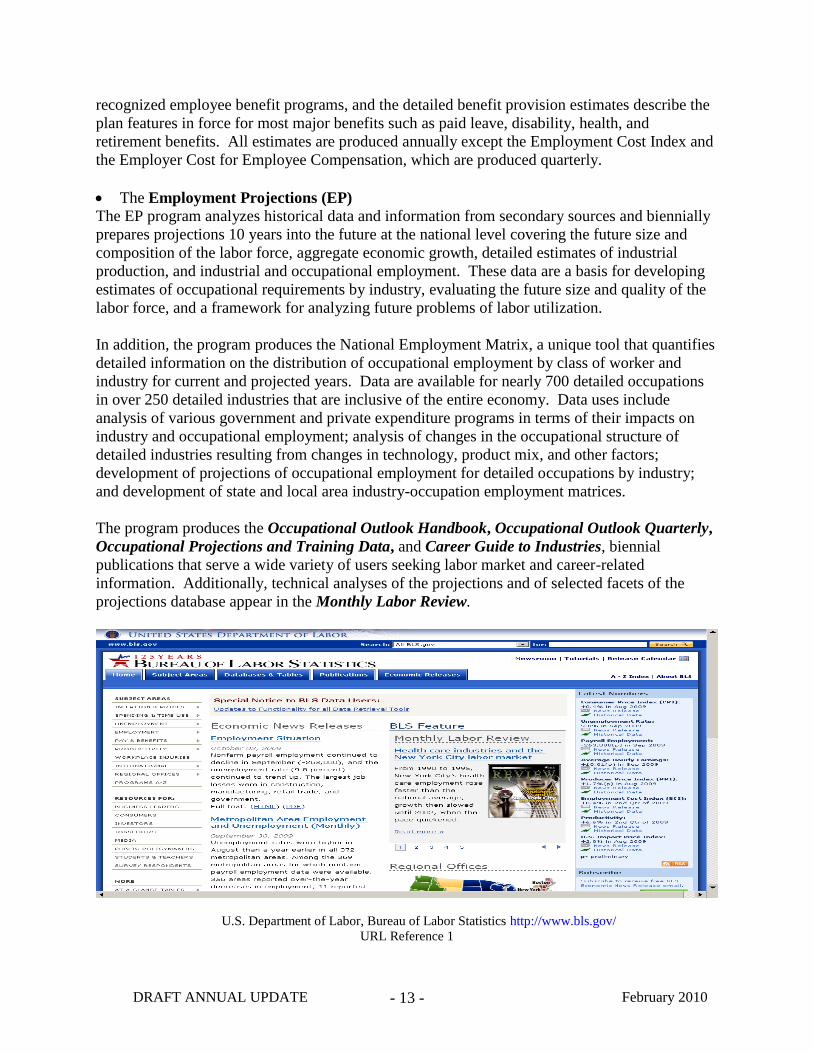
The program produces the Occupational Outlook Handbook Occupational Outlook Quarterly
Occupational Projections and Training Data and Career Guide to Industries biennial
publications that serve a wide variety of users seeking labor market and career-related
information Additionally technical analyses of the projections and of selected facets of the
projections database appear in the Monthly Labor Review
US Department of Labor Bureau of Labor Statistics httpwwwblsgov
URL Reference 1
DRAFT ANNUAL UPDATE February 2010 - 14 -
Employment and Training Administration
The mission of the Employment and Training Administration is to contribute to the more
efficient functioning of the US labor market by providing high quality job training
employment labor market information and income maintenance services primarily through state
and local workforce development systems On behalf of American taxpayers the Employment
and Training Administration administers programs that have at their core the goals of enhanced
employment opportunities and business prosperity
US Department of Labor Employment and Training Administration httpwwwdoletagov
URL Reference 2
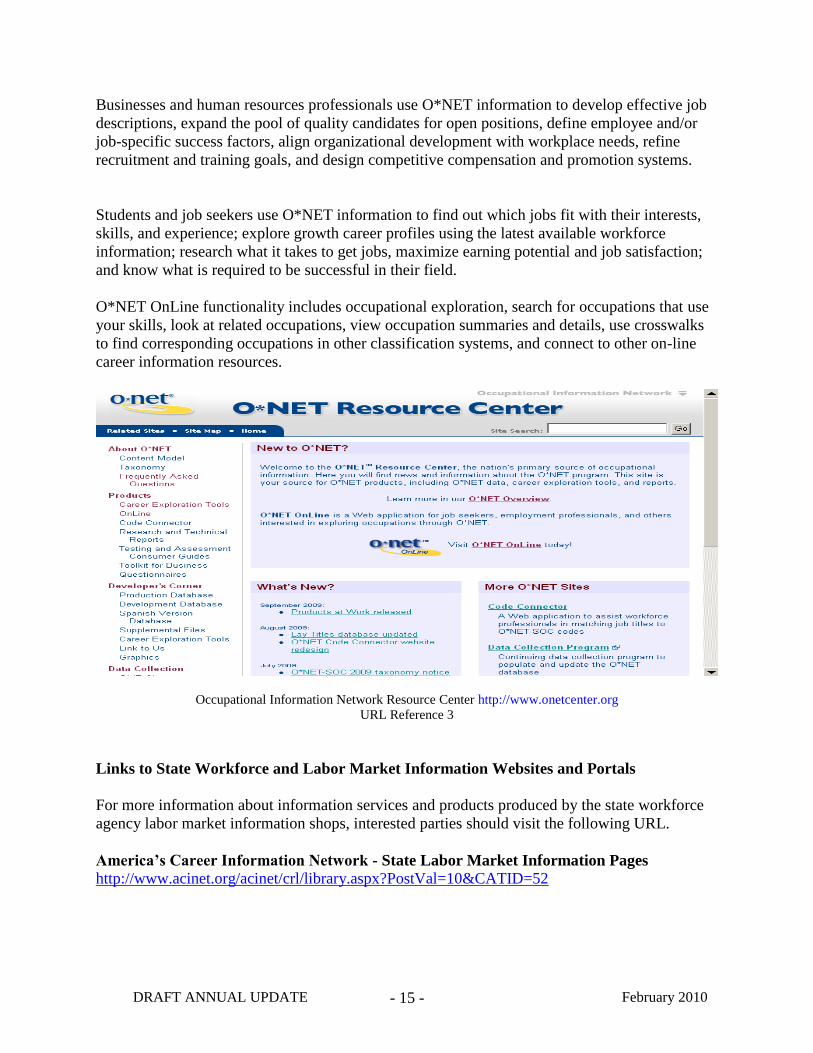
ONET OnLine ONET Online is an application that was created under a grant from the US Department of
Labor to provide broad access to the ONET database of occupational competencies including
information on knowledge skills abilities tasks work activities interests and work values
associated with occupations This information can be used to facilitate career exploration
vocational counseling and a variety of human resources functions such as developing job
orders position descriptions and aligning training with current workplace needs
Information in ONET is available for over 800 occupations ONET occupational titles and
codes are based on the 2000 Standard Occupational Classification (SOC) system which is also
used for employment and wage statistics The ONET database and data collection survey is a
unique powerful source for continually updated occupational information and labor market
research By using a contemporary interactive skills-based database and a common language to
describe worker skills and attributes the ONET system provides comprehensive searchable
skills information that can be and is adapted for many uses
DRAFT ANNUAL UPDATE February 2010 - 15 -
Businesses and human resources professionals use ONET information to develop effective job
descriptions expand the pool of quality candidates for open positions define employee andor
job-specific success factors align organizational development with workplace needs refine
recruitment and training goals and design competitive compensation and promotion systems
Students and job seekers use ONET information to find out which jobs fit with their interests
skills and experience explore growth career profiles using the latest available workforce
information research what it takes to get jobs maximize earning potential and job satisfaction
and know what is required to be successful in their field
ONET OnLine functionality includes occupational exploration search for occupations that use
your skills look at related occupations view occupation summaries and details use crosswalks
to find corresponding occupations in other classification systems and connect to other on-line
career information resources
Occupational Information Network Resource Center httpwwwonetcenterorg URL Reference 3
Links to State Workforce and Labor Market Information Websites and Portals
For more information about information services and products produced by the state workforce
agency labor market information shops interested parties should visit the following URL
Americarsquos Career Information Network - State Labor Market Information Pages
httpwwwacinetorgacinetcrllibraryaspxPostVal=10ampCATID=52
DRAFT ANNUAL UPDATE February 2010 - 16 -
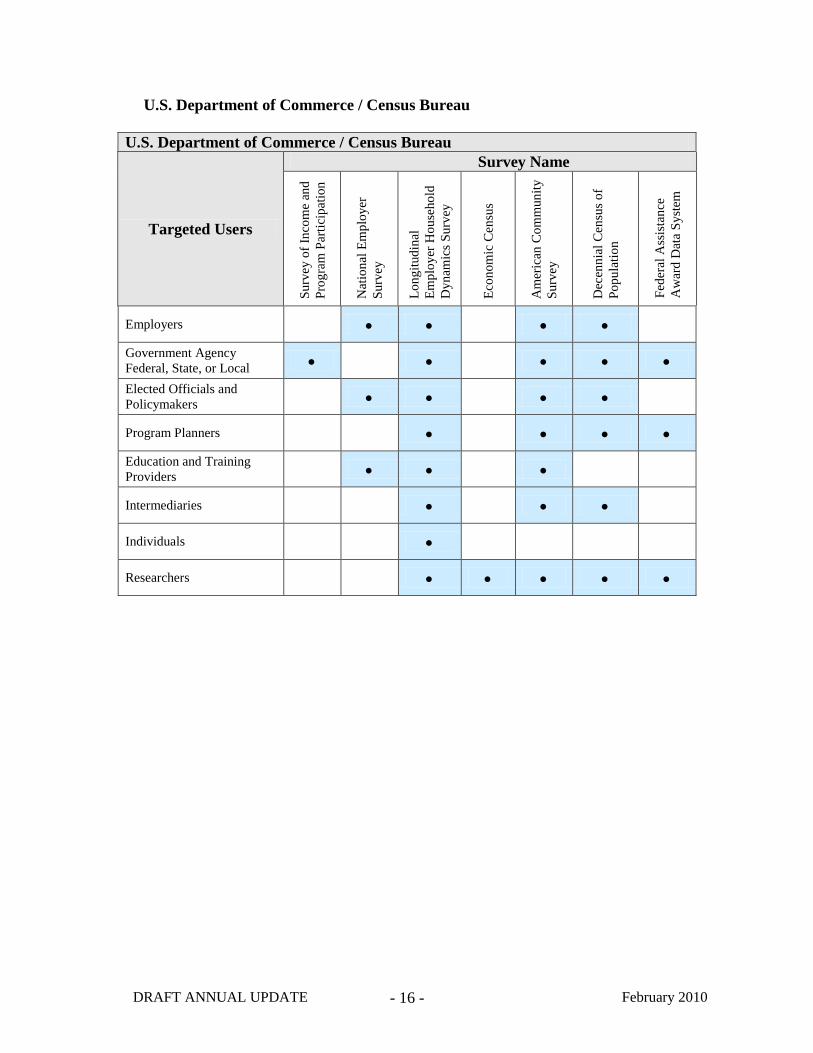
US Department of Commerce Census Bureau
US Department of Commerce Census Bureau
Targeted Users
Survey Name
S
urv
ey o
f In
com
e an
d
P
rog
ram
Par
tici
pat
ion
N
atio
nal
Em
plo
yer
S
urv
ey
L
on
git
ud
inal
E
mp
loy
er H
ou
seho
ld
D
yn
amic
s S
urv
ey
E
con
om
ic C
ensu
s
A
mer
ican
Co
mm
un
ity
S
urv
ey
D
ecen
nia
l C
ensu
s o
f
P
op
ula
tio
n
Fed
eral
Ass
ista
nce
Aw
ard
Dat
a S
yst
em
Employers
Government Agency
Federal State or Local
Elected Officials and
Policymakers
Program Planners
Education and Training
Providers
Intermediaries
Individuals
Researchers
DRAFT ANNUAL UPDATE February 2010 - 17 -
US Department of Commerce Census Bureau
Indicators
Survey Name
S
urv
ey o
f In
com
e an
d
P
rog
ram
Par
tici
pat
ion
Nat
ion
al E
mp
loy
er
Su
rvey
Lo
ng
itu
din
al
Em
plo
yer
Ho
use
ho
ld
Dy
nam
ics
Su
rvey
Eco
no
mic
Cen
sus
A
mer
ican
Co
mm
un
ity
S
urv
ey
Dec
enn
ial
Cen
sus
of
P
op
ula
tio
n
Fed
eral
Ass
ista
nce
Aw
ard
Dat
a S
yst
em
Hours WorkedPayroll Hours
Earnings Trends
Unemployment Records ndash
Mass Layoffs
Labor Force Data
Labor Market Information
Employment
Wages Income Earnings
Future Demand and Hiring Trends
EducationTraining Information about
Providers and Career Advancement
Occupational Information
Skill Requirements
Program Participation
Information about Full- and Part-Time
Workers Contract Workers and the
Self-Employed
Unions
Information about Employers by
Company Size or Characteristics
Membership or Subscription Required
RecruitingStaffing Industry
Information
Occupational Licensing Information
Benefit Information
Information about Workforce
Commuting Patterns
DRAFT ANNUAL UPDATE February 2010 - 18 -
US Department of Commerce
Along with the Department of Labor the Department of Commerce holds major responsibilities
for collecting and disseminating economic and demographic information The Departmentlsquos
Economics and Statistics Administration (ESA) is the agency within Commerce and the
Executive Branch where information related to economic and societal change is collected and
reported ESA describes its mission (1) help maintain a sound federal statistical system that
monitors and measures Americalsquos rapidly changing economic and social arrangements
(2) improve understanding of the key forces at work in the economy and the opportunities they
create for improving the well-being of Americans (3) develop new ways to disseminate
information using the most advanced technologies and (4) support the information and analytic
needs of the Commerce Department the Executive Branch and Congress ESA includes two
major statistical organizations the Bureau of Economic Analysis (BEA) and the Census Bureau
are two essential elements of the federal statistical system
Bureau of Economic Analysis (BEA) is a federal statistical agency that combines and
transforms economic data from government and private sources into a consistent and
comprehensive picture of economic activity BEA is the accountant for the national economy
developing measures and systems for collecting and interpreting vast amounts of diverse data
including data related to trade exports labor markets the workforce and workforce places
Drawn together BEA statistics and analyses provide a comprehensive picture of US economic
activity on regional national and international bases The economic accounts managed by BEA
and basic measures such as Gross Domestic Product (GDP) form the core of the federal
statistical system Data from BEA are critical to sound economic decisions by businesses
individuals state and local governments and federal institutions such as the Treasury
Department and the Federal Reserve
The Census Bureau is the primary source of information about people and the economy The
Bureau conducts large-scale surveys and censuses providing the nationlsquos official measures for
income poverty and health insurance coverage It also supplies key economic indicators
including housing starts retail and wholesale trade sales international trade manufacturerslsquo
shipments orders and quarterly estimates of corporate profits While the Bureaulsquos most visible
function is focused on conducting the decennial census that produces the widest range of
information available at the smallest geographic level it also fields over 35 regular demographic
surveys and is responsible for collecting the nationlsquos most detailed picture of businesses through
the County Business Patterns and the Economic Censuses
DRAFT ANNUAL UPDATE February 2010 - 19 -
U S Department of Commerce httpwwwcommercegov URL Reference 4
Key surveys and data sources yielding important workforce and labor market information
include the following
Survey of Income and Program Participation (SIPP) The main objective of SIPP is to provide accurate and comprehensive information about the
income and program participation of individuals and households in the US and about the
principal determinants of income and program participation SIPP offers detailed information on
cash and non-cash income on a sub-annual basis The survey also collects data on taxes assets
liabilities and participation in government transfer programs SIPP data allow the government
to evaluate the effectiveness of federal state and local programs
SIPP collects source and amount of income labor force information program participation and
eligibility data and general demographic characteristics to measure the effectiveness of existing
federal state and local programs to estimate future costs and coverage for government
programs such as food stamps and to provide improved statistics on the distribution of income
in the country
The survey design is a continuous series of national panels with sample sizes ranging from
approximately 14000 to 36700 interviewed households The duration of each panel ranges
from 2 12 years to 4 years The SIPP sample is a multi-stage stratified sample of the US
civilian non-institutionalized population For the 1984-1993 panels a panel of households was
introduced each year in February A 4-year panel was introduced in April 1996 A 2000 panel
was introduced in February 2000 for two waves A 3-year 2001 panel was introduced in
February 2001
The SIPP content is built around a core of labor force program participation and income
questions designed to measure the economic situation of persons in the US These questions
DRAFT ANNUAL UPDATE February 2010 - 20 -
expand the data currently available on the distribution of cash and non-cash income and are
repeated at each interviewing wave The survey uses a four-month recall period with
approximately the same number of interviews being conducted in each month of the four-month
period for each wave Interviews are conducted by personal visit and by decentralized telephone
The survey has been designed also to provide a broader context for analysis by adding questions
on a variety of topics not covered in the core section Topics covered by the modules include
personal history childcare wealth program eligibility child support disability school
enrollment taxes and annual income All household members 15 years old and over are
interviewed by self-response if possible proxy response is permitted when household members
are not available for interviewing
The National Employer Survey
This Survey provides information on worker education employer training and employer
business characteristics including business productivity The survey is congressionally
authorized and provides for voluntary responses The National Center on the Educational
Quality of the Workforce (EQW) a non-profit research group fully funds the survey
US manufacturing and non-manufacturing establishments with 20 or more employees except
agriculture and government establishments are included Data were collected on four topics
employees and employment employee training business characteristics and equipment and
technology Employees and employment included number of employees work week pay
benefits supervision hiring practices and union representation Employee training included
organization purposes formal and informal programs duration trainees and effectiveness
Business characteristics included the year operations began company and establishment size
principal product and exports Equipment and technology included capital assets recent
investments age of equipment use of computers and research activities
A major finding was that in the early 1990lsquos increased worker training and education raised
business productivity more than comparably increased hours worked or capital equipment The
First Findings report was released by the EQW about 13 months after the survey reference year
(7 months after data collection was completed) It included data on worker education and
workplace training and employer views on education adequacy and hiring practices
Contribution to the Productivity of Establishments report was released by EQW about 17 months
after the reference year It included data on the relationship between worker education and
business productivity and the comparative productivity contributions of increased hours and
capital investment Another major report by EQW is scheduled for release about 20 months after
the reference year It will include the complete results from the regression models of studied
activities by establishment size
Education human services and economic policy agencies use the study results to assess what
kinds of education and training most affect business productivity and encourage actions and
develop initiatives that increase productivity Employer businesses and industry associations use
the results to assess existing and potential company and industry practices and take actions that
will increase business productivity profitability and international competitiveness The survey
provided first-ever US statistics that relate education training and hiring practices to business
DRAFT ANNUAL UPDATE February 2010 - 21 -
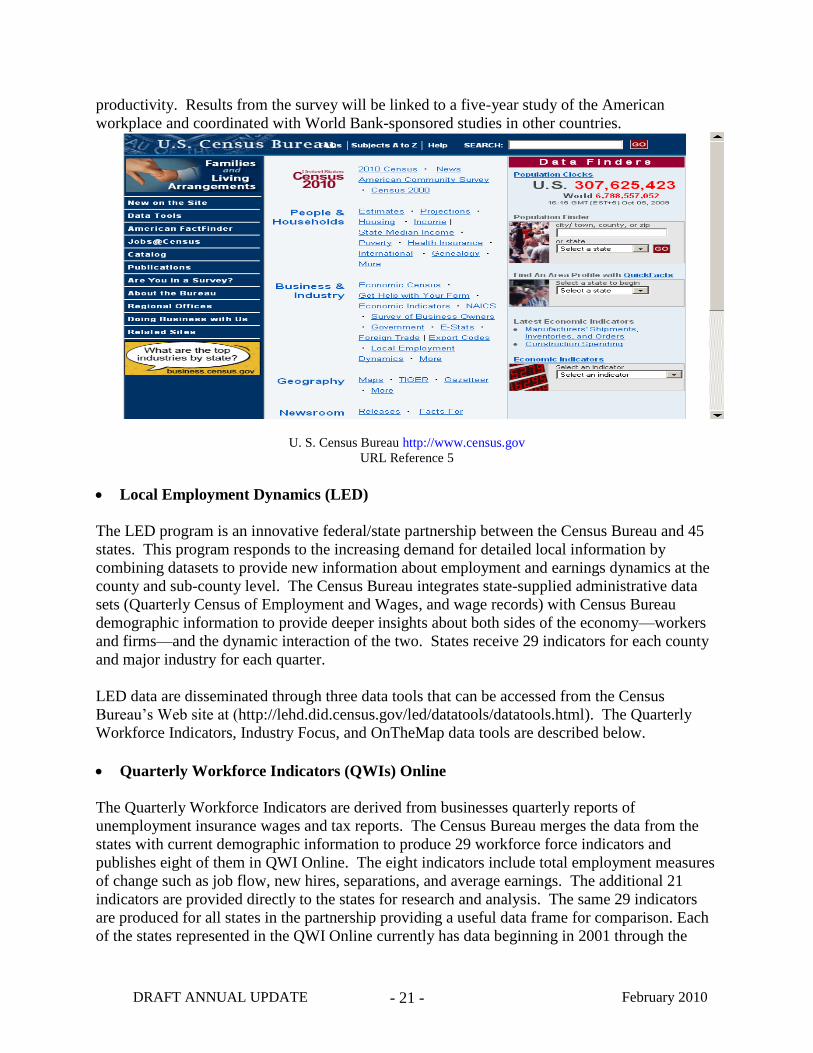
productivity Results from the survey will be linked to a five-year study of the American
workplace and coordinated with World Bank-sponsored studies in other countries
U S Census Bureau httpwwwcensusgov URL Reference 5
Local Employment Dynamics (LED)
The LED program is an innovative federalstate partnership between the Census Bureau and 45
states This program responds to the increasing demand for detailed local information by
combining datasets to provide new information about employment and earnings dynamics at the
county and sub-county level The Census Bureau integrates state-supplied administrative data
sets (Quarterly Census of Employment and Wages and wage records) with Census Bureau
demographic information to provide deeper insights about both sides of the economymdashworkers
and firmsmdashand the dynamic interaction of the two States receive 29 indicators for each county
and major industry for each quarter
LED data are disseminated through three data tools that can be accessed from the Census
Bureaulsquos Web site at (httplehddidcensusgovleddatatoolsdatatoolshtml) The Quarterly
Workforce Indicators Industry Focus and OnTheMap data tools are described below
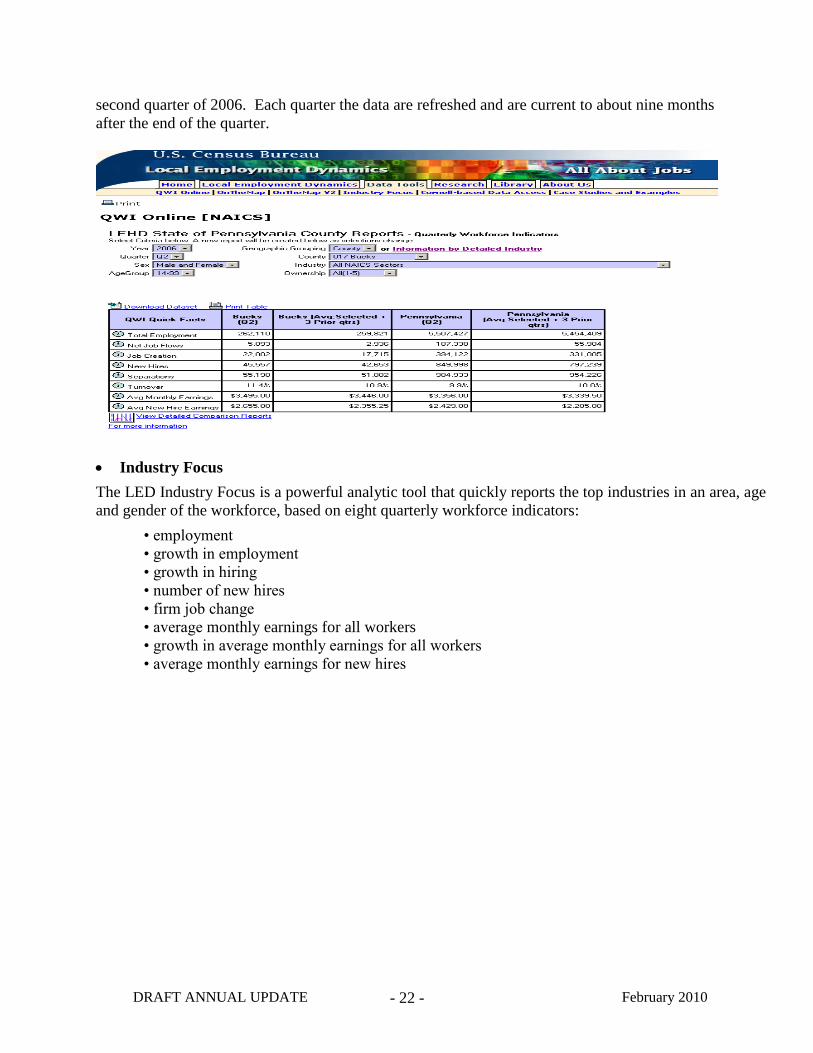
Quarterly Workforce Indicators (QWIs) Online
The Quarterly Workforce Indicators are derived from businesses quarterly reports of
unemployment insurance wages and tax reports The Census Bureau merges the data from the
states with current demographic information to produce 29 workforce force indicators and
publishes eight of them in QWI Online The eight indicators include total employment measures
of change such as job flow new hires separations and average earnings The additional 21
indicators are provided directly to the states for research and analysis The same 29 indicators
are produced for all states in the partnership providing a useful data frame for comparison Each
of the states represented in the QWI Online currently has data beginning in 2001 through the
DRAFT ANNUAL UPDATE February 2010 - 22 -
second quarter of 2006 Each quarter the data are refreshed and are current to about nine months
after the end of the quarter
Industry Focus
The LED Industry Focus is a powerful analytic tool that quickly reports the top industries in an area age
and gender of the workforce based on eight quarterly workforce indicators
bull employment
bull growth in employment
bull growth in hiring
bull number of new hires
bull firm job change
bull average monthly earnings for all workers
bull growth in average monthly earnings for all workers
bull average monthly earnings for new hires
DRAFT ANNUAL UPDATE February 2010 - 23 -
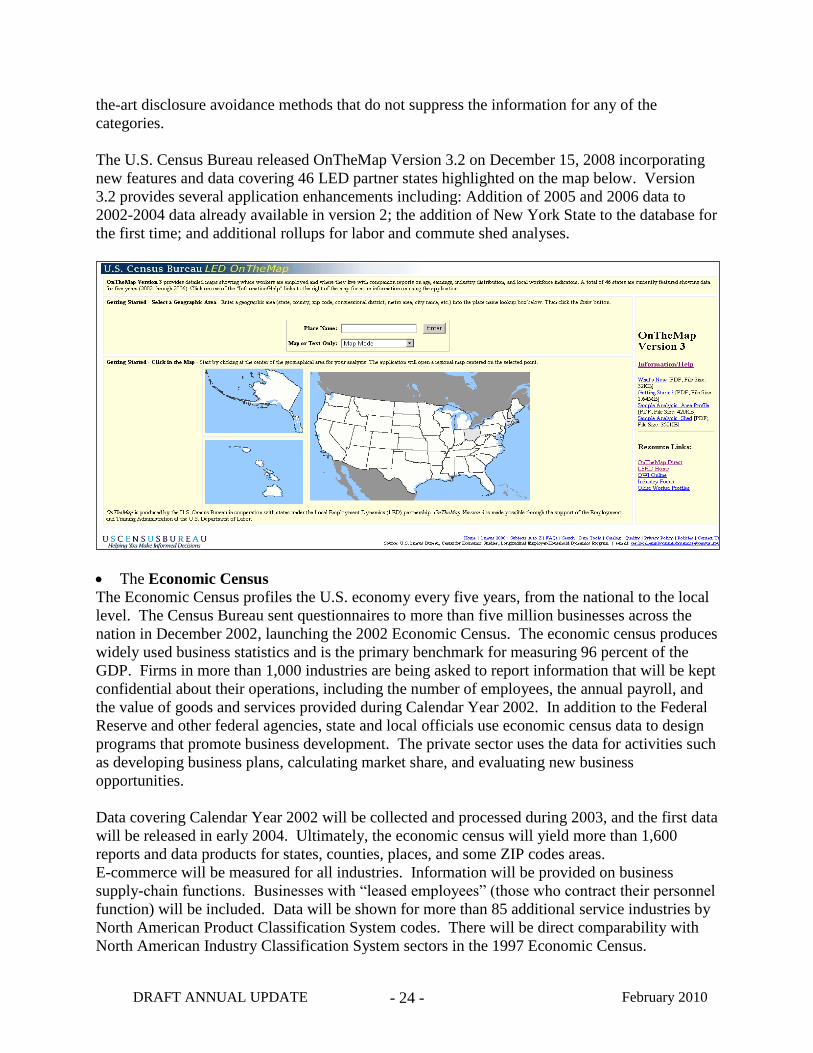
LED ldquoOnTheMaprdquo
OnTheMap is a web-based interactive mapping application The objective is to show where
people work and where workers live on maps with companion reports on their age earnings
industry distributions and local workforce indicators The user can select a geographic area and
answer Travel Pattern questions such as
Where do workers live that are employed in the area
What are the workplace destinations for workers living in the selected community or
neighborhood
How do the employment areas compare in terms of worker origin-destination patterns
workerslsquo ages monthly earnings and industry
How are these areas changing over time
OnTheMap provides timely data for labor market economic development transportation
emergency management and other potential applications The travel patterns are displayed at the
census block level and the profile reports are produced at the census block group level The
application also includes analytical tools that answer questions such as
Concentric Ring Analysis How many jobs are located within five ten or twenty miles of
a planned employment training center or transit stop
Paired Area Analysis How many workers live along a transit corridor and work
downtown or in some other area along the same corridor
OnTheMap provides information on census-block-to-census-block travel patterns and on the
characteristics of workers and firms in each work and home area on an annual basis
OnTheMap data are created by integrating unemployment insurance wage records and ES-202
establishment records covering about 98 percent of all private non-farm employment
Confidentiality is strictly protected at all detailed geographic levels through the use of state-of-
DRAFT ANNUAL UPDATE February 2010 - 24 -
the-art disclosure avoidance methods that do not suppress the information for any of the
categories
The US Census Bureau released OnTheMap Version 32 on December 15 2008 incorporating
new features and data covering 46 LED partner states highlighted on the map below Version
32 provides several application enhancements including Addition of 2005 and 2006 data to
2002-2004 data already available in version 2 the addition of New York State to the database for
the first time and additional rollups for labor and commute shed analyses
The Economic Census
The Economic Census profiles the US economy every five years from the national to the local
level The Census Bureau sent questionnaires to more than five million businesses across the
nation in December 2002 launching the 2002 Economic Census The economic census produces
widely used business statistics and is the primary benchmark for measuring 96 percent of the
GDP Firms in more than 1000 industries are being asked to report information that will be kept
confidential about their operations including the number of employees the annual payroll and
the value of goods and services provided during Calendar Year 2002 In addition to the Federal
Reserve and other federal agencies state and local officials use economic census data to design
programs that promote business development The private sector uses the data for activities such
as developing business plans calculating market share and evaluating new business
opportunities
Data covering Calendar Year 2002 will be collected and processed during 2003 and the first data
will be released in early 2004 Ultimately the economic census will yield more than 1600
reports and data products for states counties places and some ZIP codes areas
E-commerce will be measured for all industries Information will be provided on business
supply-chain functions Businesses with ―leased employees (those who contract their personnel
function) will be included Data will be shown for more than 85 additional service industries by
North American Product Classification System codes There will be direct comparability with
North American Industry Classification System sectors in the 1997 Economic Census
DRAFT ANNUAL UPDATE February 2010 - 25 -
The American Community Survey
This survey is a new approach for collecting accurate timely information needed for critical
government functions This new approach provides accurate up-to-date profiles of Americas
communities every year Community leaders and other data users have timely information for
planning and evaluating public The American Community Survey collects data from a sample
of 3 million households each year in every county and American Indian and Native Alaska area
as well as in the Hawaiian Homelands and Puerto Rico The American Community Survey will
provide the same sort of data as the census long form updated every year With a nationwide
sample of 3 million addresses the American Community Survey provides demographic social
economic and housing profiles annually for areas and subgroups with 65000 or more people For
communities of less than 65000 it will take 3 to 5 years to accumulate enough samples to
provide estimates similar to the quality of the census long form
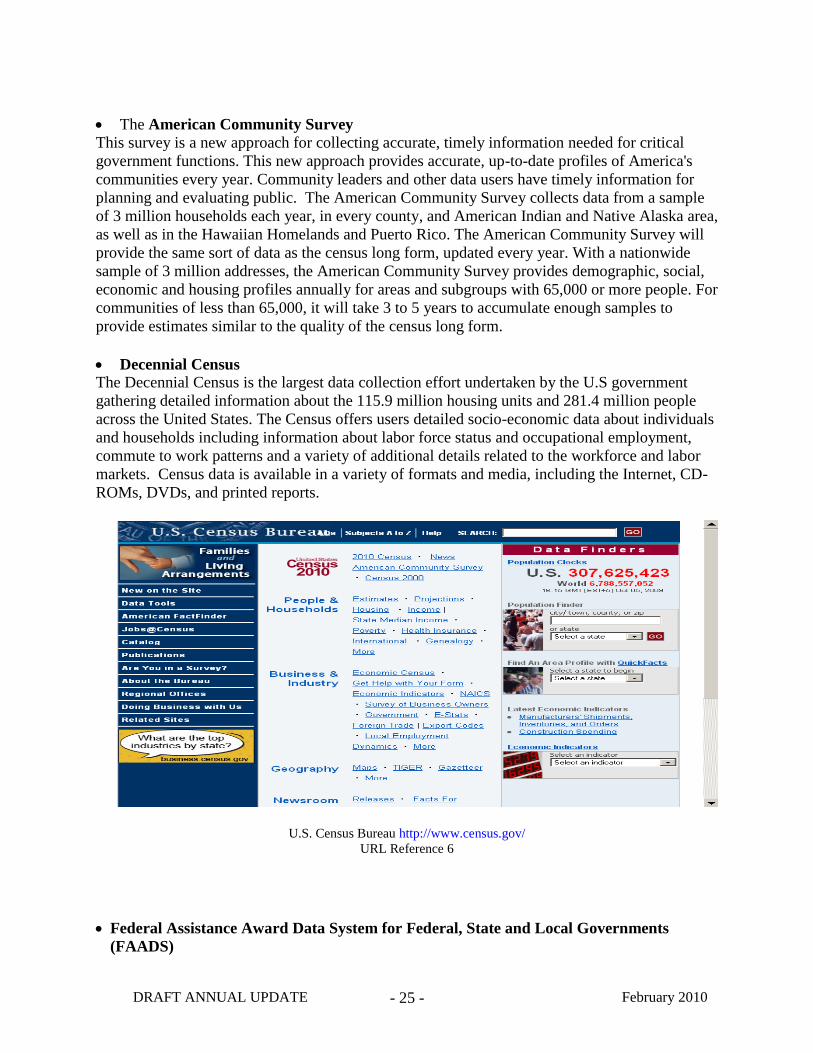
Decennial Census The Decennial Census is the largest data collection effort undertaken by the US government
gathering detailed information about the 1159 million housing units and 2814 million people
across the United States The Census offers users detailed socio-economic data about individuals
and households including information about labor force status and occupational employment
commute to work patterns and a variety of additional details related to the workforce and labor
markets Census data is available in a variety of formats and media including the Internet CD-
ROMs DVDs and printed reports
US Census Bureau httpwwwcensusgov
URL Reference 6
Federal Assistance Award Data System for Federal State and Local Governments
(FAADS)
DRAFT ANNUAL UPDATE February 2010 - 26 -
After the close of each quarter of the Federal fiscal year the Census Bureaulsquos Federal Assistance
Award Data System (FAADS) produces a file of standardized data records on all types of
financial assistance awards made by Federal agencies to all types of recipients during the
indicated quarter Each Federal fiscal year begins on October 1 of one calendar year and ends on
September 30 of the year indicated
Each transaction record identifies by the Catalog of Federal Domestic Assistance (CFDA)
program code number and name the type and amount of financial assistance the type and
location of the recipient and the geographic place of performance The recipient name and other
selected data fields are blank in county-are summary records
The recipient location and place of performance are identified by name and by the geographic
code for the stateterritory county area andor place The Federal agency that made each award
is identified by code and by name Programs not listed in the Catalog are identified by a
similarly constructed pseudocode Each record also contains information on the date of the
transaction as well as the scheduled start date and end date of the project or the award
Federal Assistance Award Data System httpwwwcensusgovgovswwwfaadshtml
URL Reference 7
The Bureau of Economic Analysis (BEA) is another agency of the Department of Commerce
Along with the Census Bureau BEA is part of the Departments Economics and Statistics
Administration BEA promotes a better understanding of the US economy by providing the
most timely relevant and accurate economic accounts data in an objective and cost-effective
manner
BEA produces economic accounts statistics that enable government and business decision-
makers researchers and the American public to follow and understand the performance of the
DRAFT ANNUAL UPDATE February 2010 - 27 -
Nations economy To do this BEA collects source data conducts research and analysis
develops and implements estimation methodologies and disseminates statistics to the public
BEA produces some of the most closely watched economic statistics that influence the decisions
made by government officials business people households and individuals BEAs economic
statistics which provide a comprehensive up-to-date picture of the US economy are key
ingredients in critical decisions affecting monetary policy tax and budget projections and
business investment plans The cornerstone of BEAs statistics is the national income and
product accounts (NIPAs) which feature the estimates of gross domestic product (GDP) and
related measures
Today BEA prepares national regional industry and international accounts that present
essential information on such key issues as economic growth regional economic development
inter-industry relationships and the Nations position in the world economy
Bureau of Economic Analysis httpbeagov
URL Reference 8
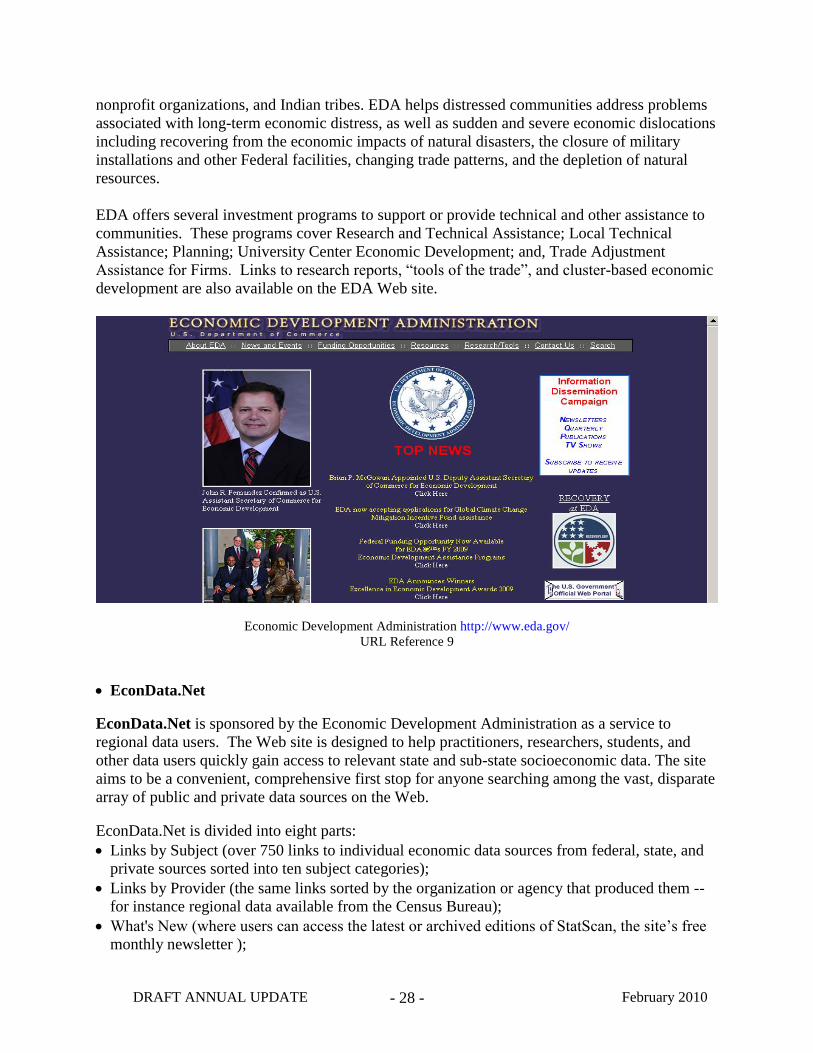
US Department of CommerceEconomic Development Administration
The Economic Development Administration (EDA) was established under the Public Works
and Economic Development Act of 1965 (42 USC sect 3121) as amended to generate jobs help
retain existing jobs and stimulate industrial and commercial growth in economically distressed
areas of the United States EDA assistance is available to rural and urban areas of the Nation
experiencing high unemployment low income or other severe economic distress
In fulfilling its mission EDA is guided by the basic principle that distressed communities must
be empowered to develop and implement their own economic development and revitalization
strategies Based on these locally and regionally-developed priorities EDA works in partnership
with state and local governments regional economic development districts public and private
DRAFT ANNUAL UPDATE February 2010 - 28 -
nonprofit organizations and Indian tribes EDA helps distressed communities address problems
associated with long-term economic distress as well as sudden and severe economic dislocations
including recovering from the economic impacts of natural disasters the closure of military
installations and other Federal facilities changing trade patterns and the depletion of natural
resources
EDA offers several investment programs to support or provide technical and other assistance to
communities These programs cover Research and Technical Assistance Local Technical
Assistance Planning University Center Economic Development and Trade Adjustment
Assistance for Firms Links to research reports ―tools of the trade and cluster-based economic
development are also available on the EDA Web site
Economic Development Administration httpwwwedagov
URL Reference 9
EconDataNet
EconDataNet is sponsored by the Economic Development Administration as a service to
regional data users The Web site is designed to help practitioners researchers students and
other data users quickly gain access to relevant state and sub-state socioeconomic data The site
aims to be a convenient comprehensive first stop for anyone searching among the vast disparate
array of public and private data sources on the Web
EconDataNet is divided into eight parts
Links by Subject (over 750 links to individual economic data sources from federal state and
private sources sorted into ten subject categories)
Links by Provider (the same links sorted by the organization or agency that produced them --
for instance regional data available from the Census Bureau)
Whats New (where users can access the latest or archived editions of StatScan the sitelsquos free
monthly newsletter )
DRAFT ANNUAL UPDATE February 2010 - 29 -
Ten Best Sites (EconDataNetlsquos selection of user-friendly sites that offer the widest selection
of data including several that generate customized tables and graphs)
Data Collections (150 Web sites that provide multiple data series usually from a variety of
sources including on-line data collections on-line versions of statistical compendia --like the
US Statistical Abstract data search engines micro-data tools and GIS mapping resources
also includes data collection links to local data intermediaries ndash such as the Census Data
Centers and university business and economic research centers -- that can help users obtain
understand and analyze data for your area)
Quick Links (EconDataNetlsquos ―links by subject without annotation on one condensed quick-
loading page which allow users who know what they want to get there quickly or gain a fast
sense of available data sources across categories)
Registration (allows EconDataNet users access to StatScan which profiles a site of the
month new additions to EconDataNet and other relevant data news and
EconDataNetlsquos Users Guide (a free 100-page Complete Dummies guide to finding and
using economic data to understand your regional economy)
EconDataNet httpwwwEconDataNet
URL Reference 11
TradeStats Express
TradeStats Express displays in maps graphs and tables the annual US merchandise trade
statistics (exports imports and trade balances) at the national and state levels It is divided into
two main sections National Trade Data and State Export Data
The National Trade Data are available as full year totals and Year-To-Current-Quarter for recent
years Data are available for individual countries tradeeconomic groups or geographic regions
You can tabulate these statistics using any of three product classification systems Harmonized
Commodity Coding System (HS) North American Industry Classification System (NAICS) or
Standard International trade Classification (SITC) You can choose to display the data for
exports imports or balance of trade
DRAFT ANNUAL UPDATE February 2010 - 30 -
The National Trade Data section offers two options
Global patterns of US merchandise trade
Product profiles of US merchandise trade with a selected market
The State Export Data are available as full year totals and Year-To-Current-Quarter for recent
years Data are available for individual states or US regions Products are classified in industry
groups corresponding to NAICS two-digit codes
The State Export Data section offers three options
Global patterns of a States exports
State-by-State exports to a selected market
Export product profile to a selected market
TradeStats Express httptseexportgov
URL Reference 12
US Patent and Trademark Office
US Patent and Trademark Office a database that includes information about all US patents
(including utility design reissue plant patents and SIR documents) from the first patent issued
1790 to the most recent issue week Patents from 1790 through 1975 are searchable only by
Issue Date Patent Number and Current US Classification while patents issued after 1976 are in
a separate database allowing a narrower more focused search Patents are divided into many
fields such as inventor name inventor city state or country and description or specification and
searches may include a date range The results of a search provide the abstract and the full
description of the invention
DRAFT ANNUAL UPDATE February 2010 - 31 -
U S Patents and Trademarks httpwwwusptogovpatftindexhtml
URL Reference 10
US Department of Defense
Defense Manpower Data Center (DMDC)Statistical Information Analysis Division
The Defense Manpower Data CenterStatistical Information Analysis Division maintains the
largest archive of personnel manpower and training data in the Department of Defense
DMDCs statistical activities include the personnel survey program an enlistment testing
program to support screening of military applicants and a client support program to provide
statistical support to the Office of the Secretary of Defense
DRAFT ANNUAL UPDATE February 2010 - 32 -
DoD Personnel and Procurement Statistics httpsiadappdmdcosdmilindexhtml
URL Reference 13
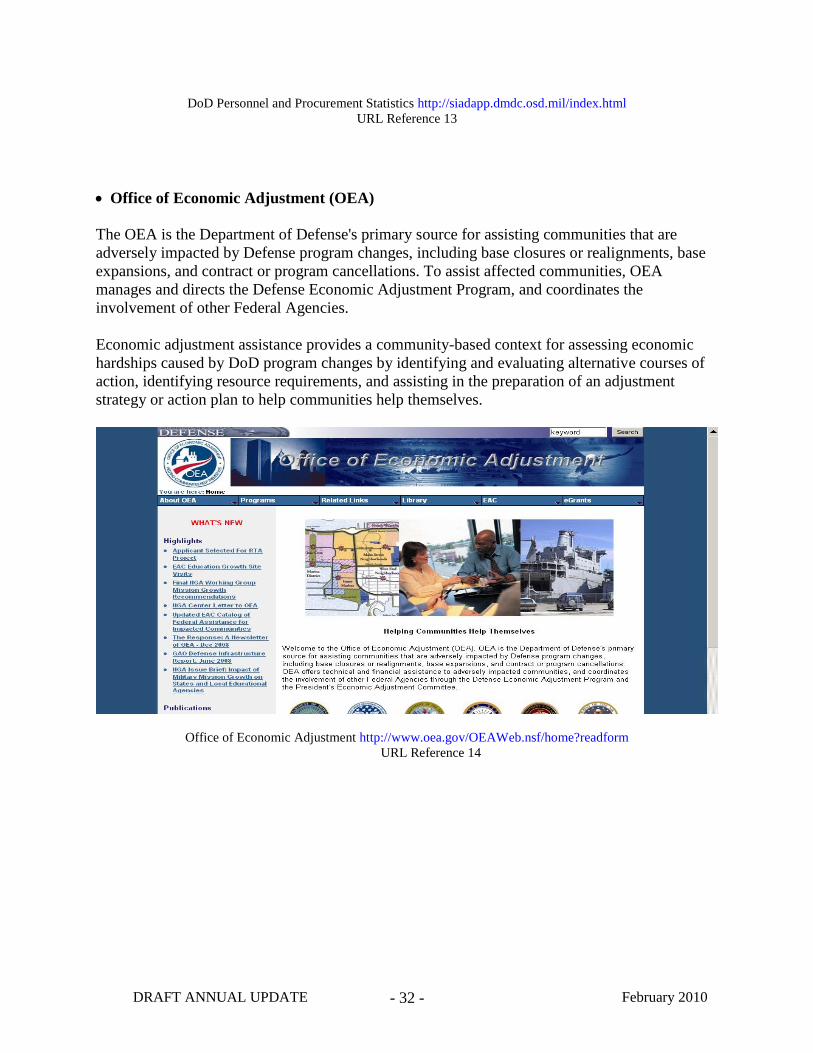
Office of Economic Adjustment (OEA)
The OEA is the Department of Defenses primary source for assisting communities that are
adversely impacted by Defense program changes including base closures or realignments base
expansions and contract or program cancellations To assist affected communities OEA
manages and directs the Defense Economic Adjustment Program and coordinates the
involvement of other Federal Agencies
Economic adjustment assistance provides a community-based context for assessing economic
hardships caused by DoD program changes by identifying and evaluating alternative courses of
action identifying resource requirements and assisting in the preparation of an adjustment
strategy or action plan to help communities help themselves
Office of Economic Adjustment httpwwwoeagovOEAWebnsfhomereadform
URL Reference 14
DRAFT ANNUAL UPDATE February 2010 - 33 -
US Small Business Administration
Targeted Users
Survey Name
Sm
all
Bu
sin
ess
Eco
no
mic
Ind
icat
ors
Ch
arac
teri
stic
s o
f
Sm
all
Bu
sin
ess
Ow
ner
s an
d
Em
plo
yer
s
Fir
m S
ize
Dat
a b
y
Lo
cati
on
and
Ind
ust
ry
Employers
Government Agency
Federal State or Local
Elected Officials and Policymakers
Program Planners
Education and Training Providers
Intermediaries
Individuals
Researchers
DRAFT ANNUAL UPDATE February 2010 - 34 -
US Small Business Administration
Indicators
Survey Name
Sm
all
Bu
sin
ess
Eco
no
mic
Ind
icat
ors
Ch
arac
teri
stic
s o
f
Sm
all
Bu
sin
ess
Ow
ner
s an
d
Em
plo
yer
s
Fir
m S
ize
Dat
a b
y
Lo
cati
on
and
Ind
ust
ry
Hours WorkedPayroll Hours
Earnings Trends
Unemployment Records ndash
Mass Layoffs
Labor Force Data
Labor Market Information
Employment
Wages Income Earnings
Future Demand and Hiring Trends
EducationTraining Information about
Providers and Career Advancement
Occupational Information
Skill Requirements
Program Participation
Information about Full- and Part-Time
Workers Contract Workers and the
Self-Employed
Unions
Information about Employers by
Company Size or Characteristics
Membership or Subscription Required
RecruitingStaffing Industry
Information
Occupational Licensing Information
Benefit Information
Information about Workforce
Commuting Patterns
DRAFT ANNUAL UPDATE February 2010 - 35 -
US Small Business Administration
The SBA is charged with aiding counseling assisting and protecting the interests of small
business which represent 99 percent of all businesses in the US The SBAlsquos Office of
Economic Research within the Office of Advocacy (wwwsbagovadvo) is the federal
governmentlsquos lead office in analyzing the role and status of small businesses in the economy
This office is the source for small business statistics gathered from various federal sources and
presented in user-friendly formats Internal staff or contractors conduct research to help
determine small businesseslsquo impact on the economy and how they are currently faring The
Office of Economic Research is the leading source of small business data portraying the
characteristics of businesses owners and their workforces Significant surveys and reports
related to the workforce include the following
Small Business Economic Indicators These serve as a quick reference guide to current data on small business activity (new firms
employment income and failures) by state Tables listing indicators for about the last 10 years
by state are included
Characteristics of Small Business Owners and Employees These analyze the demographic characteristics of employees and owners of small businesses
Employee and self-employment data cover the period 1992 to 1996 while the owner data cover
1992
Firm Size Data by Location and Industry Includes the number of employer firms number of establishments employment annual payroll
and receipts The data are presented by location (US state and Metropolitan Statistical Area
(MSA)) and industry by size of firm
Small Business Administration httpwwwsbagovadvoresearch
URL Reference 15
DRAFT ANNUAL UPDATE February 2010 - 36 -
US Department of Agriculture Economic Research Service
The Economic Research Service (ERS) is a primary source of economic information and
research in the US Department of Agriculture With 450 employees ERS conducts a research
program to inform public and private decision making on economic and policy issues involving
food farming natural resources and rural development
ERSs highly trained economists and social scientists conduct research analyze food and
commodity markets produce policy studies and develop economic and statistical indicators The
agencylsquos research program is aimed at the information needs of USDA other public policy
officials and the research community ERS information and analysis is also used by the media
trade associations public interest groups and the general public
The Agencys work is structured among four divisions Food Economics Information Services
Market and Trade Economics and Resource and Rural Economics
ERS staff disseminates economic information and research results through an array of outlets
including
Agency-published research reports market analysis and outlook reports economic briefs and
data products (accessible on the Internet with hard copies available for purchase)
An award-winning magazine Amber Waves covering the entire range of ERS work and
available in print and on the Internet (httpwwwersusdagovAmberWavesAbout)
ERS website which provides access to all ERS products and links users directly with ERS
analysts
Oral briefings written staff analyses and congressionally mandated studies delivered directly
to executive and legislative branch policymakers and program administrators and
Articles in professional journals and papers presented to academic colleagues at conferences
and meetings
DRAFT ANNUAL UPDATE February 2010 - 37 -
USDA Economic Research Service httpwwwersusdagovData
URL Reference 16
DRAFT ANNUAL UPDATE February 2010 - 38 -
US Department of Education National Center for Education Statistics
US Department of Education National Center for Education Statistics
Targeted Users Survey Name
Nat
ion
al A
sses
smen
t
of
Ed
uca
tio
nal
Pro
gre
ss
Nat
ion
al A
sses
smen
t
of
Ad
ult
Lit
erac
y
Inte
gra
ted
Po
st-
Sec
on
dar
y E
du
cati
on
Dat
a S
yst
em
Nat
ion
al H
ou
seh
old
Ed
uca
tio
n S
urv
eys
Pro
gra
m
Dat
a o
n V
oca
tio
nal
Ed
uca
tio
n
(No
t a
Su
rvey
)
Employers
Government Agency
Federal State or Local
Elected Officials and Policymakers
Program Planners
Education and Training Providers
Intermediaries
Individuals
Researchers
DRAFT ANNUAL UPDATE February 2010 - 39 -
US Department of Education National Center for Education Statistics
Indicators
Survey Name
Nat
ion
al A
sses
smen
t
of
Ed
uca
tio
nal
Pro
gre
ss
Nat
ion
al A
sses
smen
t
of
Ad
ult
Lit
erac
y
Inte
gra
ted
Po
st-
Sec
on
dar
y E
du
cati
on
Dat
a S
yst
em
Nat
ion
al H
ou
seh
old
Ed
uca
tio
n S
urv
eys
Pro
gra
m
Dat
a o
n V
oca
tio
nal
Ed
uca
tio
n
(No
t a
Su
rvey
)
Hours WorkedPayroll Hours
Earnings Trends
Unemployment Records ndash
Mass Layoffs
Labor Force Data
Labor Market Information
Employment
Wages Income Earnings
Future Demand and Hiring Trends
EducationTraining Information about
Providers and Career Advancement
Occupational Information
Skill Requirements
Program Participation
Information about Full- and Part-Time
Workers Contract Workers and the
Self-Employed
Unions
Information about Employers by
Company Size or Characteristics
Membership or Subscription Required
RecruitingStaffing Industry
Information
Occupational Licensing Information
Benefit Information
Information about Workforce
Commuting Patterns
DRAFT ANNUAL UPDATE February 2010 - 40 -
The National Center for Education Statistics (NCES) is the primary federal entity for collecting
and analyzing data related to education in the US and other nations NCES is located within the
US Department of Education and the Institute of Education Sciences The NCES fulfills a
congressional mandate to collect collate analyze and report complete statistics on the condition
of American education conduct and publish reports and review and report on education
activities internationally
Education statistics are used for a number of purposes including by business and education and
training institutions concerned with the supply of trained workers coming out of schools and
colleges and also with the subjects that are being taught there NCES statistics are used to
inform the public about matters such as school and college enrollment and expenditures per
student Business organizations use trend data on enrollments and expenditures to forecast the
demand for their products Businesses increasingly dependent on the availability of a highly
skilled workforce use educational data to gauge availability quality and characteristics of the
emerging workforce Achievement test scores numbers of students enrolled in various programs
of study and degrees and credentials awarded are important indicators to be considered in
business location and expansion decisions The economic fortunes of states and regions are
increasingly driven by test scores and the characteristics of human capital investments
Key surveys databases and studies bearing most directly on describing the present and future
workforce include the following
The National Assessment of Educational Progress (NAEP)
Also known as ―the Nationlsquos Report Card this is the only nationally representative and
continuing assessment of what Americalsquos students know and can do in various subject areas
Since 1969 assessments have been conducted periodically in reading mathematics science
writing US history civics geography and the arts
NAEP does not provide scores for individual students or schools instead it offers results
regarding subject-matter achievement instructional experiences and school environment for
populations of students (eg fourth-graders) and subgroups of those populations (eg female
students Hispanic students) NAEP results are based on a sample of student populations of
interest NAEP reports information for the nation and specific geographic regions of the country
It includes students drawn from both public and non-public schools and reports results for
student achievement at grades 4 8 and 12 Since 1990 NAEP assessments have also been
conducted on the state level
NAEP long-term trend assessments are designed to give information on the changes in the basic
achievement of Americalsquos youth They are administered nationally and report student
performance at ages 9 13 and 17 in mathematics science and reading and grades 4 8 and 11
in writing In addition to the assessments NAEP coordinates a number of special educational
studies related to assessment Ongoing projects include the High School Transcript Study and a
Technology-Based Assessment project designed to explore the use of technology
DRAFT ANNUAL UPDATE February 2010 - 41 -
The National Assessment of Adult Literacy (NAAL)
This initiative provides a nationally representative and continuing assessment of English
language literacy skills of American adults NAAL seeks to describe the status of adult literacy
in the US report on national trends and identify relationships between literacy and selected
characteristics of adults NCES has conducted adult literacy assessments since 1985 A
nationally representative sample of adults was assessed again in 2002 providing an indication of
the nationlsquos progress in adult literacy since 1992
The NAAL describes the status of literacy in the nation and is intended to inform policymakers
and educators about the factors believed to play critical roles in the development of adult literacy
abilities and the use of literacy skills in workplace family and community settings Knowledge
about the roles relationships and impacts of such factors is used to improve educational
practices and programs
The NAAL is an in-person household survey that includes an assessment of English-language
literacy skills and a computer-assisted personal interview to collect background information
The literacy assessment measures the ability to use printed or written materials to perform prose
document or quantitative tasks that simulate real-life experiences The background
questionnaire identifies key population subgroups (ie by age gender race and ethnic group
and language minority) and addresses issues related to disabilities health English as a second
language education employment and other literacy-related activities
Data from the NAAL 2002 provide accurate estimates of the current distribution of literacy
abilities for the nation at large and will help policymakers target resources to address literacy-
related issues Moreover by comparing results from 2002 to those from 1992 the NAAL will
provide the first indicators in a decade
The Integrated Post-Secondary Education Data System (IPEDS)
IPEDS established the core post-secondary education data collection program It is viewable at
httpncesedgovipeds It is a single comprehensive system that encompasses all identified
institutions whose primary purpose is to provide post-secondary education Post-secondary
education is defined within IPEDS as the provision of formal instructional programs whose
curriculum is designed primarily for students who have completed the requirements for a high
school diploma or its equivalent This includes academic vocational and continuing
professional education programs and excludes a vocational and adult basic education programs
The following types of institutions are included within IPEDS baccalaureate or higher degree
granting institutions two-year award institutions and less-than-two-year institutions (ie
institutions whose awards usually result in terminal occupational awards or are creditable toward
a formal two-year or higher award) Each of these three categories is further disaggregated by
control (public private non-profit and private for-profit) resulting in nine institutional
categories or sectors
Participating in IPEDS has been required for all Title IV participating post-secondary institutions
since 1992 Complementing IPEDS are special studies of student financial aid post-secondary
faculty doctoral degree recipients transcript studies and various longitudinal studies The
NCES survey program at the post-secondary education level provides statistical information used
DRAFT ANNUAL UPDATE February 2010 - 42 -
by planners policymakers and educators in addressing a multitude of issues including workforce
development
The National Household Education Surveys (NHES)
These surveys are a data collection system of the NCES that is designed to address a wide range
of education-related issues It provides descriptive data on the educational activities of the US
population and offers policymakers researchers and educators a variety of statistics on the
condition of education in the US Data are collected through household surveys with either
sampled adults (for the adult education surveys) or the parents most knowledgeable about the
sample children (for surveys about preschool children and students in elementary and secondary
school) NHES collections have been conducted in the springs of 1991 1993 1995 1996 1999
2001 and 2003 The Adult Education for Work-Related Reasons Survey was fielded as part of
the NHES in 2003 There is also considerable information about work-related training contained
in the Adult Education and Lifelong Learning Surveys The adult education surveys ask about
participation in a wide variety of educational activities and collect information about the subject
duration cost and sponsorship of each activity
The NHES was conducted in 2003 and will be conducted periodically thereafter The NHES
2005 will include three surveys Adult Education and Lifelong Learning Early Childhood
Program Participation and Before- and After-School Programs and Activities
Apart from the adult education surveys and the surveys on the topics planned for 2005 surveys
about school readiness parent and family involvement in education civic involvement school
safety and discipline and household use of public libraries have been fielded as part of NHES
The primary purpose of the NHES is to conduct repeated measurements of the same phenomena
at different points in time to facilitate trend analysis However one-time surveys on topics of
interest to the Department of Education have also been fielded
The NCES Data on Vocational Education (DOVE)
The DOVE system derives data about vocational education primarily from existing NCES
surveys Some of the most informative data in the DOVE system are drawn from high-school
student transcript data In comparison to reports from states that identify vocational education
students using different definitions high-school transcripts indicate how many vocational
education credits students earn These data allow researchers to identify students who take
different amounts and types of vocational education courses and to examine the relationship
between academic and vocational course taking This method of obtaining data provides a more
accurate and complete picture of participation in vocational education than can be obtained by
any other means
The DOVE system also uses data from NCESlsquos longitudinal studies to examine the economic
outcomes associated with participation in vocational education DOVE is supplemented with
data from other federal sources including the BLS (the National Longitudinal Survey of Youth)
and the Census Bureau (SIPP and CPS)
The primary use of the DOVE system is to report on the status of vocational education NCES
has published several reports on vocational education topics including student participation
DRAFT ANNUAL UPDATE February 2010 - 43 -
staff characteristics and international comparisons of vocational education systems The current
National Assessment of Vocational Education is using student transcript data collected between
1982 and 1998 to examine changes in the nature of the vocational and academic curricula that
students pursue
US Department of Education National Center for Education Statistics httpncesedgov
URL Reference 17
US Department of Transportation Bureau of Transportation Statistics
Omnibus Surveys
The Omnibus Surveys are a convenient way to get very quick input on transportation issues to
see who uses what how they use it and how users view it and what they think about it and to
gauge public satisfaction with the transportation system and government programs The series of
surveys include a monthly household survey which collects data on core questions as well as
targeted surveys to address special transportation issues
The monthly surveys are a cost-shared resource of the department providing rapid data at a
reasonable cost The BTS has in-house technical expertise to help in survey design and analysis
DOT operating administrations or offices can purchase questions to address specific issues with
very short lead times (typically a couple weeks) They can also use the Omnibus for more
extensive targeted surveys aimed at households or establishments with certain characteristics
BTS provides technical support to help develop reliable questions and releases data within one
week after data collection is completed
DRAFT ANNUAL UPDATE February 2010 - 44 -
Bureau of Transportation Statistics httpwwwbtsgovprogramsomnibus_surveys
URL Reference 18
TranStats Intermodal Transportation Database
TranStats a Bureau of Transportation Statistics (BTS) research tool provides access to more
than 100 transportation-related databases across every mode of transportation - with many social
and demographic data sets that are commonly used in transportation analysis Essentially this is
a list of outside agency sources that collect data used by transportation analysts
National Transportation Library httpntlbtsgovindexhtml
URL Reference 19
DRAFT ANNUAL UPDATE February 2010 - 45 -
U S Department of the Interior
The Mission of the Department of the Interior is to protect and provide access to our Nations
natural and cultural heritage and honor the trust responsibilities to Indian Tribes and
commitments to island communities Interior has established five Departmental goals that
encompass the major responsibilities of the Department These goals provide a framework for
their strategic plans of Interiors bureaus
The Departmental goals are as follows Resource Protection (protect the Nations natural
cultural and heritage resources) Resource Use Recreation Serving Communities and Management Excellence
Depending on the workforce and economic development strategic plannerlsquos geographic location
DOI information may be of use to regional economic development projects that include energy
industry growth water roads land use and land development projects transportation projects
and responding to natural disasters
US Department of Interior httpinteriorgov
URL Reference 20
US Geological Survey
The US Geological Survey and its Web site (wwwgeodatagov) provides links to a wide
variety of mapping data resources and links to reports and databases like data resources for real
estate and business geography analysis that provides a portal to geospatial information related to
business geographic interests
DRAFT ANNUAL UPDATE February 2010 - 46 -
US Maps amp Data wwwgeodatagov
URL Reference 21
US Department of EnergyEnergy Information Administration
Energy Statistics
The Energy Information Administration (EIA) collects and disseminates information on
energy reserves production consumption distribution prices technology and related
international economic and financial matters EIAs programs include data on coal petroleum
natural gas and electric and nuclear energy EIA maintains a comprehensive energy database
disseminates energy data and analyses for a wide variety of customers in the public and private
sectors maintains the National Energy Modeling System for mid-term energy markets analysis
and forecasting maintains the Short-Term Integrated Forecasting System for near-term energy
market analysis and forecasting conducts customer forums and surveys to maintain an up-to-
date product and service mix and maintains systems supporting the electronic dissemination of
energy data
DRAFT ANNUAL UPDATE February 2010 - 47 -
Energy Information Administration httpwwweiadoegov
URL Reference 22
US Department of Veterans Affairs
Office of PolicyVeteran Data and Information
Veteran Data and Information available through the Office of Policy includes actuarial studies
veteran population estimates and projections veteran socioeconomic characteristics VA benefit
program user and non-user surveys and VA program evaluations
Veterans Data and Information httpwww1vagovvetdata
URL Reference 23
DRAFT ANNUAL UPDATE February 2010 - 48 -
Veterans Benefits Administration (VBA)
The Veterans Benefits Administration supports continuing and new surveys of veterans and
beneficiaries who receive VBA benefits and use its services The surveys cover VA
compensation and pension education loan guaranty vocational rehabilitation and employment
services and insurance programs
Veterans Benefits Administration httpwwwvbavagovVBA
URL Reference 24
The Interagency Council on Statistical Policy
FedStats FedStats available to the public since 1997 provides access to the full range of official statistical
information produced by the Federal government without having to know in advance which
Federal agency produces which particular statistic With convenient searching and linking
capabilities to more than 100 agencies that provide data and trend information on such topics as
economic and population trends crime education health care aviation safety energy use farm
production and more FedStats is your one location for access to the full breadth of Federal
statistical information The site -- FedStats (wwwfedstatsgov) -- uses the Internets powerful
link and search capabilities to navigate publicly available statistics from over 70 Federal
agencies
As part of the Administrations efforts to achieve improved customer service and greater
efficiency throughout the Federal government FedStats reduces the amount of time and effort
necessary to locate data The site the product of a multi-agency development effort led by the
Interagency Council on Statistical Policy followed the introduction of the widely acclaimed
Federal Statistics Briefing Rooms which offer on-line access to high-profile Federal economic
and social statistics
DRAFT ANNUAL UPDATE February 2010 - 49 -
FedStats major features include
An A to Z index that provides direct access to detailed data listings in 275
categories
A keyword search capability that enables users to search Web sites linked to
FedStats
Fast Facts links which allow users to visit either the Federal Statistics Briefing
Rooms or an on-line version of the most frequently requested tables from the
Statistical Abstract of the United States
An Agencies heading that allows users to link to the Web sites of Federal
statistical agencies or select from a menu of predetermined key words for those
agencies
A Programs heading that offers 14 groups of agency data program summaries in
areas ranging from agriculture to transportation
A Regional Statistics heading that offers data that is broken down into geographic
areas -- frequently at State or county levels and
Links to agency contacts press releases and government statistical agencies outside
the United States
An on-line form permits users to comment on the site and make suggestions
FedStats httpwwwfedstatsgov
URL Reference 25
National Science Foundation
Science Resource Statistics
The Science Resource Statistics (SRS) division of the National Science Foundation conducts
surveys that measure the number and demographic characteristics of individuals trained as or
working as scientists and engineers and participates in international collaborations to yield
comparable measures of the same items In addition other components of NSF provide funding
in support of biological sciences research databases and social science research and studies such
as the Panel Study of Income Dynamics the General Social Survey and the National Election
DRAFT ANNUAL UPDATE February 2010 - 50 -
Studies NSF also collects publishes and analyzes data on the size and health of US research
and development enterprises Four annual surveys provide information on research and
development funded and performed by government industry and universities and a periodic
survey provides comparable information on the nonprofit sector
The division also conducts a biennial survey on academic and biomedical research facilities
including aspects of cyber-infrastructure and has begun design work on an information
collection on instrumentation in science and engineering facilities Science Resource Statistics
staff participates in international collaborations to develop internationally comparable measures
of research and development and collects publishes and analyzes statistics on the nations
science and engineering higher education system and those who participate in it SRS measures
science and engineering and health enrollments and degrees and develops information on other
aspects of higher education
Science and Engineering Statistics httpwwwnsfgovstatistics
URL Reference 26
DRAFT ANNUAL UPDATE February 2010 - 51 -
Private Sources Generating Workforce Information
Private Sources Generating Workforce Information
Targeted Users
Source
ER
ISS
T
he
Wo
rkfo
rce
Inte
llig
ence
Co
mp
any
Man
po
wer
In
c
Ch
alle
ng
er
Gra
y a
nd
Ch
rist
mas
Nat
ion
al A
sso
ciat
ion
of
Co
lleg
es a
nd
Em
plo
yer
s
Th
e A
mer
ican
Sta
ffin
g
Ass
oci
atio
n
Am
eric
an M
anag
emen
t
Ass
oci
atio
n
Eco
no
my
co
m
Inte
rbiz
net
Un
iver
sity
of
Mic
hig
an
Pan
el S
tud
y o
f In
com
e
Dy
nam
ics
Ru
tger
s U
niv
ersi
tyJ
oh
n
J H
eld
rich
Cen
ter
for
Wo
rkfo
rce
Dev
elo
pm
ent
Employers
Government Agency
Federal State or Local
Elected Officials and Policymakers
Program Planners
Education and Training Providers
Intermediaries
Individuals
Researchers
DRAFT ANNUAL UPDATE February 2010 - 52 -
Private Sources Generating Workforce Information
Indicators
Source
ER
ISS
T
he
Wo
rkfo
rce
Inte
llig
ence
Co
mp
any
Man
po
wer
In
c
Ch
alle
ng
er
Gra
y a
nd
Ch
rist
mas
Nat
ion
al A
sso
ciat
ion
of
Co
lleg
es a
nd
Em
plo
yer
s
Th
e A
mer
ican
Sta
ffin
g
Ass
oci
atio
n
Am
eric
an M
anag
emen
t
Ass
oci
atio
n
Eco
no
my
co
m
Inte
rbiz
net
Un
iver
sity
of
Mic
hig
anP
anel
Stu
dy
of
Inco
me
Dy
nam
ics
Ru
tger
s U
niv
ersi
tyJ
oh
n
J H
eld
rich
Cen
ter
for
Wo
rkfo
rce
Dev
elo
pm
ent
Hours WorkedPayroll Hours
Earnings Trends
Unemployment Records ndash
Mass Layoffs
Labor Force Data
Labor Market Information
Employment
Wages Income Earnings
Future Demand and Hiring Trends
EducationTraining Information about
Providers and Career Advancement
Occupational Information
Skill Requirements
Program Participation
Information about Full- and Part-Time
Workers Contract Workers and the
Self-Employed
Unions
Information about Employers by
Company Size or Characteristics
Membership or Subscription Required
RecruitingStaffing Industry
Information
Occupational Licensing Information
Benefit Information
Information about Workforce
Commuting Patterns
DRAFT ANNUAL UPDATE February 2010 - 53 -
The strategic importance of human capital in economic development and business performance
has prompted an intensified focus on workforce information In addition to the traditional
government sources a growing number of private firms non-profit organizations trade
associations and universities have also become more involved in monitoring labor market and
workforce developments
This catalogue identifies a number of organizations that collect and disseminate
workforce and labor market information The inclusion of private-sector businesses and
com Web sites in this catalogue is for informational purposes only No endorsement is
implied or conferred on a company or on a specific products or service Readers and
information users should exercise an appropriate level of care and should be aware that
the private-sector products andor services may be copyrighted and may require a fee for
service or a cost to access or use information products This Catalogue is not intended to
be an exhaustive list of private sector Web sites and we reserve the right to modify the
list on an ongoing basis
ERISS The Workforce Intelligence Company ERISS is a leading information solutions provider since 1992 specializing in business
intelligence collection technologies and methodologies The companylsquos experience includes
more than 150 workforce survey projects involving more than 2 million employers across the
United States ERISS has two primary divisions (1) The National Center for Business amp
Economic Research (NCBER) and (2) USWorks NCBER was formed in 2002 to serve the
needs of business and economic development in the United States and Canada It delivers
primary business intelligence and current trend information in support of economic growth and
competitiveness USWorks was formed in 1998 to provide the public workforce sector with
information and applications for the purpose of job placement and employer services It is a
source for workforce performance and local workforce intelligence
ERISS The Workforce Intelligence Company - httpwwwerisscom
URL Reference 27
Manpower Inc Manpower is one of the leaders in the staffing industry providing workforce management
services to customers through 4400 offices in 73 countries Manpower frequently conducts
research studies to provide its customers with additional insight into the trends that are affecting
the labor market Manpowerlsquos quarterly employment forecasts are often quoted in the local
media as a key economic indicator of firmslsquo employment plans and job seeker hiring prospects
for states and regions where they are conducted
Manpower conducts the Employment Outlook Survey in the US on a quarterly basis It is a
measurement of employerslsquo intentions to increase or decrease the permanent workforce and
during its 26-year history has been a significant indicator of employment trends The survey is
based on telephone interviews with nearly 16000 public and private employers in 470 US
markets Survey results and analysis are posted on Manpowerlsquos website and are readily
DRAFT ANNUAL UPDATE February 2010 - 54 -
accessible at no cost to users Forecasts for national regional state and some local labor
markets are available
Manpower Inc - httpwwwmanpowercom
URL Reference 28
Challenger Gray and Christmas Challenger Gray and Christmas is a consulting organization providing out-placement services by
working with individuals sponsored by their former employers The firm has offices in 47 cities
throughout the US and works with clients in over 63 locations in Canada The firm focuses on
out-placement programs for executives middle managers and long-term employees It offers
modified individual and group programs and assists relocating spouses Challenger differentiates
itself from competitors by reporting that its clients find new jobs in a median time of 32 months
(compared with about 5 months which is cited by The Wall Street Journal as the average search
length)
As part of its out-placement business Challenger has monitored job cuts since 1989 Using
announcements made by firms Challenger tabulates data of job cuts contained in these
announcements The firm and its spokesman are frequently called on by the national media to
analyze labor market development and worker dislocation The firm tracks layoff
announcements by detailed industry sector and geographic region Regular updated reports are
provided as part of the organizationlsquos monitoring workforce and labor market developments
These reports are used in investment and human resource planning decisions of private firms
Users who want to access this information are required to pay access and subscription fees
Challenger Gray and Christmas - httpwwwchallengergraycom
URL Reference 29
National Association of Colleges and Employers (NACE) NACE is a trade association representing college career planning and placement centers NACE
provides research and information through ongoing employer and college surveys quarterly
surveys of starting salary offers to new college graduates a quarterly journal and a bi-weekly
newsletter NACE also prepares an annual forecast of hiring trends tracks legal issues related to
the employment process and provides benchmark data on best practices Among its best-known
publications are Job Choices a career planning and job-search tool distributed to more than one
million college students and alumni
Human resources and compensation specialists across the country examine current starting salary
offers to college graduates through NACElsquos Salary Survey a guide for setting competitive
salaries at the critical entry level Salary Survey also gives career services officers current data
on beginning offers which they can share with students to prepare them for entering the working
world Winter spring summer and fall editions of Salary Survey reports are issued in February
April July and September respectively Each report provides national starting salary offers by
discipline degree level job function industry group and provides the average offer as well as
ranges Salary Survey covers more than 70 major fields of study more than 50 employer
DRAFT ANNUAL UPDATE February 2010 - 55 -
categories and more than 70 job functions for the bachelorlsquos-degree level In addition Salary
Survey provides starting salary information for 57 masterlsquos and 22 doctoral fields of study
National Association of Colleges and Employers httpwwwnaceweborg
URL Reference 30
Economycom Economycom is a provider of economic financial and industry research designed to meet the
planning and information needs of businesses governments and professional investors
Economycom research supports country analysis and financial industrial and regional markets
Economycomlsquos information and services are used in a variety of ways including strategic
planning product and sales forecasting risk and sensitivity management and as investment
research
Economycomlsquos US State and Metropolitan Detailed Employment amp Output Forecast Database
offers detailed payroll employment forecasts and industrial output forecasts for 50 states and
over 300 metropolitan areas (County detailed employment for over 3100 counties is offered as
a separate product from state and metropolitan area employment) The state and metropolitan
forecast includes 21 2-digit NAICS categories 89 3-digit NAICS categories and 284 4-digit
NAICS categories and offers complete coverage of government military personnel and farm
employment One-digit NAICS super sectors manufacturing aggregates and totals are also
included Series history begins in 1970 and extends to 10 years of forecast for metropolitan
areas and 30 years for states History and forecasts are updated monthly Data are available only
to customers and subscribers Many states subscribe to Economycom services and data access
in support of econometric forecasting models used to forecast state revenues
Economycom - httpwwweconomycom
URL Reference 31
DRAFT ANNUAL UPDATE February 2010 - 56 -
Interbiznet
Interbiznet is a web-based firm that tracks researches and reports on the electronic recruiting
industry chronicling and facilitating its development Interbiznet believes that the single most
profound impact of the web will be on how we work get work and change work Interbiznet
functions as an analyst of the electronic recruiting industry The firm provides a daily
newsletter the Electronic Recruiting News and conducts an annual industry analysis
Interbiznet produces and maintains The Electronic Recruiting Index The index covers the
trends events and players shaping the future of the recruiting industry and builds upon the
results covered in the indexes of previous years The Electronic Recruiting Index is a source of
information for investors vendors corporate recruiters and staffing firms on the ―Electronic
Human Capital Marketplace The report contains industry overview and statistics and trends
and predictions about this important and emerging sector
Interbiznet - httpwwwinterbiznetcom
URL Reference 32
University of MichiganPanel Study of Income Dynamics (PSID) This study is a longitudinal survey of a representative sample of US individuals and the families
in which they reside It has been ongoing since 1968 The data were collected annually through
1997 and biennially starting in 1999 The data files contain the full span of information collected
over the course of the study PSID data can be used for cross-sectional longitudinal and
intergenerational analysis and for studying both individuals and families It emphasizes the
dynamic aspects of economic and demographic behavior but its content is broad including
sociological and psychological measures As a consequence of low attrition rates and the
success in following young adults as they form their own families and recontact efforts (of those
declining an interview in prior years) the sample size has grown from 4800 families in 1968 to
more than 7000 families in 2001 At the conclusion of 2003 data collection the PSID will have
collected information about more than 65000 individuals spanning as much as 36 years of their
lives
The PSID data files provide a wide variety of information about both families and individuals
collected over the span of the study The central focus of the data is economic and demographic
with substantial detail on income sources and amounts employment family composition
changes and residential location Content of a more sociological or psychological nature is also
included in some waves of the study Information gathered in the survey applies to the
circumstances of the family unit as a whole (eg type of housing) or to particular persons in the
family unit (eg age earnings) While some information is collected about all individuals in the
family unit the greatest level of detail is ascertained for the primary adults heading the family
unit
The study is conducted at the Survey Research Center Institute for Social Research University
of Michigan and has been made possible over the years through the sponsorship of government
agencies foundations and other organizations Since 1982 the study has had an advisory board
DRAFT ANNUAL UPDATE February 2010 - 57 -
appointed by the National Science Foundation to foster input from the national community of
scholars researchers and policymakers
University of Michigan Panel Study of Income Dynamics httpwwwisrumichedusrcpsid
URL Reference 33
Rutgers UniversityJohn J Heldrich Center for Workforce Development This Center is a university-based organization devoted to transforming the workforce
development system at the local state and federal levels The Center provides analysis for
reform and innovation in policymaking and employs cutting-edge research and evaluation
projects to identify best practices in workforce development and employment and workplace
policy It is also engaged in significant partnerships with the private sector to design effective
education and training programs and is committed to assisting job seekers and workers attain the
information education and skills training they need to move up the economic ladder
The John J Heldrich Center and the Center for Survey Research and Analysis at the University
of Connecticut conduct a national survey on a quarterly basis Work Trends Americansrsquo
Attitudes About Work Employers and Government These surveys explore Americanslsquo
perceptions regarding job satisfaction job security career mobility education and training and
the appropriate role of government in addressing the needs of workers employers and job
seekers The surveys are conducted quarterly and follow broad trends in the workforce
DRAFT ANNUAL UPDATE February 2010 - 58 -
Rutgers University John J Heldrich Center for Workforce Development httpwwwheldrichrutgersedu
URL Reference 34
National Venture Capital Association (NVCA)
The National Venture Capital Association is a trade association that represents the US
venture capital industry It is a member-based organization which consists of venture capital
firms that manage pools of risk equity capital designated to be invested in high growth
companies
NVCAs mission is to foster greater understanding of the importance of venture capital to the
US economy and support entrepreneurial activity and innovation The NVCA represents the
public policy interests of the venture capital community strives to maintain high professional
standards provides reliable industry data sponsors professional development and facilitates
interaction among its members
DRAFT ANNUAL UPDATE February 2010 - 59 -
National Venture Capital Association (NVCA) httpwwwnvcaorgaboutnvcahtml
URL Reference 35
DRAFT ANNUAL UPDATE February 2010 - 60 -
Part II Workforce and Labor Market Information Portals and Systems for Decision
Support
Overview
A rapid pace of technological change innovations in business and industrial organization and
the impact of global competitiveness are transforming work and altering traditional labor
markets Information describing the nature of these changes becomes critically important as
firms individuals communities and schools making major investment decisions need to stay
abreast of labor market and workforce developments
The US Department of Labor has made a sustained effort over the last 10 years to expand the
scope of workforce and labor market information and to ensure that such information is more
accessible to end users Along with efforts of the Labor Department other federal agencies
private firms non-profit organizations trade associations and university research centers have
also made more expansive efforts in tracking researching and communicating labor market and
workforce developments
This section of the catalogue examines a diverse array of web-based systems for improved and
innovative access to workforce and labor market information While most of these systems rely
on the traditional data sources previously identified a number of organizations are also gathering
new data and are tapping into alternative information sources to fill some of the gaps and support
innovative ways of looking at labor market and workforce issues
DRAFT ANNUAL UPDATE February 2010 - 61 -
US Department of Labor ETA and State and Local Workforce Agencies
Targeted Users
Source
Car
eerI
nfo
Net
Flo
rid
a R
esea
rch
an
d
Eco
no
mic
Dat
abas
e
Was
hin
gto
n
Wo
rkfo
rce
Ex
plo
rer
Min
nes
ota
In
tern
et
Sy
stem
fo
r E
du
cati
on
and
Em
plo
ym
ent
Kn
ow
led
ge
Neb
rask
a C
aree
r
Co
mp
ass
Tex
as S
OC
RA
TE
S
Ore
go
n L
abo
r M
ark
et
Info
rmat
ion
Sy
stem
San
Die
go
at
Wo
rk
Pen
nsy
lvan
ia C
ente
r
for
Wo
rkfo
rce
Info
rmat
ion
and
An
aly
sis
Employers
Government Agency
Federal State or Local
Elected Officials and Policymakers
Program Planners
Education and Training Providers
Intermediaries
Individuals
Researchers
DRAFT ANNUAL UPDATE February 2010 - 62 -
US Department of Labor ETA and State and Local Workforce Agencies
Indicators
Source
Car
eerI
nfo
Net
Flo
rid
a R
esea
rch
an
d
Eco
no
mic
Dat
abas
e
Was
hin
gto
n
Wo
rkfo
rce
Ex
plo
rer
Min
nes
ota
In
tern
et
Sy
stem
fo
r
Ed
uca
tio
n a
nd
Em
plo
ym
ent
Kn
ow
led
ge
Neb
rask
a C
aree
r
Co
mp
ass
Tex
as S
OC
RA
TE
S
Ore
go
n L
abo
r
Mar
ket
In
form
atio
n
Sy
stem
San
Die
go
at
Wo
rk
Pen
nsy
lvan
ia C
ente
r
for
Wo
rkfo
rce
Info
rmat
ion
and
An
aly
sis
Hours WorkedPayroll Hours
Earnings Trends
Unemployment Records ndash
Mass Layoffs
Labor Force Data
Labor Market Information
Employment
Wages Income Earnings
Future Demand and Hiring Trends
EducationTraining Information
about Providers and Career
Advancement
Occupational Information
Skill Requirements
Program Participation
Information about Full- and Part-
Time Workers Contract Workers
and the Self-Employed
Unions
Information about Employers by
Company Size or Characteristics
Membership or Subscription
Required
RecruitingStaffing Industry
Information
Occupational Licensing Information
Benefit Information
Information about Workforce
Commuting Patterns
DRAFT ANNUAL UPDATE February 2010 - 63 -
US Department of Labor ETA and State and Local Workforce Boards and Agencies
The US Department of Labor and its state partners along with a number of state and local
workforce agencies have made large strides in expanding better organizing and presenting
workforce and labor market information The Workforce Investment Act (WIA) of 1998
established the WIC as a unique structure for federal-state cooperation in planning and
overseeing the workforce information system The establishment of the WIC by the Congress
recognizes the significance of workforce and labor market information in support of broader
workforce development goals The WIC has been charged to plan guide and oversee the
workforce information system There is further recognition that an effective workforce
information system requires input from multiple sources including data producers and users
Federal and state partners are also coordinating labor market information products tools and
services through Americalsquos Labor Market Information System (ALMIS) ALMIS is a system for
extending a consistent accessible set of labor market information products tools and services
There is a growing awareness that workforce and labor market information must become more
customer-focused and provide better end-user utility The WIC has identified the customers of
the workforce information system as individuals and organizations who need information about
the labor market for making many different kinds of decisions
Our catalogue included a review of all the websites maintained by state workforce agencies
identified as partners under ALMIS While all states report a web presence and offer access to
labor market information we focused on sites that have been developed and are being
maintained by federal state and local workforce agencies funded by the US Department of
Labor We looked primarily for sites that emphasized user themes and decision support for
customers groups identified by the WIC
Americarsquos CareerInfoNet (ACINET) This web-based information system has been developed by the US Department of Labor ETA
to provide comprehensive career and labor market information in one convenient place for end
users The site displays a variety of occupational demographic and labor market information at
the local state and national levels Also an extensive collection of career Internet resources is
organized in a Career Resource Library Data used by CareerInfoNet come from a variety of
federal and state sources with sources identified and web links provided Data are continuously
updated Wages income and unemployment rate data are updated annually and the
employment trend data are updated every other year
CareerInfoNet has been designed to meet the needs of end users including students who may be
planning careers workforce professionals who are guiding and advising workers and employers
job seekers who need to learn about the labor market or locate the right employment
opportunities and employers who want to investigate labor market development and trends
CareerInfoNet provides access to occupational employment forecasts and earnings trends Users
are able to view career videos on-line and learn about occupational requirements There is
access to detailed information about education and training resources including information
about financial aid This site offers one of the more comprehensive self-help information
resources to support career planning job search and workforce research and planning for
employers
DRAFT ANNUAL UPDATE February 2010 - 64 -
US Department of Labor Employment and Training Administration
CareerInfoNet httpwwwacinetorg
URL Reference 36
Florida Research and Economic Database (FRED) FRED was developed for the State of Florida Department of Labor and Employment This
system provides a single one stop source for demographic economic and labor market
information for the state FRED recognizes that those seeking such information have a wide
variety of requirements The system is set up to serve researchers seeking detailed information
on trends in labor costs to job seekers looking for the average wage for an occupation in a
specific area Data have been well organized and are effectively arrayed to meet the needs of
multiple user groups
FRED graphically displays manipulates and analyzes a broad range of information from state
local and federal sources This database includes population and income figures industrial and
occupational wage statistics and projections annual and monthly employment and
unemployment figures employment service applicantslsquo data commuting patterns employer
data and mass layoff statistics
DRAFT ANNUAL UPDATE February 2010 - 65 -
Florida Research and Economic Database (FRED) httpfredlabormarketinfocom
URL Reference 37
Washington Workforce Explorer Washington State job seekers students and businesses wanting up-to-date information on career
options average wages and skills needed for various occupations are able to access this new
Internet-based tool The Washington State Employment Security Departmentlsquos Explorer an
interactive website delivers information about jobs and the economy It provides easy access to
a wide variety of career-assessment tools labor-market data and articles of interest to job
seekers employers researchers and policymakers Users can save their favorite information on
a personalized page Administrators wanted to place greater emphasis on meeting end-user
needs and thus designed Workforce Explorer to link statistics to real-world questions facing
unemployed workers or those looking for better jobs as well as businesses Job seekers
businesses students economists and training planners can use Workforce Explorer to
Identify job skills and interests then match those skills to related occupations
Search for jobs and employers
Obtain a list of fast-growing occupations and high-wage industries in an area
Learn tips on starting a business
Discover training opportunities
Access wage information and compare wages for the same job in different parts of the
state
Find economic indicators including population property values and unemployment
rates for an area
Create and save data tables and download them to Excel
An on-line tour introduces new users to the sitelsquos features Data are automatically updated and
new articles added each week Workforce Explorer is the result of a collaborative effort among
employment agencies in 22 states Together they have spent several years developing a generic
Internet-based system to deliver labor market information Washington State led the project
which received funds from the US Department of Laborlsquos ETA
DRAFT ANNUAL UPDATE February 2010 - 66 -
Washington Workforce Explorer httpwwwworkforceexplorerorg
URL Reference 38
Minnesota Internet System for Education and Employment Knowledge (ISEEK) Iseek is a web-based gateway to Minnesota career employment education and business
development information and services The Internet system helps users make choices about
careers employment education and business growth ISEEK provides information in five main
areas
Career planning
Education and training
Class listings
Employment
Business information
The information comes from a variety of public agencies corporations and private organizations
and is linked together in a way that saves users considerable time The degree of interaction and
cross-reference that ISEEK offers is unique among web-based career employment education
and business services
DRAFT ANNUAL UPDATE February 2010 - 67 -
Minnesota Internet System for Education and Employment Knowledge (ISEEK) httpwwwiseekorg
URL Reference 39
Nebraska Career Compass Nebraska Career Compass has been developed using information from many different programs
and resources Occupations are classified and reported using the SOC system all workers are
classified into one of over 820 occupations according to their occupational definition Wage
estimates are developed and updated quarterly by labor market information staff at Nebraska
Workforce Development They use base estimates from the annual OES survey and adjust them
to current quarterly levels using the Employer Cost Index
In the OES survey over 3000 Nebraska employers are selected based on industry employment
size and location to ensure a representative sample of the all employers statewide The resulting
data are presented in practical ways The ―Hot Occupations search provides a list of
occupations that can be considered to have above-average job prospects for the selected region
The ―Job Prospects indicator is a measure of the general availability and projected growth for a
particular occupation The indicators range from HOT for the best prospects to COLD for the
poorest prospects with FAIR representing average prospects The indicators were assigned to
each occupation based on a weighted index of the following variables projected employment
growth projected average annual compound growth rate and projected average annual openings
Career Compass also includes training provider information collected by the Nebraska Career
Information System on an annual basis Specific occupational licensing information was also
compiled by the Labor Market Information Center Office of Workforce Services and Nebraska
Workforce Development with cooperation and assistance from the many agencies departments
boards and commissions charged with the responsibility to implement the occupational licensing
programs in the State of Nebraska
DRAFT ANNUAL UPDATE February 2010 - 68 -
Nebraska Career Compass httpwwwdolnebraskagovnwdlmiCareerCompassindexcfm
URL Reference 40
Texas SOCRATES SOCRATES is a tool to assist local Texas planners to perform a regional labor market analysis
SOCRATES is a tool used by local workforce board planners under the WIA to generate lists of
targeted industries and occupations It is also used for researching regional Texas labor markets
and identifying occupational training possibilities or to justify new program submission and
approval The analytical tools and regional narrative reports within SOCRATES follow the
planning guidelines issued for targeted industries and occupations and approved by the Texas
Workforce Commission (TWC) As new data series become available and software
improvements are made for planning processes in SOCRATES new features will be
implemented to enhance regional analysis SOCRATES has been created by the Texas Career
Development Resources with technical and data support from the TWC labor market
information department and developmental funding by the TWC Workforce Division
DRAFT ANNUAL UPDATE February 2010 - 69 -
Texas SOCRATES httpsocratescdrstatetxus
URL Reference 41
Texas Career Development Resources httpwwwcdrstatetxus
URL Reference 42
San Diego at Work San Diego Workforce Partnership The San Diego Workforce Partnership administers job training and employment programs for the
regionlsquos residents and businesses Created under a Joint Powers Agreement by the City and
County of San Diego the San Diego Workforce Partnership receives federal state and local
funding to provide workforce development activities that increase individualslsquo employment
retention and earnings as well as skills The Partnership has designed its programs and
organized its service delivery system to be responsive to employerslsquo needs and provide for
economic development The Partnership sees the collection organization and the presentation
DRAFT ANNUAL UPDATE February 2010 - 70 -
of workforce and labor market information as one of its most important responsibilities to
employers and job seekers The provision of labor market information to job seekers occurs
through its network of One-Stop career centers The Partnershiplsquos work with employers
particularly in the organization of sectoral initiatives depends on the provision of workforce and
labor market information
The Partnership has established a website to provide information on the regionlsquos labor market
including wage and salary data occupational projections employment statistics education and
training providers and local economic news Specific data sets maintained and updated
regularly include the following
Wage and salary data for occupations in San Diego County and California
Local state and national occupational data
Education and training providers and programs for the San Diego region and others
throughout California
Local and state employment projections and statistics
Data information on San Diegolsquos growing industry clusters
Information on San Diegolsquos economy and economic development
Information on local companies
Current updates on Californialsquos labor market
Through its affiliation with a local network television station the Partnership offers access to
information and tools for job seekers to determine which career is the best fit The Partnership
also makes available The Occupational Outlook Report which highlights salary and benefits
package information education and skill requirements and turnover rates for thousands of job
titles This report offers the regionlsquos employers and job seekers valuable information about the
labor market
San Diego Workforce Partnership wwwworkforceorggeneratehtmlLMIlmi_subhomehtml
URL Reference 43
DRAFT ANNUAL UPDATE February 2010 - 71 -
Pennsylvania Center for Workforce Information and Analysis The Center for Workforce Information and Analysis is Pennsylvanialsquos designated provider of
employment statistics The Centerlsquos goal is to provide the most current data available to help
users make the right decisions and assist organizations in meeting local planning needs
Pennsylvania Labor Market Information Database System (PALMIDS) a web-based application
contains data on a wide variety of employment economic career-related and education topics
It is intended to serve the information needs of job seekers employers students educational
curriculum planners workforce and economic development agencies and the general public
The system has been designed to be intuitive and easy to use Users of PALMIDS may also
consult with trained and experienced labor market analysts if they need more detail or individual
support
PALMIDS provides users with information on labor force employment and unemployment
statewide and for all major areas Also provided is a count of statewide and area non-agricultural
wage and salary jobs by industry as well as number of hours and pay earned in selected
manufacturing industries The system gives users access to career guides containing articles on
how to make career choices conduct a job search choose a college or training program and
obtain financial aid The guides contain outlook information for 150 selected careers including
demand occupations within Pennsylvanialsquos WIAs PALMIDS reports occupational wages
information for selected occupations in various geographical areas and an Occupational Outlook
Handbook with descriptions of what workers do on the job working conditions the training and
education needed earnings and expected job prospects in a wide range of occupations
Databases include long-term industry projections containing estimates of employment levels by
industry 10 years in the future by WIA Employment Opportunity Statistics details the
percentages of women and minorities in the labor force to assist all companies with Equal
Employment Opportunity contract compliance responsibilities Actuarial Evaluations provides
analysis of Pennsylvanialsquos unemployment compensation system regarding current and forecasted
Unemployment Compensation Trust Fund activity
In addition to workforce and labor market information PALMIS offers program resources
including a brief overview of the WIA Press releases contain an analysis of the current
economic conditions for Pennsylvanialsquos 14 MSAs in addition 29 small labor market areas are
posted regularly
DRAFT ANNUAL UPDATE February 2010 - 72 -
Pennsylvania Center for Workforce Information and Analysis httpwwwpaworkstatsstatepaus
URL Reference 44
DRAFT ANNUAL UPDATE February 2010 - 73 -
Economic Development Agencies
Economic Development Agencies
Targeted Users
Source
Sta
te o
f M
ain
e
Dep
artm
ent
of
Eco
no
mic
an
d
Co
mm
un
ity
Dev
elo
pm
ent
Qu
ad C
ity
Dev
elo
pm
ent
Gro
up
Employers
Government Agency
Federal State or Local
Elected Officials and Policymakers
Program Planners
Education and Training Providers
Intermediaries
Individuals
Researchers
DRAFT ANNUAL UPDATE February 2010 - 74 -
Economic Development Agencies
Indicators
Source
Sta
te o
f M
ain
e
Dep
artm
ent
of
Eco
no
mic
an
d
Co
mm
un
ity
Dev
elo
pm
ent
Qu
ad C
ity
Dev
elo
pm
ent
Gro
up
Hours WorkedPayroll Hours
Earnings Trends
Unemployment Records ndash
Mass Layoffs
Labor Force Data
Labor Market Information
Employment
Wages Income Earnings
Future Demand and Hiring Trends
EducationTraining Information about
Providers and Career Advancement
Occupational Information
Skill Requirements
Program Participation
Information about Full- and Part-Time
Workers Contract Workers and the
Self-Employed
Unions
Information about Employers by
Company Size or Characteristics
Membership or Subscription Required
RecruitingStaffing Industry
Information
Occupational Licensing Information
Benefit Information
Information about Workforce
Commuting Patterns
DRAFT ANNUAL UPDATE February 2010 - 75 -
Economic development agencies are increasingly focusing their efforts on workforce
development as the basis for business attraction and expansion While these organizations have
been the consistent users of traditional labor market information they are increasingly becoming
generators of such information as well The strategic value of labor availability and workforce
quality is becoming a driving force for innovative approaches to local labor market and
workforce analysis Below are three examples of economic development organizations making
creative use of traditional labor market information and developing new data to support their
needs
State of Maine Department of Economic and Community Development (DECD) DECD has identified the need to develop extensive and up-to-date information about the
workforce of Maine as a vital component of a strategy for furthering economic growth To that
end the Department has commissioned a series of studies of the workforce in Maine conducted
by the Center for Business and Economic Research (CBER) of the University of Southern
Maine The research team developed a comprehensive analysis of the labor force in 17 regions
comprised of single or multiple labor market areas defined by the Maine Department of Labor
The analysis covers five major topics using data from a random sample of households and
employers These include
Employment mobility and recruiting trends
Unemployment and underemployment
Employment costs including both pay and benefits
Education training and skills
Commuting
An extensive array of data from state federal local and other resources was compiled for
regions including the labor market area municipalities and counties The data comprise
information on demographics education employment and other labor characteristics
Random sample telephone surveys were conducted from March 1999 to July 2001 On average
401 surveys were completed in each of the regions a sample size that permits inference of plusmn 5
percent statistical accuracy 95 percent of the time The respondents selected for interviews were
those over 18 years of age who were not in the military and who were not full-time students
People who were retired and not seeking employment were excluded as were those who had left
the workforce on permanent disability Retirees actively considering taking employment were
included in the survey
A survey was mailed to 24368 employers in the state The mailing list was drawn from the
unemployment insurance records of the Maine Department of Labor In those areas with more
than 3000 employers the mailing list was comprised of all employers with over
100 employees plus a 50 percent sample of all employers under 100 employees For labor
market areas under 3000 employers all employers received a survey form Following the initial
mailing non-respondents were contacted by post card In all 3637 responses were received a
return rate of 147 percent
DRAFT ANNUAL UPDATE February 2010 - 76 -
This vital information about the workforce has been posted to a website where employers
economic development specialists and others assessing workforce issues are able to access it
readily Maine workforce information is being reported based upon the needs of economic
developers and site location specialists Data tabulation and analysis that once required the
services of researchers and technicians can now be directly accessed by those who need the
information to make decisions
State of Maine Department of Economic and Community Development httpwwwmainebusinessworksorg
URL Reference 45
Quad City Development Group Davenport IA
The Quad City Development Group serves as the umbrella organization for economic
development in the Quad Cities (Davenport Bettendorf Rock Island and Molene) The Group
is a non-profit organization supported by local governments and the private sector The
organization markets the Quad Cities as one community to businesses all over North America
and Europe that are considering expansion and investment
The Quad City Development Group conducted a laborshed analysis in cooperation with the Iowa
Workforce Developmentlsquos Workforce Research Bureau A laborshed is defined as the area or
region from which an employment center draws its commuting workers Laborshed studies
show the distribution of the workers irrespective of natural or political boundaries Laborsheds
also address underemployment the availability and willingness of current and prospective
employees to change employment within the workforce current and desired occupations wages
hours worked and distance willing to commute to work Laborsheds are conducted on an ―as
requested basis and the fee is based on the population of the laborshed area
Laborshed reports contain information to assist local leaders developers and industry with
expansion relocation and development efforts in the Quad City area Information such as
commuting patterns current and desired wagessalaries available labor workerslsquo skills and
industries in the laborshed area are reported The laborshed report measures the availability and
DRAFT ANNUAL UPDATE February 2010 - 77 -
characteristics of workers within the Quad City region Laborshed studies provide community
economic developers and existing or prospective employers a flexible tool to understand the
local labor market and make informed expansion and site-selection decisions
A random telephone survey was taken of residents (ages 18-64) living within three laborshed
zones The zones represent the areas in which actual employees of local businesses reside with
Zone 1 having the highest and Zone 3 the smallest concentration of area employees A total of
1200 telephone surveys were completed to achieve a margin of error of 5 percent for the
survey The laborshed study provides developers and existing or prospective employers a
flexible tool to understand the local labor market and make informed site selection decisions
Quad City Development Group httpwwwquadcitiesorg
URL Reference 46
DRAFT ANNUAL UPDATE February 2010 - 78 -
Private Sources Firms Non-Profit Organizations Trade Associations Research Centers
and Advocacy Groups
Private Sources Firms Non-Profit Organizations Trade Associations
Research Centers and Advocacy Groups
Source
Targeted Users
C
aree
rBu
ild
er
M
on
ster
co
m
C
aree
rJo
urn
alc
om
S
oci
ety
for
Hu
man
R
eso
urc
e
M
anag
emen
t
E
cono
mic
Po
licy
I
nst
itu
te
E
mp
loy
men
t P
oli
cy
F
ou
nd
atio
n
Employers
Government Agency
Federal State or Local
Elected Officials and Policymakers
Program Planners
Education and Training Providers
Intermediaries
Individuals
Researchers
DRAFT ANNUAL UPDATE February 2010 - 79 -
Private Sources Firms Non-Profit Organizations Trade Associations Research
Centers and Advocacy Groups
Source
Indicators
Car
eerB
uil
der
Mo
nst
erc
om
Car
eerJ
ou
rnal
co
m
So
ciet
y f
or
Hu
man
Res
ou
rce
Man
agem
ent
Eco
no
mic
Po
licy
Inst
itu
te
Em
plo
ym
ent
Po
licy
Fo
un
dat
ion
Hours WorkedPayroll Hours
Earnings Trends
Unemployment Records ndash
Mass Layoffs
Labor Force Data
Labor Market Information
Employment
Wages Income Earnings
Future Demand and Hiring Trends
EducationTraining Information about
Providers and Career Advancement
Occupational Information
Skill Requirements
Program Participation
Information about Full- and Part-Time
Workers Contract Workers and the Self-
Employed
Unions
Information about Employers by
Company Size or Characteristics
Membership or Subscription Required
RecruitingStaffing Industry Information
Occupational Licensing Information
Benefit Information
Information about Workforce Commuting
Patterns
DRAFT ANNUAL UPDATE February 2010 - 80 -
This catalogue identifies a number of organizations that collect and disseminate
workforce and labor market information The inclusion of private-sector businesses and
com Web sites in this catalogue is for informational purposes only No endorsement is
implied or conferred on a company or on a specific products or service Readers and
information users should exercise an appropriate level of care and should be aware that
the private-sector products andor services may be copyrighted and may require a fee for
service or a cost to access or use information products This Catalogue is not intended to
be an exhaustive list of private sector Web sites and we reserve the right to modify the
list on an ongoing basis
There is growing demand for workforce and labor market information In addition to innovative
systems and approaches offered by public entities there are growing numbers of private
providers for workforce and labor market information linked to decision support systems We
have identified a number of such providers Our review does not in any way constitute an
endorsement of any of these sources In many instances the information and services offered by
private sources are free to users and may be readily accessed via the Internet Often workforce
and labor market information is provided as part of other services such electronic job banks and
career planning services These services are growing in use among employers and job seekers
Our catalogue has identified a limited number of them
CareerBuilder Career Builder provides employers recruiters and job seekers with on-line recruitment resources
through its website CareerBuildercom its on-line component and three newspaper companies
Gannett Co Inc Knight Ridder and Tribune Company CareerBuilder offers a recruitment
resource through more than 130 local newspapers with a combined Sunday print circulation of
more than 15 million readers and more than 26 million visitors
to its newspaper websites on-line
each month In the next few years it is expected that web-based recruiting solutions will expand
exponentially as corporations adapt multi-pronged on-line recruiting strategies for filling all
levels of positions
On the CareerBuilder website job seekers define specific criteria and search more than 400000
continuously updated jobs representing more than 25000 employers in every industry and field
For those job seekers requiring additional assistance CareerBuilder offers personalized
individual assistance through its Customer Care organization CareerBuilder also offer users
access to information research and analysis covering labor market and workforce developments
One of its most useful features is a series of advice columns aimed at job seekers in various
career stages These columns often take more complex issues and data such as occupational
outlook issues of job tenure advancement and skills shortages and effectively analyze trends
and developments for readers to more easily comprehend and apply to their own situations
CareerBuilder - httpwwwcareerbuildercom
URL Reference 47
DRAFT ANNUAL UPDATE February 2010 - 81 -
Monstercom Monstercom is an on-line career website Monster promotes itself as a lifelong career network
providing access to companies as well as interactive personalized tools Features include a
personal career management office resume management a personal job search agent chats and
message boards expert advice on job-seeking and free career management newsletters
Employers receive real-time job postings complete company profiles and resume screening
routing and searching Features for members include resume skills screening real-time
recruiting a comprehensive resume database with more than 16 million resumes and resume
routing
Monstercom also supplies users with practical workforce and labor market information such as
the Personal Salary Report This report helps job seekers and employers establish market value
based on background experience and job setting The Personal Salary Report provides data by
industry the size of company and geographic location The report also provides data that
associate personal skills and experiences to earnings potential for market salary data on more
than 1000 jobs The data are updated monthly to stay current as salary trends evolve The data
are presented in a 14-page report
Monstercom offers detailed job profiles on-line to help job seekers and those planning careers
learn more about job content and performance requirements There is also an extensive database
of books articles and research studies that are organized for users by interest areas Another
feature supports job seekers making geographic moves Links are made to a variety of services
in major urban centers so that job seekers are able to examine housing costs insurance expenses
and other general living costs as part of helping job seekers assess job and salary offers in other
markets Monstercom - httpwwwmonstercom
URL Reference 48
CareerJournalCom CareerJournalcom is a free career information and services site geared to managers and
executives Content comes from the Wall Street Journal published by Dow Jones amp Co as well
as from the CareerJournalcom editorial team Content includes daily updates of critical news
features and trends relevant to job seekers and human resource professionals Content is
focused on searching for a new position or improving job performance
CareerJournalcom works with companies of all sizes to offer employment opportunities to
candidates in a searchable database that is updated twice weekly Positions featured include
senior and general management sales marketing finance technology and a range of related
fields Job hunters can also research publicly traded companies who post their jobs on
CareerJournalcom with one-click access to WSJcomlsquos Briefing Books There are links to an
extensive collection of editorial content databases and other services throughout the site
CareerJournalcom examines hiring demand and salary data for different industries and job
functions ranging from accounting to professionals working for public utilities Writers
interview top company hiring managers and executive recruiters nationally to compile the latest
trends and insights CareerJournalcom provides users with negotiating tips career indicators
DRAFT ANNUAL UPDATE February 2010 - 82 -
hot employment issues information on stock options regional news and a relocation salary
calculator The CareerJournal site connects with the Economic Research Institute providing
users access to salary survey analyses geographic differentials wage surveys executive
compensation information cost of living comparisons prevailing wage studies employee benefit
data and compensation and benefits training
CareerJournalcom - httpwwwcareerjournalcom
URL Reference 49
Society for Human Resource Management (SHRM) SHRM is the worldlsquos largest association devoted to human resource management representing
over 170000 individual members SHRM is committed to advancing the human resource
profession and in promoting the human resource function as an essential and effective partner in
developing and executing organizational strategy Founded in 1948 SHRM currently has more
than 500 affiliated chapters within the US and members in more than 120 countries
The Societylsquos Workplace Trends and Forecasting Program was established to give human
resource professionals added insight into cutting-edge issues and trends The Workplace Trends
and Forecasting staff examines developments in the fields of science and technology economics
politics and government law sociology and psychology for their effect on the workplace The
research department also conducts several mini-surveys to glean information on the topic of
staffing metrics The program produces Workplace Visions a bimonthly publication that
examines new issues and trends affecting the human resource professional ―Future Focus a
monthly column in HR Magazine addressing long-term human resource issues and ―Research
Translations a bimonthly column in HR News addressing the latest academic research in the
human resource management field This information may be accessed directly on the web but
requires membership in SHRM
Society for Human Resource Management httpwwwshrmorg
URL Reference 50
DRAFT ANNUAL UPDATE February 2010 - 83 -
The Economic Policy Institute (EPI)
EPI provides research and education in order to promote a prosperous fair and sustainable
economy EPI is a private research and advocacy organization It stresses real-world analysis
and focuses on living standards of working people EPI makes its findings accessible to the
general public the media and policymakers The State of Working America prepared biennially
since 1988 by EPI sums up problems and challenges facing American workers The authors
present a wide variety of data on family incomes taxes wages unemployment wealth and
povertymdashdata that enable them to closely examine the impact of the economy on the living
standards of the American people This comprehensive report is used by journalists government
leaders researchers policymakers academics and others looking for an assessment of the
economic well-being of the nation It is a comprehensive study of the living standards of
working Americans and comprises seven chapters income wages jobs wealth poverty and
regional and international comparisons With over 300 tables and charts it is among the most
detailed reference works on wages income and other economic data Data and a variety of
reports about work in America are available on EPIlsquos website
Economic Policy Institute httpwwwepinetorg
URL Reference 51
The Federal Reserve System
The Federal Reserve System consists of network of 12 regions Each region contains a Federal
Reserve Bank that is engaged in economic research and data analysis While much of the
research and data analysis are focused on overall regional economic well-being and financial
markets there are considerable data sources studies and articles pertaining to labor markets and
workforce development Among these are
DRAFT ANNUAL UPDATE February 2010 - 84 -
Surveys and Reports that include the senior loan officer survey the survey on small
business finances and the survey of consumer finances
Staff Studies consisting of a series of published studies covering a wide range of
economic and financial subjects including special studies in human capital labor
market education and training
Working Papers that serve as preliminary discussion papers in domestic and
international topics occasional staff studies and links to other working papers sites
Federal Reserve Bulletin Articles including reports and analysis on economic
developments regulatory issues and new data
Federal Reserve System httpwwwfederalreservegov
URL Reference 52
Commonly known as the Beige Book this report is published eight times per by the Federal
Reserve Each Federal Reserve Bank gathers anecdotal information on current economic
conditions in its Districts through reports from bank and branch directors and interviews with
key business contacts economist market analyst and other sources The Beige Book
summarizes this information by district and sector
DRAFT ANNUAL UPDATE February 2010 - 85 -
Beige Book httpwwwfederalreservegovfomcbeigebook2009
URL Reference 53
DRAFT ANNUAL UPDATE February 2010 - 86 -
Real-Time Workforce Information
Recently online job banks and workforce information organizations have begun to expand the
number of tools offered to the public By using frequently-updated databases of job openings and
advertisements as well as various monthly surveys and reports a number of organizations now
offer ―real-time labor market analytics
The Conference Board
The Conference Board is a not-for-profit organization which collects and distributes information
on management and the marketplace produces economics-based forecasts and analyzes
workforce trends It currently offers two real-time LMI tools
Conference Board Help-Wanted Online Data Series (HWOL) was developed in
partnership with Wanted Technologies and is a monthly release which details
workforce trends by measuring the number of online job postings from over 1200
Internet job banks From these data the HWOL offers supplydemand rates of
unemployed workers to online advertised vacancies according to region state
occupation and metropolitan area
The Conference Board Help-Wanted Online Data Services
httpwwwconference-boardorgeconomicshelpwantedOnlinecfm
URL Reference 54
The Conference Board Employment Trends Index (ETI) is another monthly
publication seeking to present underlying trends in the workforce in order to make
accurate short term predictions on employment in the United States The ETI does
this by aggregating eight separate indicators which have individually proven accurate
the percentage of Conference Board Consumer Confidence Survey respondents who
say they find ―jobs hard to get initial claims for Unemployment Insurance the
percentage of firms unable to fill positions the number of employees hired by the
DRAFT ANNUAL UPDATE February 2010 - 87 -
temporary-help industry the number of part-time workers for economic reasons the
amount of job openings industrial production and real manufacturing and trade sales
These indicators are supplied by the US Department of Labor the National
Federation of Independent Business Research Foundation the Federal Reserve Board
and the US Bureau of Economic Analysis The ETI is presented graphically and
includes data from as far back as 1973
The Conference Board Employment Trends Index httpwwwconference-
boardorgeconomicsemploymentcfm
URL Reference 55
EmployOn LMI
EmployOn seeks to provide employers recruiters publishers of classified advertising and local
regional and state governments with the market trend information needed to make wiser
spending decisions and more accurate workforce forecasts Accordingly EmployOn provides
real-time LMI based off a database of over 7 million jobs utilizing a concept-based search
engine Database sources include employers recruiting firms job boards regional sites and
―niche websites Market information provided by EmployOn includes the number of employers
posting jobs in a specified area the types of jobs being posted the names of employers with an
increasing number of postings and the most common postings by title and industry EmployOn
LMI also provides trend information such as growing and declining industries
EmployOn LMI httpwwwemployoncomproducts_labormarketasp
URL Reference 56
Indeed Job Trends Indeed is a searchable online index of job postings harvested from career and job board websites
which also provides a series of longitudinal LMI tool Indeed Job Trends presents a graphical
depiction of the number of job postings containing either user-defined keywords or
recommended search terms Additionally Indeed Job Trends offers information on the number
of unemployed workers per job posting in fifty metropolitan areas a map tool which displays job
DRAFT ANNUAL UPDATE February 2010 - 88 -
postings per capita quarterly rankings of metropolitan areas based on the number of job postings
per thousand people and monthly major industry trends
Indeed Job Trends httpwwwindeedcomjobtrends
URL Reference 57
Manpower Employment Outlook Survey (MEOS)
Manpower is an employment services leader providing recruitment assessment training
outsourcing and consulting to businesses throughout 82 countries and territories in nearly all
industries MEOS is a quarterly survey of over 72000 public and private employers from 35
countries and territories which seeks to gauge the intentions of employers to increase or decrease
their workforces in the upcoming quarter The report presents its seasonably-adjusted data in a
number of contexts including quarter-over-quarter year-over-year regional and international
comparisons
Manpower Employment Outlook Survey httpwwwmanpowercompressmeoscfm
URL Reference 58
Simply Hired Employment Trends Simply Hired is a ―vertical search engine company which compiles an online database of job
openings from job boards company pages and online classified ads The Simply Hired page also
provides a Trends tool where users can view a graphical presentation of the frequency of job
titles companies skills and industries in the Simply Hired database Users are able to view
trends based on search criteria or recommended ―popular job trends
Simply Hired Employment Trends httpwwwsimplyhiredcomajobtrendshome
URL Reference 59
DRAFT ANNUAL UPDATE February 2010 - 89 -
Part III Data Integration and Analysis Tools and Services to Support Regional
Economic Development
The need for a deep understanding of ever more complicated state regional and local economies
has intensified as government business and industries recognize the need and accept the
challenge to compete on a global basis Many if not all economies must transform themselves
and harness more and more information to improve strategic planning investment decision-
making and talent development New public and private sector information sources and tools
are emerging that tap and exploit data from multiple sources and provide a relatively new
approach to use geographic information system tools to display data on maps predefined charts
tables and reports
A new class of information tool combines selected datasets and uses geographic information
systems (GIS) to display data on maps to expand the understanding and the relationship of data
to the area being studied These new integrated relational database tools are useful for a wide
variety of analysis including
o Industry Cluster Analysis using the North American Industrial Classification System
(NAICS) summary data and business location data
o Regional Overview and Assessment using data reports and maps that include
information on basic population and demographics educational attainment housing and
income employment business and transportation information
o Benchmarking or Comparison for side-by-side benchmarking or peer analysis
o Asset and Infrastructure Analysis and o Performance Measurement by tracking the changes in key metrics and user created
trend reports can identify areas of strength and improvement as well as those in need of
greater attention
ETA - Census Bureau Community Economic Development Hot Reports
To assist communities prepare for economic shocks and impacts such as military base
realignments and closures (BRAC) the Department of Defense Office of Economic Adjustment
and the Employment Training Administration sponsored the US Census Bureaulsquos efforts to
develop an interactive web-based system to make available high level community economic
development information BRAC realignment and closures like business expansions and natural
disasters all require communities to transform themselves and address new economic challenges
the CED HotReports provide a snapshot of key aspects of the area economy workforce and
industry HotReports allows community strategic planners and decision makers to speedily
access common and updated set of data and provides comparable information for grant funding
applications economic development workforce investment planning and investment decision-
making
CED HotReports display data in charts maps and tabular formats The HotReports are made up
of several interconnected dynamic web pages Data are pulled from 12 datasets on multiple data
systems in multiple formats and from multiple physical locations including the Summary File 3
that consists of 813 detailed tables of Census 2000 social economic and housing characteristics
DRAFT ANNUAL UPDATE February 2010 - 90 -
compiled from a sample of approximately 19 million housing units (about 1 in 6 households) that
received the Census 2000 long-form questionnaire The data sets are
American Community Survey (ACS) ndash 2005 or Census 2000
Summary File 3 (SF3)
Local Employment Dynamics (LED)
Population Estimates
Small Area Income and Poverty Estimates (SAIPE)
County Business Patterns (CBP)
US Counties
Common Core of Data ndash Public ElementarySecondary School Universe
Home Mortgage Disclosure Act (HMDA)
Integrated Postsecondary Education Data System (IPEDS)
Quarterly Census of Employment and Wages (QCEW) and
State Occupation Projections
HotReports provide users speedy access to key information for strategic planning talent and
economic development and workforce investment decision making HotReports include the
following information displays
Community Economic Development Hot Reports httpcedcensusgov
URL Reference 60
DRAFT ANNUAL UPDATE February 2010 - 91 -
HotReports include the following information displays
Entry Page
Select State County
o General Overview
Population
Average annual wages
Number in labor force
Number employed
Unemployment rate (county
and national)
Median household income
Median housing value
Median gross rent
Per capita personal income
Poverty rate
High school graduates
Bachelorlsquos degree or higher
Population pyramid (age
groups by sex)
o Economic Overview
Top 20 Industries (by number
of employees)
Average annual wages by
industry (thematic map of all
counties)
Labor force size by age (graph
and table)
Education levels (graph and
table)
Top 10 occupation groups
o Detailed Economic ndash Growth and
Contractions
Top 10 industries by 8 selectable
measures (employees earnings
separations new hires etc)
Top 20 occupations by projected
percent increase (state level only)
Number of establishments by
establishment size (7 year time
graph selectable establishment
sizes)
o Detailed Economic ndash Workforce
Details ndash selectable industry sector
Employment counts (time graph
county-state comparison)
Average monthly earnings (time
graph county-state comparison
stable job-new hires comparison)
Turnover ratio (time graph county-
state comparison)
o Demographic Overview
Population
Household income distribution
(graph)
Per capita income
Median household income
Median family income
Veterans ndash percentage of
population 18 and over
English language ability
School enrollment by level
o Housing Overview
Average mortgage amount for
home purchase
Median home value
Occupancy status
Percent owner-occupied
Average people per household
Home ownership by age of
householder (graph)
Owner and renter costs
o Transportation Overview
Percent of commuters by travel
time to work (graph and table)
Average commute time
Percent of workers by means of
transportation to work (graph and
table)
o Community Assets Overview
Number of public schools by type
and level (K-12)
Number of students teachers and
ratios by level (K-12 public)
Number and listing of colleges
and universities
Economic Modeling Specialists Inc (EMSI) Strategic Advantage
EMSI is a provider of regional economic and labor market data web-based analysis tools and
consulting servicesndashintegrated solutions that bring together industry workforce and education
perspectives EMSI provides workforce information to thousands of customers representing
workforce boards economic development organizations government agencies community
colleges universities and policy professionals across the nation Their StrategicAdvantage
product is customizable by data and function and produces presentation-ready reports in graphs
tables and maps The product consists of four core components
Economic Forecaster ndash provides users with current reports and projections for industries
occupations and demographics in a selected region Hundreds of industries (2-5 digit
NACIS) and occupations (2-5 digit SOC) are available and results can be filtered and
DRAFT ANNUAL UPDATE February 2010 - 92 -
organized using multiple criteria such as number and percent change of jobs education
level and earnings
Career Pathways ndash shows the skills imbedded in the workforce for every occupation in
the region and reveals the transferability of unemployed underemployed or advancing
workers into potential occupations With this tool users can target their investments in
programs that assist workers transition from declining occupations to high-growth
occupations with similar skill requirements
Economic Impact ndash provides a host of critical information about the health and possible
future directions of the regional economy using a robust web-automated inputoutput
model The module allows users to input growth or decline in jobs earnings and sales
and view the ripple effects throughout industries
Educational Analyst ndash helps regional workforce education and training professionals
access the information they need to plan for a regionlsquos future knowledge and skill needs
by combining data on occupations and career clusters with information about post-
secondary institutions educational attainment and high school graduations The module
also connects occupations to post-secondary programs allowing users to quickly assess
the regional labor market outlook for specific education programs
Economic Modeling Specialists Inc (EMSI) Strategic Advantage
httpwwweconomicmodelingcomwebtools
URL Reference 61
DRAFT ANNUAL UPDATE February 2010 - 93 -
Acronyms
ACINET Americalsquos CareerInfoNet
ACRN Americalsquos Career Resource Network
AIDS Acquired Immune Deficiency Syndrome
AMA American Management Association
ASA American Staffing Association
BEA Bureau of Economic Analysis
BLS Bureau of Labor Statistics
CBER Center for Business and Economic Research
CES Current Employment Statistics
CPS Current Population Survey
DECD Department of Economic and Community Development
DOVE Data on Vocational Education
EPI Economic Policy Institute
EMSI Economic Modeling Specialists Inc
EQW Educational Quality of the Workforce
ESA Economics and Statistics Administration
ETA Employment and Training Administration
FRED Florida Research and Economic Database
FY Fiscal Year
GAO General Accounting Office
GDP Gross Domestic Product
IPEDS Integrated Post-secondary Education Data System
ISEEK Internet System for Education and Employment Knowledge
JOLTS Job Opening and Labor Turnover Survey
LAUS Local Area Unemployment Statistics
LEHD Longitudinal Employer Household Dynamics
MIDAS Metropolitan Information and Data Analysis Services
MLS Mass Layoff Statistics
MSA Metropolitan Statistical Area
NAAL National Assessment of Adult Literacy
NACE National Association of Colleges and Employers
NAEP National Assessment of Educational Progress
NAFTA North American Free Trade Agreement
NAICS North American Industry Classification System
NCES National Center for Education Statistics
NHES National Household Education Surveys
NLS National Longitudinal Surveys
NTSC National Training Support Center
OES Occupational Employment Statistics
OLMIS Oregon Labor Market Information System
OMB Office of Management and Budget
PALMIDS Pennsylvania Labor Market Information Database System
PSID Panel Study of Income Dynamics
QCEW Quarterly Census of Employment and Wages
DRAFT ANNUAL UPDATE February 2010 - 94 -
SBA Small Business Administration
SWA State Workforce Agency
SHRM Society for Human Resource Management
SIC Standard Industrial Classification
SIPP Survey of Income and Program Participation
SOC Standard Occupational Classification
TWC Texas Workforce Commission
UI Unemployment Insurance
US United States
WIA Workforce Investment Act of 1998
WIC Workforce Information Council
WIS Workforce Information System
DRAFT ANNUAL UPDATE February 2010 - 95 -
URL References
1 US Department of Labor Bureau of Labor Statistics wwwblsgov
2 US Department of Labor Employment and Training Administration wwwdoletagov
3 Occupational Information Network Resource Center httpwwwonetcenterorg
4 US Department of Commerce wwwcensusgov
5 US Census Bureau httpwwwcensusgov
6 US Census Bureau httpwwwcensusgov
7 Federal Assistance Award Data System httpwwwcensusgovgovswwwfaadshtml
8 Bureau of Economic Analysis httpbeagov
9 Economic Development Administration httpwwwedagov
10 US Patents and Trademarks httpwwwusptogovpatftindexhtml
11 EconDataNet httpwwwEconDataNet
12 TradeStats Express httptseexportgov
13 DoD Personnel and Procurement Statistics httpsiadappdmdcosdmilindexhtml
14 Office Economic Adjustment httpwwwoeagovOEAWebnsfhomereadform
15 Small Business Administration httpwwwsbagovadvoresearch
16 USDA Economic Research Service httpwwwersusdagovData
17 US Department of Education National Center for Education Statistics httpncesedgov
18 Bureau of Transportation Statistics httpwwwbtsgovprogramsomnibus_surveys
19 National Transportation Library httpntlbtsgovindexhtml
20 US Department of Interior httpinteriorgov
21 US Maps amp Data wwwgeodatagov
22 Energy Information Administration httpwwweiadoegov
23 Veterans Data and Information httpwww1vagovvetdata
24 Veterans Benefits Administration httpwwwvbavagov
25 FedStats httpwwwfedstatsgov
26 Science and Engineering Statistics httpwwwnsfgovstatistics
27 ERISS the Workforce Intelligence Company httpwwwerisscom
28 Manpower Inc httpwwwmanpowercom
29 Challenge Gray and Christmas httpwwwchallengergraycom
30 National Association of Colleges and Employees httpwwwnaceweborg
31 Economycom httpwwweconomycom
32 Interbiznet httpwwwinterbiznetcom
33 University of Michigan Panel Study of Income Dynamics httpwwwisrumichedusrcpsid
34 Rutgers University John J Heldrich Center for Workforce Development
For Workforce Development httpwwwheldrichrutgersedu
35 National Venture Capital Association (NVCA) httpwwwnvcaorgaboutnvcahtml
36 US Department of Labor Employment and Training Administration
CareerInfoNet httpwwwacinetorg
37 Florida Research and Economic Database (FRED) httpfredlabormarketinfocom 38 Washington Workforce Explorer httpwwwworkforceexplorerorg 39 Minnesota Internet System for Education and Employment Knowledge (ISEEK) httpwwwiseekorg
40 Nebraska Career Compass httpwwwdolstateneusnwdcentercfmPRICAT=4 ampSUBCAT=4C
41 Texas SOCRATES httpsocratescdrstatetxus
42 Texas Career Development Resources httpwwwcdrstatetxus
43 San Diego Workforce Partnership wwwworkforceorggeneratehtmlLMIlmi_subhomehtml
44 Pennsylvania Center for Workforce Information and Analysis httpwwwpaworkstatsstatepaus
45 State of Maine Department of Economic and Community Development
httpwwwmainebusinessworksorg
46 Quad City Development Group httpwwwquadcitiesorg
47 Career Builder httpwwwcareerbuildercom
48 Monstercom wwwmonstercom
49 Career Journalcom httpwwwcareerjournalcom
50 Society for Human Resource Management httpwwwshrmorg
51 Economic Policy Institute httpwwwepinetorg
DRAFT ANNUAL UPDATE February 2010 - 96 -
52 Federal Reserve System httpwwwfederalreservegov
53 Beige Book httpwwwfederalreservegovFOMCbeigebook2007
54 The Conference Board Help-Wanted Online Data Services
httpwwwconference-boardorgeconomicshelpwantedOnlinecfm
55 The Conference Board Employment Trends Index
httpwwwconference-boardorgeconomicsemploymentcfm
56 EmployOn LMI httpwwwemployoncomproducts_labormarketasp
57 Indeed Job Trends httpwwwindeedcomjobtrends
58 Manpower Employment Outlook Survey httpwwwmanpowercompressmeoscfm
59 Simply Hired Job Trends httpwwwsimplyhiredcomajobtrendshome
60 Community Economic Development Hot Reports httpcedcensusgov
61 Economic Modeling Specialist Inc (EMSI) httpwwweconomicmodelingcomwebtools
Note To ensure that there is no misinterpretation of an ETA endorsement of any type or
form the private sector and com Web sites included in the Catalogue and listed above are
not hyperlinked

Contents
Introduction - 6 -
Part I Review of Workforce and Labor Market Information Data Sources - 4 -
US Department of Labor
Bureau of Labor Statistics
The Current Employment Statistics (CES) - 8 -
The Quarterly Census of Employment and Wages (QCEW) - 8 -
The Local Area Unemployment Statistics (LAUS) - 9 -
The Occupational Employment Statistics (OES) - 10 -
The Mass Layoff Statistics (MLS) - 10 -
The Job Openings and Labor Turnover Survey (JOLTS) - 11 -
The Survey of Employer-Provided Training - 11 -
The National Longitudinal Surveys (NLS) - 11 -
The Current Population Survey (CPS) - 12 -
The National Compensation Survey (NCS) - 12 -
The Employment Projections (EP) - 13 -
Employment and Training Administration
ONET OnLine - 14 -
Links to State Workforce and Labor Market Information Websites and Portals - 15 -
US Department of Commerce - 16 -
Census Bureau
Survey of Income and Program Participation (SIPP) - 19 -
The National Employer Survey - 20 -
Local Employment Dynamics (LED) - 21 -
Quarterly Workforce Indicators (QWIs) Online - 21 -
Industry Focus - 22 -
LED ―OntheMap - 23 -
The Economic Census - 24 -
The American Community Survey - 25 -
Decennial Census - 25 -
Federal Assistance Award Data System (FAADS) - 25 -
Bureau of Economic Analysis (BEA)hellip- 26 -
Economic Development Administration- 27 -
EconDataNet - 28 -
TradeStatsExpress -29 -
US Patent and Trademark Office - 30 -
US Department of Defense - 31 -
Defense Manpower Data Center Statistical Information Analysis Division - 31 -
Office of Economic Adjustment (OEA) - 32 -
US Small Business Administration - 35 -
Small Business Economic Indicators - 35 -
Characteristics of Small Business Owners and Employees - 35 -
Firm Size Data by Location and Industry - 35 -
US Department of Agriculture Economic Research Service - 36 -
US Department of Education National Center for Education Statistics - 38 -
The National Assessment of Educational Progress (NAEP) - 40 -
The National Assessment of Adult Literacy (NAAL) - 41 -
The Integrated Post-secondary Education Data System (IPEDS) - 41 -
The National Household Education Surveys (NHES) - 42 -
The NCES Data on Vocational Education (DOVE) - 42 -
US Department of Transportation Bureau of Transportation Statistics - 43 -
Omnibus Surveys - 43 -
TranStats Intermodal Transportation Database - 44 -
US Department of the Interior - 45 -
US Geological Survey - 45 -
US Department of EnergyEnergy Information Administration - 46 -
Energy Statistics - 46 -
US Department of Veterans Affairs - 47 -
Office of PolicyVeteran Data and Information - 47 -
Veterans Benefits Administration (VBA) - 48 -
The Interagency Council on Statistical Policy - 48 -
FedStats - 48 -
National Science Foundation - 49 -
Science Resource Statistics - 49 -
Private Sources Generating Workforce Information - 51 -
ERISS The Workforce Intelligence Company - 53 -
Manpower Inc - 53 -
Challenger Gray and Christmas - 54 -
National Association of Colleges and Employers (NACE) - 54 -
Economycom - 55 -
Interbiznet - 56 -
University of MichiganPanel Study of Income Dynamics (PSID) - 56 -
Rutgers UniversityJohn J Heldrich Center for Workforce Development - 57 -
National Venture Capital Association (NVCA) - 58 -
Part II Workforce and LMI Portals and Systems for Decision Support - 60 -
US Department of Labor - 64 -
ETA and State and Local Workforce Boards and Agencies - 63 -
Americalsquos CareerInfoNet (ACINET) - 63 -
Florida Research and Economic Database (FRED) - 64 -
Washington Workforce Explorer - 65 -
Minnesota Internet System for Education and Employment Knowledge(ISEEK)- 67 -
Nebraska Career Compass - 67 -
Texas SOCRATES - 68 -
San Diego at Work San Diego Workforce Partnership - 69 -
Pennsylvania Center for Workforce Information and Analysis - 71 -
Economic Development Agencies - 73 -
State of Maine Department of Economic and Community Development (DECD) - 75 -
Quad City Development Group Davenport IA - 76 -
Private Sources Firms Non-Profit Organizations Trade Associations Research Centers
and Advocacy Groups - 78 -
CareerBuilder - 80 -
Monstercom - 81 -
CareerJournalCom - 81 -
Society for Human Resource Management (SHRM) - 82 -
The Economic Policy Institute (EPI) - 83 -
The Federal Reserve System - 83 -
Real-Time Workforce Information - 86 -
The Conference Board - 86 -
EmployOn LMI - 87 -
Indeed Job Trends - 87 -
Manpower Employment Outlook Survey - 87 -
Smply Hired Job Trends - 88 -
Part III Data Integration and Analysis Tools and Services - 89 -
ETA - Census Bureau Community Economic Development Hot Reports - 89 -
Economic Modeling Specialists Inc (EMSI) Strategic Advantage - 91 -
Acronyms - 93 -
URL References - 95 -
This page has been left blank intentionally
DRAFT ANNUAL UPDATE February 2010 - 2 -
Introduction
In a global economy that is highly dependent on human capital investment and workforce quality
to achieve economic recovery and Good Jobs for Everyone improved and expanded information
about the workforce state regional and local economic conditions has become more and more
critical for policymakers to better understand and guide the direction of long-term workforce and
economic development investments The front line of global competition typically thought of as
a national challenge is actually regional where companies workers researchers entrepreneurs
and governments come together to create a competitive advantage The regions that will be
successful in meeting the challenge are those able to demonstrate the ability to network their
innovation assetslsquo ndash people institutions capital and infrastructure to generate growth and
prosperity in the regional economy
The Catalogue of Workforce Information Sources developed by the Employment and Training
Administration in 2004 as an environmental scan has been updated annually It represents
ETAlsquos effort to identify capture and organize the dynamic and expanding body of workforce
and labor market information continuously generated by public and private sources The intent
of this catalogue is to better inform various information consumer groups including workforce
talent and regional economic development specialists education and training planners and
public policy makers about the large quantity of quality workforce and labor market information
available to them The catalogue is not intended to be a comprehensive encyclopedia or
exhaustive inventory of all that is being produced at the federal state and local levels
Design and Format
The catalogue is organized into three sections The first section examines a mix of labor market
and workforce information source organizations including those most widely and commonly
consulted The US Department of Labor Bureau of Labor Statistics (BLS) and the US
Department of Commerce Census Bureau along with partnering state labor market information
units are primarily responsible for collecting and reporting data on the nationlsquos workforce and
labor market developments The Small Business Administration (SBA) and the Department of
Educationlsquos National Center for Education Statistics (NCES) also provide data related to labor
market and workforce developments Additionally private sector entities such as businesses
non-profit organizations trade associations and research institutions that generate workforce and
labor market information were identified and included Though not exhaustive the catalogue
contains a solid sampling and provides exposure to a diverse array of data sources
The second part of the catalogue examines several web-based workforce and labor market
information delivery systems With significant investment and leadership from the US
Department of Laborlsquos Employment and Training Administration major strides have been made
since the mid-1990lsquos to develop new systems to assist job seekers employers and other user
groups to better access workforce and labor market information The CarreerOneStoporg portal
that includes Americalsquos Career InfoNet Americalsquos Service Locator the employer locator and
the Occupational Information Network (ONET) are a few of the resources and tools that were
created under national guidance to improve labor market performance guide career planning
and support workforce analysis Many of the Departmentlsquos state and local workforce partner
DRAFT ANNUAL UPDATE February 2010 - 3 -
agencies have since developed and now maintain innovative web-based workforce and labor
market information systems ETAlsquos review also found that 1) Economic development agencies
are actively collecting and reporting workforce and labor market information and 2) Many
private firms also provide specialized workforce and labor market information as a feature of
their web-based career planning and job matching systems Together all of these systems
provide a highly informative and advanced environment to address workforce and labor market
data needs
The third section of the catalogue highlights new and emerging data integration and analysis
tools developed by the private-sector and federal government Impressive progress has been
made to improve access to traditional sources of workforce and labor market information and to
add new datasets and non-traditional labor-market information These new tools use integrated
relational database systems that can combine information from various sources into new data
display tools and systems resulting in faster access to more information than in the past Along
with the federal government economic development agencies trade associations university
research centers and private firms are all contributing data to improve economic analysis and
decision making ETA will continue to uncover new data sources display tools approaches and
systems which will be added to this catalogue in the future
DRAFT ANNUAL UPDATE February 2010 - 4 -
Part I Review of Workforce and Labor Market Information Data Sources
Overview
The US economy is backed by one of the most advanced statistical information systems in the
world costing billions of dollars annually to maintain Workforce and labor market information
has always been a fundamental component of this system Indicators such as the number of
unemployed number of jobs created or workers laid off are basic statistics reported regularly
and understood by most Americans These numbers convey a basic picture about the economy
and the direction in which it is moving As we continue to move toward a more complex
knowledge and information economy the statistical infrastructure and information systems that
convey static snapshots and dynamic movements must also reflect this growing complexity
In this catalogue we have identified an extensive inventory of workforce and labor market
information sources For the most part these statistical systems work fairly well in tracking
labor market and workforce developments The BLS along with its state partners and the
Census Bureau produce timely reliable and accessible information about employment
unemployment and earnings across detailed industry sectors at the labor market level The
Department of Laborlsquos ETA supplies detailed information about jobs including skill and
education requirements with the ONET system an online occupational information system
Through a combination of establishment surveys household surveys and administrative records
we learn a great deal about the state of our labor markets and changing conditions over time
The surveys conducted and the information collected through the NCES also provides us with
considerable data about the workforce including characteristics of the existing labor supply
The Department of Labor and its partners at the state and local level are making impressive
strides in consolidating organizing and reporting the most common sources of workforce and
labor market information on the Internet We explored a number of websites where workforce
and labor market information is arrayed for users groups including employers job seekers
economic development analysts and education and training planners While our search of these
types of sites was not exhaustive a significant number of them were researched Progress is
being made in making workforce and labor market information more easily available to end
users A number of promising new developments are also underway including development of
both public and private-sector web-based database integration tools and geographic information
system (GIS) mapping functionality that allows labor market economic analyst and strategic
planners an additional perspective and dimension to the information displays
In developing the catalogue a number of additional sources of workforce and labor market
information that are less well known and generally not referenced by the Department of Labor
and its state and local workforce systems partners were identified There are firms offering
research services exclusively focused on local labor market developments and others that collect
workforce information and conduct labor market research to complement their primary business
Trade associations representing human resource professionals and industry often engage in the
collection of workforce and labor market information The research included a number of
private research institutions university-based research centers and advocacy groups offering
storehouses of workforce and labor market information Their efforts include conducting
DRAFT ANNUAL UPDATE February 2010 - 5 -
surveys and panel studies resulting in large comprehensive databases to support labor market
and workforce research Private as well as government funds support these efforts While some
of these sources require payment of fees to access the data others offer access at no cost
In addition to the number of public and private databases and information sources reviewed
there is a vast pool of labor market and workforce research carried out by academic government
foundation and private researchers Research products including journal articles published
papers research reports and books have appeared with growing frequency as labor market and
workforce development policies have drawn more interest from both public officials and
business leaders Knowledge developed and insights gained from these efforts need to be better
organized and synthesized to become more accessible to those wanting to enhance their practical
understanding of labor markets and workforce development
DRAFT ANNUAL UPDATE February 2010 - 6 -
US Department of Labor Bureau of Labor Statistics Employment and
Training and Administration
US Department of Labor Bureau of Labor Statistics Employment and Training Administration
Targeted Users
Survey Name
Cu
rren
t E
mp
loy
men
t
Sta
tist
ics
Qu
arte
rly
Cen
sus
of
Em
plo
ym
ent
and
Wag
es
Lo
cal
Are
a U
nem
plo
ym
ent
Sta
tist
ics
Occ
up
atio
nal
Em
plo
ym
ent
Sta
tist
ics
Mas
s L
ayo
ff S
tati
stic
s
Job
Op
enin
g a
nd
Lab
or
Tu
rnov
er S
urv
ey
Su
rvey
of
Em
plo
yer
-
Pro
vid
ed T
rain
ing
Nat
ion
al L
on
git
ud
inal
Su
rvey
s
Cu
rren
t P
op
ula
tio
n S
urv
ey
NC
S
O
NE
T
Employers
Government Agency
Federal State or Local
Elected Officials and Policymakers
Program Planners
Education and Training Providers
Intermediaries
Individuals
Researchers
DRAFT ANNUAL UPDATE February 2010 - 7 -
US Department of Labor Bureau of Labor Statistics Employment and Training Administration
Indicators
Survey Name
Cu
rren
t E
mp
loy
men
t
Sta
tist
ics
Qu
arte
rly
Cen
sus
of
Em
plo
ym
ent
and
Wag
es
Lo
cal
Are
a
Un
emp
loy
men
t S
tati
stic
s
Occ
up
atio
nal
Em
plo
ym
ent
Sta
tist
ics
Mas
s L
ayo
ff S
tati
stic
s
Job
Op
enin
g a
nd
Lab
or
Tu
rnov
er S
urv
ey
Su
rvey
of
Em
plo
yer
-
Pro
vid
ed T
rain
ing
Nat
ion
al L
on
git
ud
inal
Su
rvey
s
Cu
rren
t P
op
ula
tio
n
Su
rvey
NC
S
O
NE
T
Hours WorkedPayroll Hours
Earnings Trends
Unemployment Records -
Mass Layoffs
Labor Force Data
Labor Market Information
Employment
Wages Income Earnings
Future Demand and Hiring
Trends
EducationTraining Information
About Providers and Career
Advancement
Occupational Information
Skills Requirements
Program Participation
Information about Full- and Part-
Time Workers Contract
Workers and the Self-Employed
Unions
Information about Employers by
Company Size or Characteristics
Membership or Subscription
Required
RecruitingStaffing Industry
Information
Occupational Licensing
Information
Benefit Information
Information about Workforce
Commuting Patterns
DRAFT ANNUAL UPDATE February 2010 - 8 -
Bureau of Labor Statistics
The BLS provides comprehensive and timely information on the labor force employment
unemployment and related labor market characteristics at the national level industrial and
occupational employment at the state and local levels and labor force and unemployment figures
at state and local levels The BLS also develops projections of the labor force economic growth
industrial output and employment by industry and occupation for 10 years into the future for the
nation as a whole
Key BLS labor market information includes monthly estimates on the numbers of separations
new hires and current job openings by major industry groupings The BLS is also engaged in a
number of efforts designed to add to and improve current workforce and labor market
information systems In conjunction with the Census Bureau the BLS began in FY 2003 to
conduct the American Time-Use Survey The focus of the survey is on how Americans divide
their time between work and leisure The BLS also implemented the conversion of all national
state and area estimates to the North American Industry Classification System (NAICS) This
system of classifying industries was adopted with the passage of the North American Free Trade
Agreement (NAFTA) and facilitates industry comparisons for the US Mexico and Canada
The core labor market information programs conducted by BLS include the following
The Current Employment Statistics (CES)
A survey of payroll records covers over 300000 (non-farm) businesses employing a third of all
payroll workers on a monthly basis and provides detailed industry data on employment levels
hours and earnings of workers on non-farm payrolls for the nation These estimates are based
on the businesseslsquo payroll records The survey is conducted by state workforce agencies in
cooperation with the BLS The survey has been underway since 1939 and provides one of the
more continuous statistical series on employment and earnings in the US Coverage includes
non-farm payroll employment in over 600 industries including major divisions and more
detailed industry levels
The CES yields important economic indicators including employment levels earnings trends
and average weekly hours worked These data are of value to policymakers who monitor overall
economic performance Planners and analysts use this information to develop business plans and
strategies including cost projections and wage negotiations
CES employment data represent the number of covered workers who worked during or received
pay for the pay period that includes the 12th
of the month Excluded are members of the armed
forces the self-employed proprietors domestic workers unpaid family workers and railroad
workers covered by the railroad unemployment insurance system
The Quarterly Census of Employment and Wages (QCEW)
QCEW is a program that produces comprehensive employment and wage data by industry and
county and state for workers covered by unemployment insurance (UI) laws The QCEW
program also known as the ES-202 program is a cooperative program involving the BLS and
the state workforce agencies (SWAs) QCEW includes data on the number of establishments
DRAFT ANNUAL UPDATE February 2010 - 9 -
monthly employment and quarterly wages by industry at the 6-digit NAICS level by county
by ownership sector for the entire US for each state and for the District of Columbia Puerto
Rico and the US Virgin Islands
The QCEW program produces a virtual economic census of employment and wages each
quarter It is based on quarterly contribution reports from the more than eight million employers
subject to state and federal unemployment insurance laws This wide base of reported data
supports the publication of monthly employment and quarterly wage information by 6-digit
NAICS at the national state and county levels At the national level the QCEW program
publishes employment and wage data for nearly every 6-digit NAICS as well as for each
industry aggregate between the base 6-digit level and the all-industry total level
QCEW wages represent total compensation paid during the calendar quarter regardless of when
services were performed As a total compensation measure QCEW wages also include non-
wage cash compensation such as tips bonuses and in many states exercised stock options
Data from the QCEW program serve as important input to many BLS programs The QCEW
data are used as the benchmark source for employment by the Current Employment Statistics
(CES) program and the Occupational Employment Statistics (OES) program The UI
administrative records collected under the QCEW program serve as a sampling frame for other
BLS establishment surveys In addition data from the QCEW program serve as input to other
federal and state programs The Bureau of Economic Analysis (BEA) of the Department of
Commerce uses QCEW data as the base for developing the wage and salary component of
personal income The Department of Laborlsquos ETA and the SWAs use QCEW data to administer
the employment security program The QCEW data accurately reflect the extent of coverage of
the state UI laws and are used to measure UI revenues national state and local area
employment and total and UI taxable wage trends
The Local Area Unemployment Statistics (LAUS)
This program produces monthly and annual employment unemployment and labor force data
for census regions and divisions states metropolitan areas small labor market areas counties
and many cities by place of residence The LAUS program is a federal-state cooperative effort
in which monthly estimates of total employment and unemployment are prepared for
approximately 6900 areas These estimates are key indicators of local economic conditions
The BLS is responsible for the concepts definitions technical procedures validation and
publication of the estimates that state workforce agencies prepare under agreement with BLS
Local area unemployment statistics are perhaps the best known and most widely used labor
market information product Monthly media reports draw attention to the state of economic
health using measures of employment and unemployment These statistics are also used by
federal programs for determining funding allocations to states and areas as well as eligibility
determinations for assistance State and local governments use the estimates for planning and
budgetary purposes and to determine the need for local employment and training services
Private industry researchers the media and other individuals use the data to assess localized
labor market developments and make comparisons across areas
DRAFT ANNUAL UPDATE February 2010 - 10 -
The Occupational Employment Statistics (OES)
This program produces employment and wage estimates for about 800 occupations These are
estimates of the number of people employed in certain occupations and estimates of the wages
paid to them The OES program produces these occupational estimates by geographic area and
by industry Estimates based on geographic areas are available at the National State and
Metropolitan Area levels Estimates based on industry are available for over 450 industry
classifications at the national level The industry classifications correspond to the sector 3 4
and 5-digit North American Industry Classification System (NAICS) industrial groups
The OES program collects its data using a mail survey sent to establishments in May and
November of each year The OES program surveys approximately 200000 establishments per
survey cycle taking three years to fully collect the sample of 12 million establishments Self-
employed persons are not included in the estimates
The OES survey is a federal-state cooperative program between the BLS and SWAs BLS
provides the procedures and technical support draws the sample and produces the survey
materials while the SWAs collect the data from establishments Occupational employment and
wage rate estimates at the national level are produced by BLSndashWashington using data from the
50 states and the District of Columbia Employers who respond to stateslsquo requests to participate
in the OES survey make these estimates possible
OES wage and employment estimates have a wide variety of uses The BLS Occupational
Employment Projections program uses OES employment data to produce national occupational
employment projections Employment data are also used by the states to produce state and local
area employment projections Wage data are an important input in the determination of the
prevailing wage for use in Alien Labor Certification OES employment and wage estimates are
also a valuable commodity to the general public whether the data are assembled in the BLS
Occupational Outlook Handbook released across the country in various occupational
information systems or released to the public through the OES publication and website
The Mass Layoff Statistics (MLS)
This program is a federal-state cooperative statistical effort which uses a standardized automated
approach to identify describe and track the effects of major job cutbacks using data from each
statelsquos UI database Establishments that have at least 50 initial claims for UI filed against them
during a consecutive five-week period are contacted by state agencies to determine whether
those separations are of at least 31 days duration and if so information is obtained on the total
number of persons separated the reasons for these separations and recall expectations
Establishments are identified according to industry classification and location and UI claimants
are identified by such demographic characteristics as age race sex ethnic group and place of
residence The program yields information on an individuallsquos entire period of unemployment to
the point when regular UI benefits are exhausted It provides databases of establishments and
claimants both of which are used for further research and analysis
MLS are used to determine sub-state allocations of federal funds for the dislocated workers
program analysis of ailing industries or geographic areas identification of the causes and scope
of worker dislocation in terms of the human and economic costs and the characteristics of
DRAFT ANNUAL UPDATE February 2010 - 11 -
dislocated workers Data are also used for the development of workforce plans and labor market
analysis and in assisting employers andor workers at the local level through the analysis of the
potentially available labor supply
The Job Openings and Labor Turnover Survey (JOLTS)
This program produces a new monthly study that has been developed to address the need for data
on job openings hires and separations Estimates from the JOLTS program are not seasonally
adjusted therefore comparisons of JOLTS estimates should be based on the same month in
different years These data serve as a demand-side indicator of labor shortages at the national
level Prior to JOLTS there was no economic indicator of the unmet demand for labor with
which to assess the presence or extent of labor shortages in the US The availability of unfilled
jobs (the ―job openings rate) is an important measure of the tightness of job markets parallel to
existing measures of unemployment Data from a sample of approximately 16000 US business
establishments are collected by the BLS through the Atlanta JOLTS Data Collection Center The
JOLTS survey covers all non-agricultural industries in the public and private sectors for the 50
states and the District of Columbia JOLTS collects data on total employment job openings
hires quits layoffs and discharges and other separations
The JOLTS survey is used for national economic policy analysis including a deeper examination
of business cycles It provides a more dynamic look at labor market performance to aid
economic research and planning including the analysis of education and job training issues
The Survey of Employer-Provided Training
Subject to funding availability the BLS also conducts specialized studies related to labor market
performance and workforce challenges facing the US economy Such studies are conducted
over a limited period of time and yield important topical findings One such survey was initially
conducted in September of 1993 The 1993 Survey of Employer-Provided Training provided
baseline information on the nature and existence of formal training provided or financed by
employers Nearly 12000 private establishments of all sizes were surveyed to determine what
types of formal training were provided during 1993 The 1995 Survey of Employer-Provided
Training provided information on the amount of formal and informal training provided by
employers as well as the amount employers spent on selected costs of training This survey was
conducted during personal visits to more than 1000 private establishments with 50 or more
employees from May through October 1995 A representative of the establishment provided
information on the hours and costs of formal training and randomly selected individual
employees provided information on their hours of both formal and informal training
The National Longitudinal Surveys (NLS)
A set of surveys designed to gather information at multiple points in time on the labor market
activities and other significant life events of several groups of men and women For more than
three decades NLS data have served as a tool for economists sociologists and other researchers
in analyzing how individuals fare and perform in the labor market over time Multiple cohorts
have been surveyed The NLS of Youth 1997 is a survey of young men and women born in the
years 1980-84 respondents were ages 12-17 when first interviewed in 1997 The NLS of Youth
1979 is a survey of men and women born in the years 1957-64 respondents were ages 14-22
when first interviewed in 1979 The NLS of 1979 Children and Young Adults is a survey of the
DRAFT ANNUAL UPDATE February 2010 - 12 -
biological children of women that were interviewed in the 1979 survey The NLS of Young
Women and Mature Women include women who were ages 14-24 when first interviewed in
1968 The Mature Womenlsquos survey includes women who were ages 30-44 when first
interviewed in 1967 These surveys are now conducted simultaneously in odd-numbered years
The NLS of Young Men and Older Men which was discontinued in 1981 include men who
were ages 14-24 when first interviewed in 1966 The Older Menlsquos survey which was
discontinued in 1990 includes men who were ages 45-59 when first interviewed in 1966 The
data available from these surveys provide a dynamic picture of how various groups fare in the
labor market over time At a time of rapid technological change and large-scale worker
dislocations monitoring the labor market experiences of different groups including exits and
entry earnings records and other aspects of labor market behavior becomes a critically
important dimension of workforce analysis
The Current Population Survey (CPS)
The CPS is a monthly survey of approximately 60000 households conducted by the Census
Bureau for the BLS It provides a comprehensive body of data on the labor force employment
unemployment and persons not in the labor force The survey covers the employment status of
the civilian non-institutional population 16 years and over by age sex race Hispanic origin
marital status family relationship veteran status women maintaining families working women
with children and educational attainment It looks at employed persons by occupation industry
class of worker hours of work full- or part-time status and reasons for working part-time Also
included are employed multiple jobholders by occupation industry numbers of jobs held and
full- or part-time status of multiple jobs The survey collects information about unemployed
persons by occupation industry class of worker of last job duration of unemployment reason
for unemployment and methods used to find employment To better gauge labor force potential
the survey includes discouraged workers and other persons not in the labor force
Special topics such as the labor force status of particular subgroups of the population (e g
displaced workers and disabled veterans) are also covered Data are also available on work
experience occupational mobility job tenure and school enrollment of workers Information is
provided on weekly and hourly earnings by detailed demographic group occupation education
union affiliation and full- and part-time employment status
The CPS is among the most comprehensive and current sources of information about the
performance of labor markets and the status of the workforce
The National Compensation Survey (NCS)
This survey provides comprehensive measures of occupational earnings trends in the costs of
employee compensation benefit incidence and detailed benefit plan provisions Estimates of
hourly weekly and annual earnings are available for up to 450 occupations in 80 metropolitan
areas 9 census geographic regions and the nation The Employment Cost Index component of
the NCS measures changes in employee compensation Separate estimates are produced to
account for seasonal fluctuations in the data The Employer Cost for Employee Compensation
component of the NCS measures the average hourly employer costs for the total compensation
packages of their employeesmdashwages and salaries and separately for employee benefits The
NCS estimates of benefit incidence measure the proportion of employees covered by most
DRAFT ANNUAL UPDATE February 2010 - 13 -
recognized employee benefit programs and the detailed benefit provision estimates describe the
plan features in force for most major benefits such as paid leave disability health and
retirement benefits All estimates are produced annually except the Employment Cost Index and
the Employer Cost for Employee Compensation which are produced quarterly
The Employment Projections (EP)
The EP program analyzes historical data and information from secondary sources and biennially
prepares projections 10 years into the future at the national level covering the future size and
composition of the labor force aggregate economic growth detailed estimates of industrial
production and industrial and occupational employment These data are a basis for developing
estimates of occupational requirements by industry evaluating the future size and quality of the
labor force and a framework for analyzing future problems of labor utilization
In addition the program produces the National Employment Matrix a unique tool that quantifies
detailed information on the distribution of occupational employment by class of worker and
industry for current and projected years Data are available for nearly 700 detailed occupations
in over 250 detailed industries that are inclusive of the entire economy Data uses include
analysis of various government and private expenditure programs in terms of their impacts on
industry and occupational employment analysis of changes in the occupational structure of
detailed industries resulting from changes in technology product mix and other factors
development of projections of occupational employment for detailed occupations by industry
and development of state and local area industry-occupation employment matrices
The program produces the Occupational Outlook Handbook Occupational Outlook Quarterly
Occupational Projections and Training Data and Career Guide to Industries biennial
publications that serve a wide variety of users seeking labor market and career-related
information Additionally technical analyses of the projections and of selected facets of the
projections database appear in the Monthly Labor Review
US Department of Labor Bureau of Labor Statistics httpwwwblsgov
URL Reference 1
DRAFT ANNUAL UPDATE February 2010 - 14 -
Employment and Training Administration
The mission of the Employment and Training Administration is to contribute to the more
efficient functioning of the US labor market by providing high quality job training
employment labor market information and income maintenance services primarily through state
and local workforce development systems On behalf of American taxpayers the Employment
and Training Administration administers programs that have at their core the goals of enhanced
employment opportunities and business prosperity
US Department of Labor Employment and Training Administration httpwwwdoletagov
URL Reference 2
ONET OnLine ONET Online is an application that was created under a grant from the US Department of
Labor to provide broad access to the ONET database of occupational competencies including
information on knowledge skills abilities tasks work activities interests and work values
associated with occupations This information can be used to facilitate career exploration
vocational counseling and a variety of human resources functions such as developing job
orders position descriptions and aligning training with current workplace needs
Information in ONET is available for over 800 occupations ONET occupational titles and
codes are based on the 2000 Standard Occupational Classification (SOC) system which is also
used for employment and wage statistics The ONET database and data collection survey is a
unique powerful source for continually updated occupational information and labor market
research By using a contemporary interactive skills-based database and a common language to
describe worker skills and attributes the ONET system provides comprehensive searchable
skills information that can be and is adapted for many uses
DRAFT ANNUAL UPDATE February 2010 - 15 -
Businesses and human resources professionals use ONET information to develop effective job
descriptions expand the pool of quality candidates for open positions define employee andor
job-specific success factors align organizational development with workplace needs refine
recruitment and training goals and design competitive compensation and promotion systems
Students and job seekers use ONET information to find out which jobs fit with their interests
skills and experience explore growth career profiles using the latest available workforce
information research what it takes to get jobs maximize earning potential and job satisfaction
and know what is required to be successful in their field
ONET OnLine functionality includes occupational exploration search for occupations that use
your skills look at related occupations view occupation summaries and details use crosswalks
to find corresponding occupations in other classification systems and connect to other on-line
career information resources
Occupational Information Network Resource Center httpwwwonetcenterorg URL Reference 3
Links to State Workforce and Labor Market Information Websites and Portals
For more information about information services and products produced by the state workforce
agency labor market information shops interested parties should visit the following URL
Americarsquos Career Information Network - State Labor Market Information Pages
httpwwwacinetorgacinetcrllibraryaspxPostVal=10ampCATID=52
DRAFT ANNUAL UPDATE February 2010 - 16 -
US Department of Commerce Census Bureau
US Department of Commerce Census Bureau
Targeted Users
Survey Name
S
urv
ey o
f In
com
e an
d
P
rog
ram
Par
tici
pat
ion
N
atio
nal
Em
plo
yer
S
urv
ey
L
on
git
ud
inal
E
mp
loy
er H
ou
seho
ld
D
yn
amic
s S
urv
ey
E
con
om
ic C
ensu
s
A
mer
ican
Co
mm
un
ity
S
urv
ey
D
ecen
nia
l C
ensu
s o
f
P
op
ula
tio
n
Fed
eral
Ass
ista
nce
Aw
ard
Dat
a S
yst
em
Employers
Government Agency
Federal State or Local
Elected Officials and
Policymakers
Program Planners
Education and Training
Providers
Intermediaries
Individuals
Researchers
DRAFT ANNUAL UPDATE February 2010 - 17 -
US Department of Commerce Census Bureau
Indicators
Survey Name
S
urv
ey o
f In
com
e an
d
P
rog
ram
Par
tici
pat
ion
Nat
ion
al E
mp
loy
er
Su
rvey
Lo
ng
itu
din
al
Em
plo
yer
Ho
use
ho
ld
Dy
nam
ics
Su
rvey
Eco
no
mic
Cen
sus
A
mer
ican
Co
mm
un
ity
S
urv
ey
Dec
enn
ial
Cen
sus
of
P
op
ula
tio
n
Fed
eral
Ass
ista
nce
Aw
ard
Dat
a S
yst
em
Hours WorkedPayroll Hours
Earnings Trends
Unemployment Records ndash
Mass Layoffs
Labor Force Data
Labor Market Information
Employment
Wages Income Earnings
Future Demand and Hiring Trends
EducationTraining Information about
Providers and Career Advancement
Occupational Information
Skill Requirements
Program Participation
Information about Full- and Part-Time
Workers Contract Workers and the
Self-Employed
Unions
Information about Employers by
Company Size or Characteristics
Membership or Subscription Required
RecruitingStaffing Industry
Information
Occupational Licensing Information
Benefit Information
Information about Workforce
Commuting Patterns
DRAFT ANNUAL UPDATE February 2010 - 18 -
US Department of Commerce
Along with the Department of Labor the Department of Commerce holds major responsibilities
for collecting and disseminating economic and demographic information The Departmentlsquos
Economics and Statistics Administration (ESA) is the agency within Commerce and the
Executive Branch where information related to economic and societal change is collected and
reported ESA describes its mission (1) help maintain a sound federal statistical system that
monitors and measures Americalsquos rapidly changing economic and social arrangements
(2) improve understanding of the key forces at work in the economy and the opportunities they
create for improving the well-being of Americans (3) develop new ways to disseminate
information using the most advanced technologies and (4) support the information and analytic
needs of the Commerce Department the Executive Branch and Congress ESA includes two
major statistical organizations the Bureau of Economic Analysis (BEA) and the Census Bureau
are two essential elements of the federal statistical system
Bureau of Economic Analysis (BEA) is a federal statistical agency that combines and
transforms economic data from government and private sources into a consistent and
comprehensive picture of economic activity BEA is the accountant for the national economy
developing measures and systems for collecting and interpreting vast amounts of diverse data
including data related to trade exports labor markets the workforce and workforce places
Drawn together BEA statistics and analyses provide a comprehensive picture of US economic
activity on regional national and international bases The economic accounts managed by BEA
and basic measures such as Gross Domestic Product (GDP) form the core of the federal
statistical system Data from BEA are critical to sound economic decisions by businesses
individuals state and local governments and federal institutions such as the Treasury
Department and the Federal Reserve
The Census Bureau is the primary source of information about people and the economy The
Bureau conducts large-scale surveys and censuses providing the nationlsquos official measures for
income poverty and health insurance coverage It also supplies key economic indicators
including housing starts retail and wholesale trade sales international trade manufacturerslsquo
shipments orders and quarterly estimates of corporate profits While the Bureaulsquos most visible
function is focused on conducting the decennial census that produces the widest range of
information available at the smallest geographic level it also fields over 35 regular demographic
surveys and is responsible for collecting the nationlsquos most detailed picture of businesses through
the County Business Patterns and the Economic Censuses
DRAFT ANNUAL UPDATE February 2010 - 19 -
U S Department of Commerce httpwwwcommercegov URL Reference 4
Key surveys and data sources yielding important workforce and labor market information
include the following
Survey of Income and Program Participation (SIPP) The main objective of SIPP is to provide accurate and comprehensive information about the
income and program participation of individuals and households in the US and about the
principal determinants of income and program participation SIPP offers detailed information on
cash and non-cash income on a sub-annual basis The survey also collects data on taxes assets
liabilities and participation in government transfer programs SIPP data allow the government
to evaluate the effectiveness of federal state and local programs
SIPP collects source and amount of income labor force information program participation and
eligibility data and general demographic characteristics to measure the effectiveness of existing
federal state and local programs to estimate future costs and coverage for government
programs such as food stamps and to provide improved statistics on the distribution of income
in the country
The survey design is a continuous series of national panels with sample sizes ranging from
approximately 14000 to 36700 interviewed households The duration of each panel ranges
from 2 12 years to 4 years The SIPP sample is a multi-stage stratified sample of the US
civilian non-institutionalized population For the 1984-1993 panels a panel of households was
introduced each year in February A 4-year panel was introduced in April 1996 A 2000 panel
was introduced in February 2000 for two waves A 3-year 2001 panel was introduced in
February 2001
The SIPP content is built around a core of labor force program participation and income
questions designed to measure the economic situation of persons in the US These questions
DRAFT ANNUAL UPDATE February 2010 - 20 -
expand the data currently available on the distribution of cash and non-cash income and are
repeated at each interviewing wave The survey uses a four-month recall period with
approximately the same number of interviews being conducted in each month of the four-month
period for each wave Interviews are conducted by personal visit and by decentralized telephone
The survey has been designed also to provide a broader context for analysis by adding questions
on a variety of topics not covered in the core section Topics covered by the modules include
personal history childcare wealth program eligibility child support disability school
enrollment taxes and annual income All household members 15 years old and over are
interviewed by self-response if possible proxy response is permitted when household members
are not available for interviewing
The National Employer Survey
This Survey provides information on worker education employer training and employer
business characteristics including business productivity The survey is congressionally
authorized and provides for voluntary responses The National Center on the Educational
Quality of the Workforce (EQW) a non-profit research group fully funds the survey
US manufacturing and non-manufacturing establishments with 20 or more employees except
agriculture and government establishments are included Data were collected on four topics
employees and employment employee training business characteristics and equipment and
technology Employees and employment included number of employees work week pay
benefits supervision hiring practices and union representation Employee training included
organization purposes formal and informal programs duration trainees and effectiveness
Business characteristics included the year operations began company and establishment size
principal product and exports Equipment and technology included capital assets recent
investments age of equipment use of computers and research activities
A major finding was that in the early 1990lsquos increased worker training and education raised
business productivity more than comparably increased hours worked or capital equipment The
First Findings report was released by the EQW about 13 months after the survey reference year
(7 months after data collection was completed) It included data on worker education and
workplace training and employer views on education adequacy and hiring practices
Contribution to the Productivity of Establishments report was released by EQW about 17 months
after the reference year It included data on the relationship between worker education and
business productivity and the comparative productivity contributions of increased hours and
capital investment Another major report by EQW is scheduled for release about 20 months after
the reference year It will include the complete results from the regression models of studied
activities by establishment size
Education human services and economic policy agencies use the study results to assess what
kinds of education and training most affect business productivity and encourage actions and
develop initiatives that increase productivity Employer businesses and industry associations use
the results to assess existing and potential company and industry practices and take actions that
will increase business productivity profitability and international competitiveness The survey
provided first-ever US statistics that relate education training and hiring practices to business
DRAFT ANNUAL UPDATE February 2010 - 21 -
productivity Results from the survey will be linked to a five-year study of the American
workplace and coordinated with World Bank-sponsored studies in other countries
U S Census Bureau httpwwwcensusgov URL Reference 5
Local Employment Dynamics (LED)
The LED program is an innovative federalstate partnership between the Census Bureau and 45
states This program responds to the increasing demand for detailed local information by
combining datasets to provide new information about employment and earnings dynamics at the
county and sub-county level The Census Bureau integrates state-supplied administrative data
sets (Quarterly Census of Employment and Wages and wage records) with Census Bureau
demographic information to provide deeper insights about both sides of the economymdashworkers
and firmsmdashand the dynamic interaction of the two States receive 29 indicators for each county
and major industry for each quarter
LED data are disseminated through three data tools that can be accessed from the Census
Bureaulsquos Web site at (httplehddidcensusgovleddatatoolsdatatoolshtml) The Quarterly
Workforce Indicators Industry Focus and OnTheMap data tools are described below
Quarterly Workforce Indicators (QWIs) Online
The Quarterly Workforce Indicators are derived from businesses quarterly reports of
unemployment insurance wages and tax reports The Census Bureau merges the data from the
states with current demographic information to produce 29 workforce force indicators and
publishes eight of them in QWI Online The eight indicators include total employment measures
of change such as job flow new hires separations and average earnings The additional 21
indicators are provided directly to the states for research and analysis The same 29 indicators
are produced for all states in the partnership providing a useful data frame for comparison Each
of the states represented in the QWI Online currently has data beginning in 2001 through the
DRAFT ANNUAL UPDATE February 2010 - 22 -
second quarter of 2006 Each quarter the data are refreshed and are current to about nine months
after the end of the quarter
Industry Focus
The LED Industry Focus is a powerful analytic tool that quickly reports the top industries in an area age
and gender of the workforce based on eight quarterly workforce indicators
bull employment
bull growth in employment
bull growth in hiring
bull number of new hires
bull firm job change
bull average monthly earnings for all workers
bull growth in average monthly earnings for all workers
bull average monthly earnings for new hires
DRAFT ANNUAL UPDATE February 2010 - 23 -
LED ldquoOnTheMaprdquo
OnTheMap is a web-based interactive mapping application The objective is to show where
people work and where workers live on maps with companion reports on their age earnings
industry distributions and local workforce indicators The user can select a geographic area and
answer Travel Pattern questions such as
Where do workers live that are employed in the area
What are the workplace destinations for workers living in the selected community or
neighborhood
How do the employment areas compare in terms of worker origin-destination patterns
workerslsquo ages monthly earnings and industry
How are these areas changing over time
OnTheMap provides timely data for labor market economic development transportation
emergency management and other potential applications The travel patterns are displayed at the
census block level and the profile reports are produced at the census block group level The
application also includes analytical tools that answer questions such as
Concentric Ring Analysis How many jobs are located within five ten or twenty miles of
a planned employment training center or transit stop
Paired Area Analysis How many workers live along a transit corridor and work
downtown or in some other area along the same corridor
OnTheMap provides information on census-block-to-census-block travel patterns and on the
characteristics of workers and firms in each work and home area on an annual basis
OnTheMap data are created by integrating unemployment insurance wage records and ES-202
establishment records covering about 98 percent of all private non-farm employment
Confidentiality is strictly protected at all detailed geographic levels through the use of state-of-
DRAFT ANNUAL UPDATE February 2010 - 24 -
the-art disclosure avoidance methods that do not suppress the information for any of the
categories
The US Census Bureau released OnTheMap Version 32 on December 15 2008 incorporating
new features and data covering 46 LED partner states highlighted on the map below Version
32 provides several application enhancements including Addition of 2005 and 2006 data to
2002-2004 data already available in version 2 the addition of New York State to the database for
the first time and additional rollups for labor and commute shed analyses
The Economic Census
The Economic Census profiles the US economy every five years from the national to the local
level The Census Bureau sent questionnaires to more than five million businesses across the
nation in December 2002 launching the 2002 Economic Census The economic census produces
widely used business statistics and is the primary benchmark for measuring 96 percent of the
GDP Firms in more than 1000 industries are being asked to report information that will be kept
confidential about their operations including the number of employees the annual payroll and
the value of goods and services provided during Calendar Year 2002 In addition to the Federal
Reserve and other federal agencies state and local officials use economic census data to design
programs that promote business development The private sector uses the data for activities such
as developing business plans calculating market share and evaluating new business
opportunities
Data covering Calendar Year 2002 will be collected and processed during 2003 and the first data
will be released in early 2004 Ultimately the economic census will yield more than 1600
reports and data products for states counties places and some ZIP codes areas
E-commerce will be measured for all industries Information will be provided on business
supply-chain functions Businesses with ―leased employees (those who contract their personnel
function) will be included Data will be shown for more than 85 additional service industries by
North American Product Classification System codes There will be direct comparability with
North American Industry Classification System sectors in the 1997 Economic Census
DRAFT ANNUAL UPDATE February 2010 - 25 -
The American Community Survey
This survey is a new approach for collecting accurate timely information needed for critical
government functions This new approach provides accurate up-to-date profiles of Americas
communities every year Community leaders and other data users have timely information for
planning and evaluating public The American Community Survey collects data from a sample
of 3 million households each year in every county and American Indian and Native Alaska area
as well as in the Hawaiian Homelands and Puerto Rico The American Community Survey will
provide the same sort of data as the census long form updated every year With a nationwide
sample of 3 million addresses the American Community Survey provides demographic social
economic and housing profiles annually for areas and subgroups with 65000 or more people For
communities of less than 65000 it will take 3 to 5 years to accumulate enough samples to
provide estimates similar to the quality of the census long form
Decennial Census The Decennial Census is the largest data collection effort undertaken by the US government
gathering detailed information about the 1159 million housing units and 2814 million people
across the United States The Census offers users detailed socio-economic data about individuals
and households including information about labor force status and occupational employment
commute to work patterns and a variety of additional details related to the workforce and labor
markets Census data is available in a variety of formats and media including the Internet CD-
ROMs DVDs and printed reports
US Census Bureau httpwwwcensusgov
URL Reference 6
Federal Assistance Award Data System for Federal State and Local Governments
(FAADS)
DRAFT ANNUAL UPDATE February 2010 - 26 -
After the close of each quarter of the Federal fiscal year the Census Bureaulsquos Federal Assistance
Award Data System (FAADS) produces a file of standardized data records on all types of
financial assistance awards made by Federal agencies to all types of recipients during the
indicated quarter Each Federal fiscal year begins on October 1 of one calendar year and ends on
September 30 of the year indicated
Each transaction record identifies by the Catalog of Federal Domestic Assistance (CFDA)
program code number and name the type and amount of financial assistance the type and
location of the recipient and the geographic place of performance The recipient name and other
selected data fields are blank in county-are summary records
The recipient location and place of performance are identified by name and by the geographic
code for the stateterritory county area andor place The Federal agency that made each award
is identified by code and by name Programs not listed in the Catalog are identified by a
similarly constructed pseudocode Each record also contains information on the date of the
transaction as well as the scheduled start date and end date of the project or the award
Federal Assistance Award Data System httpwwwcensusgovgovswwwfaadshtml
URL Reference 7
The Bureau of Economic Analysis (BEA) is another agency of the Department of Commerce
Along with the Census Bureau BEA is part of the Departments Economics and Statistics
Administration BEA promotes a better understanding of the US economy by providing the
most timely relevant and accurate economic accounts data in an objective and cost-effective
manner
BEA produces economic accounts statistics that enable government and business decision-
makers researchers and the American public to follow and understand the performance of the
DRAFT ANNUAL UPDATE February 2010 - 27 -
Nations economy To do this BEA collects source data conducts research and analysis
develops and implements estimation methodologies and disseminates statistics to the public
BEA produces some of the most closely watched economic statistics that influence the decisions
made by government officials business people households and individuals BEAs economic
statistics which provide a comprehensive up-to-date picture of the US economy are key
ingredients in critical decisions affecting monetary policy tax and budget projections and
business investment plans The cornerstone of BEAs statistics is the national income and
product accounts (NIPAs) which feature the estimates of gross domestic product (GDP) and
related measures
Today BEA prepares national regional industry and international accounts that present
essential information on such key issues as economic growth regional economic development
inter-industry relationships and the Nations position in the world economy
Bureau of Economic Analysis httpbeagov
URL Reference 8
US Department of CommerceEconomic Development Administration
The Economic Development Administration (EDA) was established under the Public Works
and Economic Development Act of 1965 (42 USC sect 3121) as amended to generate jobs help
retain existing jobs and stimulate industrial and commercial growth in economically distressed
areas of the United States EDA assistance is available to rural and urban areas of the Nation
experiencing high unemployment low income or other severe economic distress
In fulfilling its mission EDA is guided by the basic principle that distressed communities must
be empowered to develop and implement their own economic development and revitalization
strategies Based on these locally and regionally-developed priorities EDA works in partnership
with state and local governments regional economic development districts public and private
DRAFT ANNUAL UPDATE February 2010 - 28 -
nonprofit organizations and Indian tribes EDA helps distressed communities address problems
associated with long-term economic distress as well as sudden and severe economic dislocations
including recovering from the economic impacts of natural disasters the closure of military
installations and other Federal facilities changing trade patterns and the depletion of natural
resources
EDA offers several investment programs to support or provide technical and other assistance to
communities These programs cover Research and Technical Assistance Local Technical
Assistance Planning University Center Economic Development and Trade Adjustment
Assistance for Firms Links to research reports ―tools of the trade and cluster-based economic
development are also available on the EDA Web site
Economic Development Administration httpwwwedagov
URL Reference 9
EconDataNet
EconDataNet is sponsored by the Economic Development Administration as a service to
regional data users The Web site is designed to help practitioners researchers students and
other data users quickly gain access to relevant state and sub-state socioeconomic data The site
aims to be a convenient comprehensive first stop for anyone searching among the vast disparate
array of public and private data sources on the Web
EconDataNet is divided into eight parts
Links by Subject (over 750 links to individual economic data sources from federal state and
private sources sorted into ten subject categories)
Links by Provider (the same links sorted by the organization or agency that produced them --
for instance regional data available from the Census Bureau)
Whats New (where users can access the latest or archived editions of StatScan the sitelsquos free
monthly newsletter )
DRAFT ANNUAL UPDATE February 2010 - 29 -
Ten Best Sites (EconDataNetlsquos selection of user-friendly sites that offer the widest selection
of data including several that generate customized tables and graphs)
Data Collections (150 Web sites that provide multiple data series usually from a variety of
sources including on-line data collections on-line versions of statistical compendia --like the
US Statistical Abstract data search engines micro-data tools and GIS mapping resources
also includes data collection links to local data intermediaries ndash such as the Census Data
Centers and university business and economic research centers -- that can help users obtain
understand and analyze data for your area)
Quick Links (EconDataNetlsquos ―links by subject without annotation on one condensed quick-
loading page which allow users who know what they want to get there quickly or gain a fast
sense of available data sources across categories)
Registration (allows EconDataNet users access to StatScan which profiles a site of the
month new additions to EconDataNet and other relevant data news and
EconDataNetlsquos Users Guide (a free 100-page Complete Dummies guide to finding and
using economic data to understand your regional economy)
EconDataNet httpwwwEconDataNet
URL Reference 11
TradeStats Express
TradeStats Express displays in maps graphs and tables the annual US merchandise trade
statistics (exports imports and trade balances) at the national and state levels It is divided into
two main sections National Trade Data and State Export Data
The National Trade Data are available as full year totals and Year-To-Current-Quarter for recent
years Data are available for individual countries tradeeconomic groups or geographic regions
You can tabulate these statistics using any of three product classification systems Harmonized
Commodity Coding System (HS) North American Industry Classification System (NAICS) or
Standard International trade Classification (SITC) You can choose to display the data for
exports imports or balance of trade
DRAFT ANNUAL UPDATE February 2010 - 30 -
The National Trade Data section offers two options
Global patterns of US merchandise trade
Product profiles of US merchandise trade with a selected market
The State Export Data are available as full year totals and Year-To-Current-Quarter for recent
years Data are available for individual states or US regions Products are classified in industry
groups corresponding to NAICS two-digit codes
The State Export Data section offers three options
Global patterns of a States exports
State-by-State exports to a selected market
Export product profile to a selected market
TradeStats Express httptseexportgov
URL Reference 12
US Patent and Trademark Office
US Patent and Trademark Office a database that includes information about all US patents
(including utility design reissue plant patents and SIR documents) from the first patent issued
1790 to the most recent issue week Patents from 1790 through 1975 are searchable only by
Issue Date Patent Number and Current US Classification while patents issued after 1976 are in
a separate database allowing a narrower more focused search Patents are divided into many
fields such as inventor name inventor city state or country and description or specification and
searches may include a date range The results of a search provide the abstract and the full
description of the invention
DRAFT ANNUAL UPDATE February 2010 - 31 -
U S Patents and Trademarks httpwwwusptogovpatftindexhtml
URL Reference 10
US Department of Defense
Defense Manpower Data Center (DMDC)Statistical Information Analysis Division
The Defense Manpower Data CenterStatistical Information Analysis Division maintains the
largest archive of personnel manpower and training data in the Department of Defense
DMDCs statistical activities include the personnel survey program an enlistment testing
program to support screening of military applicants and a client support program to provide
statistical support to the Office of the Secretary of Defense
DRAFT ANNUAL UPDATE February 2010 - 32 -
DoD Personnel and Procurement Statistics httpsiadappdmdcosdmilindexhtml
URL Reference 13
Office of Economic Adjustment (OEA)
The OEA is the Department of Defenses primary source for assisting communities that are
adversely impacted by Defense program changes including base closures or realignments base
expansions and contract or program cancellations To assist affected communities OEA
manages and directs the Defense Economic Adjustment Program and coordinates the
involvement of other Federal Agencies
Economic adjustment assistance provides a community-based context for assessing economic
hardships caused by DoD program changes by identifying and evaluating alternative courses of
action identifying resource requirements and assisting in the preparation of an adjustment
strategy or action plan to help communities help themselves
Office of Economic Adjustment httpwwwoeagovOEAWebnsfhomereadform
URL Reference 14
DRAFT ANNUAL UPDATE February 2010 - 33 -
US Small Business Administration
Targeted Users
Survey Name
Sm
all
Bu
sin
ess
Eco
no
mic
Ind
icat
ors
Ch
arac
teri
stic
s o
f
Sm
all
Bu
sin
ess
Ow
ner
s an
d
Em
plo
yer
s
Fir
m S
ize
Dat
a b
y
Lo
cati
on
and
Ind
ust
ry
Employers
Government Agency
Federal State or Local
Elected Officials and Policymakers
Program Planners
Education and Training Providers
Intermediaries
Individuals
Researchers
DRAFT ANNUAL UPDATE February 2010 - 34 -
US Small Business Administration
Indicators
Survey Name
Sm
all
Bu
sin
ess
Eco
no
mic
Ind
icat
ors
Ch
arac
teri
stic
s o
f
Sm
all
Bu
sin
ess
Ow
ner
s an
d
Em
plo
yer
s
Fir
m S
ize
Dat
a b
y
Lo
cati
on
and
Ind
ust
ry
Hours WorkedPayroll Hours
Earnings Trends
Unemployment Records ndash
Mass Layoffs
Labor Force Data
Labor Market Information
Employment
Wages Income Earnings
Future Demand and Hiring Trends
EducationTraining Information about
Providers and Career Advancement
Occupational Information
Skill Requirements
Program Participation
Information about Full- and Part-Time
Workers Contract Workers and the
Self-Employed
Unions
Information about Employers by
Company Size or Characteristics
Membership or Subscription Required
RecruitingStaffing Industry
Information
Occupational Licensing Information
Benefit Information
Information about Workforce
Commuting Patterns
DRAFT ANNUAL UPDATE February 2010 - 35 -
US Small Business Administration
The SBA is charged with aiding counseling assisting and protecting the interests of small
business which represent 99 percent of all businesses in the US The SBAlsquos Office of
Economic Research within the Office of Advocacy (wwwsbagovadvo) is the federal
governmentlsquos lead office in analyzing the role and status of small businesses in the economy
This office is the source for small business statistics gathered from various federal sources and
presented in user-friendly formats Internal staff or contractors conduct research to help
determine small businesseslsquo impact on the economy and how they are currently faring The
Office of Economic Research is the leading source of small business data portraying the
characteristics of businesses owners and their workforces Significant surveys and reports
related to the workforce include the following
Small Business Economic Indicators These serve as a quick reference guide to current data on small business activity (new firms
employment income and failures) by state Tables listing indicators for about the last 10 years
by state are included
Characteristics of Small Business Owners and Employees These analyze the demographic characteristics of employees and owners of small businesses
Employee and self-employment data cover the period 1992 to 1996 while the owner data cover
1992
Firm Size Data by Location and Industry Includes the number of employer firms number of establishments employment annual payroll
and receipts The data are presented by location (US state and Metropolitan Statistical Area
(MSA)) and industry by size of firm
Small Business Administration httpwwwsbagovadvoresearch
URL Reference 15
DRAFT ANNUAL UPDATE February 2010 - 36 -
US Department of Agriculture Economic Research Service
The Economic Research Service (ERS) is a primary source of economic information and
research in the US Department of Agriculture With 450 employees ERS conducts a research
program to inform public and private decision making on economic and policy issues involving
food farming natural resources and rural development
ERSs highly trained economists and social scientists conduct research analyze food and
commodity markets produce policy studies and develop economic and statistical indicators The
agencylsquos research program is aimed at the information needs of USDA other public policy
officials and the research community ERS information and analysis is also used by the media
trade associations public interest groups and the general public
The Agencys work is structured among four divisions Food Economics Information Services
Market and Trade Economics and Resource and Rural Economics
ERS staff disseminates economic information and research results through an array of outlets
including
Agency-published research reports market analysis and outlook reports economic briefs and
data products (accessible on the Internet with hard copies available for purchase)
An award-winning magazine Amber Waves covering the entire range of ERS work and
available in print and on the Internet (httpwwwersusdagovAmberWavesAbout)
ERS website which provides access to all ERS products and links users directly with ERS
analysts
Oral briefings written staff analyses and congressionally mandated studies delivered directly
to executive and legislative branch policymakers and program administrators and
Articles in professional journals and papers presented to academic colleagues at conferences
and meetings
DRAFT ANNUAL UPDATE February 2010 - 37 -
USDA Economic Research Service httpwwwersusdagovData
URL Reference 16
DRAFT ANNUAL UPDATE February 2010 - 38 -
US Department of Education National Center for Education Statistics
US Department of Education National Center for Education Statistics
Targeted Users Survey Name
Nat
ion
al A
sses
smen
t
of
Ed
uca
tio
nal
Pro
gre
ss
Nat
ion
al A
sses
smen
t
of
Ad
ult
Lit
erac
y
Inte
gra
ted
Po
st-
Sec
on
dar
y E
du
cati
on
Dat
a S
yst
em
Nat
ion
al H
ou
seh
old
Ed
uca
tio
n S
urv
eys
Pro
gra
m
Dat
a o
n V
oca
tio
nal
Ed
uca
tio
n
(No
t a
Su
rvey
)
Employers
Government Agency
Federal State or Local
Elected Officials and Policymakers
Program Planners
Education and Training Providers
Intermediaries
Individuals
Researchers
DRAFT ANNUAL UPDATE February 2010 - 39 -
US Department of Education National Center for Education Statistics
Indicators
Survey Name
Nat
ion
al A
sses
smen
t
of
Ed
uca
tio
nal
Pro
gre
ss
Nat
ion
al A
sses
smen
t
of
Ad
ult
Lit
erac
y
Inte
gra
ted
Po
st-
Sec
on
dar
y E
du
cati
on
Dat
a S
yst
em
Nat
ion
al H
ou
seh
old
Ed
uca
tio
n S
urv
eys
Pro
gra
m
Dat
a o
n V
oca
tio
nal
Ed
uca
tio
n
(No
t a
Su
rvey
)
Hours WorkedPayroll Hours
Earnings Trends
Unemployment Records ndash
Mass Layoffs
Labor Force Data
Labor Market Information
Employment
Wages Income Earnings
Future Demand and Hiring Trends
EducationTraining Information about
Providers and Career Advancement
Occupational Information
Skill Requirements
Program Participation
Information about Full- and Part-Time
Workers Contract Workers and the
Self-Employed
Unions
Information about Employers by
Company Size or Characteristics
Membership or Subscription Required
RecruitingStaffing Industry
Information
Occupational Licensing Information
Benefit Information
Information about Workforce
Commuting Patterns
DRAFT ANNUAL UPDATE February 2010 - 40 -
The National Center for Education Statistics (NCES) is the primary federal entity for collecting
and analyzing data related to education in the US and other nations NCES is located within the
US Department of Education and the Institute of Education Sciences The NCES fulfills a
congressional mandate to collect collate analyze and report complete statistics on the condition
of American education conduct and publish reports and review and report on education
activities internationally
Education statistics are used for a number of purposes including by business and education and
training institutions concerned with the supply of trained workers coming out of schools and
colleges and also with the subjects that are being taught there NCES statistics are used to
inform the public about matters such as school and college enrollment and expenditures per
student Business organizations use trend data on enrollments and expenditures to forecast the
demand for their products Businesses increasingly dependent on the availability of a highly
skilled workforce use educational data to gauge availability quality and characteristics of the
emerging workforce Achievement test scores numbers of students enrolled in various programs
of study and degrees and credentials awarded are important indicators to be considered in
business location and expansion decisions The economic fortunes of states and regions are
increasingly driven by test scores and the characteristics of human capital investments
Key surveys databases and studies bearing most directly on describing the present and future
workforce include the following
The National Assessment of Educational Progress (NAEP)
Also known as ―the Nationlsquos Report Card this is the only nationally representative and
continuing assessment of what Americalsquos students know and can do in various subject areas
Since 1969 assessments have been conducted periodically in reading mathematics science
writing US history civics geography and the arts
NAEP does not provide scores for individual students or schools instead it offers results
regarding subject-matter achievement instructional experiences and school environment for
populations of students (eg fourth-graders) and subgroups of those populations (eg female
students Hispanic students) NAEP results are based on a sample of student populations of
interest NAEP reports information for the nation and specific geographic regions of the country
It includes students drawn from both public and non-public schools and reports results for
student achievement at grades 4 8 and 12 Since 1990 NAEP assessments have also been
conducted on the state level
NAEP long-term trend assessments are designed to give information on the changes in the basic
achievement of Americalsquos youth They are administered nationally and report student
performance at ages 9 13 and 17 in mathematics science and reading and grades 4 8 and 11
in writing In addition to the assessments NAEP coordinates a number of special educational
studies related to assessment Ongoing projects include the High School Transcript Study and a
Technology-Based Assessment project designed to explore the use of technology
DRAFT ANNUAL UPDATE February 2010 - 41 -
The National Assessment of Adult Literacy (NAAL)
This initiative provides a nationally representative and continuing assessment of English
language literacy skills of American adults NAAL seeks to describe the status of adult literacy
in the US report on national trends and identify relationships between literacy and selected
characteristics of adults NCES has conducted adult literacy assessments since 1985 A
nationally representative sample of adults was assessed again in 2002 providing an indication of
the nationlsquos progress in adult literacy since 1992
The NAAL describes the status of literacy in the nation and is intended to inform policymakers
and educators about the factors believed to play critical roles in the development of adult literacy
abilities and the use of literacy skills in workplace family and community settings Knowledge
about the roles relationships and impacts of such factors is used to improve educational
practices and programs
The NAAL is an in-person household survey that includes an assessment of English-language
literacy skills and a computer-assisted personal interview to collect background information
The literacy assessment measures the ability to use printed or written materials to perform prose
document or quantitative tasks that simulate real-life experiences The background
questionnaire identifies key population subgroups (ie by age gender race and ethnic group
and language minority) and addresses issues related to disabilities health English as a second
language education employment and other literacy-related activities
Data from the NAAL 2002 provide accurate estimates of the current distribution of literacy
abilities for the nation at large and will help policymakers target resources to address literacy-
related issues Moreover by comparing results from 2002 to those from 1992 the NAAL will
provide the first indicators in a decade
The Integrated Post-Secondary Education Data System (IPEDS)
IPEDS established the core post-secondary education data collection program It is viewable at
httpncesedgovipeds It is a single comprehensive system that encompasses all identified
institutions whose primary purpose is to provide post-secondary education Post-secondary
education is defined within IPEDS as the provision of formal instructional programs whose
curriculum is designed primarily for students who have completed the requirements for a high
school diploma or its equivalent This includes academic vocational and continuing
professional education programs and excludes a vocational and adult basic education programs
The following types of institutions are included within IPEDS baccalaureate or higher degree
granting institutions two-year award institutions and less-than-two-year institutions (ie
institutions whose awards usually result in terminal occupational awards or are creditable toward
a formal two-year or higher award) Each of these three categories is further disaggregated by
control (public private non-profit and private for-profit) resulting in nine institutional
categories or sectors
Participating in IPEDS has been required for all Title IV participating post-secondary institutions
since 1992 Complementing IPEDS are special studies of student financial aid post-secondary
faculty doctoral degree recipients transcript studies and various longitudinal studies The
NCES survey program at the post-secondary education level provides statistical information used
DRAFT ANNUAL UPDATE February 2010 - 42 -
by planners policymakers and educators in addressing a multitude of issues including workforce
development
The National Household Education Surveys (NHES)
These surveys are a data collection system of the NCES that is designed to address a wide range
of education-related issues It provides descriptive data on the educational activities of the US
population and offers policymakers researchers and educators a variety of statistics on the
condition of education in the US Data are collected through household surveys with either
sampled adults (for the adult education surveys) or the parents most knowledgeable about the
sample children (for surveys about preschool children and students in elementary and secondary
school) NHES collections have been conducted in the springs of 1991 1993 1995 1996 1999
2001 and 2003 The Adult Education for Work-Related Reasons Survey was fielded as part of
the NHES in 2003 There is also considerable information about work-related training contained
in the Adult Education and Lifelong Learning Surveys The adult education surveys ask about
participation in a wide variety of educational activities and collect information about the subject
duration cost and sponsorship of each activity
The NHES was conducted in 2003 and will be conducted periodically thereafter The NHES
2005 will include three surveys Adult Education and Lifelong Learning Early Childhood
Program Participation and Before- and After-School Programs and Activities
Apart from the adult education surveys and the surveys on the topics planned for 2005 surveys
about school readiness parent and family involvement in education civic involvement school
safety and discipline and household use of public libraries have been fielded as part of NHES
The primary purpose of the NHES is to conduct repeated measurements of the same phenomena
at different points in time to facilitate trend analysis However one-time surveys on topics of
interest to the Department of Education have also been fielded
The NCES Data on Vocational Education (DOVE)
The DOVE system derives data about vocational education primarily from existing NCES
surveys Some of the most informative data in the DOVE system are drawn from high-school
student transcript data In comparison to reports from states that identify vocational education
students using different definitions high-school transcripts indicate how many vocational
education credits students earn These data allow researchers to identify students who take
different amounts and types of vocational education courses and to examine the relationship
between academic and vocational course taking This method of obtaining data provides a more
accurate and complete picture of participation in vocational education than can be obtained by
any other means
The DOVE system also uses data from NCESlsquos longitudinal studies to examine the economic
outcomes associated with participation in vocational education DOVE is supplemented with
data from other federal sources including the BLS (the National Longitudinal Survey of Youth)
and the Census Bureau (SIPP and CPS)
The primary use of the DOVE system is to report on the status of vocational education NCES
has published several reports on vocational education topics including student participation
DRAFT ANNUAL UPDATE February 2010 - 43 -
staff characteristics and international comparisons of vocational education systems The current
National Assessment of Vocational Education is using student transcript data collected between
1982 and 1998 to examine changes in the nature of the vocational and academic curricula that
students pursue
US Department of Education National Center for Education Statistics httpncesedgov
URL Reference 17
US Department of Transportation Bureau of Transportation Statistics
Omnibus Surveys
The Omnibus Surveys are a convenient way to get very quick input on transportation issues to
see who uses what how they use it and how users view it and what they think about it and to
gauge public satisfaction with the transportation system and government programs The series of
surveys include a monthly household survey which collects data on core questions as well as
targeted surveys to address special transportation issues
The monthly surveys are a cost-shared resource of the department providing rapid data at a
reasonable cost The BTS has in-house technical expertise to help in survey design and analysis
DOT operating administrations or offices can purchase questions to address specific issues with
very short lead times (typically a couple weeks) They can also use the Omnibus for more
extensive targeted surveys aimed at households or establishments with certain characteristics
BTS provides technical support to help develop reliable questions and releases data within one
week after data collection is completed
DRAFT ANNUAL UPDATE February 2010 - 44 -
Bureau of Transportation Statistics httpwwwbtsgovprogramsomnibus_surveys
URL Reference 18
TranStats Intermodal Transportation Database
TranStats a Bureau of Transportation Statistics (BTS) research tool provides access to more
than 100 transportation-related databases across every mode of transportation - with many social
and demographic data sets that are commonly used in transportation analysis Essentially this is
a list of outside agency sources that collect data used by transportation analysts
National Transportation Library httpntlbtsgovindexhtml
URL Reference 19
DRAFT ANNUAL UPDATE February 2010 - 45 -
U S Department of the Interior
The Mission of the Department of the Interior is to protect and provide access to our Nations
natural and cultural heritage and honor the trust responsibilities to Indian Tribes and
commitments to island communities Interior has established five Departmental goals that
encompass the major responsibilities of the Department These goals provide a framework for
their strategic plans of Interiors bureaus
The Departmental goals are as follows Resource Protection (protect the Nations natural
cultural and heritage resources) Resource Use Recreation Serving Communities and Management Excellence
Depending on the workforce and economic development strategic plannerlsquos geographic location
DOI information may be of use to regional economic development projects that include energy
industry growth water roads land use and land development projects transportation projects
and responding to natural disasters
US Department of Interior httpinteriorgov
URL Reference 20
US Geological Survey
The US Geological Survey and its Web site (wwwgeodatagov) provides links to a wide
variety of mapping data resources and links to reports and databases like data resources for real
estate and business geography analysis that provides a portal to geospatial information related to
business geographic interests
DRAFT ANNUAL UPDATE February 2010 - 46 -
US Maps amp Data wwwgeodatagov
URL Reference 21
US Department of EnergyEnergy Information Administration
Energy Statistics
The Energy Information Administration (EIA) collects and disseminates information on
energy reserves production consumption distribution prices technology and related
international economic and financial matters EIAs programs include data on coal petroleum
natural gas and electric and nuclear energy EIA maintains a comprehensive energy database
disseminates energy data and analyses for a wide variety of customers in the public and private
sectors maintains the National Energy Modeling System for mid-term energy markets analysis
and forecasting maintains the Short-Term Integrated Forecasting System for near-term energy
market analysis and forecasting conducts customer forums and surveys to maintain an up-to-
date product and service mix and maintains systems supporting the electronic dissemination of
energy data
DRAFT ANNUAL UPDATE February 2010 - 47 -
Energy Information Administration httpwwweiadoegov
URL Reference 22
US Department of Veterans Affairs
Office of PolicyVeteran Data and Information
Veteran Data and Information available through the Office of Policy includes actuarial studies
veteran population estimates and projections veteran socioeconomic characteristics VA benefit
program user and non-user surveys and VA program evaluations
Veterans Data and Information httpwww1vagovvetdata
URL Reference 23
DRAFT ANNUAL UPDATE February 2010 - 48 -
Veterans Benefits Administration (VBA)
The Veterans Benefits Administration supports continuing and new surveys of veterans and
beneficiaries who receive VBA benefits and use its services The surveys cover VA
compensation and pension education loan guaranty vocational rehabilitation and employment
services and insurance programs
Veterans Benefits Administration httpwwwvbavagovVBA
URL Reference 24
The Interagency Council on Statistical Policy
FedStats FedStats available to the public since 1997 provides access to the full range of official statistical
information produced by the Federal government without having to know in advance which
Federal agency produces which particular statistic With convenient searching and linking
capabilities to more than 100 agencies that provide data and trend information on such topics as
economic and population trends crime education health care aviation safety energy use farm
production and more FedStats is your one location for access to the full breadth of Federal
statistical information The site -- FedStats (wwwfedstatsgov) -- uses the Internets powerful
link and search capabilities to navigate publicly available statistics from over 70 Federal
agencies
As part of the Administrations efforts to achieve improved customer service and greater
efficiency throughout the Federal government FedStats reduces the amount of time and effort
necessary to locate data The site the product of a multi-agency development effort led by the
Interagency Council on Statistical Policy followed the introduction of the widely acclaimed
Federal Statistics Briefing Rooms which offer on-line access to high-profile Federal economic
and social statistics
DRAFT ANNUAL UPDATE February 2010 - 49 -
FedStats major features include
An A to Z index that provides direct access to detailed data listings in 275
categories
A keyword search capability that enables users to search Web sites linked to
FedStats
Fast Facts links which allow users to visit either the Federal Statistics Briefing
Rooms or an on-line version of the most frequently requested tables from the
Statistical Abstract of the United States
An Agencies heading that allows users to link to the Web sites of Federal
statistical agencies or select from a menu of predetermined key words for those
agencies
A Programs heading that offers 14 groups of agency data program summaries in
areas ranging from agriculture to transportation
A Regional Statistics heading that offers data that is broken down into geographic
areas -- frequently at State or county levels and
Links to agency contacts press releases and government statistical agencies outside
the United States
An on-line form permits users to comment on the site and make suggestions
FedStats httpwwwfedstatsgov
URL Reference 25
National Science Foundation
Science Resource Statistics
The Science Resource Statistics (SRS) division of the National Science Foundation conducts
surveys that measure the number and demographic characteristics of individuals trained as or
working as scientists and engineers and participates in international collaborations to yield
comparable measures of the same items In addition other components of NSF provide funding
in support of biological sciences research databases and social science research and studies such
as the Panel Study of Income Dynamics the General Social Survey and the National Election
DRAFT ANNUAL UPDATE February 2010 - 50 -
Studies NSF also collects publishes and analyzes data on the size and health of US research
and development enterprises Four annual surveys provide information on research and
development funded and performed by government industry and universities and a periodic
survey provides comparable information on the nonprofit sector
The division also conducts a biennial survey on academic and biomedical research facilities
including aspects of cyber-infrastructure and has begun design work on an information
collection on instrumentation in science and engineering facilities Science Resource Statistics
staff participates in international collaborations to develop internationally comparable measures
of research and development and collects publishes and analyzes statistics on the nations
science and engineering higher education system and those who participate in it SRS measures
science and engineering and health enrollments and degrees and develops information on other
aspects of higher education
Science and Engineering Statistics httpwwwnsfgovstatistics
URL Reference 26
DRAFT ANNUAL UPDATE February 2010 - 51 -
Private Sources Generating Workforce Information
Private Sources Generating Workforce Information
Targeted Users
Source
ER
ISS
T
he
Wo
rkfo
rce
Inte
llig
ence
Co
mp
any
Man
po
wer
In
c
Ch
alle
ng
er
Gra
y a
nd
Ch
rist
mas
Nat
ion
al A
sso
ciat
ion
of
Co
lleg
es a
nd
Em
plo
yer
s
Th
e A
mer
ican
Sta
ffin
g
Ass
oci
atio
n
Am
eric
an M
anag
emen
t
Ass
oci
atio
n
Eco
no
my
co
m
Inte
rbiz
net
Un
iver
sity
of
Mic
hig
an
Pan
el S
tud
y o
f In
com
e
Dy
nam
ics
Ru
tger
s U
niv
ersi
tyJ
oh
n
J H
eld
rich
Cen
ter
for
Wo
rkfo
rce
Dev
elo
pm
ent
Employers
Government Agency
Federal State or Local
Elected Officials and Policymakers
Program Planners
Education and Training Providers
Intermediaries
Individuals
Researchers
DRAFT ANNUAL UPDATE February 2010 - 52 -
Private Sources Generating Workforce Information
Indicators
Source
ER
ISS
T
he
Wo
rkfo
rce
Inte
llig
ence
Co
mp
any
Man
po
wer
In
c
Ch
alle
ng
er
Gra
y a
nd
Ch
rist
mas
Nat
ion
al A
sso
ciat
ion
of
Co
lleg
es a
nd
Em
plo
yer
s
Th
e A
mer
ican
Sta
ffin
g
Ass
oci
atio
n
Am
eric
an M
anag
emen
t
Ass
oci
atio
n
Eco
no
my
co
m
Inte
rbiz
net
Un
iver
sity
of
Mic
hig
anP
anel
Stu
dy
of
Inco
me
Dy
nam
ics
Ru
tger
s U
niv
ersi
tyJ
oh
n
J H
eld
rich
Cen
ter
for
Wo
rkfo
rce
Dev
elo
pm
ent
Hours WorkedPayroll Hours
Earnings Trends
Unemployment Records ndash
Mass Layoffs
Labor Force Data
Labor Market Information
Employment
Wages Income Earnings
Future Demand and Hiring Trends
EducationTraining Information about
Providers and Career Advancement
Occupational Information
Skill Requirements
Program Participation
Information about Full- and Part-Time
Workers Contract Workers and the
Self-Employed
Unions
Information about Employers by
Company Size or Characteristics
Membership or Subscription Required
RecruitingStaffing Industry
Information
Occupational Licensing Information
Benefit Information
Information about Workforce
Commuting Patterns
DRAFT ANNUAL UPDATE February 2010 - 53 -
The strategic importance of human capital in economic development and business performance
has prompted an intensified focus on workforce information In addition to the traditional
government sources a growing number of private firms non-profit organizations trade
associations and universities have also become more involved in monitoring labor market and
workforce developments
This catalogue identifies a number of organizations that collect and disseminate
workforce and labor market information The inclusion of private-sector businesses and
com Web sites in this catalogue is for informational purposes only No endorsement is
implied or conferred on a company or on a specific products or service Readers and
information users should exercise an appropriate level of care and should be aware that
the private-sector products andor services may be copyrighted and may require a fee for
service or a cost to access or use information products This Catalogue is not intended to
be an exhaustive list of private sector Web sites and we reserve the right to modify the
list on an ongoing basis
ERISS The Workforce Intelligence Company ERISS is a leading information solutions provider since 1992 specializing in business
intelligence collection technologies and methodologies The companylsquos experience includes
more than 150 workforce survey projects involving more than 2 million employers across the
United States ERISS has two primary divisions (1) The National Center for Business amp
Economic Research (NCBER) and (2) USWorks NCBER was formed in 2002 to serve the
needs of business and economic development in the United States and Canada It delivers
primary business intelligence and current trend information in support of economic growth and
competitiveness USWorks was formed in 1998 to provide the public workforce sector with
information and applications for the purpose of job placement and employer services It is a
source for workforce performance and local workforce intelligence
ERISS The Workforce Intelligence Company - httpwwwerisscom
URL Reference 27
Manpower Inc Manpower is one of the leaders in the staffing industry providing workforce management
services to customers through 4400 offices in 73 countries Manpower frequently conducts
research studies to provide its customers with additional insight into the trends that are affecting
the labor market Manpowerlsquos quarterly employment forecasts are often quoted in the local
media as a key economic indicator of firmslsquo employment plans and job seeker hiring prospects
for states and regions where they are conducted
Manpower conducts the Employment Outlook Survey in the US on a quarterly basis It is a
measurement of employerslsquo intentions to increase or decrease the permanent workforce and
during its 26-year history has been a significant indicator of employment trends The survey is
based on telephone interviews with nearly 16000 public and private employers in 470 US
markets Survey results and analysis are posted on Manpowerlsquos website and are readily
DRAFT ANNUAL UPDATE February 2010 - 54 -
accessible at no cost to users Forecasts for national regional state and some local labor
markets are available
Manpower Inc - httpwwwmanpowercom
URL Reference 28
Challenger Gray and Christmas Challenger Gray and Christmas is a consulting organization providing out-placement services by
working with individuals sponsored by their former employers The firm has offices in 47 cities
throughout the US and works with clients in over 63 locations in Canada The firm focuses on
out-placement programs for executives middle managers and long-term employees It offers
modified individual and group programs and assists relocating spouses Challenger differentiates
itself from competitors by reporting that its clients find new jobs in a median time of 32 months
(compared with about 5 months which is cited by The Wall Street Journal as the average search
length)
As part of its out-placement business Challenger has monitored job cuts since 1989 Using
announcements made by firms Challenger tabulates data of job cuts contained in these
announcements The firm and its spokesman are frequently called on by the national media to
analyze labor market development and worker dislocation The firm tracks layoff
announcements by detailed industry sector and geographic region Regular updated reports are
provided as part of the organizationlsquos monitoring workforce and labor market developments
These reports are used in investment and human resource planning decisions of private firms
Users who want to access this information are required to pay access and subscription fees
Challenger Gray and Christmas - httpwwwchallengergraycom
URL Reference 29
National Association of Colleges and Employers (NACE) NACE is a trade association representing college career planning and placement centers NACE
provides research and information through ongoing employer and college surveys quarterly
surveys of starting salary offers to new college graduates a quarterly journal and a bi-weekly
newsletter NACE also prepares an annual forecast of hiring trends tracks legal issues related to
the employment process and provides benchmark data on best practices Among its best-known
publications are Job Choices a career planning and job-search tool distributed to more than one
million college students and alumni
Human resources and compensation specialists across the country examine current starting salary
offers to college graduates through NACElsquos Salary Survey a guide for setting competitive
salaries at the critical entry level Salary Survey also gives career services officers current data
on beginning offers which they can share with students to prepare them for entering the working
world Winter spring summer and fall editions of Salary Survey reports are issued in February
April July and September respectively Each report provides national starting salary offers by
discipline degree level job function industry group and provides the average offer as well as
ranges Salary Survey covers more than 70 major fields of study more than 50 employer
DRAFT ANNUAL UPDATE February 2010 - 55 -
categories and more than 70 job functions for the bachelorlsquos-degree level In addition Salary
Survey provides starting salary information for 57 masterlsquos and 22 doctoral fields of study
National Association of Colleges and Employers httpwwwnaceweborg
URL Reference 30
Economycom Economycom is a provider of economic financial and industry research designed to meet the
planning and information needs of businesses governments and professional investors
Economycom research supports country analysis and financial industrial and regional markets
Economycomlsquos information and services are used in a variety of ways including strategic
planning product and sales forecasting risk and sensitivity management and as investment
research
Economycomlsquos US State and Metropolitan Detailed Employment amp Output Forecast Database
offers detailed payroll employment forecasts and industrial output forecasts for 50 states and
over 300 metropolitan areas (County detailed employment for over 3100 counties is offered as
a separate product from state and metropolitan area employment) The state and metropolitan
forecast includes 21 2-digit NAICS categories 89 3-digit NAICS categories and 284 4-digit
NAICS categories and offers complete coverage of government military personnel and farm
employment One-digit NAICS super sectors manufacturing aggregates and totals are also
included Series history begins in 1970 and extends to 10 years of forecast for metropolitan
areas and 30 years for states History and forecasts are updated monthly Data are available only
to customers and subscribers Many states subscribe to Economycom services and data access
in support of econometric forecasting models used to forecast state revenues
Economycom - httpwwweconomycom
URL Reference 31
DRAFT ANNUAL UPDATE February 2010 - 56 -
Interbiznet
Interbiznet is a web-based firm that tracks researches and reports on the electronic recruiting
industry chronicling and facilitating its development Interbiznet believes that the single most
profound impact of the web will be on how we work get work and change work Interbiznet
functions as an analyst of the electronic recruiting industry The firm provides a daily
newsletter the Electronic Recruiting News and conducts an annual industry analysis
Interbiznet produces and maintains The Electronic Recruiting Index The index covers the
trends events and players shaping the future of the recruiting industry and builds upon the
results covered in the indexes of previous years The Electronic Recruiting Index is a source of
information for investors vendors corporate recruiters and staffing firms on the ―Electronic
Human Capital Marketplace The report contains industry overview and statistics and trends
and predictions about this important and emerging sector
Interbiznet - httpwwwinterbiznetcom
URL Reference 32
University of MichiganPanel Study of Income Dynamics (PSID) This study is a longitudinal survey of a representative sample of US individuals and the families
in which they reside It has been ongoing since 1968 The data were collected annually through
1997 and biennially starting in 1999 The data files contain the full span of information collected
over the course of the study PSID data can be used for cross-sectional longitudinal and
intergenerational analysis and for studying both individuals and families It emphasizes the
dynamic aspects of economic and demographic behavior but its content is broad including
sociological and psychological measures As a consequence of low attrition rates and the
success in following young adults as they form their own families and recontact efforts (of those
declining an interview in prior years) the sample size has grown from 4800 families in 1968 to
more than 7000 families in 2001 At the conclusion of 2003 data collection the PSID will have
collected information about more than 65000 individuals spanning as much as 36 years of their
lives
The PSID data files provide a wide variety of information about both families and individuals
collected over the span of the study The central focus of the data is economic and demographic
with substantial detail on income sources and amounts employment family composition
changes and residential location Content of a more sociological or psychological nature is also
included in some waves of the study Information gathered in the survey applies to the
circumstances of the family unit as a whole (eg type of housing) or to particular persons in the
family unit (eg age earnings) While some information is collected about all individuals in the
family unit the greatest level of detail is ascertained for the primary adults heading the family
unit
The study is conducted at the Survey Research Center Institute for Social Research University
of Michigan and has been made possible over the years through the sponsorship of government
agencies foundations and other organizations Since 1982 the study has had an advisory board
DRAFT ANNUAL UPDATE February 2010 - 57 -
appointed by the National Science Foundation to foster input from the national community of
scholars researchers and policymakers
University of Michigan Panel Study of Income Dynamics httpwwwisrumichedusrcpsid
URL Reference 33
Rutgers UniversityJohn J Heldrich Center for Workforce Development This Center is a university-based organization devoted to transforming the workforce
development system at the local state and federal levels The Center provides analysis for
reform and innovation in policymaking and employs cutting-edge research and evaluation
projects to identify best practices in workforce development and employment and workplace
policy It is also engaged in significant partnerships with the private sector to design effective
education and training programs and is committed to assisting job seekers and workers attain the
information education and skills training they need to move up the economic ladder
The John J Heldrich Center and the Center for Survey Research and Analysis at the University
of Connecticut conduct a national survey on a quarterly basis Work Trends Americansrsquo
Attitudes About Work Employers and Government These surveys explore Americanslsquo
perceptions regarding job satisfaction job security career mobility education and training and
the appropriate role of government in addressing the needs of workers employers and job
seekers The surveys are conducted quarterly and follow broad trends in the workforce
DRAFT ANNUAL UPDATE February 2010 - 58 -
Rutgers University John J Heldrich Center for Workforce Development httpwwwheldrichrutgersedu
URL Reference 34
National Venture Capital Association (NVCA)
The National Venture Capital Association is a trade association that represents the US
venture capital industry It is a member-based organization which consists of venture capital
firms that manage pools of risk equity capital designated to be invested in high growth
companies
NVCAs mission is to foster greater understanding of the importance of venture capital to the
US economy and support entrepreneurial activity and innovation The NVCA represents the
public policy interests of the venture capital community strives to maintain high professional
standards provides reliable industry data sponsors professional development and facilitates
interaction among its members
DRAFT ANNUAL UPDATE February 2010 - 59 -
National Venture Capital Association (NVCA) httpwwwnvcaorgaboutnvcahtml
URL Reference 35
DRAFT ANNUAL UPDATE February 2010 - 60 -
Part II Workforce and Labor Market Information Portals and Systems for Decision
Support
Overview
A rapid pace of technological change innovations in business and industrial organization and
the impact of global competitiveness are transforming work and altering traditional labor
markets Information describing the nature of these changes becomes critically important as
firms individuals communities and schools making major investment decisions need to stay
abreast of labor market and workforce developments
The US Department of Labor has made a sustained effort over the last 10 years to expand the
scope of workforce and labor market information and to ensure that such information is more
accessible to end users Along with efforts of the Labor Department other federal agencies
private firms non-profit organizations trade associations and university research centers have
also made more expansive efforts in tracking researching and communicating labor market and
workforce developments
This section of the catalogue examines a diverse array of web-based systems for improved and
innovative access to workforce and labor market information While most of these systems rely
on the traditional data sources previously identified a number of organizations are also gathering
new data and are tapping into alternative information sources to fill some of the gaps and support
innovative ways of looking at labor market and workforce issues
DRAFT ANNUAL UPDATE February 2010 - 61 -
US Department of Labor ETA and State and Local Workforce Agencies
Targeted Users
Source
Car
eerI
nfo
Net
Flo
rid
a R
esea
rch
an
d
Eco
no
mic
Dat
abas
e
Was
hin
gto
n
Wo
rkfo
rce
Ex
plo
rer
Min
nes
ota
In
tern
et
Sy
stem
fo
r E
du
cati
on
and
Em
plo
ym
ent
Kn
ow
led
ge
Neb
rask
a C
aree
r
Co
mp
ass
Tex
as S
OC
RA
TE
S
Ore
go
n L
abo
r M
ark
et
Info
rmat
ion
Sy
stem
San
Die
go
at
Wo
rk
Pen
nsy
lvan
ia C
ente
r
for
Wo
rkfo
rce
Info
rmat
ion
and
An
aly
sis
Employers
Government Agency
Federal State or Local
Elected Officials and Policymakers
Program Planners
Education and Training Providers
Intermediaries
Individuals
Researchers
DRAFT ANNUAL UPDATE February 2010 - 62 -
US Department of Labor ETA and State and Local Workforce Agencies
Indicators
Source
Car
eerI
nfo
Net
Flo
rid
a R
esea
rch
an
d
Eco
no
mic
Dat
abas
e
Was
hin
gto
n
Wo
rkfo
rce
Ex
plo
rer
Min
nes
ota
In
tern
et
Sy
stem
fo
r
Ed
uca
tio
n a
nd
Em
plo
ym
ent
Kn
ow
led
ge
Neb
rask
a C
aree
r
Co
mp
ass
Tex
as S
OC
RA
TE
S
Ore
go
n L
abo
r
Mar
ket
In
form
atio
n
Sy
stem
San
Die
go
at
Wo
rk
Pen
nsy
lvan
ia C
ente
r
for
Wo
rkfo
rce
Info
rmat
ion
and
An
aly
sis
Hours WorkedPayroll Hours
Earnings Trends
Unemployment Records ndash
Mass Layoffs
Labor Force Data
Labor Market Information
Employment
Wages Income Earnings
Future Demand and Hiring Trends
EducationTraining Information
about Providers and Career
Advancement
Occupational Information
Skill Requirements
Program Participation
Information about Full- and Part-
Time Workers Contract Workers
and the Self-Employed
Unions
Information about Employers by
Company Size or Characteristics
Membership or Subscription
Required
RecruitingStaffing Industry
Information
Occupational Licensing Information
Benefit Information
Information about Workforce
Commuting Patterns
DRAFT ANNUAL UPDATE February 2010 - 63 -
US Department of Labor ETA and State and Local Workforce Boards and Agencies
The US Department of Labor and its state partners along with a number of state and local
workforce agencies have made large strides in expanding better organizing and presenting
workforce and labor market information The Workforce Investment Act (WIA) of 1998
established the WIC as a unique structure for federal-state cooperation in planning and
overseeing the workforce information system The establishment of the WIC by the Congress
recognizes the significance of workforce and labor market information in support of broader
workforce development goals The WIC has been charged to plan guide and oversee the
workforce information system There is further recognition that an effective workforce
information system requires input from multiple sources including data producers and users
Federal and state partners are also coordinating labor market information products tools and
services through Americalsquos Labor Market Information System (ALMIS) ALMIS is a system for
extending a consistent accessible set of labor market information products tools and services
There is a growing awareness that workforce and labor market information must become more
customer-focused and provide better end-user utility The WIC has identified the customers of
the workforce information system as individuals and organizations who need information about
the labor market for making many different kinds of decisions
Our catalogue included a review of all the websites maintained by state workforce agencies
identified as partners under ALMIS While all states report a web presence and offer access to
labor market information we focused on sites that have been developed and are being
maintained by federal state and local workforce agencies funded by the US Department of
Labor We looked primarily for sites that emphasized user themes and decision support for
customers groups identified by the WIC
Americarsquos CareerInfoNet (ACINET) This web-based information system has been developed by the US Department of Labor ETA
to provide comprehensive career and labor market information in one convenient place for end
users The site displays a variety of occupational demographic and labor market information at
the local state and national levels Also an extensive collection of career Internet resources is
organized in a Career Resource Library Data used by CareerInfoNet come from a variety of
federal and state sources with sources identified and web links provided Data are continuously
updated Wages income and unemployment rate data are updated annually and the
employment trend data are updated every other year
CareerInfoNet has been designed to meet the needs of end users including students who may be
planning careers workforce professionals who are guiding and advising workers and employers
job seekers who need to learn about the labor market or locate the right employment
opportunities and employers who want to investigate labor market development and trends
CareerInfoNet provides access to occupational employment forecasts and earnings trends Users
are able to view career videos on-line and learn about occupational requirements There is
access to detailed information about education and training resources including information
about financial aid This site offers one of the more comprehensive self-help information
resources to support career planning job search and workforce research and planning for
employers
DRAFT ANNUAL UPDATE February 2010 - 64 -
US Department of Labor Employment and Training Administration
CareerInfoNet httpwwwacinetorg
URL Reference 36
Florida Research and Economic Database (FRED) FRED was developed for the State of Florida Department of Labor and Employment This
system provides a single one stop source for demographic economic and labor market
information for the state FRED recognizes that those seeking such information have a wide
variety of requirements The system is set up to serve researchers seeking detailed information
on trends in labor costs to job seekers looking for the average wage for an occupation in a
specific area Data have been well organized and are effectively arrayed to meet the needs of
multiple user groups
FRED graphically displays manipulates and analyzes a broad range of information from state
local and federal sources This database includes population and income figures industrial and
occupational wage statistics and projections annual and monthly employment and
unemployment figures employment service applicantslsquo data commuting patterns employer
data and mass layoff statistics
DRAFT ANNUAL UPDATE February 2010 - 65 -
Florida Research and Economic Database (FRED) httpfredlabormarketinfocom
URL Reference 37
Washington Workforce Explorer Washington State job seekers students and businesses wanting up-to-date information on career
options average wages and skills needed for various occupations are able to access this new
Internet-based tool The Washington State Employment Security Departmentlsquos Explorer an
interactive website delivers information about jobs and the economy It provides easy access to
a wide variety of career-assessment tools labor-market data and articles of interest to job
seekers employers researchers and policymakers Users can save their favorite information on
a personalized page Administrators wanted to place greater emphasis on meeting end-user
needs and thus designed Workforce Explorer to link statistics to real-world questions facing
unemployed workers or those looking for better jobs as well as businesses Job seekers
businesses students economists and training planners can use Workforce Explorer to
Identify job skills and interests then match those skills to related occupations
Search for jobs and employers
Obtain a list of fast-growing occupations and high-wage industries in an area
Learn tips on starting a business
Discover training opportunities
Access wage information and compare wages for the same job in different parts of the
state
Find economic indicators including population property values and unemployment
rates for an area
Create and save data tables and download them to Excel
An on-line tour introduces new users to the sitelsquos features Data are automatically updated and
new articles added each week Workforce Explorer is the result of a collaborative effort among
employment agencies in 22 states Together they have spent several years developing a generic
Internet-based system to deliver labor market information Washington State led the project
which received funds from the US Department of Laborlsquos ETA
DRAFT ANNUAL UPDATE February 2010 - 66 -
Washington Workforce Explorer httpwwwworkforceexplorerorg
URL Reference 38
Minnesota Internet System for Education and Employment Knowledge (ISEEK) Iseek is a web-based gateway to Minnesota career employment education and business
development information and services The Internet system helps users make choices about
careers employment education and business growth ISEEK provides information in five main
areas
Career planning
Education and training
Class listings
Employment
Business information
The information comes from a variety of public agencies corporations and private organizations
and is linked together in a way that saves users considerable time The degree of interaction and
cross-reference that ISEEK offers is unique among web-based career employment education
and business services
DRAFT ANNUAL UPDATE February 2010 - 67 -
Minnesota Internet System for Education and Employment Knowledge (ISEEK) httpwwwiseekorg
URL Reference 39
Nebraska Career Compass Nebraska Career Compass has been developed using information from many different programs
and resources Occupations are classified and reported using the SOC system all workers are
classified into one of over 820 occupations according to their occupational definition Wage
estimates are developed and updated quarterly by labor market information staff at Nebraska
Workforce Development They use base estimates from the annual OES survey and adjust them
to current quarterly levels using the Employer Cost Index
In the OES survey over 3000 Nebraska employers are selected based on industry employment
size and location to ensure a representative sample of the all employers statewide The resulting
data are presented in practical ways The ―Hot Occupations search provides a list of
occupations that can be considered to have above-average job prospects for the selected region
The ―Job Prospects indicator is a measure of the general availability and projected growth for a
particular occupation The indicators range from HOT for the best prospects to COLD for the
poorest prospects with FAIR representing average prospects The indicators were assigned to
each occupation based on a weighted index of the following variables projected employment
growth projected average annual compound growth rate and projected average annual openings
Career Compass also includes training provider information collected by the Nebraska Career
Information System on an annual basis Specific occupational licensing information was also
compiled by the Labor Market Information Center Office of Workforce Services and Nebraska
Workforce Development with cooperation and assistance from the many agencies departments
boards and commissions charged with the responsibility to implement the occupational licensing
programs in the State of Nebraska
DRAFT ANNUAL UPDATE February 2010 - 68 -
Nebraska Career Compass httpwwwdolnebraskagovnwdlmiCareerCompassindexcfm
URL Reference 40
Texas SOCRATES SOCRATES is a tool to assist local Texas planners to perform a regional labor market analysis
SOCRATES is a tool used by local workforce board planners under the WIA to generate lists of
targeted industries and occupations It is also used for researching regional Texas labor markets
and identifying occupational training possibilities or to justify new program submission and
approval The analytical tools and regional narrative reports within SOCRATES follow the
planning guidelines issued for targeted industries and occupations and approved by the Texas
Workforce Commission (TWC) As new data series become available and software
improvements are made for planning processes in SOCRATES new features will be
implemented to enhance regional analysis SOCRATES has been created by the Texas Career
Development Resources with technical and data support from the TWC labor market
information department and developmental funding by the TWC Workforce Division
DRAFT ANNUAL UPDATE February 2010 - 69 -
Texas SOCRATES httpsocratescdrstatetxus
URL Reference 41
Texas Career Development Resources httpwwwcdrstatetxus
URL Reference 42
San Diego at Work San Diego Workforce Partnership The San Diego Workforce Partnership administers job training and employment programs for the
regionlsquos residents and businesses Created under a Joint Powers Agreement by the City and
County of San Diego the San Diego Workforce Partnership receives federal state and local
funding to provide workforce development activities that increase individualslsquo employment
retention and earnings as well as skills The Partnership has designed its programs and
organized its service delivery system to be responsive to employerslsquo needs and provide for
economic development The Partnership sees the collection organization and the presentation
DRAFT ANNUAL UPDATE February 2010 - 70 -
of workforce and labor market information as one of its most important responsibilities to
employers and job seekers The provision of labor market information to job seekers occurs
through its network of One-Stop career centers The Partnershiplsquos work with employers
particularly in the organization of sectoral initiatives depends on the provision of workforce and
labor market information
The Partnership has established a website to provide information on the regionlsquos labor market
including wage and salary data occupational projections employment statistics education and
training providers and local economic news Specific data sets maintained and updated
regularly include the following
Wage and salary data for occupations in San Diego County and California
Local state and national occupational data
Education and training providers and programs for the San Diego region and others
throughout California
Local and state employment projections and statistics
Data information on San Diegolsquos growing industry clusters
Information on San Diegolsquos economy and economic development
Information on local companies
Current updates on Californialsquos labor market
Through its affiliation with a local network television station the Partnership offers access to
information and tools for job seekers to determine which career is the best fit The Partnership
also makes available The Occupational Outlook Report which highlights salary and benefits
package information education and skill requirements and turnover rates for thousands of job
titles This report offers the regionlsquos employers and job seekers valuable information about the
labor market
San Diego Workforce Partnership wwwworkforceorggeneratehtmlLMIlmi_subhomehtml
URL Reference 43
DRAFT ANNUAL UPDATE February 2010 - 71 -
Pennsylvania Center for Workforce Information and Analysis The Center for Workforce Information and Analysis is Pennsylvanialsquos designated provider of
employment statistics The Centerlsquos goal is to provide the most current data available to help
users make the right decisions and assist organizations in meeting local planning needs
Pennsylvania Labor Market Information Database System (PALMIDS) a web-based application
contains data on a wide variety of employment economic career-related and education topics
It is intended to serve the information needs of job seekers employers students educational
curriculum planners workforce and economic development agencies and the general public
The system has been designed to be intuitive and easy to use Users of PALMIDS may also
consult with trained and experienced labor market analysts if they need more detail or individual
support
PALMIDS provides users with information on labor force employment and unemployment
statewide and for all major areas Also provided is a count of statewide and area non-agricultural
wage and salary jobs by industry as well as number of hours and pay earned in selected
manufacturing industries The system gives users access to career guides containing articles on
how to make career choices conduct a job search choose a college or training program and
obtain financial aid The guides contain outlook information for 150 selected careers including
demand occupations within Pennsylvanialsquos WIAs PALMIDS reports occupational wages
information for selected occupations in various geographical areas and an Occupational Outlook
Handbook with descriptions of what workers do on the job working conditions the training and
education needed earnings and expected job prospects in a wide range of occupations
Databases include long-term industry projections containing estimates of employment levels by
industry 10 years in the future by WIA Employment Opportunity Statistics details the
percentages of women and minorities in the labor force to assist all companies with Equal
Employment Opportunity contract compliance responsibilities Actuarial Evaluations provides
analysis of Pennsylvanialsquos unemployment compensation system regarding current and forecasted
Unemployment Compensation Trust Fund activity
In addition to workforce and labor market information PALMIS offers program resources
including a brief overview of the WIA Press releases contain an analysis of the current
economic conditions for Pennsylvanialsquos 14 MSAs in addition 29 small labor market areas are
posted regularly
DRAFT ANNUAL UPDATE February 2010 - 72 -
Pennsylvania Center for Workforce Information and Analysis httpwwwpaworkstatsstatepaus
URL Reference 44
DRAFT ANNUAL UPDATE February 2010 - 73 -
Economic Development Agencies
Economic Development Agencies
Targeted Users
Source
Sta
te o
f M
ain
e
Dep
artm
ent
of
Eco
no
mic
an
d
Co
mm
un
ity
Dev
elo
pm
ent
Qu
ad C
ity
Dev
elo
pm
ent
Gro
up
Employers
Government Agency
Federal State or Local
Elected Officials and Policymakers
Program Planners
Education and Training Providers
Intermediaries
Individuals
Researchers
DRAFT ANNUAL UPDATE February 2010 - 74 -
Economic Development Agencies
Indicators
Source
Sta
te o
f M
ain
e
Dep
artm
ent
of
Eco
no
mic
an
d
Co
mm
un
ity
Dev
elo
pm
ent
Qu
ad C
ity
Dev
elo
pm
ent
Gro
up
Hours WorkedPayroll Hours
Earnings Trends
Unemployment Records ndash
Mass Layoffs
Labor Force Data
Labor Market Information
Employment
Wages Income Earnings
Future Demand and Hiring Trends
EducationTraining Information about
Providers and Career Advancement
Occupational Information
Skill Requirements
Program Participation
Information about Full- and Part-Time
Workers Contract Workers and the
Self-Employed
Unions
Information about Employers by
Company Size or Characteristics
Membership or Subscription Required
RecruitingStaffing Industry
Information
Occupational Licensing Information
Benefit Information
Information about Workforce
Commuting Patterns
DRAFT ANNUAL UPDATE February 2010 - 75 -
Economic development agencies are increasingly focusing their efforts on workforce
development as the basis for business attraction and expansion While these organizations have
been the consistent users of traditional labor market information they are increasingly becoming
generators of such information as well The strategic value of labor availability and workforce
quality is becoming a driving force for innovative approaches to local labor market and
workforce analysis Below are three examples of economic development organizations making
creative use of traditional labor market information and developing new data to support their
needs
State of Maine Department of Economic and Community Development (DECD) DECD has identified the need to develop extensive and up-to-date information about the
workforce of Maine as a vital component of a strategy for furthering economic growth To that
end the Department has commissioned a series of studies of the workforce in Maine conducted
by the Center for Business and Economic Research (CBER) of the University of Southern
Maine The research team developed a comprehensive analysis of the labor force in 17 regions
comprised of single or multiple labor market areas defined by the Maine Department of Labor
The analysis covers five major topics using data from a random sample of households and
employers These include
Employment mobility and recruiting trends
Unemployment and underemployment
Employment costs including both pay and benefits
Education training and skills
Commuting
An extensive array of data from state federal local and other resources was compiled for
regions including the labor market area municipalities and counties The data comprise
information on demographics education employment and other labor characteristics
Random sample telephone surveys were conducted from March 1999 to July 2001 On average
401 surveys were completed in each of the regions a sample size that permits inference of plusmn 5
percent statistical accuracy 95 percent of the time The respondents selected for interviews were
those over 18 years of age who were not in the military and who were not full-time students
People who were retired and not seeking employment were excluded as were those who had left
the workforce on permanent disability Retirees actively considering taking employment were
included in the survey
A survey was mailed to 24368 employers in the state The mailing list was drawn from the
unemployment insurance records of the Maine Department of Labor In those areas with more
than 3000 employers the mailing list was comprised of all employers with over
100 employees plus a 50 percent sample of all employers under 100 employees For labor
market areas under 3000 employers all employers received a survey form Following the initial
mailing non-respondents were contacted by post card In all 3637 responses were received a
return rate of 147 percent
DRAFT ANNUAL UPDATE February 2010 - 76 -
This vital information about the workforce has been posted to a website where employers
economic development specialists and others assessing workforce issues are able to access it
readily Maine workforce information is being reported based upon the needs of economic
developers and site location specialists Data tabulation and analysis that once required the
services of researchers and technicians can now be directly accessed by those who need the
information to make decisions
State of Maine Department of Economic and Community Development httpwwwmainebusinessworksorg
URL Reference 45
Quad City Development Group Davenport IA
The Quad City Development Group serves as the umbrella organization for economic
development in the Quad Cities (Davenport Bettendorf Rock Island and Molene) The Group
is a non-profit organization supported by local governments and the private sector The
organization markets the Quad Cities as one community to businesses all over North America
and Europe that are considering expansion and investment
The Quad City Development Group conducted a laborshed analysis in cooperation with the Iowa
Workforce Developmentlsquos Workforce Research Bureau A laborshed is defined as the area or
region from which an employment center draws its commuting workers Laborshed studies
show the distribution of the workers irrespective of natural or political boundaries Laborsheds
also address underemployment the availability and willingness of current and prospective
employees to change employment within the workforce current and desired occupations wages
hours worked and distance willing to commute to work Laborsheds are conducted on an ―as
requested basis and the fee is based on the population of the laborshed area
Laborshed reports contain information to assist local leaders developers and industry with
expansion relocation and development efforts in the Quad City area Information such as
commuting patterns current and desired wagessalaries available labor workerslsquo skills and
industries in the laborshed area are reported The laborshed report measures the availability and
DRAFT ANNUAL UPDATE February 2010 - 77 -
characteristics of workers within the Quad City region Laborshed studies provide community
economic developers and existing or prospective employers a flexible tool to understand the
local labor market and make informed expansion and site-selection decisions
A random telephone survey was taken of residents (ages 18-64) living within three laborshed
zones The zones represent the areas in which actual employees of local businesses reside with
Zone 1 having the highest and Zone 3 the smallest concentration of area employees A total of
1200 telephone surveys were completed to achieve a margin of error of 5 percent for the
survey The laborshed study provides developers and existing or prospective employers a
flexible tool to understand the local labor market and make informed site selection decisions
Quad City Development Group httpwwwquadcitiesorg
URL Reference 46
DRAFT ANNUAL UPDATE February 2010 - 78 -
Private Sources Firms Non-Profit Organizations Trade Associations Research Centers
and Advocacy Groups
Private Sources Firms Non-Profit Organizations Trade Associations
Research Centers and Advocacy Groups
Source
Targeted Users
C
aree
rBu
ild
er
M
on
ster
co
m
C
aree
rJo
urn
alc
om
S
oci
ety
for
Hu
man
R
eso
urc
e
M
anag
emen
t
E
cono
mic
Po
licy
I
nst
itu
te
E
mp
loy
men
t P
oli
cy
F
ou
nd
atio
n
Employers
Government Agency
Federal State or Local
Elected Officials and Policymakers
Program Planners
Education and Training Providers
Intermediaries
Individuals
Researchers
DRAFT ANNUAL UPDATE February 2010 - 79 -
Private Sources Firms Non-Profit Organizations Trade Associations Research
Centers and Advocacy Groups
Source
Indicators
Car
eerB
uil
der
Mo
nst
erc
om
Car
eerJ
ou
rnal
co
m
So
ciet
y f
or
Hu
man
Res
ou
rce
Man
agem
ent
Eco
no
mic
Po
licy
Inst
itu
te
Em
plo
ym
ent
Po
licy
Fo
un
dat
ion
Hours WorkedPayroll Hours
Earnings Trends
Unemployment Records ndash
Mass Layoffs
Labor Force Data
Labor Market Information
Employment
Wages Income Earnings
Future Demand and Hiring Trends
EducationTraining Information about
Providers and Career Advancement
Occupational Information
Skill Requirements
Program Participation
Information about Full- and Part-Time
Workers Contract Workers and the Self-
Employed
Unions
Information about Employers by
Company Size or Characteristics
Membership or Subscription Required
RecruitingStaffing Industry Information
Occupational Licensing Information
Benefit Information
Information about Workforce Commuting
Patterns
DRAFT ANNUAL UPDATE February 2010 - 80 -
This catalogue identifies a number of organizations that collect and disseminate
workforce and labor market information The inclusion of private-sector businesses and
com Web sites in this catalogue is for informational purposes only No endorsement is
implied or conferred on a company or on a specific products or service Readers and
information users should exercise an appropriate level of care and should be aware that
the private-sector products andor services may be copyrighted and may require a fee for
service or a cost to access or use information products This Catalogue is not intended to
be an exhaustive list of private sector Web sites and we reserve the right to modify the
list on an ongoing basis
There is growing demand for workforce and labor market information In addition to innovative
systems and approaches offered by public entities there are growing numbers of private
providers for workforce and labor market information linked to decision support systems We
have identified a number of such providers Our review does not in any way constitute an
endorsement of any of these sources In many instances the information and services offered by
private sources are free to users and may be readily accessed via the Internet Often workforce
and labor market information is provided as part of other services such electronic job banks and
career planning services These services are growing in use among employers and job seekers
Our catalogue has identified a limited number of them
CareerBuilder Career Builder provides employers recruiters and job seekers with on-line recruitment resources
through its website CareerBuildercom its on-line component and three newspaper companies
Gannett Co Inc Knight Ridder and Tribune Company CareerBuilder offers a recruitment
resource through more than 130 local newspapers with a combined Sunday print circulation of
more than 15 million readers and more than 26 million visitors
to its newspaper websites on-line
each month In the next few years it is expected that web-based recruiting solutions will expand
exponentially as corporations adapt multi-pronged on-line recruiting strategies for filling all
levels of positions
On the CareerBuilder website job seekers define specific criteria and search more than 400000
continuously updated jobs representing more than 25000 employers in every industry and field
For those job seekers requiring additional assistance CareerBuilder offers personalized
individual assistance through its Customer Care organization CareerBuilder also offer users
access to information research and analysis covering labor market and workforce developments
One of its most useful features is a series of advice columns aimed at job seekers in various
career stages These columns often take more complex issues and data such as occupational
outlook issues of job tenure advancement and skills shortages and effectively analyze trends
and developments for readers to more easily comprehend and apply to their own situations
CareerBuilder - httpwwwcareerbuildercom
URL Reference 47
DRAFT ANNUAL UPDATE February 2010 - 81 -
Monstercom Monstercom is an on-line career website Monster promotes itself as a lifelong career network
providing access to companies as well as interactive personalized tools Features include a
personal career management office resume management a personal job search agent chats and
message boards expert advice on job-seeking and free career management newsletters
Employers receive real-time job postings complete company profiles and resume screening
routing and searching Features for members include resume skills screening real-time
recruiting a comprehensive resume database with more than 16 million resumes and resume
routing
Monstercom also supplies users with practical workforce and labor market information such as
the Personal Salary Report This report helps job seekers and employers establish market value
based on background experience and job setting The Personal Salary Report provides data by
industry the size of company and geographic location The report also provides data that
associate personal skills and experiences to earnings potential for market salary data on more
than 1000 jobs The data are updated monthly to stay current as salary trends evolve The data
are presented in a 14-page report
Monstercom offers detailed job profiles on-line to help job seekers and those planning careers
learn more about job content and performance requirements There is also an extensive database
of books articles and research studies that are organized for users by interest areas Another
feature supports job seekers making geographic moves Links are made to a variety of services
in major urban centers so that job seekers are able to examine housing costs insurance expenses
and other general living costs as part of helping job seekers assess job and salary offers in other
markets Monstercom - httpwwwmonstercom
URL Reference 48
CareerJournalCom CareerJournalcom is a free career information and services site geared to managers and
executives Content comes from the Wall Street Journal published by Dow Jones amp Co as well
as from the CareerJournalcom editorial team Content includes daily updates of critical news
features and trends relevant to job seekers and human resource professionals Content is
focused on searching for a new position or improving job performance
CareerJournalcom works with companies of all sizes to offer employment opportunities to
candidates in a searchable database that is updated twice weekly Positions featured include
senior and general management sales marketing finance technology and a range of related
fields Job hunters can also research publicly traded companies who post their jobs on
CareerJournalcom with one-click access to WSJcomlsquos Briefing Books There are links to an
extensive collection of editorial content databases and other services throughout the site
CareerJournalcom examines hiring demand and salary data for different industries and job
functions ranging from accounting to professionals working for public utilities Writers
interview top company hiring managers and executive recruiters nationally to compile the latest
trends and insights CareerJournalcom provides users with negotiating tips career indicators
DRAFT ANNUAL UPDATE February 2010 - 82 -
hot employment issues information on stock options regional news and a relocation salary
calculator The CareerJournal site connects with the Economic Research Institute providing
users access to salary survey analyses geographic differentials wage surveys executive
compensation information cost of living comparisons prevailing wage studies employee benefit
data and compensation and benefits training
CareerJournalcom - httpwwwcareerjournalcom
URL Reference 49
Society for Human Resource Management (SHRM) SHRM is the worldlsquos largest association devoted to human resource management representing
over 170000 individual members SHRM is committed to advancing the human resource
profession and in promoting the human resource function as an essential and effective partner in
developing and executing organizational strategy Founded in 1948 SHRM currently has more
than 500 affiliated chapters within the US and members in more than 120 countries
The Societylsquos Workplace Trends and Forecasting Program was established to give human
resource professionals added insight into cutting-edge issues and trends The Workplace Trends
and Forecasting staff examines developments in the fields of science and technology economics
politics and government law sociology and psychology for their effect on the workplace The
research department also conducts several mini-surveys to glean information on the topic of
staffing metrics The program produces Workplace Visions a bimonthly publication that
examines new issues and trends affecting the human resource professional ―Future Focus a
monthly column in HR Magazine addressing long-term human resource issues and ―Research
Translations a bimonthly column in HR News addressing the latest academic research in the
human resource management field This information may be accessed directly on the web but
requires membership in SHRM
Society for Human Resource Management httpwwwshrmorg
URL Reference 50
DRAFT ANNUAL UPDATE February 2010 - 83 -
The Economic Policy Institute (EPI)
EPI provides research and education in order to promote a prosperous fair and sustainable
economy EPI is a private research and advocacy organization It stresses real-world analysis
and focuses on living standards of working people EPI makes its findings accessible to the
general public the media and policymakers The State of Working America prepared biennially
since 1988 by EPI sums up problems and challenges facing American workers The authors
present a wide variety of data on family incomes taxes wages unemployment wealth and
povertymdashdata that enable them to closely examine the impact of the economy on the living
standards of the American people This comprehensive report is used by journalists government
leaders researchers policymakers academics and others looking for an assessment of the
economic well-being of the nation It is a comprehensive study of the living standards of
working Americans and comprises seven chapters income wages jobs wealth poverty and
regional and international comparisons With over 300 tables and charts it is among the most
detailed reference works on wages income and other economic data Data and a variety of
reports about work in America are available on EPIlsquos website
Economic Policy Institute httpwwwepinetorg
URL Reference 51
The Federal Reserve System
The Federal Reserve System consists of network of 12 regions Each region contains a Federal
Reserve Bank that is engaged in economic research and data analysis While much of the
research and data analysis are focused on overall regional economic well-being and financial
markets there are considerable data sources studies and articles pertaining to labor markets and
workforce development Among these are
DRAFT ANNUAL UPDATE February 2010 - 84 -
Surveys and Reports that include the senior loan officer survey the survey on small
business finances and the survey of consumer finances
Staff Studies consisting of a series of published studies covering a wide range of
economic and financial subjects including special studies in human capital labor
market education and training
Working Papers that serve as preliminary discussion papers in domestic and
international topics occasional staff studies and links to other working papers sites
Federal Reserve Bulletin Articles including reports and analysis on economic
developments regulatory issues and new data
Federal Reserve System httpwwwfederalreservegov
URL Reference 52
Commonly known as the Beige Book this report is published eight times per by the Federal
Reserve Each Federal Reserve Bank gathers anecdotal information on current economic
conditions in its Districts through reports from bank and branch directors and interviews with
key business contacts economist market analyst and other sources The Beige Book
summarizes this information by district and sector
DRAFT ANNUAL UPDATE February 2010 - 85 -
Beige Book httpwwwfederalreservegovfomcbeigebook2009
URL Reference 53
DRAFT ANNUAL UPDATE February 2010 - 86 -
Real-Time Workforce Information
Recently online job banks and workforce information organizations have begun to expand the
number of tools offered to the public By using frequently-updated databases of job openings and
advertisements as well as various monthly surveys and reports a number of organizations now
offer ―real-time labor market analytics
The Conference Board
The Conference Board is a not-for-profit organization which collects and distributes information
on management and the marketplace produces economics-based forecasts and analyzes
workforce trends It currently offers two real-time LMI tools
Conference Board Help-Wanted Online Data Series (HWOL) was developed in
partnership with Wanted Technologies and is a monthly release which details
workforce trends by measuring the number of online job postings from over 1200
Internet job banks From these data the HWOL offers supplydemand rates of
unemployed workers to online advertised vacancies according to region state
occupation and metropolitan area
The Conference Board Help-Wanted Online Data Services
httpwwwconference-boardorgeconomicshelpwantedOnlinecfm
URL Reference 54
The Conference Board Employment Trends Index (ETI) is another monthly
publication seeking to present underlying trends in the workforce in order to make
accurate short term predictions on employment in the United States The ETI does
this by aggregating eight separate indicators which have individually proven accurate
the percentage of Conference Board Consumer Confidence Survey respondents who
say they find ―jobs hard to get initial claims for Unemployment Insurance the
percentage of firms unable to fill positions the number of employees hired by the
DRAFT ANNUAL UPDATE February 2010 - 87 -
temporary-help industry the number of part-time workers for economic reasons the
amount of job openings industrial production and real manufacturing and trade sales
These indicators are supplied by the US Department of Labor the National
Federation of Independent Business Research Foundation the Federal Reserve Board
and the US Bureau of Economic Analysis The ETI is presented graphically and
includes data from as far back as 1973
The Conference Board Employment Trends Index httpwwwconference-
boardorgeconomicsemploymentcfm
URL Reference 55
EmployOn LMI
EmployOn seeks to provide employers recruiters publishers of classified advertising and local
regional and state governments with the market trend information needed to make wiser
spending decisions and more accurate workforce forecasts Accordingly EmployOn provides
real-time LMI based off a database of over 7 million jobs utilizing a concept-based search
engine Database sources include employers recruiting firms job boards regional sites and
―niche websites Market information provided by EmployOn includes the number of employers
posting jobs in a specified area the types of jobs being posted the names of employers with an
increasing number of postings and the most common postings by title and industry EmployOn
LMI also provides trend information such as growing and declining industries
EmployOn LMI httpwwwemployoncomproducts_labormarketasp
URL Reference 56
Indeed Job Trends Indeed is a searchable online index of job postings harvested from career and job board websites
which also provides a series of longitudinal LMI tool Indeed Job Trends presents a graphical
depiction of the number of job postings containing either user-defined keywords or
recommended search terms Additionally Indeed Job Trends offers information on the number
of unemployed workers per job posting in fifty metropolitan areas a map tool which displays job
DRAFT ANNUAL UPDATE February 2010 - 88 -
postings per capita quarterly rankings of metropolitan areas based on the number of job postings
per thousand people and monthly major industry trends
Indeed Job Trends httpwwwindeedcomjobtrends
URL Reference 57
Manpower Employment Outlook Survey (MEOS)
Manpower is an employment services leader providing recruitment assessment training
outsourcing and consulting to businesses throughout 82 countries and territories in nearly all
industries MEOS is a quarterly survey of over 72000 public and private employers from 35
countries and territories which seeks to gauge the intentions of employers to increase or decrease
their workforces in the upcoming quarter The report presents its seasonably-adjusted data in a
number of contexts including quarter-over-quarter year-over-year regional and international
comparisons
Manpower Employment Outlook Survey httpwwwmanpowercompressmeoscfm
URL Reference 58
Simply Hired Employment Trends Simply Hired is a ―vertical search engine company which compiles an online database of job
openings from job boards company pages and online classified ads The Simply Hired page also
provides a Trends tool where users can view a graphical presentation of the frequency of job
titles companies skills and industries in the Simply Hired database Users are able to view
trends based on search criteria or recommended ―popular job trends
Simply Hired Employment Trends httpwwwsimplyhiredcomajobtrendshome
URL Reference 59
DRAFT ANNUAL UPDATE February 2010 - 89 -
Part III Data Integration and Analysis Tools and Services to Support Regional
Economic Development
The need for a deep understanding of ever more complicated state regional and local economies
has intensified as government business and industries recognize the need and accept the
challenge to compete on a global basis Many if not all economies must transform themselves
and harness more and more information to improve strategic planning investment decision-
making and talent development New public and private sector information sources and tools
are emerging that tap and exploit data from multiple sources and provide a relatively new
approach to use geographic information system tools to display data on maps predefined charts
tables and reports
A new class of information tool combines selected datasets and uses geographic information
systems (GIS) to display data on maps to expand the understanding and the relationship of data
to the area being studied These new integrated relational database tools are useful for a wide
variety of analysis including
o Industry Cluster Analysis using the North American Industrial Classification System
(NAICS) summary data and business location data
o Regional Overview and Assessment using data reports and maps that include
information on basic population and demographics educational attainment housing and
income employment business and transportation information
o Benchmarking or Comparison for side-by-side benchmarking or peer analysis
o Asset and Infrastructure Analysis and o Performance Measurement by tracking the changes in key metrics and user created
trend reports can identify areas of strength and improvement as well as those in need of
greater attention
ETA - Census Bureau Community Economic Development Hot Reports
To assist communities prepare for economic shocks and impacts such as military base
realignments and closures (BRAC) the Department of Defense Office of Economic Adjustment
and the Employment Training Administration sponsored the US Census Bureaulsquos efforts to
develop an interactive web-based system to make available high level community economic
development information BRAC realignment and closures like business expansions and natural
disasters all require communities to transform themselves and address new economic challenges
the CED HotReports provide a snapshot of key aspects of the area economy workforce and
industry HotReports allows community strategic planners and decision makers to speedily
access common and updated set of data and provides comparable information for grant funding
applications economic development workforce investment planning and investment decision-
making
CED HotReports display data in charts maps and tabular formats The HotReports are made up
of several interconnected dynamic web pages Data are pulled from 12 datasets on multiple data
systems in multiple formats and from multiple physical locations including the Summary File 3
that consists of 813 detailed tables of Census 2000 social economic and housing characteristics
DRAFT ANNUAL UPDATE February 2010 - 90 -
compiled from a sample of approximately 19 million housing units (about 1 in 6 households) that
received the Census 2000 long-form questionnaire The data sets are
American Community Survey (ACS) ndash 2005 or Census 2000
Summary File 3 (SF3)
Local Employment Dynamics (LED)
Population Estimates
Small Area Income and Poverty Estimates (SAIPE)
County Business Patterns (CBP)
US Counties
Common Core of Data ndash Public ElementarySecondary School Universe
Home Mortgage Disclosure Act (HMDA)
Integrated Postsecondary Education Data System (IPEDS)
Quarterly Census of Employment and Wages (QCEW) and
State Occupation Projections
HotReports provide users speedy access to key information for strategic planning talent and
economic development and workforce investment decision making HotReports include the
following information displays
Community Economic Development Hot Reports httpcedcensusgov
URL Reference 60
DRAFT ANNUAL UPDATE February 2010 - 91 -
HotReports include the following information displays
Entry Page
Select State County
o General Overview
Population
Average annual wages
Number in labor force
Number employed
Unemployment rate (county
and national)
Median household income
Median housing value
Median gross rent
Per capita personal income
Poverty rate
High school graduates
Bachelorlsquos degree or higher
Population pyramid (age
groups by sex)
o Economic Overview
Top 20 Industries (by number
of employees)
Average annual wages by
industry (thematic map of all
counties)
Labor force size by age (graph
and table)
Education levels (graph and
table)
Top 10 occupation groups
o Detailed Economic ndash Growth and
Contractions
Top 10 industries by 8 selectable
measures (employees earnings
separations new hires etc)
Top 20 occupations by projected
percent increase (state level only)
Number of establishments by
establishment size (7 year time
graph selectable establishment
sizes)
o Detailed Economic ndash Workforce
Details ndash selectable industry sector
Employment counts (time graph
county-state comparison)
Average monthly earnings (time
graph county-state comparison
stable job-new hires comparison)
Turnover ratio (time graph county-
state comparison)
o Demographic Overview
Population
Household income distribution
(graph)
Per capita income
Median household income
Median family income
Veterans ndash percentage of
population 18 and over
English language ability
School enrollment by level
o Housing Overview
Average mortgage amount for
home purchase
Median home value
Occupancy status
Percent owner-occupied
Average people per household
Home ownership by age of
householder (graph)
Owner and renter costs
o Transportation Overview
Percent of commuters by travel
time to work (graph and table)
Average commute time
Percent of workers by means of
transportation to work (graph and
table)
o Community Assets Overview
Number of public schools by type
and level (K-12)
Number of students teachers and
ratios by level (K-12 public)
Number and listing of colleges
and universities
Economic Modeling Specialists Inc (EMSI) Strategic Advantage
EMSI is a provider of regional economic and labor market data web-based analysis tools and
consulting servicesndashintegrated solutions that bring together industry workforce and education
perspectives EMSI provides workforce information to thousands of customers representing
workforce boards economic development organizations government agencies community
colleges universities and policy professionals across the nation Their StrategicAdvantage
product is customizable by data and function and produces presentation-ready reports in graphs
tables and maps The product consists of four core components
Economic Forecaster ndash provides users with current reports and projections for industries
occupations and demographics in a selected region Hundreds of industries (2-5 digit
NACIS) and occupations (2-5 digit SOC) are available and results can be filtered and
DRAFT ANNUAL UPDATE February 2010 - 92 -
organized using multiple criteria such as number and percent change of jobs education
level and earnings
Career Pathways ndash shows the skills imbedded in the workforce for every occupation in
the region and reveals the transferability of unemployed underemployed or advancing
workers into potential occupations With this tool users can target their investments in
programs that assist workers transition from declining occupations to high-growth
occupations with similar skill requirements
Economic Impact ndash provides a host of critical information about the health and possible
future directions of the regional economy using a robust web-automated inputoutput
model The module allows users to input growth or decline in jobs earnings and sales
and view the ripple effects throughout industries
Educational Analyst ndash helps regional workforce education and training professionals
access the information they need to plan for a regionlsquos future knowledge and skill needs
by combining data on occupations and career clusters with information about post-
secondary institutions educational attainment and high school graduations The module
also connects occupations to post-secondary programs allowing users to quickly assess
the regional labor market outlook for specific education programs
Economic Modeling Specialists Inc (EMSI) Strategic Advantage
httpwwweconomicmodelingcomwebtools
URL Reference 61
DRAFT ANNUAL UPDATE February 2010 - 93 -
Acronyms
ACINET Americalsquos CareerInfoNet
ACRN Americalsquos Career Resource Network
AIDS Acquired Immune Deficiency Syndrome
AMA American Management Association
ASA American Staffing Association
BEA Bureau of Economic Analysis
BLS Bureau of Labor Statistics
CBER Center for Business and Economic Research
CES Current Employment Statistics
CPS Current Population Survey
DECD Department of Economic and Community Development
DOVE Data on Vocational Education
EPI Economic Policy Institute
EMSI Economic Modeling Specialists Inc
EQW Educational Quality of the Workforce
ESA Economics and Statistics Administration
ETA Employment and Training Administration
FRED Florida Research and Economic Database
FY Fiscal Year
GAO General Accounting Office
GDP Gross Domestic Product
IPEDS Integrated Post-secondary Education Data System
ISEEK Internet System for Education and Employment Knowledge
JOLTS Job Opening and Labor Turnover Survey
LAUS Local Area Unemployment Statistics
LEHD Longitudinal Employer Household Dynamics
MIDAS Metropolitan Information and Data Analysis Services
MLS Mass Layoff Statistics
MSA Metropolitan Statistical Area
NAAL National Assessment of Adult Literacy
NACE National Association of Colleges and Employers
NAEP National Assessment of Educational Progress
NAFTA North American Free Trade Agreement
NAICS North American Industry Classification System
NCES National Center for Education Statistics
NHES National Household Education Surveys
NLS National Longitudinal Surveys
NTSC National Training Support Center
OES Occupational Employment Statistics
OLMIS Oregon Labor Market Information System
OMB Office of Management and Budget
PALMIDS Pennsylvania Labor Market Information Database System
PSID Panel Study of Income Dynamics
QCEW Quarterly Census of Employment and Wages
DRAFT ANNUAL UPDATE February 2010 - 94 -
SBA Small Business Administration
SWA State Workforce Agency
SHRM Society for Human Resource Management
SIC Standard Industrial Classification
SIPP Survey of Income and Program Participation
SOC Standard Occupational Classification
TWC Texas Workforce Commission
UI Unemployment Insurance
US United States
WIA Workforce Investment Act of 1998
WIC Workforce Information Council
WIS Workforce Information System
DRAFT ANNUAL UPDATE February 2010 - 95 -
URL References
1 US Department of Labor Bureau of Labor Statistics wwwblsgov
2 US Department of Labor Employment and Training Administration wwwdoletagov
3 Occupational Information Network Resource Center httpwwwonetcenterorg
4 US Department of Commerce wwwcensusgov
5 US Census Bureau httpwwwcensusgov
6 US Census Bureau httpwwwcensusgov
7 Federal Assistance Award Data System httpwwwcensusgovgovswwwfaadshtml
8 Bureau of Economic Analysis httpbeagov
9 Economic Development Administration httpwwwedagov
10 US Patents and Trademarks httpwwwusptogovpatftindexhtml
11 EconDataNet httpwwwEconDataNet
12 TradeStats Express httptseexportgov
13 DoD Personnel and Procurement Statistics httpsiadappdmdcosdmilindexhtml
14 Office Economic Adjustment httpwwwoeagovOEAWebnsfhomereadform
15 Small Business Administration httpwwwsbagovadvoresearch
16 USDA Economic Research Service httpwwwersusdagovData
17 US Department of Education National Center for Education Statistics httpncesedgov
18 Bureau of Transportation Statistics httpwwwbtsgovprogramsomnibus_surveys
19 National Transportation Library httpntlbtsgovindexhtml
20 US Department of Interior httpinteriorgov
21 US Maps amp Data wwwgeodatagov
22 Energy Information Administration httpwwweiadoegov
23 Veterans Data and Information httpwww1vagovvetdata
24 Veterans Benefits Administration httpwwwvbavagov
25 FedStats httpwwwfedstatsgov
26 Science and Engineering Statistics httpwwwnsfgovstatistics
27 ERISS the Workforce Intelligence Company httpwwwerisscom
28 Manpower Inc httpwwwmanpowercom
29 Challenge Gray and Christmas httpwwwchallengergraycom
30 National Association of Colleges and Employees httpwwwnaceweborg
31 Economycom httpwwweconomycom
32 Interbiznet httpwwwinterbiznetcom
33 University of Michigan Panel Study of Income Dynamics httpwwwisrumichedusrcpsid
34 Rutgers University John J Heldrich Center for Workforce Development
For Workforce Development httpwwwheldrichrutgersedu
35 National Venture Capital Association (NVCA) httpwwwnvcaorgaboutnvcahtml
36 US Department of Labor Employment and Training Administration
CareerInfoNet httpwwwacinetorg
37 Florida Research and Economic Database (FRED) httpfredlabormarketinfocom 38 Washington Workforce Explorer httpwwwworkforceexplorerorg 39 Minnesota Internet System for Education and Employment Knowledge (ISEEK) httpwwwiseekorg
40 Nebraska Career Compass httpwwwdolstateneusnwdcentercfmPRICAT=4 ampSUBCAT=4C
41 Texas SOCRATES httpsocratescdrstatetxus
42 Texas Career Development Resources httpwwwcdrstatetxus
43 San Diego Workforce Partnership wwwworkforceorggeneratehtmlLMIlmi_subhomehtml
44 Pennsylvania Center for Workforce Information and Analysis httpwwwpaworkstatsstatepaus
45 State of Maine Department of Economic and Community Development
httpwwwmainebusinessworksorg
46 Quad City Development Group httpwwwquadcitiesorg
47 Career Builder httpwwwcareerbuildercom
48 Monstercom wwwmonstercom
49 Career Journalcom httpwwwcareerjournalcom
50 Society for Human Resource Management httpwwwshrmorg
51 Economic Policy Institute httpwwwepinetorg
DRAFT ANNUAL UPDATE February 2010 - 96 -
52 Federal Reserve System httpwwwfederalreservegov
53 Beige Book httpwwwfederalreservegovFOMCbeigebook2007
54 The Conference Board Help-Wanted Online Data Services
httpwwwconference-boardorgeconomicshelpwantedOnlinecfm
55 The Conference Board Employment Trends Index
httpwwwconference-boardorgeconomicsemploymentcfm
56 EmployOn LMI httpwwwemployoncomproducts_labormarketasp
57 Indeed Job Trends httpwwwindeedcomjobtrends
58 Manpower Employment Outlook Survey httpwwwmanpowercompressmeoscfm
59 Simply Hired Job Trends httpwwwsimplyhiredcomajobtrendshome
60 Community Economic Development Hot Reports httpcedcensusgov
61 Economic Modeling Specialist Inc (EMSI) httpwwweconomicmodelingcomwebtools
Note To ensure that there is no misinterpretation of an ETA endorsement of any type or
form the private sector and com Web sites included in the Catalogue and listed above are
not hyperlinked
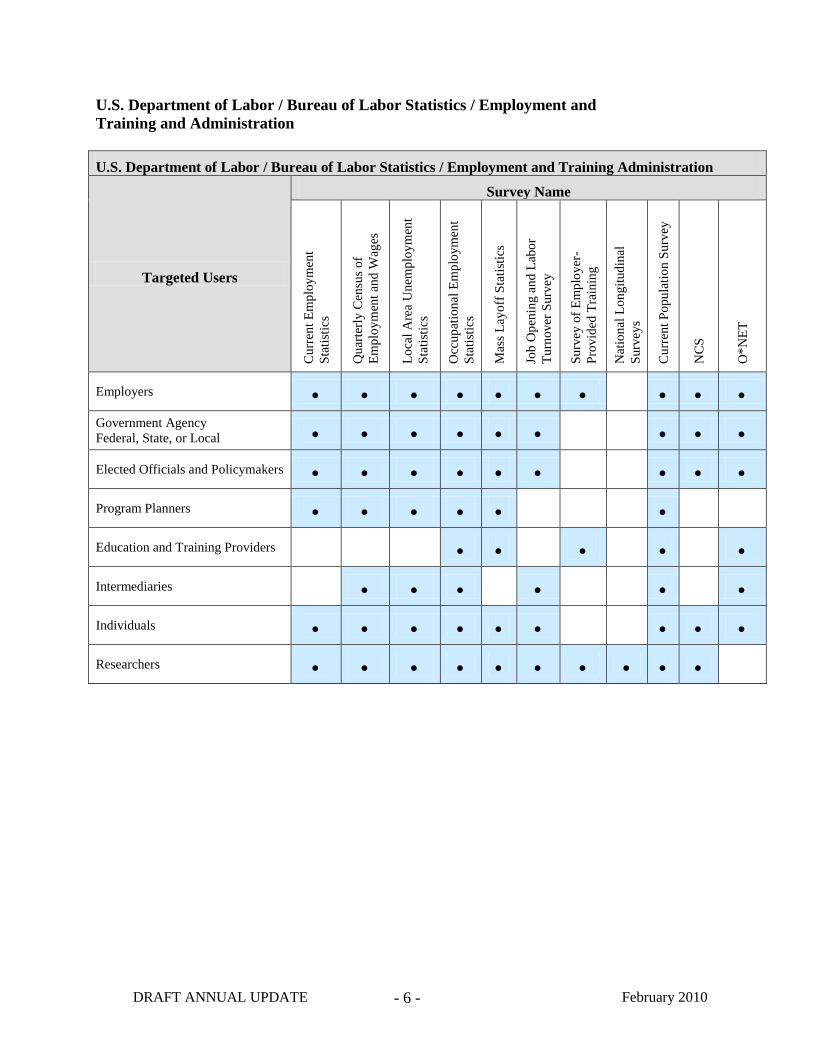