decisionspace geosciences: an eclipse-based visualization ... · © 2016 halliburton. all rights...
TRANSCRIPT
© 2016 Halliburton. All rights reserved.
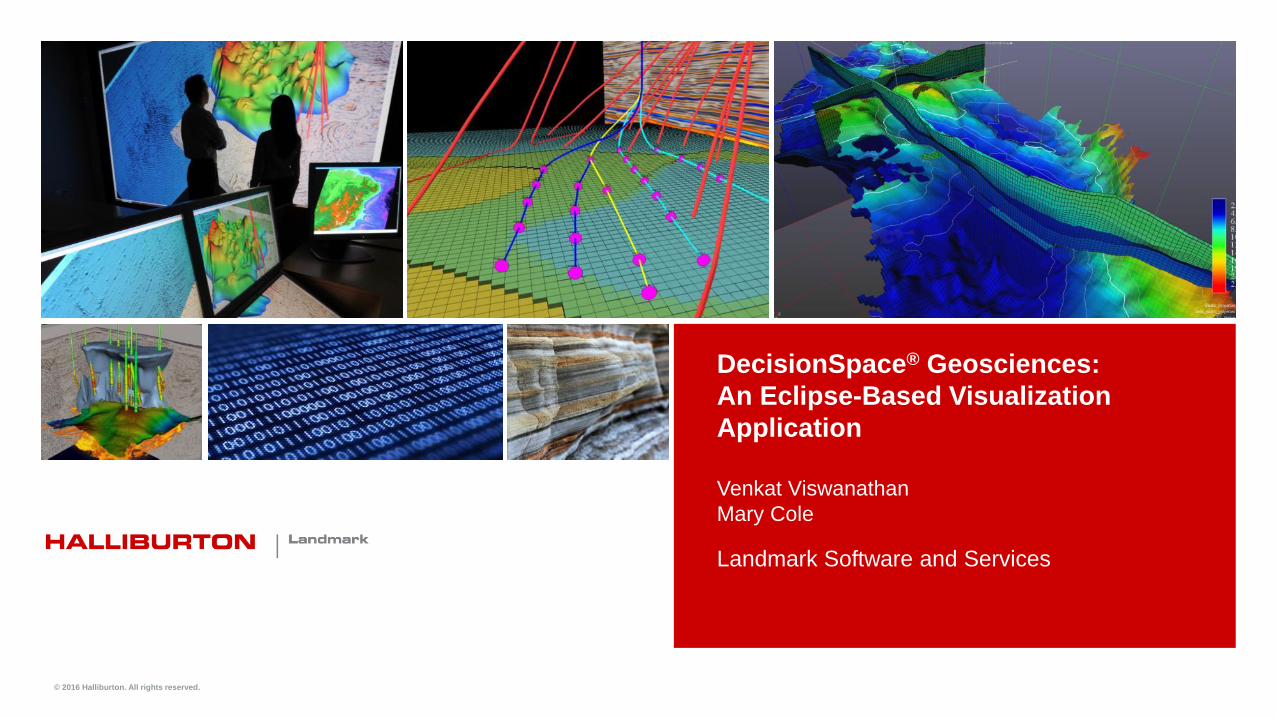
Landmark Software and Services
DecisionSpace® Geosciences:
An Eclipse-Based Visualization
Application
Venkat Viswanathan
Mary Cole
2 © 2016 Halliburton. All rights reserved.
Disclaimer
The content of this presentation is intended for informational purposes only and, unless otherwise
agreed in writing, shall not be incorporated into any contract. Landmark makes no representation
about the accuracy, reliability, completeness or timeliness of the information provided herein and
the information may be revised at any time without notice. The development, release and timing of
any features or functionality described for Landmark’s products remains at the sole discretion of
Landmark. This presentation and the information herein is presented “as is” and Landmark makes
no warranty, express or implied and Landmark assumes no liability in connection with the use of
information contained herein.
Nothing in this presentation should be construed as granting any license or right to use the property
of Landmark without the express written consent of Landmark and information presented herein
may be subject to applicable existing non-disclosure agreements. The trademarks, service marks
and logos displayed herein are the property of Landmark. All text, images, graphics and other
materials in this presentation are subject to the copyright and other intellectual property rights of
Landmark.

3 © 2016 Halliburton. All rights reserved.
The Challenge
Oil and gas harder to find
and expensive to produce
Drilling deeper, longer wells
at greater expense
“We find oil in new places
with old ideas, and in old
places with new ideas…”
Wytch Farm Dataset used with permission of BP and BP Wytch Farm partners

4 © 2016 Halliburton. All rights reserved.
Production
Portfolio of Prospects Exploration
Ranking
Portfolio of Discoveries Portfolio of Production
Operations
Optimization
Delineation
Appraisal
Planning
DecisionSpace Information Management and Platform
DecisionSpace® Geosciences
DecisionSpace® Drilling & Completions
DecisionSpace® Production
Pip
elin
e o
f P
ote
nti
al
Investm
en
ts
• Where to explore?
• Which prospects to investigate?
• Where to invest?
• What are the fluid volumes?
Prospecting/Exploration Development Production
• Which discoveries to develop?
• What are the reserves?
• How can I develop most efficiently?
• Real-time execution and control
• Asset model-driven performance
• Automatic optimization of production
activities
Ab
an
do
nm
en
t
Landmark Solutions

5 © 2016 Halliburton. All rights reserved.
Outline
Visualization
Data Types
Views
Demo
Architecture
Questions

6 © 2016 Halliburton. All rights reserved.
Data Types
Seismic: Prestack and Post-Stack
Horizons and Grids
Faults and GeoShells
Wells and Well Logs
3D Grids

7 © 2016 Halliburton. All rights reserved.
Seismic: Prestack and Post-Stack
3D and 4D volumes over thousands of
square kilometers
Hundreds of gigabytes to terabytes
in size
http://www.subsurfwiki.org/mediawiki/index.php?title=File:Seismic_acquisition_cartoon_marine.jpg&page=1

8 © 2016 Halliburton. All rights reserved.
Horizons and Grids
2D grids (height fields) representing
underground surface layers
Tens to hundreds of megabytes per
surface
Multiple surfaces

9 © 2016 Halliburton. All rights reserved.
Faults and GeoShells
Triangle meshes
representing faults or salt
formations
Hundreds of millions of
triangles

10 © 2016 Halliburton. All rights reserved.
Wells and Well Logs
Polyline trajectory
Logs: measurements along well
Lightweight trajectories; logs finely
sampled and can be tens of megabytes
Tens of logs per well
Thousands of wells

11 © 2016 Halliburton. All rights reserved.
3D Grids
Structured grids
Hexahedral meshes with
implicit layering
Discontinuities
Unstructured grids
No implicit layering
Tetrahedral
Hundreds of millions to
several billion cells per model
Multiple-property cells
Gigabytes

12 © 2016 Halliburton. All rights reserved.
Views/Editors
1D View
2D Views
3D View

13 © 2016 Halliburton. All rights reserved.
1D View
1D measurements along a parametrized
distance along borehole
Multiple 1D views juxtaposed for
correlation

14 © 2016 Halliburton. All rights reserved.
2D Views
Maps
Sections

15 © 2016 Halliburton. All rights reserved.
3D View
X and Y usually spatial
Z could be depth, time, age

16 © 2016 Halliburton. All rights reserved.
Demo

17 © 2016 Halliburton. All rights reserved.
Demo

18 © 2016 Halliburton. All rights reserved.
Factors Guiding Architecture
Data set sizes
Multiple views on the same data
Interactivity
Navigating within views
Changing display parameters
Editing: manual or automated
Leverage all computational power on
system: CPUs and GPUs
Portability
On-the-fly vs. a priori computation

19 © 2016 Halliburton. All rights reserved.
Visualization Architecture
3D View 2D Views (Map, Section) 1D Views (Well Correlation)
Manipulators
Domain/Application Scene Graph Eventing
OpenGL CUDA/OpenCL Java2D Hard Copy AWT SWT Touch
(Native)
Low Level Scene Graph (3D and 2D) Gesture Recognition
Visualization Framework

20 © 2016 Halliburton. All rights reserved.
JavaFX
Interesting
2D and 3D Scene graphs
Leverages OpenGL
Additional features needed
Extensibility at the underlying graphics API level:
custom rendering, access to programmable pipeline

21 © 2016 Halliburton. All rights reserved.
Additional Halliburton/Landmark Information
Stop by our booth Come to our 2nd talk
Moving a Large Swing-Based
Geoscience Application to Eclipse
1:30pm - Wednesday 3/9/2016
Grand Ballroom C

22 © 2016 Halliburton. All rights reserved.
Discussion and Questions?

23 © 2016 Halliburton. All rights reserved.