decentralization, local government elections and voter turnout in
TRANSCRIPT

IFPRI Discussion Paper 00754
March 2008
Decentralization, Local Government Elections and Voter Turnout in Pakistan
Kamiljon T. Akramov, International Food Policy Research Institute Sarfraz Qureshi, Innovative Development Strategies, Islamabad, Pakistan
Regina Birner, International Food Policy Research Institute and
Bilal Hasan Khan, Innovative Development Strategies, Islamabad, Pakistan
Development Strategy and Governance Division

INTERNATIONAL FOOD POLICY RESEARCH INSTITUTE
The International Food Policy Research Institute (IFPRI) was established in 1975. IFPRI is one of 15 agricultural research centers that receive principal funding from governments, private foundations, and international and regional organizations, most of which are members of the Consultative Group on International Agricultural Research (CGIAR).
FINANCIAL CONTRIBUTORS AND PARTNERS IFPRI’s research, capacity strengthening, and communications work is made possible by its financial contributors and partners. IFPRI gratefully acknowledges generous unrestricted funding from Australia, Canada, China, Denmark, Finland, France, Germany, India, Ireland, Italy, Japan, the Netherlands, Norway, the Philippines, Sweden, Switzerland, the United Kingdom, the United States, and the World Bank.
Published by
INTERNATIONAL FOOD POLICY RESEARCH INSTITUTE 2033 K Street, NW Washington, DC 20006-1002 USA Tel.: +1-202-862-5600 Fax: +1-202-467-4439 Email: [email protected]
www.ifpri.org
Notices 1 Effective January 2007, the Discussion Paper series within each division and the Director General’s Office of IFPRI were merged into one IFPRI–wide Discussion Paper series. The new series begins with number 00689, reflecting the prior publication of 688 discussion papers within the dispersed series. The earlier series are available on IFPRI’s website at www.ifpri.org/pubs/otherpubs.htm#dp. 2 IFPRI Discussion Papers contain preliminary material and research results. They have not been subject to formal external reviews managed by IFPRI’s Publications Review Committee but have been reviewed by at least one internal and/or external reviewer. They are circulated in order to stimulate discussion and critical comment.
Copyright 2008 International Food Policy Research Institute. All rights reserved. Sections of this material may be reproduced for personal and not-for-profit use without the express written permission of but with acknowledgment to IFPRI. To reproduce the material contained herein for profit or commercial use requires express written permission. To obtain permission, contact the Communications Division at [email protected].

iii
Contents
Acknowledgments v
Abstract vi
1. Introduction 1
2. Decentralization and Local Government in Pakistan 3
3. Rational-Choice Perspective and Voter Turnout 6
4. Data and Descriptive Findings 8
5. Identification Issues and Estimation Strategy 12
6. Main Empirical Results 15
7. Discussion and Implications 21
Appendix A: Data and Variable Descriptions 23
Appendix B: Summary of Variables 26
Appendix C: Socioeconomic Characteristics of Survey Respondents 27
References 30

iv
List of Tables
1. Electoral arrangements for local government elections in Pakistan* 4
2. Voter turnout in the 2005 local government elections 8
3. Correlations of voter characteristics with voter turnout 10
4. Correlations of voter turnout with district characteristics 11
5. Analysis of variance 13
6. Determinants of voter turnout in the 2005 local government elections (odds ratios from logistic regression) 18
7. Determinants of voter turnout in the 2005 local government elections (odds ratios from multilevel random-intercept logistic regressions) 19
8. Determinants of voter turnout by level of credibility (odds ratios from logistic regressions) 20
List of Figures
1. Classification of survey respondents by age........................................................................ 27
2. Classification of voters by gender........................................................................................ 27
3. Share of rural and urban respondents................................................................................... 28
4. Classification of respondents by educational background................................................... 28
5. Classification of respondents by occupational background................................................. 29
6. Classification of respondents by household financial situation........................................... 29

v
ACKNOWLEDGMENTS
Earlier versions of the paper were presented at the 2007 annual meeting of the American Political Science Association, August 30 through September 2, 2007, Chicago, Illinois; the International Conference on Governing for Millennium Development Goals with Focus on Incentives, Ownership and Institutions, April 28 and 29, 2007, Islamabad, Pakistan; and a seminar at IFPRI. The authors are pleased to acknowledge the valuable comments and suggestions of those participants, especially James A. McCann, Eric S. McLaughlin, Bingham Powell, Frederick Solt, Shenggen Fan, Barak D. Hoffman, and Tewodaj Mogues. The authors would also like to thank two anonymous reviewers for their comments. Any remaining errors are the responsibility of the authors.

vi
ABSTRACT
Decentralization has the potential to improve the accountability of government and lead to a more efficient provision of public services. However, accountability requires broad groups of people to participate in local government. Thus, voter turnout at local government elections is an important component of government accountability. This study used survey data on the 2005 local government elections in Pakistan to analyze the impact of electoral mechanisms, the credibility of elections, and voters’ socioeconomic characteristics on voter turnout. The rational-choice perspective is applied to develop the specifications of the empirical model. The empirical analysis is based on a series of standard and multilevel random-intercept logistic models. Our important findings reveal that (1) voter turnout is strongly associated with the personal and social gratifications people derive from voting; (2) the preference-matching ability of candidates for local government positions is marginal; and (3) the introduction of direct elections of the district nazims—a key position in local government—might improve electoral participation and thus create a precondition for better local government accountability. The findings also suggest that less educated people, farmers, and rural people are more likely to vote.
Key words: decentralization, local government elections, political participation, voter turnout, public service provision.
1
1. INTRODUCTION
The decentralization of political, administrative, and fiscal authority to local governments is an essential part of the overall development strategies of many developing and transition countries. Two arguments are commonly given in favor of decentralization. First, some proponents claim that decentralization improves allocative efficiency by allowing greater differentiation in the provision of public goods and services. This is also known as the preference-matching argument, reflecting the belief that because local governments are closer to the people than the central government, they are better informed about the preferences and circumstances of the residents. The second argument posits that decentralization increases the accountability of government. Proponents of this argument contend that people tend to be more aware of the actions of local governments than they are of the actions of the higher levels of government because local governments are closer to their constituents (Shah 2006).1
The literature uses the accountability mechanism in a broader sense, rather than for narrow political accountability, and refers to information flows and incentives, rent seeking, and corruption. Nevertheless, in political economy analyses of incentives and collective action in the public sector (e.g., Besley and Coate 2003; Persson and Tabelini 2000; Seabright 1996), political accountability is at the center of the debate on decentralization. Some authors have studied the role of political market imperfections in service delivery and economic development and found that policy breakdowns and the inability of politicians to make credible pre-electoral promises to voters led them to underprovide public services (Keefer 2004, 2005; Keefer and Khemani 2003). Hindricks and Lockwood (2005) suggest that political accountability may be problematic when elected representatives either have policy priorities different from those of the electorate or are subject to lobbying by interest groups or to political clientelism. The notion of political clientelism refers to the proffering of material benefits in return for electoral support (Stokes 2007). The two subclasses of political clientelism are patronage and vote buying. The criterion for selecting clients and vote sellers is, will you support me? Can decentralization help to effectively address these problems at localities? An appealing argument in this vein is that the competitive pressure associated with winning local elections could foster greater political accountability among governments (Bardhan and Mookherjee 2006).
However, the actual success of decentralization in improving allocative efficiency and accountability depends on the existence of certain conditions (Litvack et al. 1998). One important condition that affects political accountability is the competitive electoral mechanism, and at the core of the electoral mechanism is the vote. The vote is a primary tool for citizens to make their governments accountable. Do the electoral rules of local government provide sufficient incentives to elected representatives to deliver necessary public services? Are the conditions of fair and credible elections more conducive at the local level? Does the public have confidence that local government elections are trustworthy?
Although political participation in developed countries has garnered considerable attention (for an overview of these studies, see Przeworski 2007), political participation, especially voter turnout, in developing countries has been largely ignored. Even more understudied is voter turnout in local government elections in developing countries. Nevertheless, studies of political participation at the local government level have been carried out for Chinese countryside by Jennings (1997) and some Indian states by Krishna (2006), Khemani (2000), Crook and Manor (1998), and Bardhan et al. (2007). These studies found that the main determinants of political participation in the Indian states of Rajastan, Madhya Pradesh, Karnataka, and West Bengal were education, gender, and immigrant status rather than land or caste. As the scope of decentralization increases throughout the developing world, along with the devolution of political and economic authority to local governments, the phenomenon of political
1 The origins of these arguments go back to Stigler’s (1957) two principles of jurisdictional design: (1) the closer a
representative government is to the people, the better it works, and (2) people should be able to vote for the kind and amount of public services they want.

2
participation in local government needs to be better understood. This is of interest to governments, donor agencies, and development practitioners seeking to strengthen democratic governance.
This study used survey data on the 2005 local government elections in Pakistan to analyze the impact of electoral mechanisms, the credibility of elections, and voters’ socioeconomic characteristics on voter turnout. Pakistan represents an interesting case for studying local government elections because it underwent a major process of political decentralization in 2000–2001. The new structure of local governments in Pakistan consists of three levels: union councils (lower tier), tehsil councils (medium tier),2 and district councils (upper tier). The members and heads of the union councils are directly elected by citizens through public vote. The electoral rules also assume political linkages between various levels of local government by ensuring that the heads of tehsil and district governments are elected indirectly by the union council members.
The theoretical foundation of the paper is the rational-choice perspective of voter turnout, which holds that a positive relationship should exist between the level of voter turnout and (1) the instrumental and consumption benefits of voting and (2) the probability of affecting the outcomes of election. The model also predicts a negative relationship between the level of voter turnout and the cost of voting.
The empirical analysis is based on the series of logistic and multilevel models of voter turnout by controlling for the local government electoral mechanisms and the socioeconomic characteristics of the electorate in Pakistan. Our dependent variable is the reported behavior of voters after their voting experience. The data allow us to test how voter turnout is influenced by variations in the perceived benefits and costs of voting and the probability of affecting the outcome of an election. Overall, the results show that voter turnout is strongly associated with the personal and social gratifications people derive from voting, but the preference matching between candidates and voters and the credibility of elections play important roles in determining voter turnout. The results from a multilevel model suggest that these effects vary across districts depending on voters’ level of education. Another important finding indicates that when people care about who will be elected in an indirect election of a district nazim, they are more likely to vote, even if they perceive the election is less credible. The findings also suggest that people with less education, farmers, and residents of rural areas are more likely to vote.
The paper is organized into seven sections. Section 2 reviews the decentralization reforms initiated by President Musharraf in 2000. Section 3 presents the conceptual framework, which is based on the application of the rational-choice perspective to voter turnout—in particular, the calculus-of-voting model. In Section 4, we describe the data and present the descriptive findings, highlighting specific circumstances and conditions associated with local government elections in Pakistan. Section 5 discusses econometric issues related to the structure of our data, and explains our identification strategy. In Section 6, we present the empirical results, and Section 7 discusses the findings and the implications that follow from the analysis. Three appendixes provide details on the data and definitions of the variables.
2 Tehsil is the medium tier of local governments in the rural districts of provinces other than Sindh. In Sindh, the middle tier
of local government is called taluka.

3
2. DECENTRALIZATION AND LOCAL GOVERNMENT IN PAKISTAN
Although Pakistan has undergone several waves of decentralization during the past decades,3 the devolution plan introduced by President Musharraf’s government in 2000 represents the most comprehensive and far-reaching initiative so far. Previously, the local government system did not have a meaningful role because local governments were rather inactive and most of the government functions were carried out at the provincial level. Devolution significantly changed public service delivery by passing the authority to allocate expenditures for various services from the provincial level to the district level and by introducing political and administrative accountability mechanisms for elected local governments. Further, the Musharraf plan devolved the determination and enforcement of laws related to property and labor rights as well as access to justice.
The structural changes introduced under devolution in Pakistan aim at influencing the incentives within the public sector through a pragmatic mixture of political, fiscal, and administrative measures that will both empower local governments and make them accountable for public service delivery (Manning et al. 2003).4 Two types of incentives to improve service delivery under devolution were created. First, it was assumed that citizen power, in the form of “voice,” can create incentives for local governments to improve public service delivery by allocating resources efficiently and holding providers accountable for service delivery outcomes. Second, devolution created a mechanism that ensures that local governments have authority over front-line service providers (ADB et al. 2005a). The literature suggests, however, that the outcome of decentralization depends to a large extent on the technical design and implementation of new political, administrative, and fiscal measures (Crook and Sverrisson 2001; Guess 2005). An important change in the fiscal arrangements of local governments under devolution has been the establishment of a “rule-based” intergovernmental fiscal transfer system. The major elements of this rule-based system are twofold. First, intergovernmental budgetary transfers are nondiscretionary in character and determined by the Provincial Finance Commission using a special formula. Second, the transfers are no longer lapsable and continue to be retained by the respective local governments. However, the extent of fiscal decentralization remains limited because district governments continue to have limited revenue bases and are highly dependent on provincial and federal budgetary transfers.
The creation of a new local government structure, with special electoral arrangements, is an important element of devolution in Pakistan. The devolution reforms replaced the deconcentrated government structure that was previously in place with a new one that includes three levels of elected local government consisting of 96 district councils, 337 tehsil councils, and 6,022 union councils. Decision-making power and control over the financial resources largely reside at the district level. In addition, citizen–community boards have been created to promote greater citizen participation in local policymaking. Responsibilities for regulation of civil society activities have also been devolved to the district level.
Each level of local government has elected councils, nazims (mayors), and naib (deputy) nazims. The main aspects of the electoral mechanism for local government elections, established under devolution in Pakistan, are summarized in Table 1. The foundation of the electoral system of the three-tier local government structure is the union council, which consists of several villages. All union councils are approximately equal in size, and council members are directly elected by all registered voters on a nonparty basis. Women, peasants, and minority groups have reserved seats on union councils. A nazim and naib nazim are directly elected to the union council on a joint ticket.
3Pakistan has had a local government tradition since the 1950s. During the period 1947–1958, local governments in Pakistan operated under administrative decentralization, financing up to 95 percent of their expenditures with their own revenue sources. Two previous attempts to devolve power in Pakistan were made after that, but neither was complete nor survived the regime that promulgated the reforms. In each case, it was a military regime that introduced decentralization reforms (the Basic Democracies Order in 1959 under Ayub Khan and the 1979 Local Government Ordinance of General Zia ul Haq) that were subsequently dismantled by elected civilian regimes. For a historical overview of decentralization in Pakistan, see Cheema et al. (2003), which covers the reforms from the pre-independence period to the current revival of local governments.
4 For detailed assessments of these measures of devolution in Pakistan, see ADB et al. (2005a) and Cheema et al. (2003).
4
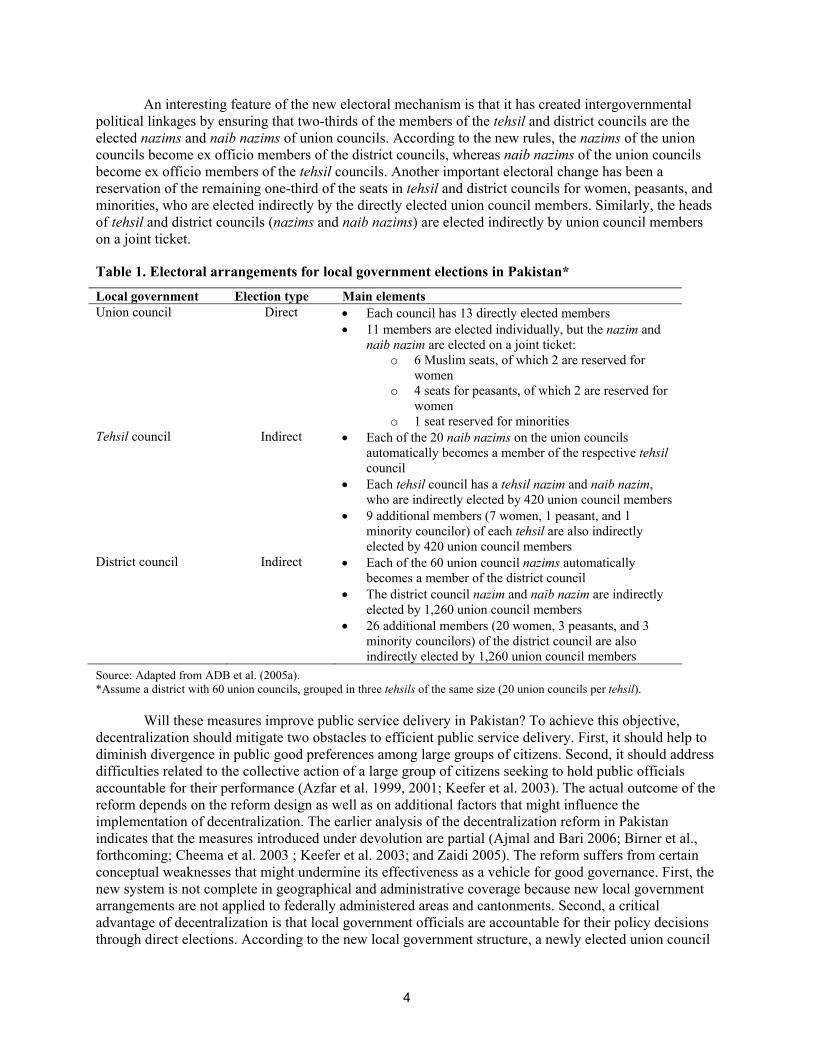
An interesting feature of the new electoral mechanism is that it has created intergovernmental political linkages by ensuring that two-thirds of the members of the tehsil and district councils are the elected nazims and naib nazims of union councils. According to the new rules, the nazims of the union councils become ex officio members of the district councils, whereas naib nazims of the union councils become ex officio members of the tehsil councils. Another important electoral change has been a reservation of the remaining one-third of the seats in tehsil and district councils for women, peasants, and minorities, who are elected indirectly by the directly elected union council members. Similarly, the heads of tehsil and district councils (nazims and naib nazims) are elected indirectly by union council members on a joint ticket.
Table 1. Electoral arrangements for local government elections in Pakistan*
Local government Election type Main elements Union council Direct • Each council has 13 directly elected members
• 11 members are elected individually, but the nazim and naib nazim are elected on a joint ticket:
o 6 Muslim seats, of which 2 are reserved for women
o 4 seats for peasants, of which 2 are reserved for women
o 1 seat reserved for minorities Tehsil council Indirect • Each of the 20 naib nazims on the union councils
automatically becomes a member of the respective tehsil council
• Each tehsil council has a tehsil nazim and naib nazim, who are indirectly elected by 420 union council members
• 9 additional members (7 women, 1 peasant, and 1 minority councilor) of each tehsil are also indirectly elected by 420 union council members
District council Indirect • Each of the 60 union council nazims automatically becomes a member of the district council
• The district council nazim and naib nazim are indirectly elected by 1,260 union council members
• 26 additional members (20 women, 3 peasants, and 3 minority councilors) of the district council are also indirectly elected by 1,260 union council members
Source: Adapted from ADB et al. (2005a). *Assume a district with 60 union councils, grouped in three tehsils of the same size (20 union councils per tehsil).
Will these measures improve public service delivery in Pakistan? To achieve this objective, decentralization should mitigate two obstacles to efficient public service delivery. First, it should help to diminish divergence in public good preferences among large groups of citizens. Second, it should address difficulties related to the collective action of a large group of citizens seeking to hold public officials accountable for their performance (Azfar et al. 1999, 2001; Keefer et al. 2003). The actual outcome of the reform depends on the reform design as well as on additional factors that might influence the implementation of decentralization. The earlier analysis of the decentralization reform in Pakistan indicates that the measures introduced under devolution are partial (Ajmal and Bari 2006; Birner et al., forthcoming; Cheema et al. 2003 ; Keefer et al. 2003; and Zaidi 2005). The reform suffers from certain conceptual weaknesses that might undermine its effectiveness as a vehicle for good governance. First, the new system is not complete in geographical and administrative coverage because new local government arrangements are not applied to federally administered areas and cantonments. Second, a critical advantage of decentralization is that local government officials are accountable for their policy decisions through direct elections. According to the new local government structure, a newly elected union council
5
is created at the district level and headed by an indirectly elected nazim of the district council. The district nazim is granted a large amount of decision-making power with considerable control over resource allocation. However, the procedure for indirect elections of the district nazims introduces weaker electoral constraints and may weaken the ability of voters to hold them accountable. This could limit the district nazims’ incentives for a more efficient provision of public services. Another weakness of devolution plan is its fiscal decentralization element. Although local governments have been given new statutory sources of revenue, they still have very limited revenue bases, and most of their funds come from higher levels of government. The formula for allocation of fiscal transfers is determined by the Provincial Finance Commission. The members of that commission are nominated by the provincial government, and no meaningful political link exists between elected local governments and the commission.
The literature on decentralization indicates the importance of high-level political support, local technical capacity, and cultural and institutional factors to successful implementation of the reform (Guess 2005). Obviously, high-level political support for decentralization in Pakistan is very strong, because President Musharraf made devolution the centerpiece of his overall reform program. However, the most immediate issue is whether local capacity is conducive to decentralized decision making. The widespread consensus in Pakistan among both proponents and skeptics of the devolution plan is that without sufficient training and capacity building at the local level, the national decentralization program will not be successful (Birner et al., forthcoming).
The success of decentralization also depends on conditions for political competition and accountability being more favorable at the local level and on the public being able to demand the efficient provision of public services. Keefer et al. (2003) suggest that the policy horizons of local officials may be more uncertain than those of federal and provincial officials because of the past history of decentralization in Pakistan. These uncertain policy horizons may encourage local politicians to engage in rent seeking rather than focusing on service provision. Further, skeptics and opponents of decentralization in Pakistan view the existing political culture and weak civil society as threats to or constraints on decentralization. It is true that neither competitive political culture nor viable civil organizations exist in Pakistan. Nevertheless, the country does have repressed local and civic traditions that the decentralization could reactivate. Therefore, civil society development is part of Pakistan’s decentralization reform. Local government elections play an important role in this regard as a primary tool for citizens to control their governments and hold them accountable. By turning out to vote, people can send signals to government about their preferences and problems.
Voting is obviously only one step, but it is essential to the accountability chain that links the public with elected officials. Therefore, a better empirical understanding of this important mechanism and the factors that influence voter turnout is a critical element in assessing the earlier success of decentralization. The following sections of the paper apply the rational-choice perspective to the examination of voter turnout using data from the local government elections of 2005.
6
3. RATIONAL-CHOICE PERSPECTIVE AND VOTER TURNOUT
There is a considerable literature on how and why people vote in elections. Studies have used various approaches to explain voter turnout and can be broadly classified into two groups: One group of studies uses an implicit approach and describes voter turnout in terms of demographic, social, economic, cultural, and other factors. A second group of studies examines voter turnout from the rational-choice perspective. The rational-choice perspective assumes that individuals will make their decisions whether to vote by comparing the expected benefits of voting with its cost. Various models of voter turnout are built on the rational-choice perspective. This section briefly lays out the calculus-of-voting model, which is one of the two most important rational-choice models of voter turnout.
As Aldrich (1993) notes, almost all scholars agree with the notion that preferences determine political behavior. By reintegrating politics and economics under a common paradigm and deductive structure, rational-choice theory explains how those individual preferences determine behavior. From the rational-choice perspective, voter turnout is a collective-action problem in which citizens are asked to sacrifice time and transportation expenses on behalf of a public good, the elected government. The most widely used rational-choice model of voter turnout is the calculus-of-voting model developed by Riker and Ordeshook (1968), which incorporates insights from Downs’ (1957) classic economic theory of democracy. According to the calculus-of-voting model, voters operate rationally, and their decisions whether to vote are based on the expected utility of the vote.
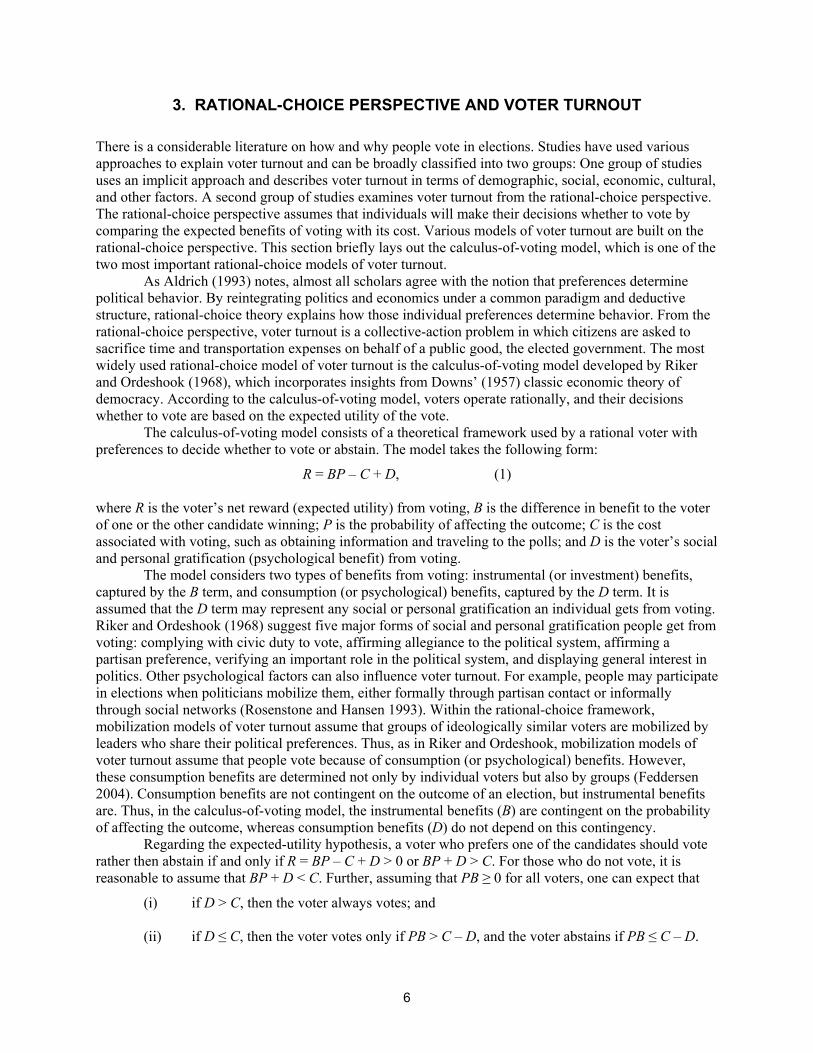
The calculus-of-voting model consists of a theoretical framework used by a rational voter with preferences to decide whether to vote or abstain. The model takes the following form:
R = BP – C + D, (1)
where R is the voter’s net reward (expected utility) from voting, B is the difference in benefit to the voter of one or the other candidate winning; P is the probability of affecting the outcome; C is the cost associated with voting, such as obtaining information and traveling to the polls; and D is the voter’s social and personal gratification (psychological benefit) from voting.
The model considers two types of benefits from voting: instrumental (or investment) benefits, captured by the B term, and consumption (or psychological) benefits, captured by the D term. It is assumed that the D term may represent any social or personal gratification an individual gets from voting. Riker and Ordeshook (1968) suggest five major forms of social and personal gratification people get from voting: complying with civic duty to vote, affirming allegiance to the political system, affirming a partisan preference, verifying an important role in the political system, and displaying general interest in politics. Other psychological factors can also influence voter turnout. For example, people may participate in elections when politicians mobilize them, either formally through partisan contact or informally through social networks (Rosenstone and Hansen 1993). Within the rational-choice framework, mobilization models of voter turnout assume that groups of ideologically similar voters are mobilized by leaders who share their political preferences. Thus, as in Riker and Ordeshook, mobilization models of voter turnout assume that people vote because of consumption (or psychological) benefits. However, these consumption benefits are determined not only by individual voters but also by groups (Feddersen 2004). Consumption benefits are not contingent on the outcome of an election, but instrumental benefits are. Thus, in the calculus-of-voting model, the instrumental benefits (B) are contingent on the probability of affecting the outcome, whereas consumption benefits (D) do not depend on this contingency.
Regarding the expected-utility hypothesis, a voter who prefers one of the candidates should vote rather then abstain if and only if R = BP – C + D > 0 or BP + D > C. For those who do not vote, it is reasonable to assume that BP + D < C. Further, assuming that PB ≥ 0 for all voters, one can expect that
(i) if D > C, then the voter always votes; and
(ii) if D ≤ C, then the voter votes only if PB > C – D, and the voter abstains if PB ≤ C – D.

7
There is considerable literature on the merits and weaknesses of rational-choice models of voter turnout, including the calculus-of-voting model.5 However, even fundamental critics of the rational-choice model of voter turnout cannot ignore its usefulness in estimating the marginal impacts of various political and socioeconomic factors on voter turnout. As Green and Shapiro (1996) indicate, one advantage of the rational-choice perspective over competing explanatory approaches is the ability to estimate the marginal impacts of various factors on voter turnout. Those estimates can then be used to make plausible predictions about the effects of changing, for example, the costs of voting on voter turnout or political participation.
Rendering inferences from equation (1) requires measuring each component of the calculus-of-voting model. Suppose we can obtain some measures of the variables B, P, C, and D for a sample of voters. Then we can estimate the probability of a given individual voting as a function of the main components of the model. The next section of the paper operationalizes the main components of the equation (1) in the context of local government elections in Pakistan.
5 For detailed discussions of the merits and weaknesses of rational-choice models, see Aldrich (1993), Jackman (1993),
Dowding (2005), Blais (2000), Blais et al. (2000), and Green and Shapiro (1996).

8
4. DATA AND DESCRIPTIVE FINDINGS
This study used individual- and district-level data for empirical analysis. The individual-level data came from a survey conducted after the 2005 local government elections in Pakistan by the Pattan Development Organization, a Pakistan-based nongovernmental organization. Researchers interviewed a random sample of more than 3,500 voters after the elections. The answers to the survey questions reflect respondents’ perceptions and observations before, during, and after the elections regarding economic, political, and social concerns. The survey also provided information about the socioeconomic characteristics of the respondents. District-level data were obtained from the Pakistan Human Development Report (UNDP 2003) and include population size, population density, the Human Development Index, and the Educational Attainment Index.
The answers to the survey questions were used to create the dependent and explanatory variables (for the descriptions of all variables and texts of respective questions see Appendix A, and a summary of the variables is presented in Appendix B). The dependent variable is reported voter behavior following voting. The question offered the binary response categories of yes = 1 and no = 0. For the 2005 local government elections, average turnout among male respondents was 65.5 percent compared with a 46.5 percent turnout among female voters (Table 2).6 As Table 2 shows, voter turnout across four provinces varied significantly. The highest total voter turnout, 62.1 percent, was observed in Punjab, whereas voter turnout in the other three provinces was below 50 percent. It is also evident that female electoral participation was about 20 percent lower than male participation.
Table 2. Voter turnout in the 2005 local government elections
Province Male (%) Female (%) Total (%) Punjab 68.9 55.4 62.1 Sindh 57.2 36.1 46.7 NWFP* 71.7 27.4 49.1 Baluchistan 54.2 43.5 49.2 Total 65.5 46.5 56.4
Source: Computed from the postelection survey conducted by Pattan Development Organization. * North West Frontier Province
For the instrumental benefits of voting, the B term in the calculus-of-voting model, the study used two variables. First, respondents of the postelection survey were asked how much attention they expected new union council members to pay to the problems that ordinary people experience in determining development priorities. The question reflects the assumption that voicing the desire for better service provision through voting will be more effective if voters have an idea about the policy priorities of candidates. The surveyed voters could choose from five response categories: “a lot,” “some,” “very little,” “not at all,” and “don’t know.” Obviously, voters who expected candidates to pay more attention to the problems of ordinary people would benefit more from voting. Only 47 percent of the survey respondents chose either “a lot” or “some,” indicating that voters’ expectations about the developmental benefits of voting were moderate, not high. This, in turn, indicates that there is a preference-matching problem between candidates and voters.
The second variable related to instrumental benefits was based on the important aspect of the electoral mechanism for local government elections mentioned earlier: that “powerful” district nazims are elected indirectly by directly elected union council members. Thus, more informed voters should be concerned about how union council members will vote in the indirect election of the district nazim,
6 The voter turnout based on postelection survey data is slightly higher than the official turnout percentages published by the
Election Commission of Pakistan. However, both official and survey data show similar differences between male and female turnout and across the four provinces.

9
because the district nazim is the key figure in local government. The survey included a question asking voters about their likely choices if they were able to vote in the district nazim election. The voters were offered four choices: “would have voted for present successful district nazim,” “would have voted for an opponent candidate of present successful district nazim,” “would not have voted,” and “don’t know.” It is reasonable to assume that respondents who chose either the first (43 percent) or second category (17 percent) would benefit from voting more than the other two categories would.
The P term in the calculus-of-voting model—the probability of affecting the outcome—was measured by the perceived credibility of the 2005 local government elections. Only 51 percent of the respondents expressed their belief that the results accurately reflected the way people voted. The rest of the respondents either believed that some rigging occurred or had no opinion (responding with “don’t know”). This suggests that the credibility of the 2005 local government elections was problematic. It seems plausible that people who perceived that the elections were credible would expect a higher probability of affecting the outcome of the elections than would people with the opposite expectation. On the basis of the perceived credibility of the 2005 elections, we constructed a binary variable that proxies for the probability of affecting the outcome, with 1 indicating those who thought the elections were credible.
Another element in the model is the cost term. The survey did not include any questions that would have allowed us to directly measure the costs of voting associated with obtaining information and traveling to the polls. However, some questions in the survey allowed us to indirectly measure the costs of obtaining information and traveling to the polls. First, respondents were asked about their perceptions regarding the security situation during the elections. Approximately 60 percent of the respondents perceived that the situation during the 2005 local government elections was more peaceful. The rest of the respondents felt that it was less peaceful. This is a reasonable indirect measure of the cost of voting associated with traveling to the polls. Second, the cost of acquiring the information necessary to decide how to vote was measured indirectly by an item asking respondents about the support that political parties extended to candidates. About 48 percent of the survey respondents felt that the candidates received greater support from their parties. It is reasonable to expect that these respondents would also be more likely to easily obtain information about candidates than the other group.
Other important components of the calculus-of-voting model are the social and personal gratifications an individual gets from voting, including consumption benefits that are determined in part by social groups. As mentioned earlier, the literature on voter turnout largely acknowledges that a normative sense of interest in politics and civic duty may affect the likelihood of an individual turning out to vote.7 Also, interest in politics and civic duty could not be “politically inert” but may include highly political motives and values (Aldrich 1993). Further, voting based on individual gratifications can be seen as a surrogate for clientelism (Putnam et al. 1994). The study used three indirect measures of social and personal gratifications. As one measure, the survey asked voters in the sample whether they went to a speech or rally given by one of the candidates for union council. Only one-third of respondents participated in those kinds of election events. The second measure of personal gratification was the closeness of the survey respondents to political parties. About 35 percent of respondents stated the felt close to one or another party. The third measure was the impact of voter mobilization on voter turnout. Literature suggests that similar groups of voters are mobilized by their leaders (Feddersen 2004; Lee 2004; and Uhlaner 1989). An example of such groups in Pakistan is a local organization of political parties in which members share common political perspectives. Thus, for this study, voter mobilization was indirectly measured by asking surveyed voters whether they had participated in local meetings of their parties. One-fourth of the respondents indicated they had participated in such meetings.
7There is ongoing debate among scholars about the role of duty in the calculus of voting. Some argue that the sense of duty
should be considered as exogenous to the rational-choice model (e.g., see Blais et al. 2000). At the same time, Aldrich (1993) argues that an expanded view of the elements of duty may open the rational-choice model of voting to include long-term beliefs and values. However, for the purposes of this study, this debate is not important because either way, it may be included in empirical estimations, but the results will be interpreted differently.

10
The literature on voter turnout suggests that the socioeconomic and demographic characteristics of the electorate, such as age, gender, economic status, type of locality (rural or urban), and occupational and educational backgrounds, play an important role in voters deciding to participate in elections (Merrifield 2003). Therefore, it is important to control for the socioeconomic characteristics of the electorate when conducting an empirical analysis of voter turnout. The study divided voters into various groups based on analysis of survey respondents’ age, gender, educational and occupational background, and economic status (for graphical illustration of these classifications, see Appendix C). As in many developing countries, the electorate in Pakistan is dominated by rural (64 percent), young (about 45 percent of voters are under age 30), and less educated voters. Almost 6 in 10 survey respondents were either illiterate (44 percent) or had only a primary education (14 percent). As to occupational background, manual laborers (23 percent) and farmers (22 percent) were the two largest groups in Pakistan’s electorate. Two other important occupational groups were self-employed (15 percent) and government employees (11 percent). About 12 percent said that sometimes they did not have enough income to eat three meals a day. Nearly half of the survey respondents had enough income only to provide adequate food and shelter for their families. Only 1 in 10 said that they had money left over after meeting their basic needs.
Table 3 presents the correlations of voter turnout and voters’ socioeconomic characteristics. Voter turnout appears to be positively correlated with age and marital status. Some negative association with voting and the level of education is evident. It is also evident that being a resident of a rural area, male, or a farmer is positively correlated with voter turnout. However, there is virtually no correlation between voter turnout and economic status or being employed in the government or private sector. Perhaps these relationships are neither immediate nor linear if they exist at all.
Table 3. Correlations of voter characteristics with voter turnout
Variable Voting Age 0.26* Status 0.01 Rural 0.12* Education –0.04* Gender (male) 0.19* Married 0.15* Farmer 0.16* Government employee –0.01 Private sector employee –0.01 Unemployed 0.05*
Note: Spearman correlation coefficients are reported. * Statistically significant at 5% significance level.
Further, Ghosh (2006) reports that voter turnout is affected by heterogeneity in the demographic and socioeconomic compositions of the electorate within a constituency. Ideally, constituency level measures are used to control for that type of heterogeneity. We used population size and density, per capita income, the Human Development Index, and the Educational Attainment Index at the district level for these purposes. Table 4 reports the correlation coefficients of these variables with voter turnout. Voter turnout appears to be negatively correlated with the socioeconomic characteristics of districts. Although these correlations are weak, they are statistically significant except for per capita income.

11
Table 4. Correlations of voter turnout with district characteristics
Variables Voting Population size –0.06* Population density –0.11* Per capita income –0.02 Human Development Index –0.05* Educational Attainment Index –0.07*
Note: Spearman correlation coefficients are reported. * Statistically significant at 5% significance level.
The analysis of correlation coefficients suggests that correlations of both voter and district characteristics with voter turnout tend to change across provinces and districts. For example, the correlation coefficient between voter turnout and the Human Development Index at the district level increases from –0.08 in Punjab to –0.18 in Sindh. Further, the correlation coefficients between voter turnout and voters being farmers varies from 0.14 to 0.18 in Punjab, Sindh, and the North West Frontier Province (NWFP), while there is virtually no statistically significant association between these two variables in Baluchistan. Similar observations can be made at the district level. These observations point to some important differences in voter turnout across provinces and districts. This is to be expected because the analysis of voter turnout in this study focuses on voters in varying clusters. There could be several levels of analysis, including voters, unions, tehsils, districts, and provinces, with lower levels embedded or nested within the higher levels. The empirical analysis of voter turnout using multilevel data confronts some methodological challenges. The sources of those challenges and possible solutions are discussed in the following section.

12
5. IDENTIFICATION ISSUES AND ESTIMATION STRATEGY
The core question regarding voter turnout is how the perceived benefits and costs of voting, the credibility of elections, and the individual characteristics of voters influence voters’ decisions to vote. This question can be modeled by using the standard logistic regression model formulated as a latent-response model. The assumption is that underlying the observed dichotomous response yi (whether an individual votes or not) is the unobserved or latent continuous response ŷi, representing the propensity to vote compared with not voting. For example, if the latent response is greater than 0.5, the observed response is 1:
yi = 1, if ŷi ≥ 0.5, and 0 otherwise
A logistic regression model is then specified for the latent response ŷi:
logit{Pr(ŷi = 1/(X1i, X2i, …, Xni))} = β0 + β1X1i + β2 X2i + … + βnXni + ξi (2)
where X1i, X2i, …, Xni are explanatory variables, including the components of the calculus of voting as perceived by voters and individual voter characteristics, and ξi is residual error term. The residual term is assumed to have a logistic distribution with mean zero and variance π2/3. The model can alternatively be written, for yi in odds, as follows: Pr(yi = 1/(X1i, X2i, …, Xni))
Odds(yi = 1/(X1i, X2i, …, Xni) = ---------------------------------------- = 1 – Pr(yi = 1/(X1i, X2i, …, Xni))
= exp (β0 + β1Xi + β2X2i + … + βnXni) (3)
The estimated parameters β1, β2, and βn are interpreted as the change in the log odds for a one-unit increase in a particular covariate, holding all the other covariates constant. The marginal probabilities estimated by the standard logistic regression model fit the observed data well, given that the observations on individuals from the same district or province are mutually independent. However, this is likely to be false because the data used in this study focus on individual voters located in various clusters. Within strata, the survey data were collected in three stages: sampling districts, then sampling villages or primary sampling units (PSUs), and then selecting individuals from within each cluster. At the least, there may be neighborhood effects, with local peculiarities copied by those who live in the same union or district and becoming more or less uniform within a neighborhood. Thus, we could not assume that individual observations were independent because of the dependence among observations within the same cluster. This also led us to use a hierarchical data structure, which can involve the use of stratification variables at some level. The hierarchy in the data can be established as the following: individual voters nested in union councils, union councils nested in tehsil councils, tehsil councils nested in districts, and districts nested in provinces. Therefore, in conducting empirical statistical analysis, we had to pay attention to the sources of variation in the individual-level data.
There are potentially four levels of analysis: individual voters, PSUs, districts, and provinces, with lower levels embedded, or nested, within the higher levels. What is the importance of each of the four levels for understanding voter turnout in the 2005 local government elections in Pakistan? The answer to that question can be based on an analysis of variances that decomposes the variance in voter turnout:
yijkp = γ0000 + μ000p + ν00kp + λ0jkp + ξijkp, (4)
where yijkp is the observed dichotomous response (whether an individual votes or not) for individual i from PSU j, which is in district k and province p; and γ0000 is the grand mean of voter turnout (i.e., the mean across individuals, PSUs, districts, and provinces). The sources of cross-provincial variation, which cause voter turnout in particular provinces to deviate from the grand mean, are contained in μ000p. Similarly, ν00kp and λ0jkp contain sources of cross-district and cross-PSU variations, respectively. Finally,

13
ξijkp captures interindividual differences. Table 5 displays the multilevel generalized maximum likelihood estimates of the grand mean and the variance components. All the variance components are statistically significant at least at the 5 percent significance level, indicating that there was significant variance in voter turnout at all potential levels of analysis.8
Table 5. Analysis of variance
Parameter Estimate Fixed effects
Constant Variance components
Province level District level PSU level Log likelihood
0.316* (0.074)
0.294** (0.150) 0.172* (0.060) 0.241* (0.062)
–2,300.4
Note: Table entries are generalized maximum likelihood (GLLAMM) estimates, with estimated standard errors in parentheses. * p < 0.01; ** p < 0.05.
Further analysis of variances suggests that about 82 percent of the total variance is explained at the individual voter level. Because data are measured at the individual level, this is a plausible result. Nevertheless, about 18 percent of the total variance in voter turnout is caused by higher levels of analysis. This suggests significant variation in voter turnout exists at higher levels of analysis. Further, we were able to consider different types of the within-cluster correlations of the responses of two individual voters, usually referred to as the intraclass correlations.9 For example, for the same province but different districts, the estimated intraclass correlation is 0.07, whereas for the same district (and then obviously the same province) but different PSUs, it is 0.12. Further, for the same primary sampling unit (and the same district and the same province), we could observe that the intraclass correlation is 0.18. These are sizable positive correlations that suggest a fair amount of clustering at the PSU, district, and province levels. Ignoring the hierarchical structure of the data causing sizable intraclass correlations would result in erroneous statistical inference and flawed substantive conclusions. Contemporary methods of multilevel modeling provide solutions to the presence of a hierarchical data structure. Multilevel modeling makes it possible to account for variance in a dependent variable (voter turnout) measured at the individual level of analysis by considering information from all levels of analysis. Thus, multilevel modeling combines multiple levels of analysis in a single comprehensive model by specifying sources of variance at different levels (Rabe-Hesketh and Skrondal 2005; Steenbergen and Jones 2002).
We constructed a three-level random-intercept logit model for voter turnout involving individual, PSU, and district levels of analysis. These three levels of analysis account for nearly 93 percent of the variation in voter turnout. The specification of a three-level random-intercept logit model for voter turnout, with individual voters i nested in PSUs j nested in districts k, can be written as
logit{Pr(ŷijk = 1/(X1ijk, X2ijk, …, Xnijk, ξ0jk, ξ00k)}
= β0 + β1X1ijk + β2 X2ijk +…+ βnXnijk + βn + 1Z100k + βn + 2Z200k + … + βn + mZm00k +
8 The overall significance of the analysis of variance is tested by using the likelihood ratio test (chi2 = 176.26, p value =
0.0000), which compares the fit of the model with the linear regression model. 9 For a more detailed discussion of the intraclass correlations, see Rabe-Hesketh and Skrondal (2005).

14
ξ00k + ξ0jk + ξijk, (5)
where X1ijk, X2ijk, …, Xnijk are explanatory variables at the individual level, including the components of the calculus of voting as perceived by voters and individual voter characteristics; Z100k, Z200k, …, Zm00k are explanatory variables at the district level; ξ00k is a random-intercept varying over districts; ξ0jk is a random-intercept varying over PSUs; and ξijk is a random-error term varying over individual voters. Model (5) has the following notable features. First, it implies variance components at three levels: the individual voter, the PSU, and the district. An important limitation of model (5) is that it does not capture the variances in voter turnout at the province level. However, we included province-fixed effects on the right side of model (5) to absorb the sources of variances at the province level resulting from the contextual differences between provinces. Second, the model assumes that the individual-level explanatory variables have fixed effects. However, for some of those variables—for example, credibility of elections—that assumption could be too strong. Theoretically, the effect of election credibility on voter turnout varies over districts as a consequence of the various overall education levels (educational attainments) of the populace across districts. The districts with better-educated populaces might have higher requirements regarding the credibility of elections. Thus, the impact of the credibility of elections is moderated by the overall level of educational attainment in a given district. This can be modeled by changing the assumption in model (5) that the effect of the credibility of elections on voter turnout is fixed. Instead, the credibility effect can be modeled by introducing a cross-level interaction between the overall level of human development or educational attainment and the credibility of elections.

15
6. MAIN EMPIRICAL RESULTS
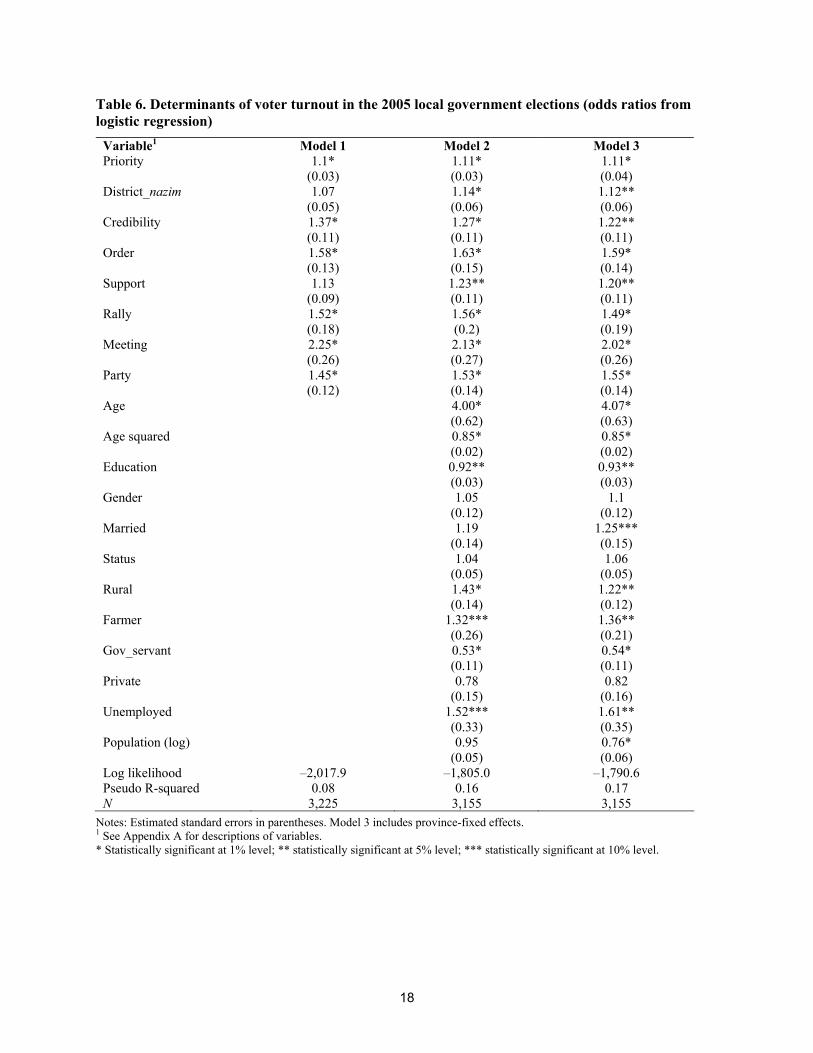
This section presents the main findings of the empirical analysis. The results are presented in Tables 6, 7, and 8. Table 6 reports results from three specifications of the standard logistic regression model. The goodness of fit of the models was tested by using the Hosmer-Lemeshow statistic and partitioning the observations into 10 equal-sized groups according to their predicted probabilities. All three models show no evidence of lack of fit based on that test. Specification 1 includes only the components of the calculus-of-voting model, while specifications 2 and 3 control for voters' individual socioeconomic characteristics and province-fixed effects. In comparing the results of regression models 1, 2, and 3, we found very similar results. However, controlling for voters' socioeconomic characteristics and province-fixed effects added more explanatory power to the model.
The results suggest that voter mobilization was by far the most important factor in voter turnout at the 2005 local government elections in Pakistan. The estimated odds ratio for voters who participated in local meetings organized by either political parties or candidates, after controlling for voter characteristics and province-fixed effects (model 3 in Table 6), is 2.02. That means those people were about two times more likely to vote than were people who had not participated in such local meetings. The results also suggest that other individual and social gratifications were important determinants of voting in the 2005 local government elections. The estimated odds ratios for voters who felt close to political parties and attended campaign rallies are 1.55 and 1.49, respectively.
Voters’ perceptions of the security situation during the election also had a significant impact on voter turnout, with an odds ratio of 1.59. The indirect measure of the cost of obtaining information also is positively associated with voting, with an odds ratio of 1.20. Further, the benefits of voting and the credibility of elections had a significant impact on voter turnout. In Table 6, model 3 shows clearly that all these variables had statistically and practically significant effects, weighing in the expected direction. Thus, evidence suggests that when people expect that elected officials will pay attention to their needs (odds ratio 1.11), when they care about who will be elected in the indirect elections of district nazim (odds ratio 1.12), and when their perception regarding the credibility of the election is strong (1.22), they are more likely to vote. However, our findings also suggest that the importance of those considerations in people’s decision to vote is significantly less than the importance of people’s personal interests and security situations during elections. Overall, the results show that people’s perceptions of instrumental and psychological benefits, the credibility of elections, and the costs associated with voting all influence the decision to vote.
The results further suggest that socioeconomic and demographic variables also have an important influence. Older people are far more likely to vote than youth (the odds ratio for age is around 4), but at a diminishing rate (the odds ratio for age squared is 0.85). A possible interpretation of this result, given the way the age variable has been coded, is that the likelihood of voting increases with age up to age 50 and starts to decline after age 50. These results are similar to the evidence found in other developed and developing countries. Interestingly, occupation has an important effect on voter turnout, with higher voting rates among farmers (odds ratio, 1.36) and unemployed (odds ratio, 1.61). Surprisingly, government employees are far less likely to vote, with an odds ratio of 0.54. This puzzling finding can be explained by the observed opposition to and skeptic views about the devolution plan among members of the government bureaucracy (Birner et al., forthcoming).10 The findings also suggest that rural citizens are more likely to vote (odds ratio, 1.22). This is a common phenomenon in many developing countries, and one explanation is that rural people can be easily persuaded and mobilized (Mo et al. 1991). The odds ratio for voters’ self-assessed financial status is slightly greater than 1, which might be because wealthier people are more likely to vote, but it is statistically insignificant.
The level of education is also expected to have an influence on voter turnout. Available evidence suggests that the more educated people are, the more likely they are to vote. It is assumed that education
10Evidence from other countries suggests that government employees are more likely to vote.

16
may influence voter turnout by improving the civic skills necessary to register and vote (Rosenstone and Hansen 1993). The evidence from some Indian states (e.g., West Bengal by Bardhan et al. 2007; Rajasthan and Madhya Pradesh by Krishna 2006) where education appears as one of the main positive determinants of political participation supports this proposition. However, the estimated odds ratio for education level (0.93) in our analysis suggests that, in Pakistan, the more educated people are, the less likely they are to vote when controlled for other factors. One possible explanation for this finding is that, in a clientelistic environment, the votes of less educated people tend to be cheaper to purchase by candidates, and less educated people are more vulnerable to intimidation by authorities (Blaydes 2006).
Further, some studies have shown that men are more likely to be politically active than women (Verba et al. 1978). Our results, at first look, do not necessarily suggest significant differences between men and women in voter turnout. Although our estimated regression coefficients indicate that men are slightly more likely to vote than are women, the coefficients are not statistically significant in any of the estimated regression models. However, as Verba et al. suggest, gender differences in individual and institutional characteristics might explain the differences in political participation between men and women. Because we controlled for many of those characteristics, the results are not surprising. The following results from our survey suggest that women in Pakistan are not convinced when it comes to devolution reforms and are disadvantaged when it comes to political participation:
1. Only 45 percent of female respondents perceived the 2005 local government elections as credible compared with 57 percent of the male respondents.
2. The majority of women (60 percent versus 45 percent of men) expressed their belief that new local governments will not pay enough attention to the problems of ordinary people.
3. Institutional and community resources seem to benefit women less than men. This was evident in relation to women’s affiliations with political parties and their participation in political rallies and speeches given by candidates. For example, women were about nine times less likely go to a speech or rally given by a candidate for union council.
Table 7 presents the results of a three-level random-intercept logistic model. As mentioned earlier, this model differentiates three levels in the data: individual, PSU, and district. It also controls for province-fixed effects as a way to absorb the unique variation among provinces. The first two columns (models 1 and 2) in Table 7 present the results from two specifications of the three-level logistic random-intercept estimation. These models include the same variables as in model 3 in Table 6. The results from these models are mostly consistent with the baseline results discussed earlier. Comparing the results from the baseline and multilevel model estimations reveals some noteworthy differences. The notable feature of the results of the three-level random-intercept model is that some estimates of parameters and their standard errors have changed. As a result, two variables, rural residence and education level, are no longer statistically significant at acceptable levels. Conversely, marital status is statistically significant at the 5 percent level, suggesting that married people are more likely to vote than those who are not married (odds ratio, 1.29). Further, the practical significance of several variables, such as credibility of elections, personal gratifications, and being a farmer, moderately changed. As the variance component at the district level shows, some clustering remains after controlling for the district-level covariates of population size and educational attainment; therefore, the observations are probably not conditionally independent.11
Regarding the effect of voters’ perceptions of the credibility of elections and candidates’ policy priorities, it has thus far been assumed that these variables have fixed effects. The alternative hypothesis, however, is that these effects are heterogeneous across districts. The last two columns (models 3 and 4) in Table 7 report the estimates of the three-level model by interacting educational attainment (a district-level variable) with voters’ perceptions regarding credibility of elections and candidates’ policy priorities (individual-level variables). The models assume that those effects are not fixed. The findings suggest that
11However, we cannot make any definitive conclusions in this regard because neither district-level explanatory variables nor
the variance component at the district level are statistically significant.
17
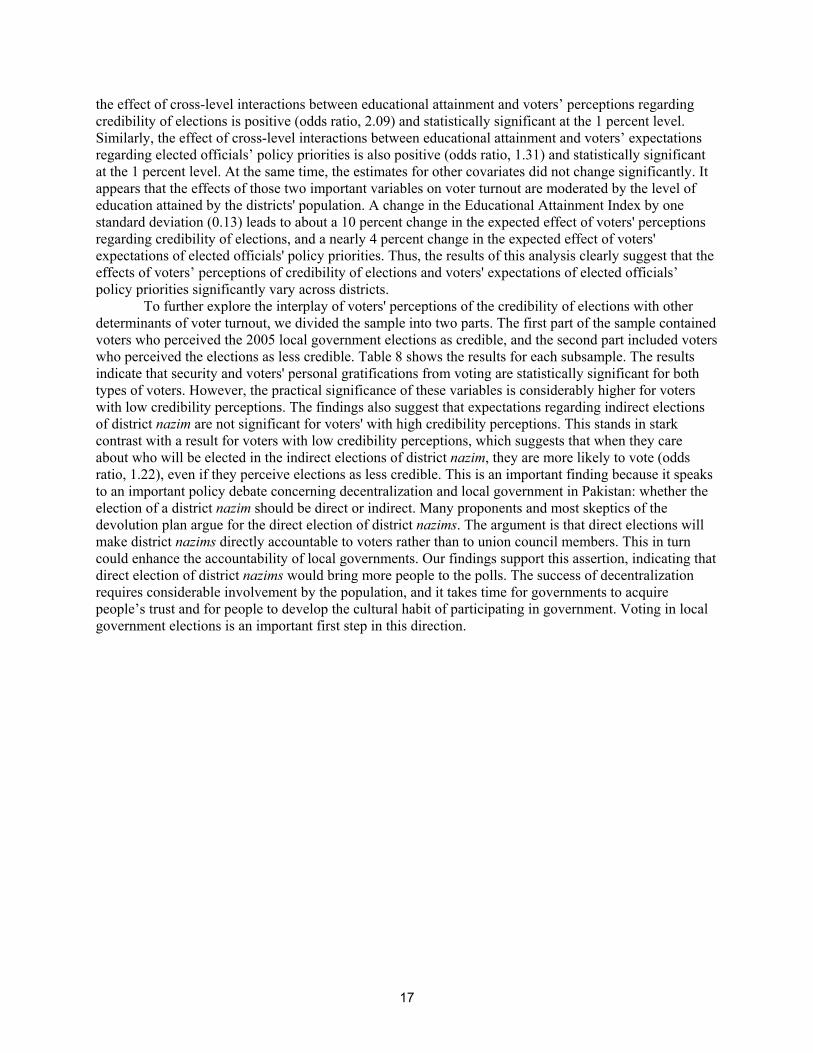
the effect of cross-level interactions between educational attainment and voters’ perceptions regarding credibility of elections is positive (odds ratio, 2.09) and statistically significant at the 1 percent level. Similarly, the effect of cross-level interactions between educational attainment and voters’ expectations regarding elected officials’ policy priorities is also positive (odds ratio, 1.31) and statistically significant at the 1 percent level. At the same time, the estimates for other covariates did not change significantly. It appears that the effects of those two important variables on voter turnout are moderated by the level of education attained by the districts' population. A change in the Educational Attainment Index by one standard deviation (0.13) leads to about a 10 percent change in the expected effect of voters' perceptions regarding credibility of elections, and a nearly 4 percent change in the expected effect of voters' expectations of elected officials' policy priorities. Thus, the results of this analysis clearly suggest that the effects of voters’ perceptions of credibility of elections and voters' expectations of elected officials’ policy priorities significantly vary across districts.
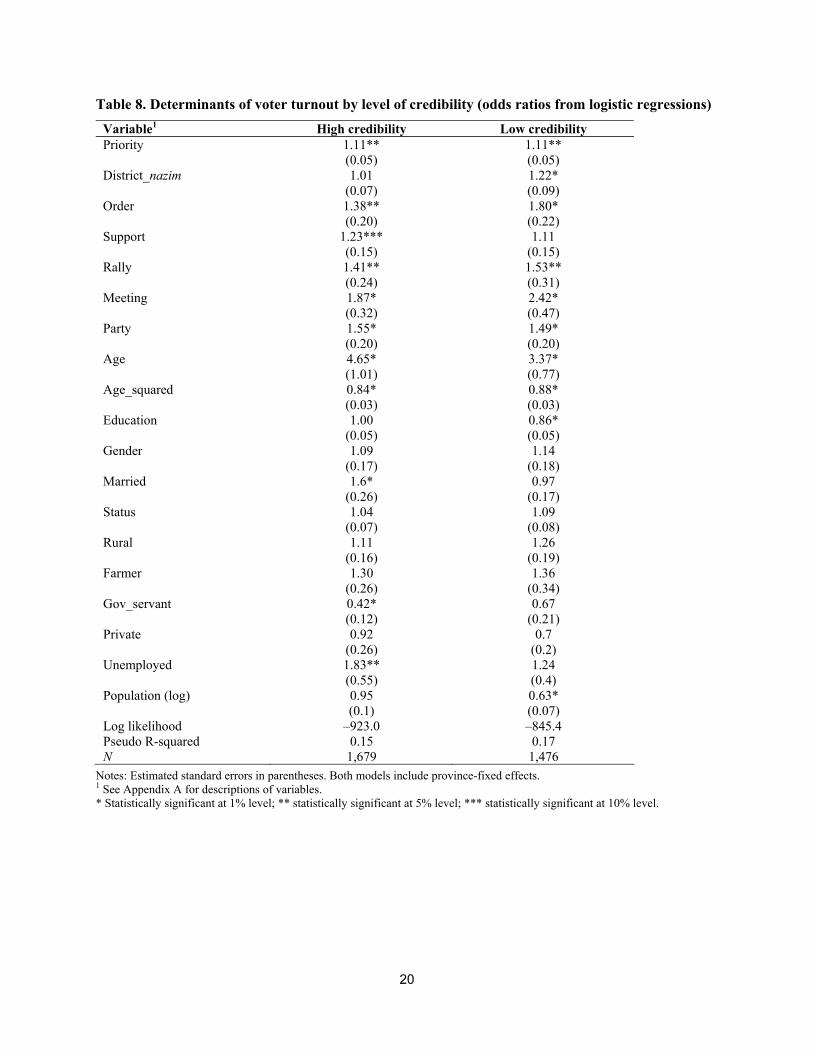
To further explore the interplay of voters' perceptions of the credibility of elections with other determinants of voter turnout, we divided the sample into two parts. The first part of the sample contained voters who perceived the 2005 local government elections as credible, and the second part included voters who perceived the elections as less credible. Table 8 shows the results for each subsample. The results indicate that security and voters' personal gratifications from voting are statistically significant for both types of voters. However, the practical significance of these variables is considerably higher for voters with low credibility perceptions. The findings also suggest that expectations regarding indirect elections of district nazim are not significant for voters' with high credibility perceptions. This stands in stark contrast with a result for voters with low credibility perceptions, which suggests that when they care about who will be elected in the indirect elections of district nazim, they are more likely to vote (odds ratio, 1.22), even if they perceive elections as less credible. This is an important finding because it speaks to an important policy debate concerning decentralization and local government in Pakistan: whether the election of a district nazim should be direct or indirect. Many proponents and most skeptics of the devolution plan argue for the direct election of district nazims. The argument is that direct elections will make district nazims directly accountable to voters rather than to union council members. This in turn could enhance the accountability of local governments. Our findings support this assertion, indicating that direct election of district nazims would bring more people to the polls. The success of decentralization requires considerable involvement by the population, and it takes time for governments to acquire people’s trust and for people to develop the cultural habit of participating in government. Voting in local government elections is an important first step in this direction.
18
Table 6. Determinants of voter turnout in the 2005 local government elections (odds ratios from logistic regression)
Variable1 Model 1 Model 2 Model 3 Priority 1.1*
(0.03) 1.11* (0.03)
1.11* (0.04)
District_nazim 1.07 (0.05)
1.14* (0.06)
1.12** (0.06)
Credibility 1.37* (0.11)
1.27* (0.11)
1.22** (0.11)
Order 1.58* (0.13)
1.63* (0.15)
1.59* (0.14)
Support 1.13 (0.09)
1.23** (0.11)
1.20** (0.11)
Rally 1.52* (0.18)
1.56* (0.2)
1.49* (0.19)
Meeting 2.25* (0.26)
2.13* (0.27)
2.02* (0.26)
Party 1.45* (0.12)
1.53* (0.14)
1.55* (0.14)
Age 4.00* (0.62)
4.07* (0.63)
Age squared 0.85* (0.02)
0.85* (0.02)
Education 0.92** (0.03)
0.93** (0.03)
Gender 1.05 (0.12)
1.1 (0.12)
Married 1.19 (0.14)
1.25*** (0.15)
Status 1.04 (0.05)
1.06 (0.05)
Rural 1.43* (0.14)
1.22** (0.12)
Farmer 1.32*** (0.26)
1.36** (0.21)
Gov_servant 0.53* (0.11)
0.54* (0.11)
Private 0.78 (0.15)
0.82 (0.16)
Unemployed 1.52*** (0.33)
1.61** (0.35)
Population (log) 0.95 (0.05)
0.76* (0.06)
Log likelihood –2,017.9 –1,805.0 –1,790.6 Pseudo R-squared 0.08 0.16 0.17 N 3,225 3,155 3,155
Notes: Estimated standard errors in parentheses. Model 3 includes province-fixed effects. 1 See Appendix A for descriptions of variables. * Statistically significant at 1% level; ** statistically significant at 5% level; *** statistically significant at 10% level.

19
Table 7. Determinants of voter turnout in the 2005 local government elections (odds ratios from multilevel random-intercept logistic regressions)
Variable1 Model 1 Model 2 Model 3 Model 4
Priority 1.12* (0.04)
1.12* (0.04)
1.11* (0.04)
District_nazim 1.13** (0.06)
1.13** (0.06)
1.12** (0.06)
1.13** (0.06)
Credibility 1.25** (0.12)
1.25** (0.12)
1.25** (0.12)
Order 1.68* (0.17)
1.68* (0.17)
1.64* (0.16)
1.67* (0.17)
Support 1.17 (0.12)
1.17 (0.12)
1.17 (0.12)
1.17 (0.12)
Rally 1.55* (0.21)
1.55* (0.21)
1.54* (0.21)
1.55* (0.21)
Meeting 2.09* (0.28)
2.09* (0.28)
2.10* (0.29)
2.11* (0.27)
Party 1.57* (0.16)
1.57* (0.16)
1.57* (0.16)
1.57* (0.16)
Age 4.36* (0.72)
4.36* (0.72)
4.38* (0.72)
4.36* (0.72)
Age squared 0.85* (0.02)
0.85* (0.02)
0.85* (0.02)
0.85* (0.02)
Education 0.93*** (0.04)
0.93*** (0.04)
0.93*** (0.04)
0.92*** (0.04)
Gender 1.14 (0.13)
1.14 (0.13)
1.15 (0.14)
1.13 (0.13)
Married 1.29** (0.16)
1.29** (0.16)
1.29** (0.16)
1.29** (0.16)
Status 1.07 (0.06)
1.07 (0.06)
1.07 (0.06)
1.07 (0.06)
Rural 1.25*** (0.16)
1.24*** (0.16)
1.23*** (0.16)
1.25*** (0.16)
Farmer 1.44** (0.24)
1.43** (0.24)
1.42** (0.24)
1.45** (0.24)
Gov_servant 0.50* (0.11)
0.50* (0.11)
0.50* (0.11)
0.50* (0.11)
Private 0.79 (0.16)
0.79 (0.16)
0.79 (0.16)
0.78 (0.16)
Unemployed 1.64** (0.37)
1.63** (0.37)
1.63** (0.37)
1.65** (0.38)
Population (log) 0.75*** (0.12)
0.77*** (0.11)
0.77* (0.09)
0.72* (0.09)
eai 1.52 (1.13)
hdi
1.83 (2.86)
eai × credibility
2.09* (0.44)
eai × priority
1.31* (0.09)
Variance components PSU level District level
0.24* (0.08) 0.15
(0.09)
0.24* (0.08) 0.16
(0.09)
0.24* (0.08) 0.16
(0.09)
0.24* (0.08) 0.16
(0.09)Log likelihood –1,768.0 –1,768.0 –1,764.7 –1,766.1
Notes: Estimated standard errors in parentheses. All models include province-fixed effects. The number of individual-, PSU-, and district-level units are 3,155, 296, and 59, respectively. 1 See Appendix A for descriptions of variables. * Statistically significant at 1% level; ** statistically significant at 5% level; *** statistically significant at 10% level.
20
Table 8. Determinants of voter turnout by level of credibility (odds ratios from logistic regressions)
Variable1 High credibility Low credibility Priority 1.11**
(0.05) 1.11** (0.05)
District_nazim 1.01 (0.07)
1.22* (0.09)
Order 1.38** (0.20)
1.80* (0.22)
Support 1.23*** (0.15)
1.11 (0.15)
Rally 1.41** (0.24)
1.53** (0.31)
Meeting 1.87* (0.32)
2.42* (0.47)
Party 1.55* (0.20)
1.49* (0.20)
Age
4.65* (1.01)
3.37* (0.77)
Age_squared 0.84* (0.03)
0.88* (0.03)
Education 1.00 (0.05)
0.86* (0.05)
Gender 1.09 (0.17)
1.14 (0.18)
Married 1.6* (0.26)
0.97 (0.17)
Status 1.04 (0.07)
1.09 (0.08)
Rural 1.11 (0.16)
1.26 (0.19)
Farmer 1.30 (0.26)
1.36 (0.34)
Gov_servant 0.42* (0.12)
0.67 (0.21)
Private 0.92 (0.26)
0.7 (0.2)
Unemployed 1.83** (0.55)
1.24 (0.4)
Population (log) 0.95 (0.1)
0.63* (0.07)
Log likelihood –923.0 –845.4 Pseudo R-squared 0.15 0.17 N 1,679 1,476
Notes: Estimated standard errors in parentheses. Both models include province-fixed effects. 1 See Appendix A for descriptions of variables. * Statistically significant at 1% level; ** statistically significant at 5% level; *** statistically significant at 10% level.

21
7. DISCUSSION AND IMPLICATIONS
One of the fundamental concerns of scholars and development practitioners regarding decentralization has been whether local governments are likely to be more accountable and responsive to the needs of poor people. Obviously, competitive and credible local elections are a necessary component in the sequence of changes that lead to local government accountability. This paper offers an analysis of an essential determinant of political accountability: voter turnout at local government elections. Decentralization cannot be successful in establishing responsive and accountable local governments if voters believe local elections are not fair and if candidates are not able to offer credible policy promises.
In Pakistan, probably based on their experience of life under conditions of limited political competition and policy breakdowns in public goods and services provision (Keefer 2004, 2005), a considerable percentage of people (especially women) doubt the fairness of devolution and local government elections; consequently, many chose to refrain from participating in elections. Evidence to support this proposition comes from the 2005 local government elections, where turnout levels were lower than the initial (2001) local government elections under devolution. Further, people’s unwillingness to participate in the 2005 local government elections is particularly relevant to women and better-educated people. Our analysis indicates that women and better-educated people are less likely to vote when they view the local election as not credible.
The findings of this study also relate to the argument that decentralization leads to efficient provision of public services, because services provided by local governments will better match the preferences of the residents of those jurisdictions. Our results suggest that preference matching is not strong in these early stages of decentralization in Pakistan. Important gaps exist between the policy priorities of the candidates for local government positions and the development preferences of ordinary people. The political agency problem of elected representatives having different policy priorities than the electorate may, at least partially, explain why the effect of the preference matching between candidates and voters on voter turnout is marginal.
Our findings also speak to a fundamental concern of the development debate that focuses on the clientelistic relationship between political candidates and voters. In fact, the observed evidence concerning the credibility of elections can be considered a plausible sign of that political clientelism (patronage, vote buying, intimidation, etc.) exists in local electoral politics in Pakistan. Moreover, this study revealed some direct indications of political clientelism. First, the voting pattern observed in the local government elections in Pakistan—that people with less education, people who live in rural areas, and farmers are far more likely to vote—is exactly what scholars associate with political clientelism. Poor and less educated people are risk averse and hence may value immediate private gains more than the promise of a wider redistributive public policy in the future (Stokes 2007). As Powell (1970) suggests, within many rural communities, the patron status is significantly associated with land ownership and the client status with poor farmers dependent on the patron’s land for their living. This is consistent with the reality of the 2005 local elections in Pakistan, where more than 80 percent of the candidates for tehsil or district nazim were landowners, and about half of them had large landholdings.
Second, clientelism is compatible with the rational-choice perspective because there is an implicit quid pro quo, and voting based on personal gratifications can be seen as a surrogate for clientelism (Putnam et al. 1994). As Stokes (2007) explains, clientelistic candidates rely on an army of intermediaries and campaign workers to monitor actions of voters at a fine-grain level, including clients’ participation in pre-election events. Thus, participation in speeches or rallies organized by a candidate can be seen as a surrogate for clientelism. In this sense, our findings regarding the impact of personal gratifications can be considered another indication of clientelistic politics.
Even though the observed facts regarding voter turnout can be interpreted as an indication of clientelistic local politics, other interpretations are also possible. The clientelism interpretation appears to suggest that uneducated, poor, and rural people are less able to judge the credibility of a politician and are less interested in public goods than are better-educated groups. This may well be a prejudice, and more

22
research is necessary to substantiate the proposition, because alternative explanations are also possible. If decentralization does in fact create incentives for politicians to better serve the uneducated rural poor because they represent the majority of the votes, we would also expect a higher voter turnout among that group. The information collected through the survey does not support the hypothesis that poor, uneducated and rural people are less able to judge the credibility of elections. The percentage of people who considered the elections credible did not differ significantly by income group or education level, even though it differed between rural and urban areas. Although further research on the question of clientelism is justified, we need to acknowledge that the relatively high voter turnout among uneducated, poor, and rural people in the 2005 local government elections entails a considerable potential for making decentralized public service provision more responsive to the needs of these groups.
The findings presented in this paper have important policy implications for fine-tuning decentralization reform and improving local government accountability in Pakistan. Perhaps voters’ perceptions regarding the credibility of elections, together with clientelistic local politics and the weak preference-matching ability of candidates, is making nearly half of the electorate politically inert and causing relatively low electoral participation. This suggests that policy breakdowns and the inability of politicians to make credible pre-electoral policy promises, which were prevalent during the period before devolution (Keefer 2004, 2005; Keefer and Khemani 2003), are also apparent at the local level. At the same time, one important finding of the study suggests that direct elections of district nazims, a key position in local government structure, have the potential to increase electoral participation and thus to create a precondition for better local government accountability. Greater electoral participation is more likely to bring broad groups of people into local politics, which eventually could lead to greater accountability of government, not only at the local level but also at the provincial and national levels.

23
APPENDIX A: DATA AND VARIABLE DESCRIPTIONS
The data set comprises voters (i) nested in unions (j) nested in districts (k). It contains the following subset of variables: Level-1 (voter) variables
Detailed descriptions of the variables for this level are given later in this appendix. Level-2 (union) variable
union_no: identifier for unions (j) Level-3 (district) variables
district: identifier for districts (k)
population: size of district populations
income: real GDP per capita (PPP$) for districts
hdi: Human Development Index for districts
eai: Educational Attainment Index for districts
Level-1 (voter) variables: Survey question wording and coding of variables
The survey analyzed in this paper was conducted by Pattan Development Organization after the 2005 local government elections in Pakistan. The data are available from Pattan Development Organization. The total sample size is 3,527. The variables used in this research are listed below, together with the wording of the questionnaire items used to measure them.
Dependent variable
Vote: Did you vote in the local government union council elections? 1 = Yes, 0 = No.
Independent (exploratory) variables
Benefits of voting
Priority: When the new union council sets development priorities for your area, how much attention do you think they will pay to the problems of ordinary people? 5 = A lot, 4 = Some, 3 = Very little, 2 = Don’t know, 1 = Not at all. District_nazim: If you were given a chance to vote in the district nazim election, would you have voted for the present successful district nazim candidate or some other candidate? 3 = I would have voted for present successful district nazim, or I would have voted for an opponent candidate of present successful district nazim; 2 = I would not have voted, 1 = Don’t know.
Credibility of the local government elections (we assume that this may influence the probability of
affecting the outcome of the election)
Credibility: In your opinion, did the results of the recent local government elections accurately reflect the
way people voted, or do you think there was rigging? 1 = Reflect the way people voted; 0 = There was
rigging, or Don’t know.

24
Cost of voting
Order: In your opinion, were current union council elections (2005), compared with the previous union
council elections (2001), more peaceful, less peaceful, or the same with respect to the law and order
situation? 1 = More peaceful, or About the same; 0 = Less peaceful.
Support: With respect to union-level elections, the political parties extended what kind of help for its
candidates? 1 = Political workers were instructed to support the candidates, Provided funds, Leaders
participated in election campaign, or Other; 2 = Don’t know.
Level of interest in politics
Rally: Did you go to a speech or rally given by one of the candidates for union council? 1 = Yes, 0 = No.
Party: Overall, which political party do you feel closest to, or do you not feel close any political party? 0
= I do not feel close to any political party, or Don’t know; 1 = I feel close to the … party.
Voter mobilization
Meeting: Please tell me if you have participated in a local meeting of your party or candidate. 1 = Yes, 0
= No.
Control (for heterogeneity) variables
Education: 1 = Illiterate, 2 = Primary, 3 = Middle, 4 = Matric/F.A/F.Sc., 5 = B.A/B.Sc. or higher.
Gender: 1 = Male, 0 = Female
Married: 1 = Married, 0 = Never married/widow/divorced/separated.
Head: Are you the head of household? 1 = Yes, 0 = No.
Age: 1 = Age category 18–20, 2 = Age category 21–30, 3 = Age category 31–40, 4 = Age category 41–
50, 5 = age category 51–60, 6 = age category more than 60.
Status: There are several ways to describe a household’s financial situation. Please tell me which of these
statements best describes the situation in your household. 1 = We sometimes do not have enough income
to eat three meals a day, 2 = We have enough income only to provide adequate food and shelter for the
family, 3 = We have enough income to provide food and shelter and to buy new clothing from time to
time, 4 = We have money left over from time to time after meeting our basic needs, 5 = We always have
money left after meeting our basic needs.
Self_employed: 1 = Self-employed shopkeeper, business, or trade; 0 = Not self-employed.
Gov_servant: 1 = Government servant, 0 = Not government servant.
Farmer: 1 = Small or medium-sized farmer, 0 = Not small or medium-sized farmer.
Student: 1 = Student, 0 = Not student.
Private: 1 = Private sector employee, 0 = Not private sector employee.

25
Unemployed: 1 = Unemployed, 0 = Employed.
Rural: 1 = Rural, 0 = Urban.
Province: Four binary variables to control for four provinces: Punjab, Sindh, North West Frontier
Province (NWFP), and Baluchistan.
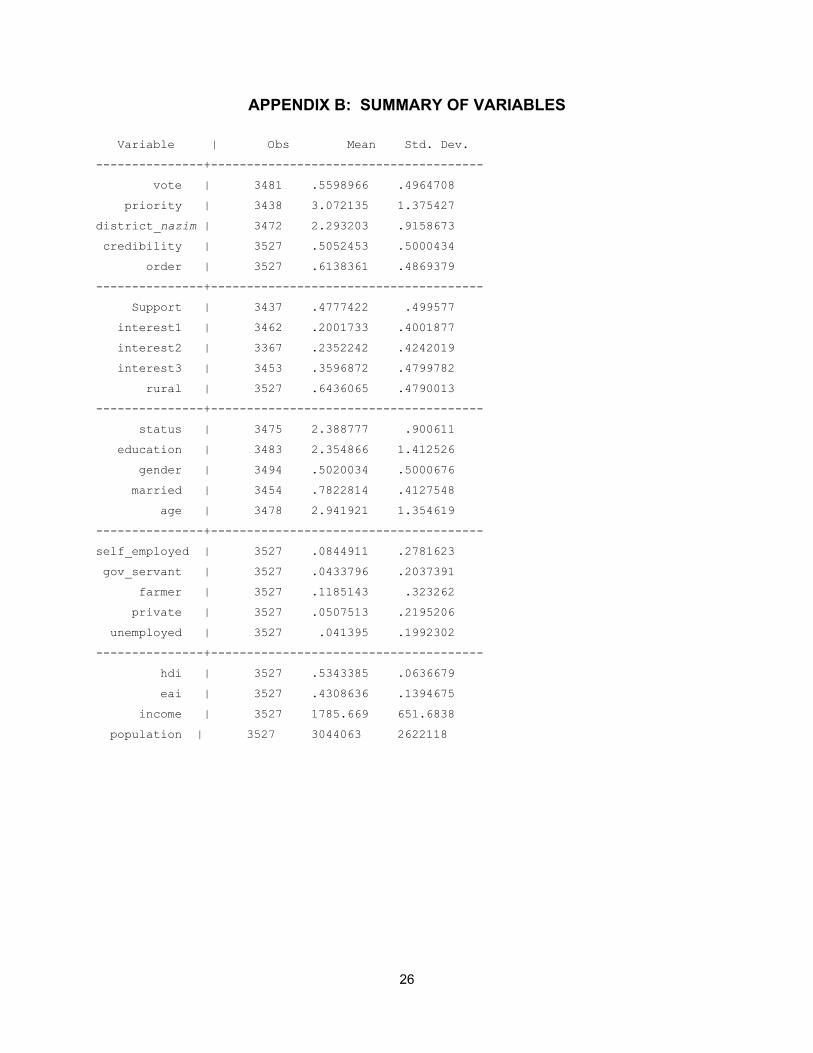
26
APPENDIX B: SUMMARY OF VARIABLES
Variable | Obs Mean Std. Dev.
---------------+--------------------------------------
vote | 3481 .5598966 .4964708
priority | 3438 3.072135 1.375427
district_nazim | 3472 2.293203 .9158673
credibility | 3527 .5052453 .5000434
order | 3527 .6138361 .4869379
---------------+--------------------------------------
Support | 3437 .4777422 .499577
interest1 | 3462 .2001733 .4001877
interest2 | 3367 .2352242 .4242019
interest3 | 3453 .3596872 .4799782
rural | 3527 .6436065 .4790013
---------------+--------------------------------------
status | 3475 2.388777 .900611
education | 3483 2.354866 1.412526
gender | 3494 .5020034 .5000676
married | 3454 .7822814 .4127548
age | 3478 2.941921 1.354619
---------------+--------------------------------------
self_employed | 3527 .0844911 .2781623
gov_servant | 3527 .0433796 .2037391
farmer | 3527 .1185143 .323262
private | 3527 .0507513 .2195206
unemployed | 3527 .041395 .1992302
---------------+--------------------------------------
hdi | 3527 .5343385 .0636679
eai | 3527 .4308636 .1394675
income | 3527 1785.669 651.6838
population | 3527 3044063 2622118
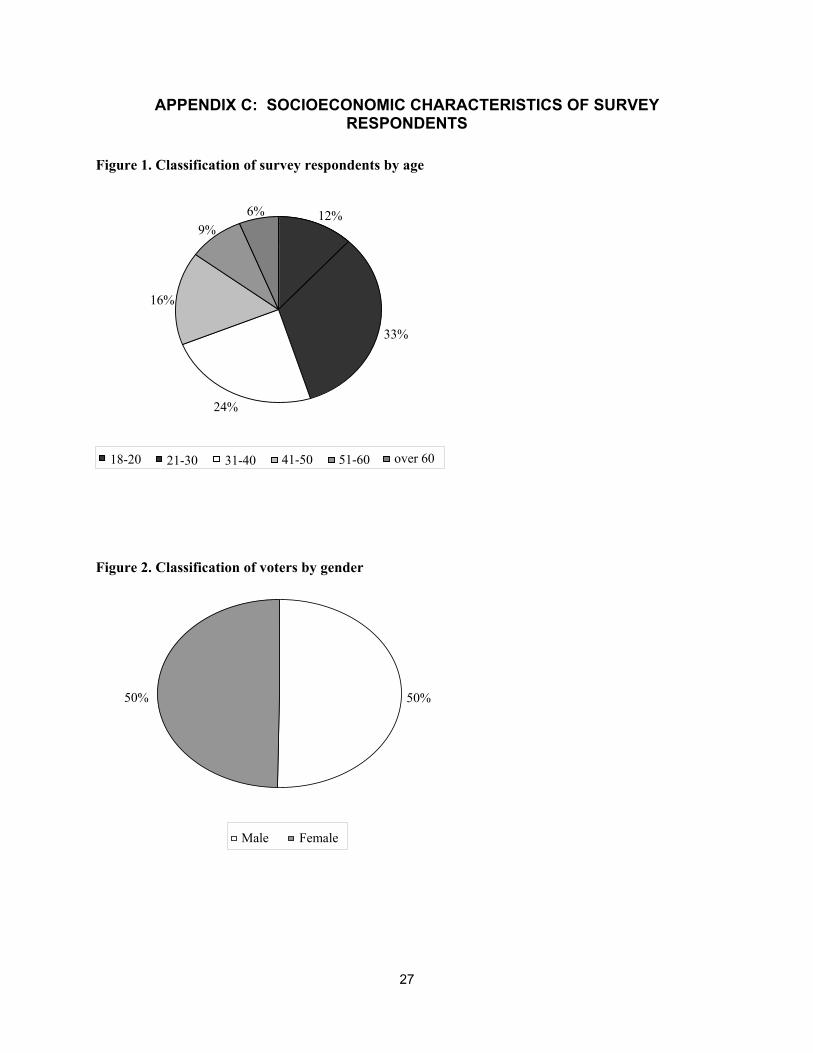
27
APPENDIX C: SOCIOECONOMIC CHARACTERISTICS OF SURVEY RESPONDENTS
Figure 1. Classification of survey respondents by age
Figure 2. Classification of voters by gender
12%
33%
24%
16%
9% 6%
18-20 21-30 31-40 41-50 51-60 over 60
50%50%
Male Female

28
Figure 3. Share of rural and urban respondents
Figure 4. Classification of respondents by educational background
64%
36%
Rural Urban
44%
14%
12%
23%
7%
Primary SecondaryIlliterate B.A. and upSome college

29
Figure 5. Classification of respondents by occupational background
Figure 6. Classification of respondents by household financial situation
5%15%
9%
22%
2% 11% 1% 3%
7%
2%
23%
Self-employed Private sector Farmer Landlord Government servantProfessional Retired Unemployed Housewife Manual laborer Other
12%
51%
26%
8% 3%
Always have income left over after meeting basic needs
Enough income only for food and shelter Enough income for food, shelter and clothing
Not enough income for three meals a day Sometimes have income left over after meeting basic needs

30
REFERENCES
Ajmal, Muhammad, and Sarwar Bari. 2006. Understanding the role of political dynasties: Local government elections 2005. Working paper, Pattan Development Organization, Islamabad, Pakistan.
Aldrich, John H. 1993. Rational choice and turnout. American Journal of Political Science 37: 246–278.
Azfar, Omar, Satu Kahkonen, and Patrick Meagher. 1999. Decentralization, governance, and public services: The impact of institutional arrangements. IRIS Working Paper No. 255, University of Maryland.
———. 2001. Conditions for effective decentralized governance: A synthesis of research findings. IRIS Working Paper No. 256, University of Maryland.
Asian Development Bank (ADB), Department for Internal Development (DFID), and World Bank. 2005a. Devolution in Pakistan: An assessment and recommendations for action. Research report. http://www.dfid.gov.uk/pubs/files/devolution-vol1.pdf.
Bardhan, Pranab, and Dilip Mookherjee, eds. 2006. Decentralization and local governance in developing countries: A comparative perspective. Boston: MIT Press.
Bardhan, Pranab, Sandip Mitra, Dilip Mookherjee, and Abhirup Sarkar. 2007. Local democracy in West Bengal: Political participation and targeting of public services. Unpublished manuscript, Economics Department, University of California, Berkeley.
Besley, Timothy, and Stephan Coate. 2003. Centralized versus decentralized provision of local public goods: A political economy approach. Journal of Public Economics 87(12): 2611–2637.
Birner, Regina, Sarfraz Qureshi, Kamiljon Akramov and Bilal Hasan. Forthcoming. Voice and votes: Does political decentralization work for the poor and for women? Pakistan Development Review.
Blais, Andre. 2000. To vote or not to vote: The merits and limits of rational choice theory. Pittsburgh: University of Pittsburgh Press.
Blais, Andre, Robert Young, and Miriam Lapp. 2000. The calculus of voting: An empirical test. European Journal of Political Research 37: 181–201.
Blaydes, Lisa. 2006. Who votes in authoritarian elections and why? Determinants of voter turnout in contemporary Egypt. Paper prepared for delivery at annual meeting of American Political Science Association, August 31–September 3, 2006, Philadelphia, PA. http://www.stanford.edu/~blaydes/Turnout.pdf.
Cheema, Ali, Asim Ijaz Khwaja, and Adnan Qadir. 2003. Local government reforms in Pakistan: Context, content and causes. Research paper, John F. Kennedy School of Government, Harvard University, Cambridge, MA. http://ksghome.harvard.edu/~akhwaja/papers/Chapter8.pdf.
Crook, Richard C. and James Manor. 1998. Democracy and decentralization in South Asia and West Africa: Participation, accountability and performance. Cambridge: Cambridge University Press.
Crook, Richard C. and Alan Sturla Sverrisson. 2001. Decentralization and poverty alleviation in developing countries: A comparative analysis; or, Is West Bengal unique? IDS Working Paper No. 130, Institute of Development Studies, Brighton, UK. http://www.ids.ac.uk/ids/bookshop/wp/wp130.pdf.
Dowding, Keith. 2005. Is it rational to vote? Five types of answer and a suggestion. British Journal of Politics and International Relations 7: 442–459.
Downs, Anthony. 1957. An economic theory of democracy. New York: Addison-Wesley.
Feddersen, Timothy J. 2004. Rational choice theory and the paradox of voting. Journal of Economic Perspectives 18(1): 99–112.
Ghosh, Sanmitra. 2006. The phenomenon of voter turnout in the parliamentary elections of India. Contemporary Issues and Ideas in Social Sciences 2(2).
Green, Donald, and Ian Shapiro. 1996. Pathologies of rational choice theory: A critique of applications in political science. New Haven, CT: Yale University Press.

31
Guess, George M. 2005. Comparative decentralization lessons from Pakistan, Indonesia, and the Philippines. Public Administration Review 65(2): 217–230.
Hindricks, Jean, and Ben Lockwood. 2005. Decentralization and electoral accountability: Incentives, separation, and voter welfare. Warwick Economics Research Paper No. 729, Warwick University.
Jackman, Robert W. 1993. Response to Aldrich’s “Rational choice and turnout”: Rationality and political participation. American Journal of Political Science 37: 279–290.
Jennings, Kent M. 1997. Political participation in the Chinese countryside.” American Political Science Review 91(2): 361–372.
Keefer, Philip. 2004. What does political economy tell us about economic development—and vice versa? World Bank Policy Research Working Paper No. 3250, Washington, DC.
———. 2005. Democratization and clientelism: Why are young democracies badly governed? World Bank Policy Research Working Paper No. 3594, Washington, DC.
Keefer, Philip, and Stuti Khemani. 2003. Democracy, public expenditures, and the poor. World Bank Policy Research Paper No. 3164, Washington, DC.
Keefer, Philip, Ambar Narayan and Tara Vishwanath. 2003. Political economy of decentralization in Pakistan. Unpublished manuscript, World Bank.
Khemani, Stuti. 2000. Political cycles in a developing economy: Effect of elections in the Indian states. World Bank Policy Research Working Paper No. 2454, Washington, DC.
Krishna, Anirudh. 2006. Poverty and democratic participation reconsidered: Evidence from the local level in India. Comparative Politics 38(4): 439–458.
Lee, Junhan. 2004. Who votes and why in Korea? International Journal of Public Opinion Research 16(2): 183–198.
Litvack, J, J. Ahmad, and R. Bird. 1998. Rethinking decentralization in developing countries. Sector Studies Series. Washington, DC: World Bank.
Manning, Nick, Doug Porter, Jackie Charlton, Musharraf Cyan, and Zahid Hasnain. 2003. Devolution in Pakistan: Preparing for service delivery improvements. Working paper prepared for Forum on Intergovernmental Relations and Service Delivery in Pakistan, June 27–29 2003, Burbhan, Murree.
Merrifield, John. 2003. The institutional and political factors that influence voter turnout. Public Choice 77(3): 657–667.
Mo, Jongryn, David Brady, and Jaehun Ro. 1991. Urbanization and voter turnout in Korea: An update. Political Behavior 13(1): 24–32.
Persson, Torsten, and Guido Tabelini. 2000. Political economics: Explaining economic policy. Cambridge, MA: MIT Press.
Powell, John Duncan. 1970. Peasant society and clientelist politics. American Political Science Review 64(2) 411–425.
Przeworski, Adam. 2007. Constraints and choices: Electoral participation in historical perspective. Unpublished manuscript, Department of Politics, New York University.
Putnam, Robert D., Robert Leonardi, and Rafaella Nanetti. 1994. Making democracy work: Civic traditions in modern Italy. Princeton University Press.
Rabe-Hesketh, Sophia, and Anders Skrondal. 2005. Multilevel and longitudinal modeling using stata. College Station, TX: Stata Press.
Riker, William H., and Peter C. Ordeshook. 1968. A theory of the calculus of voting. American Political Science Review 62: 25–42.
Rosenstone, Steven J., and John Mark Hansen. 1993. Mobilization, participation, and democracy in America. New York: Macmillan.

32
Seabright, Paul. 1996. Accountability and decentralization in government: An incomplete contracts model. European Economic Review 40(1): 61–89.
Shah, Anwar, ed. 2006. Local governance in developing countries. Public Sector Governance and Accountability Series. Washington, DC: World Bank.
Steenbergen, Marco R., and Bradford S. Jones. 2002. Modeling multilevel data structures. American Journal of Political Science 46(1): 218–237.
Stigler, George. 1957. The tenable range of functions of local government. In Federal expenditure policy for economic growth and stability, ed. Joint Economic Committee, Subcommittee on Fiscal Policy, U.S. Congress, 213–219. Washington, DC: U.S. Government Printing Office.
Stokes, Susan C. 2007. Models of programmatic and clientelistic parties. In Oxford handbook of comparative politics, ed. Carles Boix and Susan Stokes. New York: Oxford University Press.
Uhlaner, Carol. 1989. Rational turnout: The neglected role of groups. American Journal of Political Science 33(2): 390–422.
United Nations Development Programme (UNDP). 2003. Pakistan national human development report. New York.
Verba, Sidney, Norman H. Nie, and Jae-On Kim. 1978. Participation and political equality: A seven-nation comparison. Cambridge, MA: Cambridge University Press.
Zaidi, S. Akbar. 2005. The political economy of decentralization in Pakistan. Transversal Theme on Decentralization and Social Movement, Working Paper No. 1, Sustainable Development Policy Institute, Islamabad, and Development Study Group, Zurich.

RECENT IFPRI DISCUSSION PAPERS
For earlier discussion papers, please go to www.ifpri.org/pubs/pubs.htm#dp. All discussion papers can be downloaded free of charge.
753. Regional biotechnology regulations: Design options and implications for good governance. Regina Birner and Nicholas Linacre, 2008.
752. The rise of supermarkets and their development implications: International experience relevant for India. Thomas Reardon and Ashok Gulati, 2008.
751. Investing in African agriculture to halve poverty by 2015. Shenggen Fan, Michael Johnson, Anuja Saurkar, and Tsitsi Makombe, 2008.
750. Accelerating growth and structural transformation: Ghana’s options for reaching middle-income country status. Clemens Breisinger, Xinshen Diao, James Thurlow, Bingxin Yu, and Shashidhara Kolavalli, 2008.
749. Seed value chains for millet and sorghum in Mali: A state-based system in transition. Lamissa Diakité, Amadou Sidibé, Melinda Smale, and Mikkel Grum, 2008.
748. The impact of CAFTA on employment, production and poverty in Honduras, Samuel Morley, Eduardo Nakasone, and Valeria Piñeiro, 2008.
747. Asian-driven resource booms in Africa: Rethinking the impacts on development. Clemens Breisinger and James Thurlow, 2008.
746. Trading millet and sorghum genetic resources: Women vendors in the village fairs of San and Douentza, Mali. Melinda Smale, Lamissa Diakité Brahima Dembélé, Issa Seni Traoré, Oumar Guindo, Bouréma Konta, 2008.
745. Determinants of smallholder commercialization of food crops: Theory and evidence from Ethiopia. John Pender and Dawit Alemu, 2007.
744. Benefit-cost analysis of Uganda’s clonal coffee replanting program: An ex-ante analysis. Samuel Benin and Liangzhi You, 2007.
743. The impact of CAFTA on poverty, distribution, and growth in El Salvador. Samuel Morley, Eduardo Nakasone and Valeria Piñeiro, 2007.
742. Impact of contract farming on income: Linking small farmers, packers, and supermarkets in China. Sachiko Miyata, Nicholas Minot, and Dinghuan Hu, 2007.
741. Spatial coordination in public good allocation: Nonparametric evidence from decentralized Indonesia. Futoshi Yamauchi, Shyamal Chowdhury, and Reno Dewina, 2007.
740. Genetically modified food and international trade: The case of India, Bangladesh, Indonesia, and the Philippines. Guillaume Gruère, Antoine Bouët, and Simon Mevel, 2007.
739. Income growth and gender bias in childhood mortality in developing countries. Mike Ueyama, 2007.
738. Seed provision and dryland crops in the semiarid regions of eastern Kenya. Latha Nagarajan, Patrick Audi, Richard Jones, and Melinda Smale, 2007.
737. Food safety requirements in African green bean exports and their impact on small farmers, Julius Juma Okello. Clare Narrod, and Devesh Roy, 2007.
736. Strengthening agricultural education and training in Sub-Saharan Africa from an innovation systems perspective: Case studies of Ethiopia and Mozambique. Kristin Davis, Javier Ekboir, Wendmsyamregne Mekasha, Cosmas M.O. Ochieng, David J. Spielman, and Elias Zerfu, 2007.
735. Gobernabilidad de los sistemas de innovación en Bolivia: Lecciones para las políticas de innovación agrícola. Frank Hartwich, Anastasia Alexaki, and René Baptista, 2007.
734. A typology for vulnerability and agriculture in Sub-Saharan Africa. Xiaobo Zhang, Marc Rockmore, and Jordan Chamberlin, 2007.
733. Impact of soil conservation on crop production in the Northern Ethiopian Highlands. Menale Kassie, John Pender, Mahmud Yesuf, Gunnar Kohlin, Randy Bluffstone, and Elias Mulugeta, 2007.
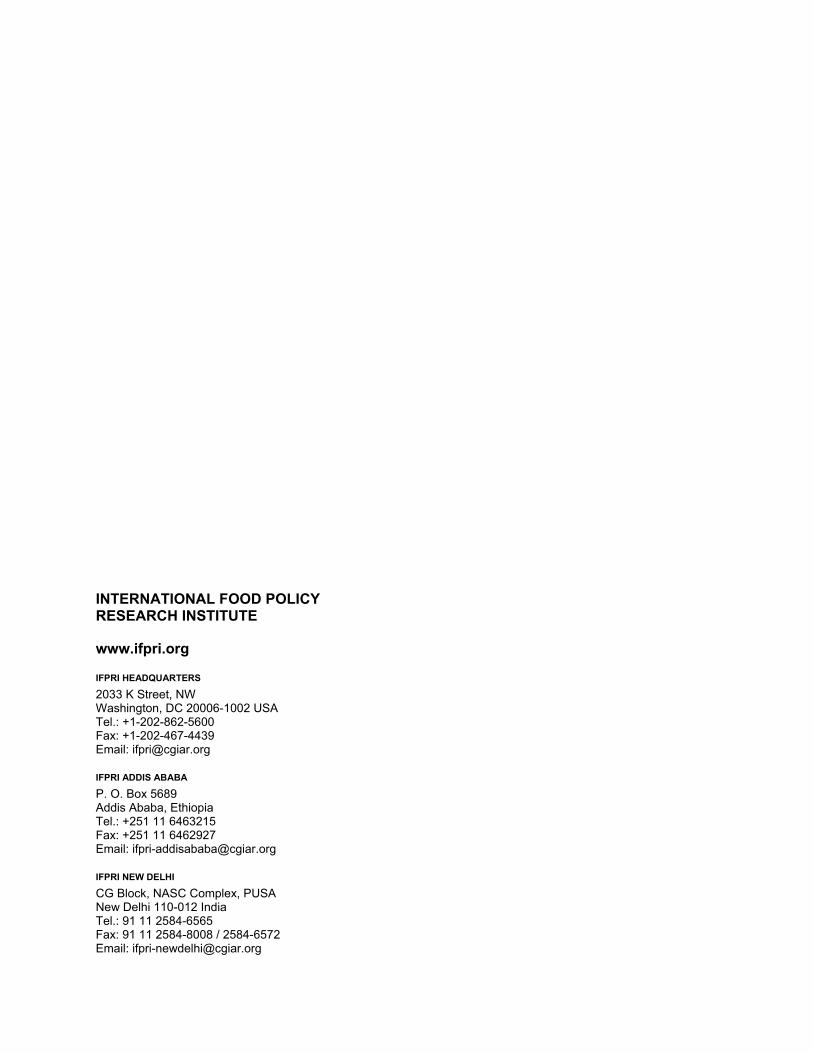
INTERNATIONAL FOOD POLICY RESEARCH INSTITUTE
www.ifpri.org
IFPRI HEADQUARTERS
2033 K Street, NW Washington, DC 20006-1002 USA Tel.: +1-202-862-5600 Fax: +1-202-467-4439 Email: [email protected]
IFPRI ADDIS ABABA
P. O. Box 5689 Addis Ababa, Ethiopia Tel.: +251 11 6463215 Fax: +251 11 6462927 Email: [email protected]
IFPRI NEW DELHI
CG Block, NASC Complex, PUSA New Delhi 110-012 India Tel.: 91 11 2584-6565 Fax: 91 11 2584-8008 / 2584-6572 Email: [email protected]