voter turnout - australian electoral commission · voter turnout at the 2016 federal election was...
TRANSCRIPT
Voter turnout
2016 House of Representatives and Senate
elections

Page 1 Voter turnout – 2016 House of Representatives and Senate elections
Contents Summary ............................................................................................................................................ 4
Key findings ........................................................................................................................................ 6
Lowest turnout under compulsory voting ......................................................................................... 6
Turnout and effective participation................................................................................................... 6
Growing divergence between House of Representatives and Senate turnout ................................. 7
Declining turnout and increasing formality for the House of Representatives .................................. 8
Declining turnout and formality for the Senate ................................................................................. 9
Turnout by state and territory ........................................................................................................ 10
High and low turnout divisions ....................................................................................................... 12
What’s influencing low turnout? ..................................................................................................... 13
Election timing ........................................................................................................................... 14
Age ............................................................................................................................................ 14
Gender ...................................................................................................................................... 15
Indigeneity ................................................................................................................................. 15
Socio-economic status ............................................................................................................... 16
Federal Direct Enrolment and Update ........................................................................................ 18
Service delivery ......................................................................................................................... 18
Competitiveness of an election .................................................................................................. 19
Change of government .............................................................................................................. 19
Opinions of the electoral system or politics in general ................................................................ 20
Appendices ....................................................................................................................................... 22
Appendix A. Key terms .................................................................................................................. 22
Appendix B. Tables ....................................................................................................................... 23
References ....................................................................................................................................... 27
End notes ......................................................................................................................................... 29
Page 2 Voter turnout – 2016 House of Representatives and Senate elections
Tables Table 1. Selected summary statistics for turnout and (in)formality, 1984–2016 House of
Representatives and Senate elections .............................................................................................. 23
Table 2. Difference between highest and lowest turnout rates by state and territory, 1984–2016
House of Representatives elections .................................................................................................. 24
Table 3. Difference between highest and lowest turnout rates by state and territory, 1984–2016
Senate elections ............................................................................................................................... 24
Table 4. Turnout history of divisions with the highest and lowest levels of turnout in 2016, 2001–2016
House of Representatives elections .................................................................................................. 25
Table 5. Turnout by seasons, 1901–2016 House of Representatives elections ................................ 26
Table 6. Turnout by Federal Direct Enrolment and Update (FDEU) status and enrolment type, 2016
federal election ................................................................................................................................. 26
Figures Figure 1. Voter turnout, 1925–2016 House of Representatives and Senate elections ......................... 6
Figure 2. Turnout and effective participation, 2001–2016 House of Representatives elections ........... 7
Figure 3. Voter turnout, 1984–2016 House of Representatives and Senate elections ......................... 8
Figure 4. Changes in turnout and formality rates, 1955–2016 House of Representatives elections .... 9
Figure 5. Changes in turnout and formality rates, 1955–2016 Senate elections ................................ 10
Figure 6. Voter turnout, 1984–2016 House of Representatives elections: New South Wales, Victoria,
South Australia, Tasmania, Australian Capital Territory and National ............................................... 11
Figure 7. Voter turnout, 1984–2016 House of Representatives elections: Queensland, Western
Australia, Northern Territory and National ......................................................................................... 11
Figure 8. Average voter turnout, 2001–2016 House of Representatives elections: Top and bottom 10
divisions in each year and National ................................................................................................... 13
Figure 9. Mark-off and VEP voting rates, 2016 federal election ......................................................... 14
Figure 10. Mark-off by gender, 1996–2016 federal elections ............................................................ 15
Figure 11. Non-turnout rate and Index of Relative Socio-economic Advantage and Disadvantage,
Macarthur polling place catchments, 2016 House of Representatives election ................................. 16
Figure 12. Non-turnout rate and Index of Relative Socio-economic Advantage and Disadvantage,
Chifley polling place catchments, 2016 House of Representatives election ...................................... 17
Figure 13. Non-turnout rate and Index of Relative Socio-economic Advantage and Disadvantage,
Watson polling place catchments, 2016 House of Representatives election ..................................... 17
Page 3 Voter turnout – 2016 House of Representatives and Senate elections
Figure 14. Turnout by seat status, 1996–2016 House of Representatives elections ......................... 19
Figure 15. Change of government turnout, 1925–2016 House of Representatives elections ............ 20
Figure 16. Proportion of people with “a good deal of interest in the election”, 1993-2016 federal
elections ........................................................................................................................................... 20
Figure 17. Satisfaction with democracy, 1969-2016 federal election ................................................. 21

Page 4 Voter turnout – 2016 House of Representatives and Senate elections
This research paper presents findings of various analyses of voter behaviour and the operation of
the 2016 federal election counts. Subsequent changes in the composition of the Senate have not
been incorporated but would not affect the findings.
The voter turnout rate measures the proportion of the enrolled population who successfully cast a
vote and is therefore a vital indicator of democratic health.
Voter turnout at the 2016 federal election was the lowest recorded since the introduction of
compulsory voting.
While voter turnout has remained over 90 per cent since the introduction of compulsory voting, it
has been on a slow downward trend in recent years, mirroring the experience of most developed
countries.
However, improvements in the enrolment rate and formality mean that ‘effective participation’
actually increased at the 2016 House of Representatives (HoR) elections. Effective participation
declined in the Senate elections, mainly because of falls in both turnout and formality.
Summary
■ Turnout at the 2016 House of Representatives (HoR) elections (91.0 per cent) was the lowest
recorded since the introduction of compulsory voting ahead of the 1925 federal election.
Turnout at the 2016 Senate elections (91.9 per cent) was the lowest recorded since the 1925
federal election.
■ While HoR turnout decreased in 2016, effective participation rates (formal votes as a
proportion of total potential electors) increased, reflecting higher formality.
■ There are more divisions consistently showing low levels of turnout than divisions consistently
showing high levels of turnout.
■ The decline in turnout in conjunction with an increase in formality at the 2016 HoR elections is
unusual, but not unique.
■ Turnout and formality both decreased at the 2016 Senate elections.
■ Lower levels of turnout are most likely to be influenced by age, Indigeneity, socio-economic
status, and Federal Direct Enrolment and Update (FDEU) processes, as well as electors’
confidence in the electoral system or politics in general.
Page 5 Voter turnout – 2016 House of Representatives and Senate elections
– There is a clear relationship between age and voter turnout at the national level. Mark-
off data from previous elections suggest that targeting turnout initiatives at people under
the age of 40 would be a valid strategy for increasing overall turnout.
– Areas where a higher proportion of the population are Indigenous tend to have lower
enrolment and formality rates, indicating that issues relating to Indigenous electoral
participation are broader than turnout alone.
– Drivers of low turnout may vary between divisions. For example, the drivers of low
turnout in rural divisions may not be the same as those driving low turnout for inner city
divisions in Sydney and Melbourne.
– While FDEU processes have an overall positive impact on the voting franchise, the
increase in enrolments resulting from FDEU is greater than the increase in the numbers
of electors voting as a result of FDEU (thereby producing a modest drop in the turnout
rate).
– Results from the 2016 AEC Voter Survey and the 2016 AES survey imply a decrease in
elector confidence both in the electoral system and politics in general could be
contributing to the decrease in voter turnout.
■ The timing of an election, voter gender, satisfaction with the delivery of previous election
services, perceived competitiveness of an election and potential for changes in government
may also contribute to decreasing turnout. However, analysis of previous elections suggests
that the impact of these factors is minimal.
■ The declining voter turnout observed at Australian federal elections reflects international
trends. Over recent decades, voter turnout has been declining in most developed countries
(see, for example: Desilver, 2016; Ferrini, 2012; and Lam, 2015).
Page 6 Voter turnout – 2016 House of Representatives and Senate elections
Key findings
Lowest turnout under compulsory voting
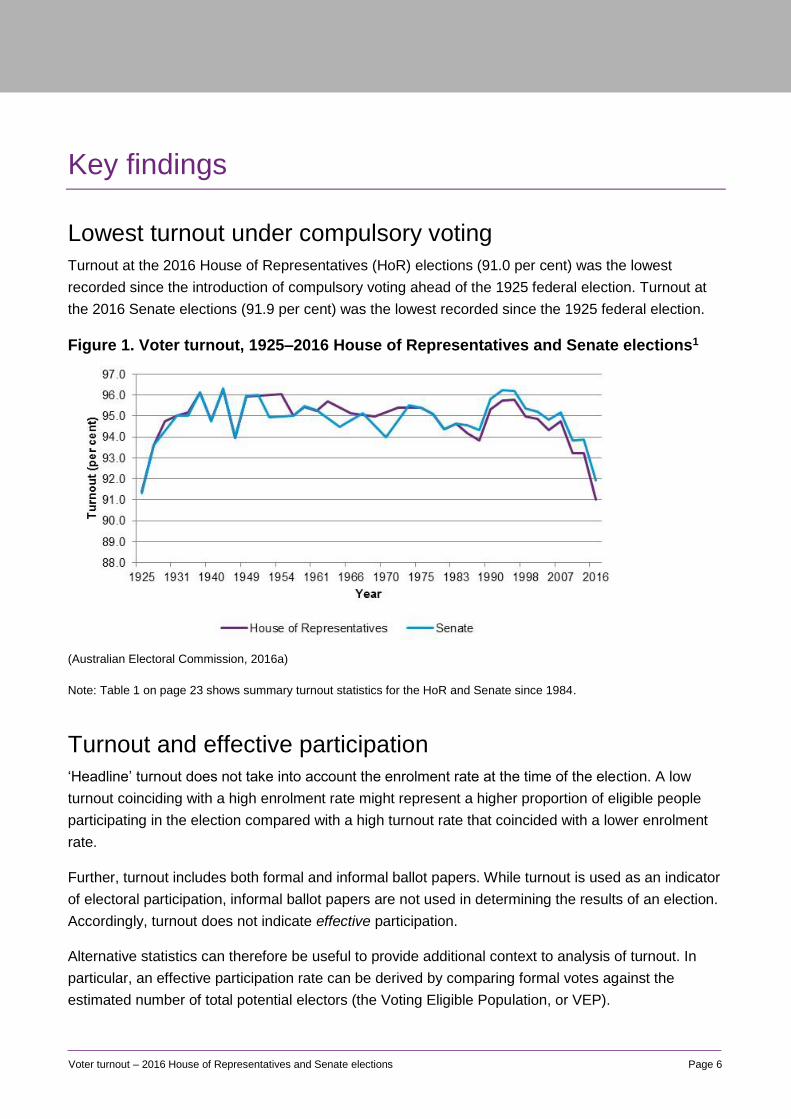
Turnout at the 2016 House of Representatives (HoR) elections (91.0 per cent) was the lowest
recorded since the introduction of compulsory voting ahead of the 1925 federal election. Turnout at
the 2016 Senate elections (91.9 per cent) was the lowest recorded since the 1925 federal election.
Figure 1. Voter turnout, 1925–2016 House of Representatives and Senate elections1
(Australian Electoral Commission, 2016a)
Note: Table 1 on page 23 shows summary turnout statistics for the HoR and Senate since 1984.
Turnout and effective participation
‘Headline’ turnout does not take into account the enrolment rate at the time of the election. A low
turnout coinciding with a high enrolment rate might represent a higher proportion of eligible people
participating in the election compared with a high turnout rate that coincided with a lower enrolment
rate.
Further, turnout includes both formal and informal ballot papers. While turnout is used as an indicator
of electoral participation, informal ballot papers are not used in determining the results of an election.
Accordingly, turnout does not indicate effective participation.
Alternative statistics can therefore be useful to provide additional context to analysis of turnout. In
particular, an effective participation rate can be derived by comparing formal votes against the
estimated number of total potential electors (the Voting Eligible Population, or VEP).
Page 7 Voter turnout – 2016 House of Representatives and Senate elections
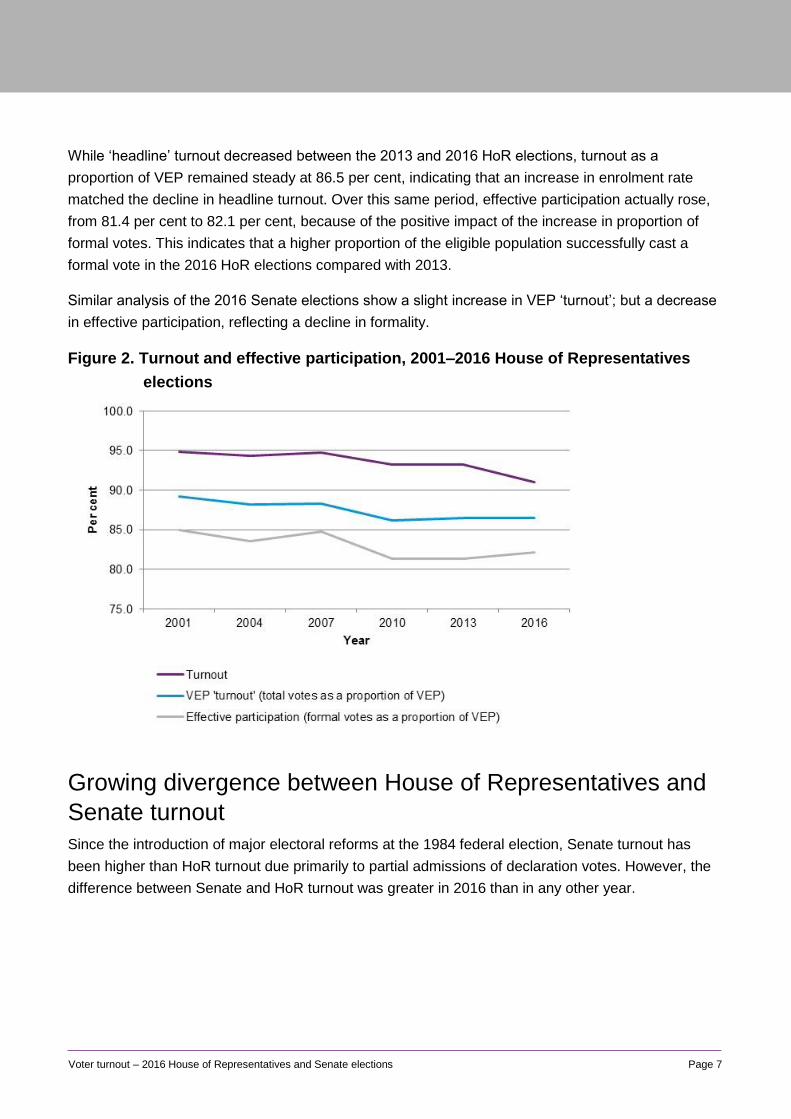
While ‘headline’ turnout decreased between the 2013 and 2016 HoR elections, turnout as a
proportion of VEP remained steady at 86.5 per cent, indicating that an increase in enrolment rate
matched the decline in headline turnout. Over this same period, effective participation actually rose,
from 81.4 per cent to 82.1 per cent, because of the positive impact of the increase in proportion of
formal votes. This indicates that a higher proportion of the eligible population successfully cast a
formal vote in the 2016 HoR elections compared with 2013.
Similar analysis of the 2016 Senate elections show a slight increase in VEP ‘turnout’; but a decrease
in effective participation, reflecting a decline in formality.
Figure 2. Turnout and effective participation, 2001–2016 House of Representatives
elections
Growing divergence between House of Representatives and
Senate turnout
Since the introduction of major electoral reforms at the 1984 federal election, Senate turnout has
been higher than HoR turnout due primarily to partial admissions of declaration votes. However, the
difference between Senate and HoR turnout was greater in 2016 than in any other year.

Page 8 Voter turnout – 2016 House of Representatives and Senate elections
Figure 3. Voter turnout, 1984–2016 House of Representatives and Senate elections
(Australian Electoral Commission, 2016a)
Note: Senate turnout figures for 2013 reflect the 2013 Senate election for Western Australia, not the 2014 re-run of this
election.2
Declining turnout and increasing formality for the House of
Representatives
In the past, turnout and formality at HoR elections have tended to move in the same direction (either
both increasing or both decreasing), reflecting a range of common factors that influence overall
engagement with the election. However, while the observed decrease in turnout combined with an
increase in formality at the 2016 HoR elections is unusual, it is not unique.
HoR turnout and formality have moved in the same direction at 8 of the 12 elections held since 1984.
The most recent previous elections where turnout and formality moved in opposite directions were
2013 and 1996 (although in both cases the change in turnout was negligible). The 2016 HoR
elections remain an outlier, in that a relatively strong decrease in turnout was paired with a relatively
strong increase in formality.
There is no one factor that explains this divergence. Rather, these divergences suggest that while
there may be some common factors influencing people to turnout and cast a formal vote, other
factors (perhaps specific to particular elections) may differ, or have varying levels of influence.
Changes in intentional verses unintentional informal voting might help explain the divergence
between turnout and formality, but these data are not yet available. For example, a substantial
increase in the proportion of intentional informality would be consistent with the drop in turnout as
both would indicate a decline in electoral engagement. The high proportion of ballot papers with no
Page 9 Voter turnout – 2016 House of Representatives and Senate elections
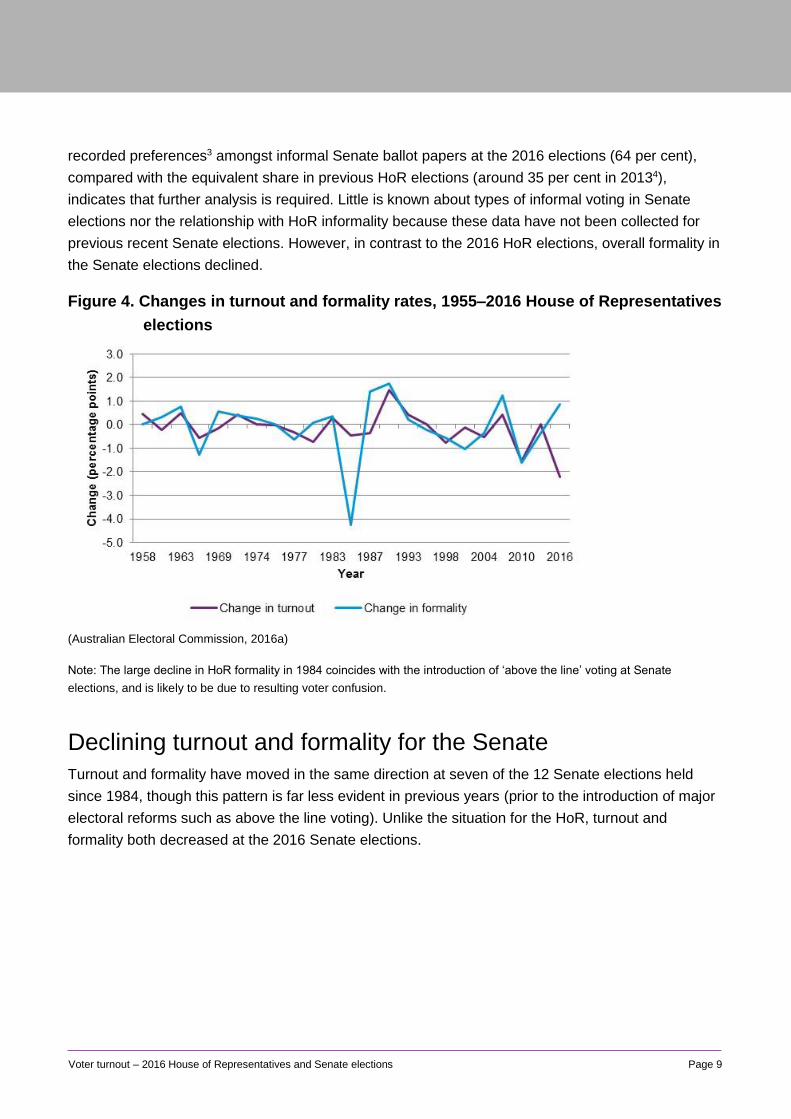
recorded preferences3 amongst informal Senate ballot papers at the 2016 elections (64 per cent),
compared with the equivalent share in previous HoR elections (around 35 per cent in 20134),
indicates that further analysis is required. Little is known about types of informal voting in Senate
elections nor the relationship with HoR informality because these data have not been collected for
previous recent Senate elections. However, in contrast to the 2016 HoR elections, overall formality in
the Senate elections declined.
Figure 4. Changes in turnout and formality rates, 1955–2016 House of Representatives
elections
(Australian Electoral Commission, 2016a)
Note: The large decline in HoR formality in 1984 coincides with the introduction of ‘above the line’ voting at Senate
elections, and is likely to be due to resulting voter confusion.
Declining turnout and formality for the Senate
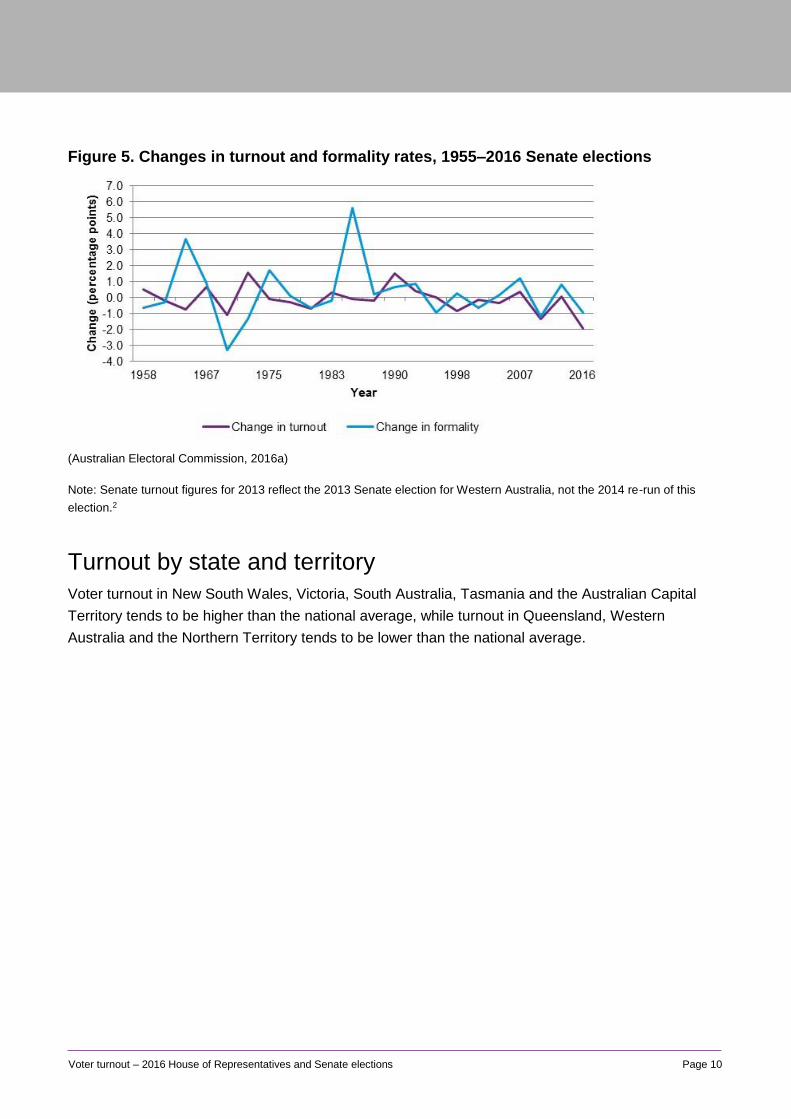
Turnout and formality have moved in the same direction at seven of the 12 Senate elections held
since 1984, though this pattern is far less evident in previous years (prior to the introduction of major
electoral reforms such as above the line voting). Unlike the situation for the HoR, turnout and
formality both decreased at the 2016 Senate elections.
Page 10 Voter turnout – 2016 House of Representatives and Senate elections
Figure 5. Changes in turnout and formality rates, 1955–2016 Senate elections
(Australian Electoral Commission, 2016a)
Note: Senate turnout figures for 2013 reflect the 2013 Senate election for Western Australia, not the 2014 re-run of this
election.2
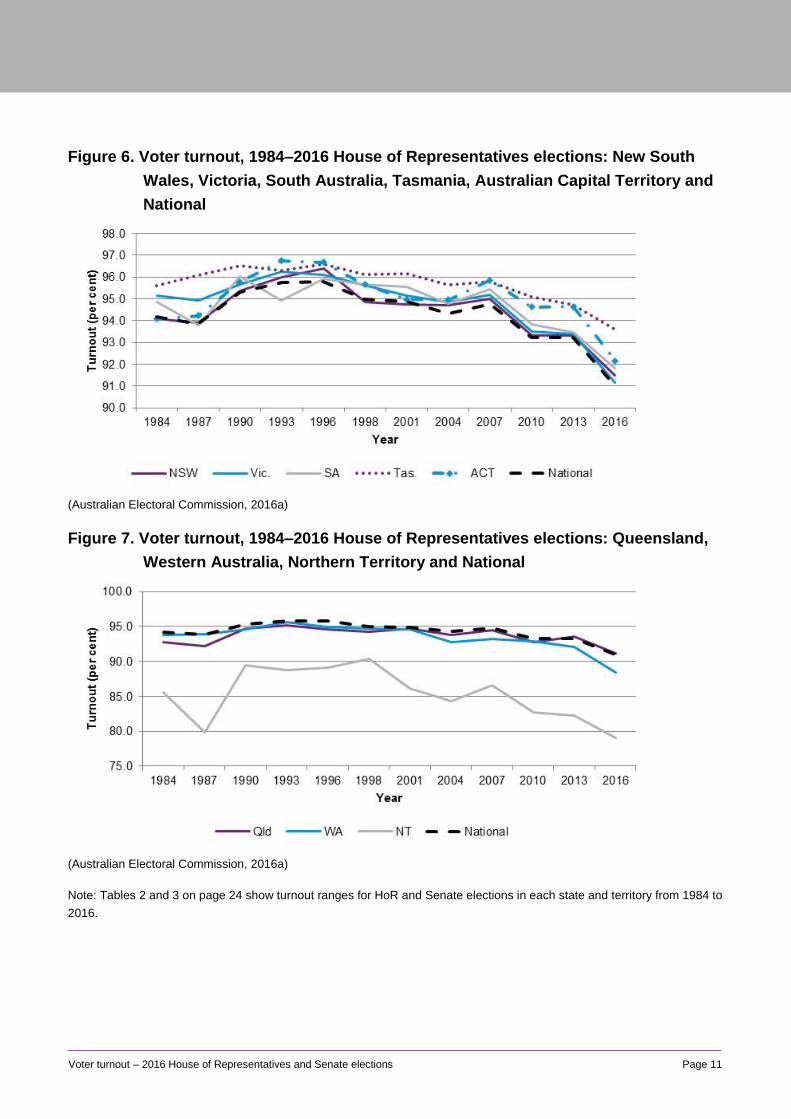
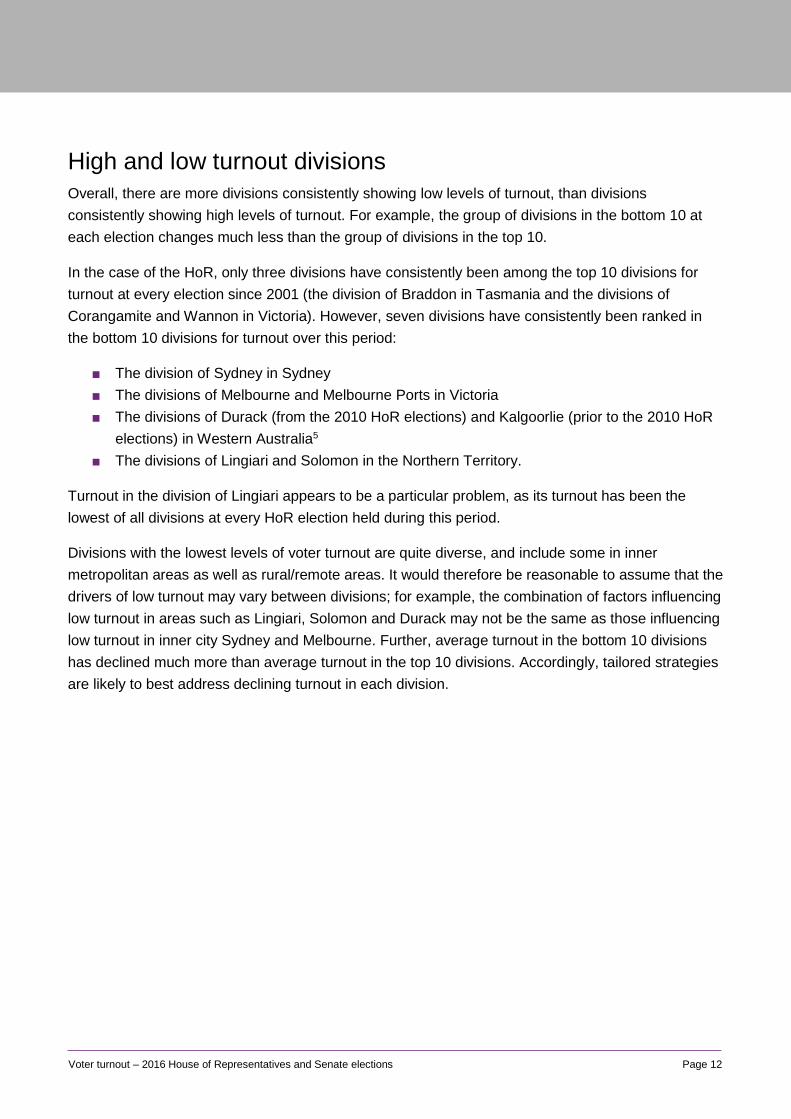
Turnout by state and territory
Voter turnout in New South Wales, Victoria, South Australia, Tasmania and the Australian Capital
Territory tends to be higher than the national average, while turnout in Queensland, Western
Australia and the Northern Territory tends to be lower than the national average.
Page 11 Voter turnout – 2016 House of Representatives and Senate elections
Figure 6. Voter turnout, 1984–2016 House of Representatives elections: New South
Wales, Victoria, South Australia, Tasmania, Australian Capital Territory and
National
(Australian Electoral Commission, 2016a)
Figure 7. Voter turnout, 1984–2016 House of Representatives elections: Queensland,
Western Australia, Northern Territory and National
(Australian Electoral Commission, 2016a)
Note: Tables 2 and 3 on page 24 show turnout ranges for HoR and Senate elections in each state and territory from 1984 to
2016.
Page 12 Voter turnout – 2016 House of Representatives and Senate elections
High and low turnout divisions
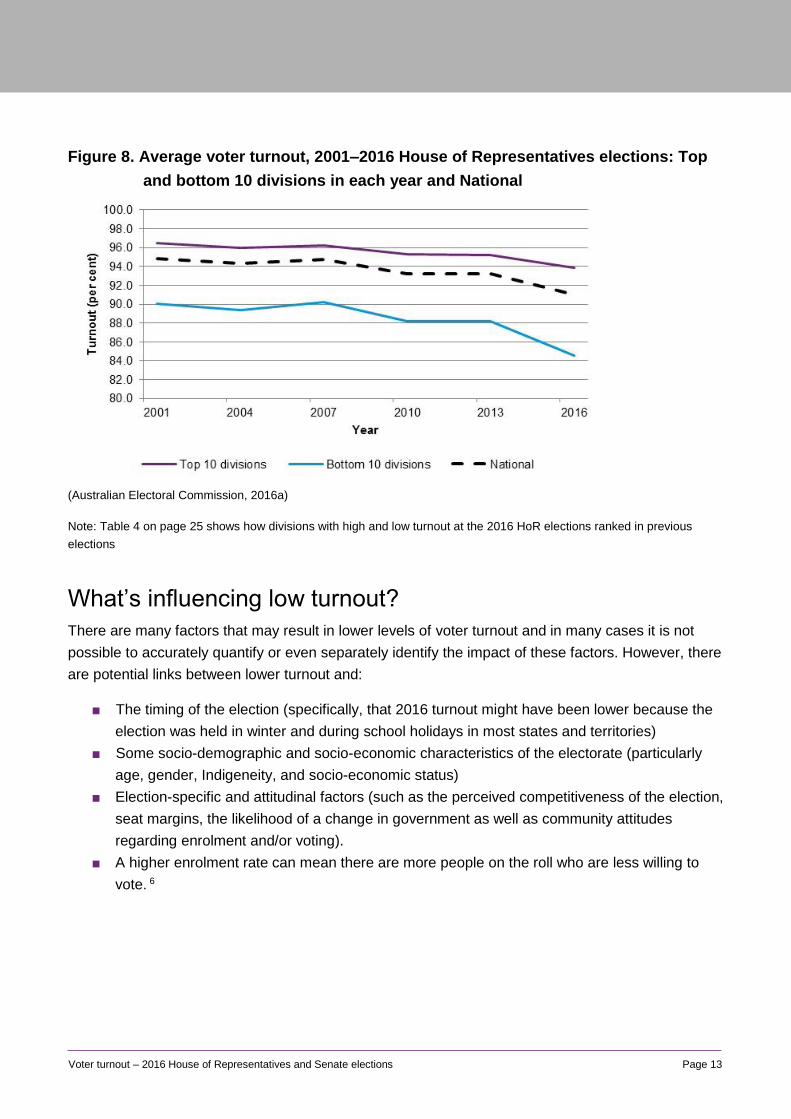
Overall, there are more divisions consistently showing low levels of turnout, than divisions
consistently showing high levels of turnout. For example, the group of divisions in the bottom 10 at
each election changes much less than the group of divisions in the top 10.
In the case of the HoR, only three divisions have consistently been among the top 10 divisions for
turnout at every election since 2001 (the division of Braddon in Tasmania and the divisions of
Corangamite and Wannon in Victoria). However, seven divisions have consistently been ranked in
the bottom 10 divisions for turnout over this period:
■ The division of Sydney in Sydney
■ The divisions of Melbourne and Melbourne Ports in Victoria
■ The divisions of Durack (from the 2010 HoR elections) and Kalgoorlie (prior to the 2010 HoR
elections) in Western Australia5
■ The divisions of Lingiari and Solomon in the Northern Territory.
Turnout in the division of Lingiari appears to be a particular problem, as its turnout has been the
lowest of all divisions at every HoR election held during this period.
Divisions with the lowest levels of voter turnout are quite diverse, and include some in inner
metropolitan areas as well as rural/remote areas. It would therefore be reasonable to assume that the
drivers of low turnout may vary between divisions; for example, the combination of factors influencing
low turnout in areas such as Lingiari, Solomon and Durack may not be the same as those influencing
low turnout in inner city Sydney and Melbourne. Further, average turnout in the bottom 10 divisions
has declined much more than average turnout in the top 10 divisions. Accordingly, tailored strategies
are likely to best address declining turnout in each division.
Page 13 Voter turnout – 2016 House of Representatives and Senate elections
Figure 8. Average voter turnout, 2001–2016 House of Representatives elections: Top
and bottom 10 divisions in each year and National
(Australian Electoral Commission, 2016a)
Note: Table 4 on page 25 shows how divisions with high and low turnout at the 2016 HoR elections ranked in previous
elections
What’s influencing low turnout?
There are many factors that may result in lower levels of voter turnout and in many cases it is not
possible to accurately quantify or even separately identify the impact of these factors. However, there
are potential links between lower turnout and:
■ The timing of the election (specifically, that 2016 turnout might have been lower because the
election was held in winter and during school holidays in most states and territories)
■ Some socio-demographic and socio-economic characteristics of the electorate (particularly
age, gender, Indigeneity, and socio-economic status)
■ Election-specific and attitudinal factors (such as the perceived competitiveness of the election,
seat margins, the likelihood of a change in government as well as community attitudes
regarding enrolment and/or voting).
■ A higher enrolment rate can mean there are more people on the roll who are less willing to
vote. 6
Page 14 Voter turnout – 2016 House of Representatives and Senate elections
Election timing
Some media commentators have speculated that voter turnout for the 2016 federal election was
particularly low due to a long winter campaign that clashed with school holidays (Hasham, 2016;
Mather, 2016). Only three other federal elections have been held in winter. Since 1925, the average
for winter turnout is 93.6 per cent, compared to 95.0 per cent for non-winter elections (as shown in
Table 5 on page 26).7
It is difficult to assess the impact of school holidays on voter turnout as school terms vary between
(and within) states and territories, and change from year to year. Elections are not usually scheduled
during school holidays (Sloan & Lester, 2016; McIlroy, 2016), and while there is evidence that one of
the reasons for increased levels of early voting at the 2016 federal election was that more people
were travelling interstate, it does not necessarily follow that persons travelling in school holiday
periods would also be more likely to not vote at all.8
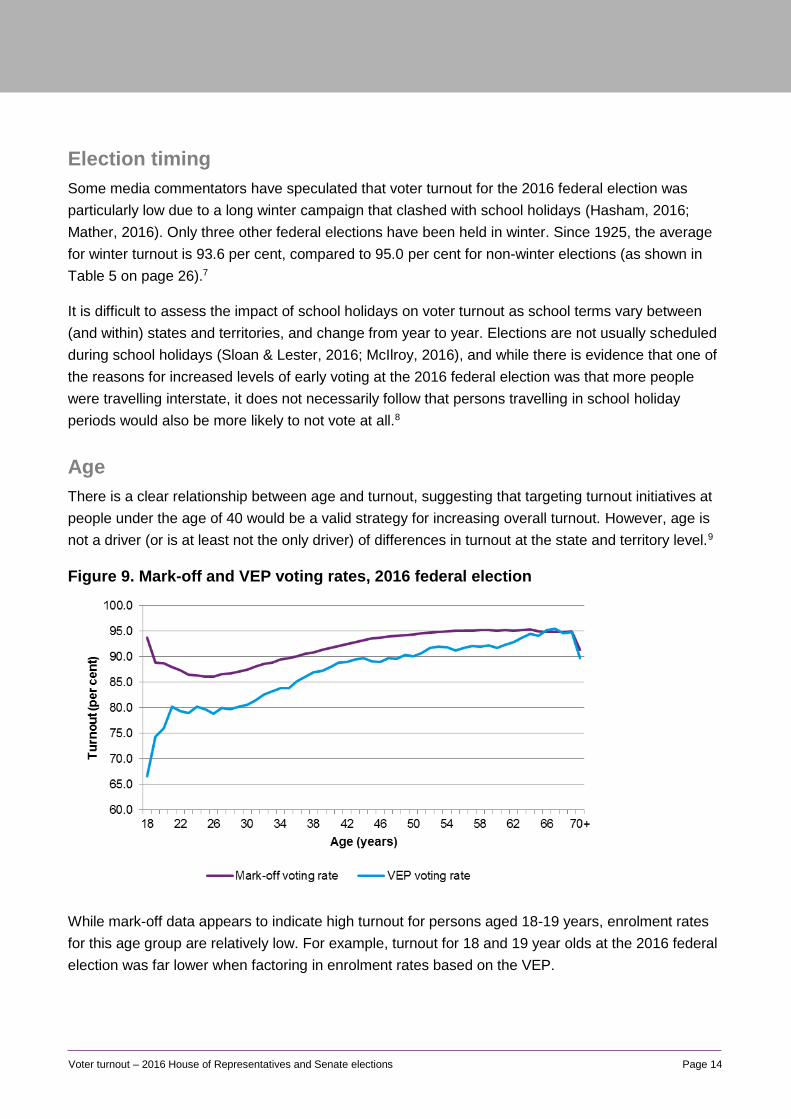
Age
There is a clear relationship between age and turnout, suggesting that targeting turnout initiatives at
people under the age of 40 would be a valid strategy for increasing overall turnout. However, age is
not a driver (or is at least not the only driver) of differences in turnout at the state and territory level.9
Figure 9. Mark-off and VEP voting rates, 2016 federal election
While mark-off data appears to indicate high turnout for persons aged 18-19 years, enrolment rates
for this age group are relatively low. For example, turnout for 18 and 19 year olds at the 2016 federal
election was far lower when factoring in enrolment rates based on the VEP.

Page 15 Voter turnout – 2016 House of Representatives and Senate elections
The relationship between turnout and age has been apparent for many years, with research
indicating that this is a life-stage effect, not a generational effect.10 In other words, turnout is more
closely related to the age of an elector at the time of the election, not the year in which they were
born.
Gender
Mark-off data indicates that turnout for males is consistently lower than that for females and this gap
is gradually increasing. However, gender does not appear to have a strong effect on turnout.
Figure 10. Mark-off by gender, 1996–2016 federal elections
Indigeneity
Indigenous turnout is persistently and substantially lower than turnout for the rest of the Australian
population. The absence of an Indigenous Identifier on the Roll necessitates indirect estimation of
Indigenous franchise metrics, making findings indicative only. Such modelling suggests that
indigenous turnout at the 2013 and 2016 HoR elections was 60 and 52 per cent respectively, much
lower than the corresponding overall figures of 93.2 and 91.0 per cent.
Areas with high proportions of the Indigenous population also exhibit lower rates of enrolment and
formality, indicating that issues relating to Indigenous electoral participation are broader than turnout
alone.
Page 16 Voter turnout – 2016 House of Representatives and Senate elections
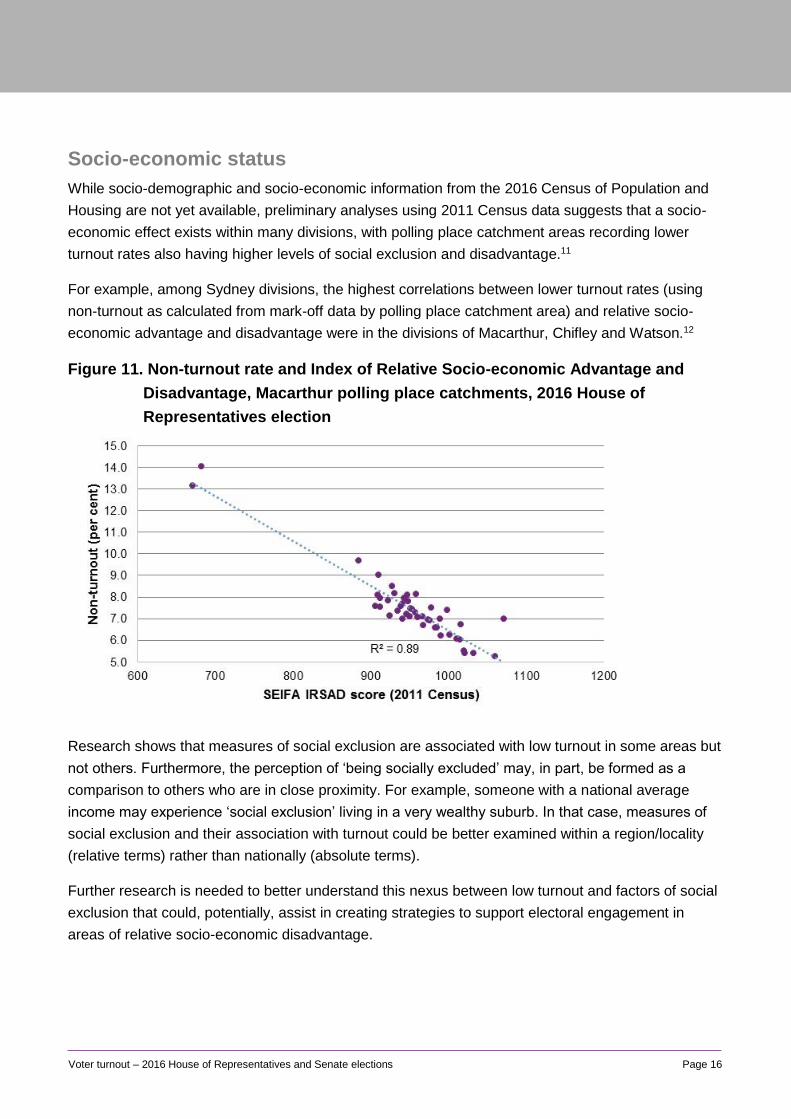
Socio-economic status
While socio-demographic and socio-economic information from the 2016 Census of Population and
Housing are not yet available, preliminary analyses using 2011 Census data suggests that a socio-
economic effect exists within many divisions, with polling place catchment areas recording lower
turnout rates also having higher levels of social exclusion and disadvantage.11
For example, among Sydney divisions, the highest correlations between lower turnout rates (using
non-turnout as calculated from mark-off data by polling place catchment area) and relative socio-
economic advantage and disadvantage were in the divisions of Macarthur, Chifley and Watson.12
Figure 11. Non-turnout rate and Index of Relative Socio-economic Advantage and
Disadvantage, Macarthur polling place catchments, 2016 House of
Representatives election
Research shows that measures of social exclusion are associated with low turnout in some areas but
not others. Furthermore, the perception of ‘being socially excluded’ may, in part, be formed as a
comparison to others who are in close proximity. For example, someone with a national average
income may experience ‘social exclusion’ living in a very wealthy suburb. In that case, measures of
social exclusion and their association with turnout could be better examined within a region/locality
(relative terms) rather than nationally (absolute terms).
Further research is needed to better understand this nexus between low turnout and factors of social
exclusion that could, potentially, assist in creating strategies to support electoral engagement in
areas of relative socio-economic disadvantage.
Page 17 Voter turnout – 2016 House of Representatives and Senate elections
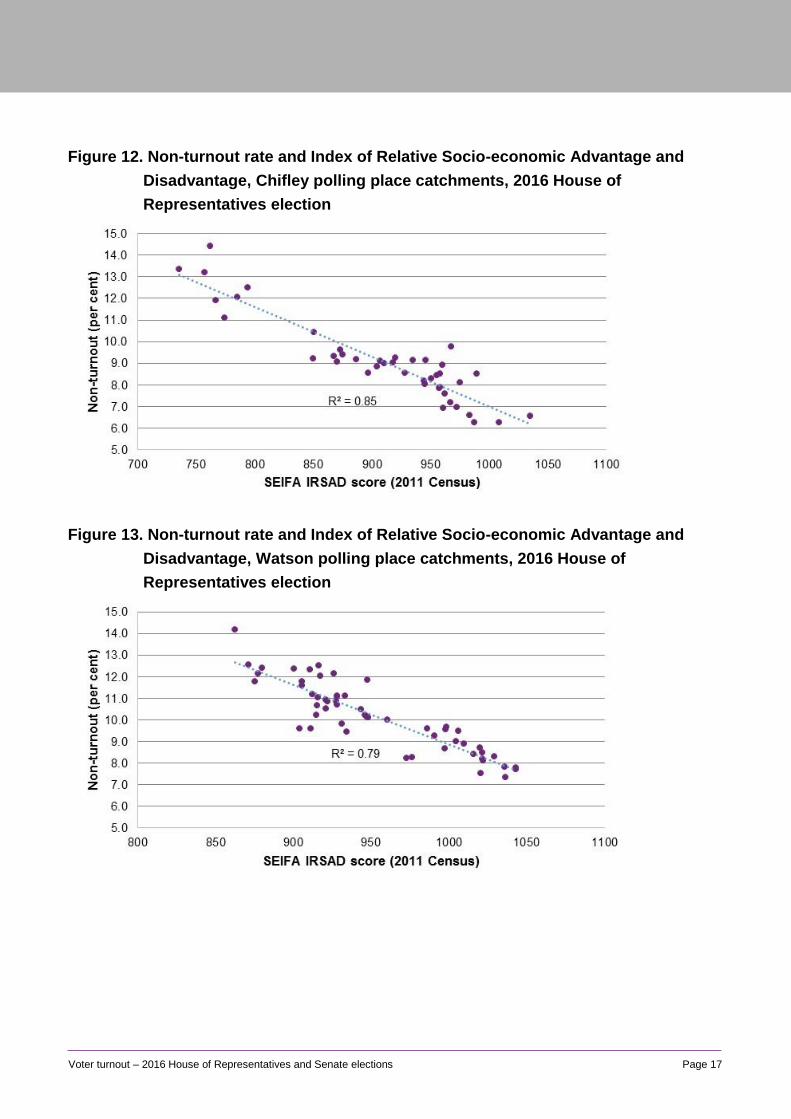
Figure 12. Non-turnout rate and Index of Relative Socio-economic Advantage and
Disadvantage, Chifley polling place catchments, 2016 House of
Representatives election
Figure 13. Non-turnout rate and Index of Relative Socio-economic Advantage and
Disadvantage, Watson polling place catchments, 2016 House of
Representatives election

Page 18 Voter turnout – 2016 House of Representatives and Senate elections
Federal Direct Enrolment and Update
Subject to a rigorous quality assurance regime, FDEU processes allow the AEC to place eligible
persons on the electoral roll based on data from external agencies. This has led to increased
enrolments and higher numbers of people voting.
As a group, electors enrolled by FDEU appear to be less inclined to vote than electors enrolled by
other means. Compared with other electors they might be less likely to:
■ be aware of the compulsory nature of voting,
■ know that they had been enrolled,
■ know how to cast their vote, and/or
■ be motivated to vote.
Only 83.1 per cent of electors whose most recent enrolment transaction was via FDEU were marked
off the roll compared with 94.2 per cent of all other electors. The difference was greater for new
electors, with a mark-off rate for those enrolled for the first time via FDEU of 60.9 per cent compared
with 92.4 per cent for other new electors.
While growth in the roll via FDEU can have a negative influence on the rate of turnout, it increases
the opportunity for more people to vote, and results in an increase in turnout as a number. The
overall effect of FDEU on the voting franchise is positive: more people have the opportunity to vote,
and more people do so.13
Note: Table 6 on page 26 shows turnout from the 2016 federal election by FDEU status and enrolment type.
Service delivery
People’s voting experience and their perceptions of the AEC could also affect their willingness to
vote. The 2016 Voter Survey indicated several areas of service delivery that could impact voter
turnout, and showed that there was a significant decline in levels of satisfaction with the overall voting
experience (from 93 per cent of voters in 2013 to 87 per cent reporting they were satisfied in 2016)
(Wallis Market and Social Research, 2016).
The proportion of voters who were confident in the AEC’s ability to deliver electoral services also fell:
from 91 per cent in 2013 to 85 per cent in 2016. However, the proportion of voters who agreed that
the AEC conducts elections fairly and impartially remained high and stable at 90 per cent (Wallis
Market and Social Research, 2016).
Improvements to overall election processes and ballot paper handling procedures implemented after
the 2013 election have reduced the risk of service delivery issues negatively affecting turnout.
Avoiding the potential disenfranchisement of electors is a core focus for the AEC.

Page 19 Voter turnout – 2016 House of Representatives and Senate elections
Competitiveness of an election
There is a view that voter turnout is likely to be higher if the election margin is expected to be close
(see, for example, Dowding, 2005; Grofman, 1993; and Rolfe, 2012). Electors may be more inclined
to turn out to vote if they believe their vote will have a greater influence in determining the overall
result. Conversely, if they believe that the outcome of the election is a foregone conclusion, electors
may be less inclined to turn out to vote.
Information relating to the competitiveness of an election can be found by looking at margins in
individual seats, as well as information from such sources as national opinion polls and betting
markets. Previous AEC investigations concluded that the closeness of election results was not
detectably related to turnout in Australia. Between the 1996 and 2016 federal elections there was no
consistent pattern to turnout in marginal, fairly safe and safe seats14, when compared against the
overall turnout.
Figure 14. Turnout by seat status, 1996–2016 House of Representatives elections
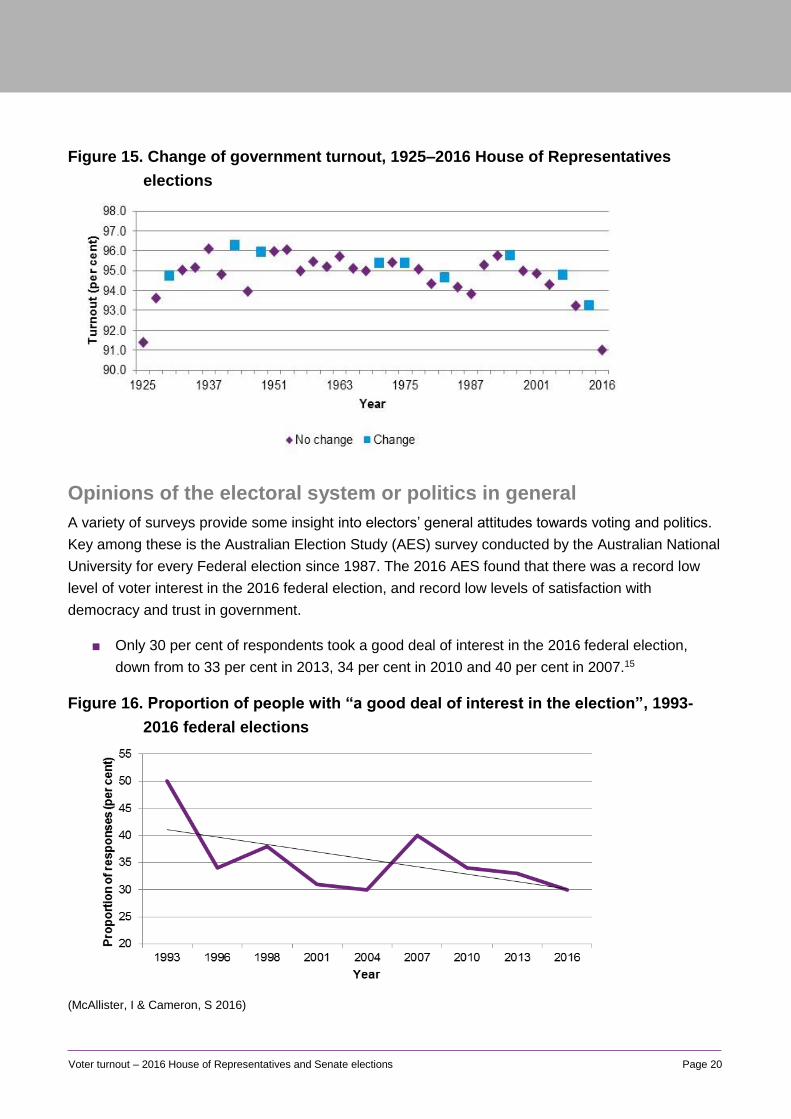
Change of government
Previous AEC research shows that turnouts for change of government elections have tended to be
slightly higher than those where there has been no change. While the differences are not believed to
be statistically significant, this could indicate that some of the factors influencing change of
government elections may also influence turnout.
Page 20 Voter turnout – 2016 House of Representatives and Senate elections
Figure 15. Change of government turnout, 1925–2016 House of Representatives
elections
Opinions of the electoral system or politics in general
A variety of surveys provide some insight into electors’ general attitudes towards voting and politics.
Key among these is the Australian Election Study (AES) survey conducted by the Australian National
University for every Federal election since 1987. The 2016 AES found that there was a record low
level of voter interest in the 2016 federal election, and record low levels of satisfaction with
democracy and trust in government.
■ Only 30 per cent of respondents took a good deal of interest in the 2016 federal election,
down from to 33 per cent in 2013, 34 per cent in 2010 and 40 per cent in 2007.15
Figure 16. Proportion of people with “a good deal of interest in the election”, 1993-
2016 federal elections
(McAllister, I & Cameron, S 2016)
Page 21 Voter turnout – 2016 House of Representatives and Senate elections
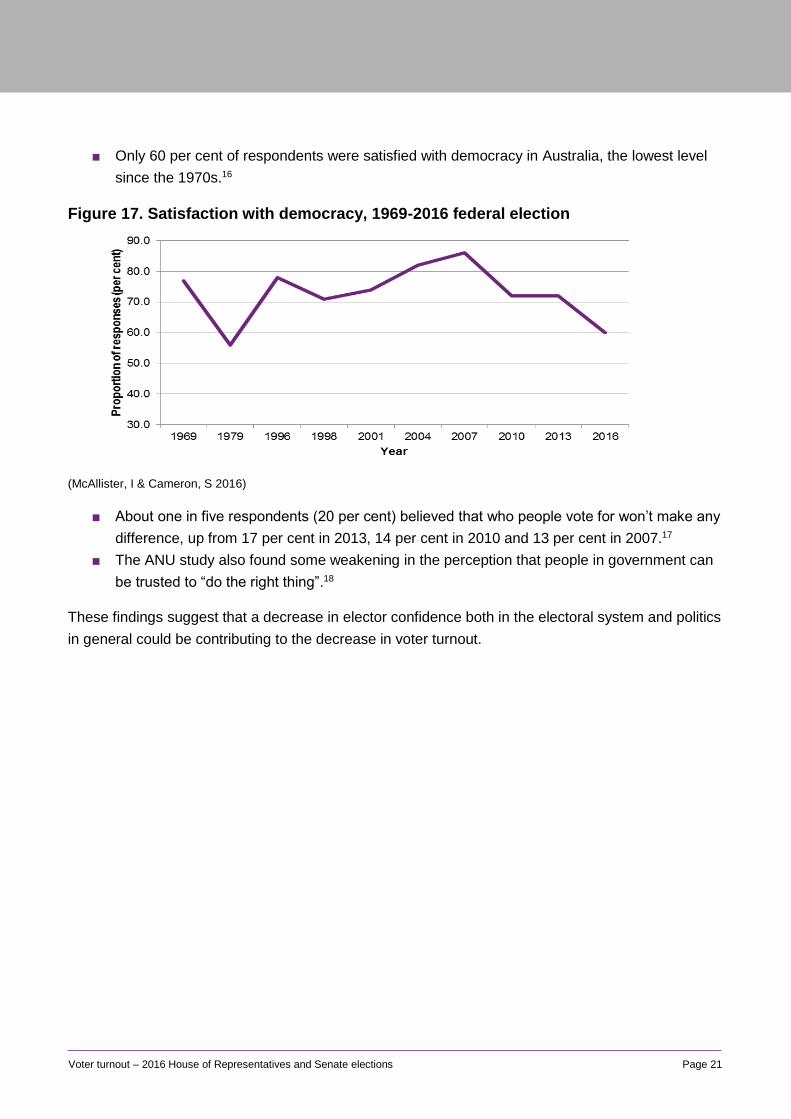
■ Only 60 per cent of respondents were satisfied with democracy in Australia, the lowest level
since the 1970s.16
Figure 17. Satisfaction with democracy, 1969-2016 federal election
(McAllister, I & Cameron, S 2016)
■ About one in five respondents (20 per cent) believed that who people vote for won’t make any
difference, up from 17 per cent in 2013, 14 per cent in 2010 and 13 per cent in 2007.17
■ The ANU study also found some weakening in the perception that people in government can
be trusted to “do the right thing”.18
These findings suggest that a decrease in elector confidence both in the electoral system and politics
in general could be contributing to the decrease in voter turnout.
Page 22 Voter turnout – 2016 House of Representatives and Senate elections
Appendices
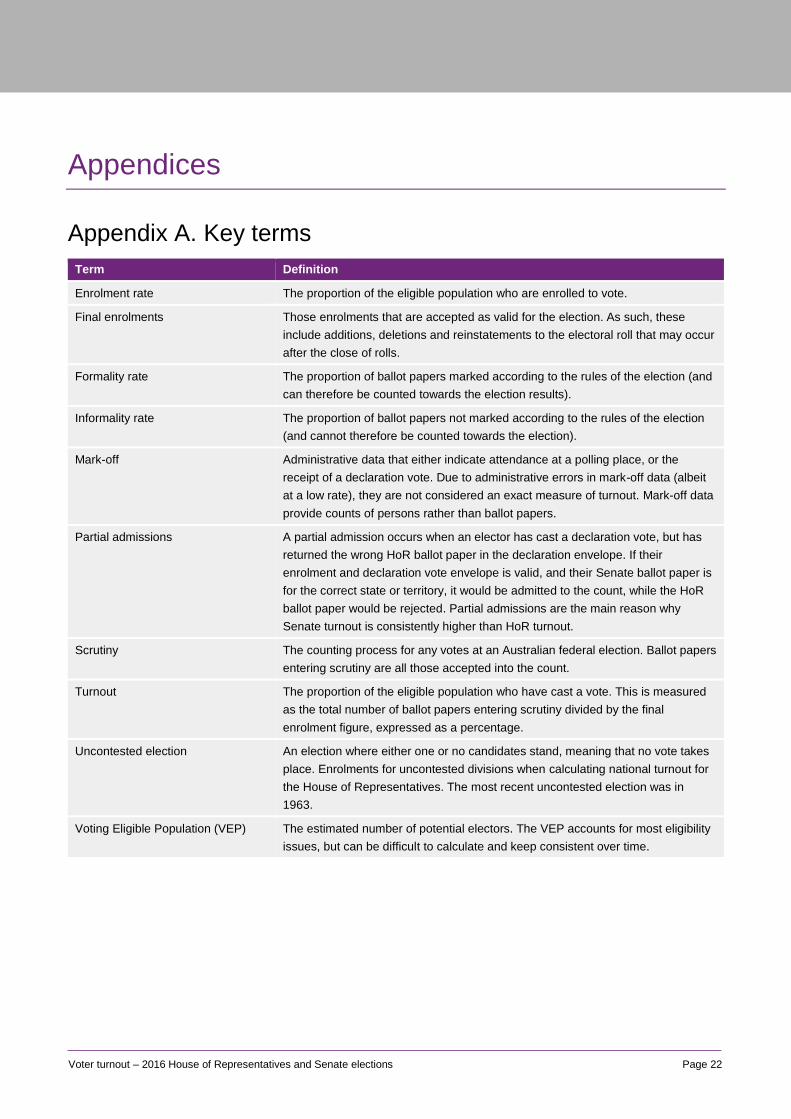
Appendix A. Key terms
Term Definition
Enrolment rate The proportion of the eligible population who are enrolled to vote.
Final enrolments Those enrolments that are accepted as valid for the election. As such, these
include additions, deletions and reinstatements to the electoral roll that may occur
after the close of rolls.
Formality rate The proportion of ballot papers marked according to the rules of the election (and
can therefore be counted towards the election results).
Informality rate The proportion of ballot papers not marked according to the rules of the election
(and cannot therefore be counted towards the election).
Mark-off Administrative data that either indicate attendance at a polling place, or the
receipt of a declaration vote. Due to administrative errors in mark-off data (albeit
at a low rate), they are not considered an exact measure of turnout. Mark-off data
provide counts of persons rather than ballot papers.
Partial admissions A partial admission occurs when an elector has cast a declaration vote, but has
returned the wrong HoR ballot paper in the declaration envelope. If their
enrolment and declaration vote envelope is valid, and their Senate ballot paper is
for the correct state or territory, it would be admitted to the count, while the HoR
ballot paper would be rejected. Partial admissions are the main reason why
Senate turnout is consistently higher than HoR turnout.
Scrutiny The counting process for any votes at an Australian federal election. Ballot papers
entering scrutiny are all those accepted into the count.
Turnout The proportion of the eligible population who have cast a vote. This is measured
as the total number of ballot papers entering scrutiny divided by the final
enrolment figure, expressed as a percentage.
Uncontested election An election where either one or no candidates stand, meaning that no vote takes
place. Enrolments for uncontested divisions when calculating national turnout for
the House of Representatives. The most recent uncontested election was in
1963.
Voting Eligible Population (VEP) The estimated number of potential electors. The VEP accounts for most eligibility
issues, but can be difficult to calculate and keep consistent over time.
Page 23 Voter turnout – 2016 House of Representatives and Senate elections
Appendix B. Tables
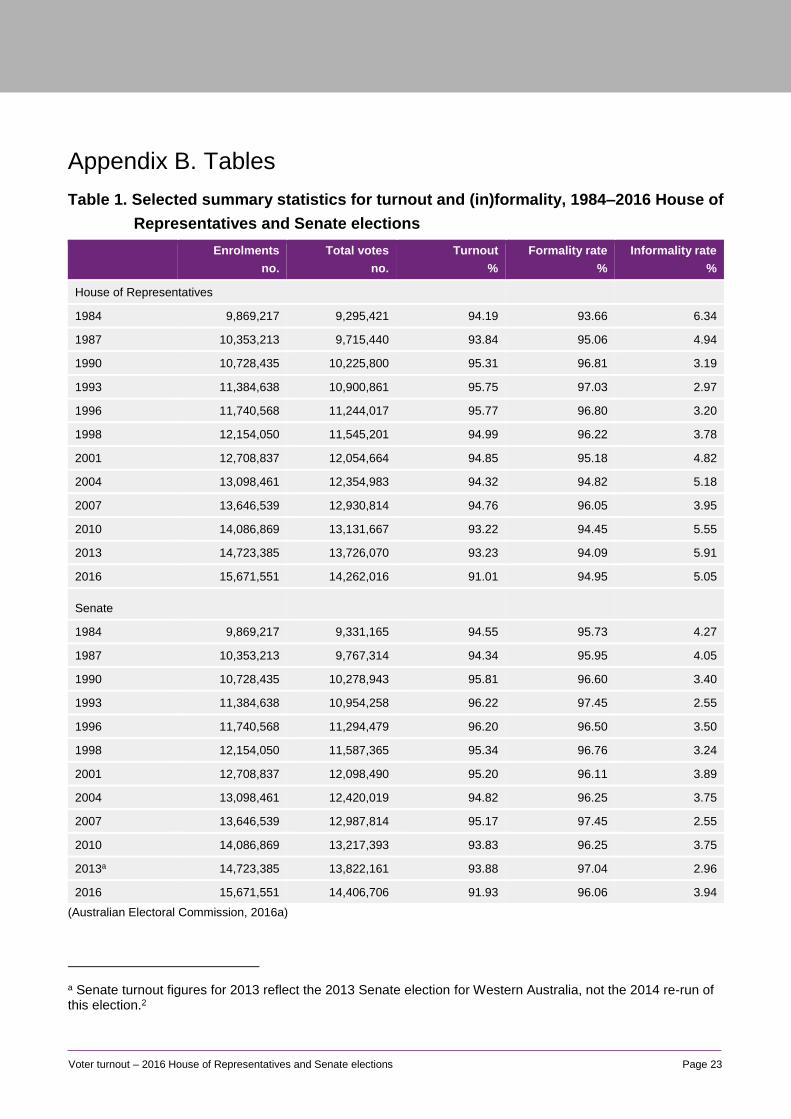
Table 1. Selected summary statistics for turnout and (in)formality, 1984–2016 House of
Representatives and Senate elections
Enrolments
no.
Total votes
no.
Turnout
%
Formality rate
%
Informality rate
%
House of Representatives
1984 9,869,217 9,295,421 94.19 93.66 6.34
1987 10,353,213 9,715,440 93.84 95.06 4.94
1990 10,728,435 10,225,800 95.31 96.81 3.19
1993 11,384,638 10,900,861 95.75 97.03 2.97
1996 11,740,568 11,244,017 95.77 96.80 3.20
1998 12,154,050 11,545,201 94.99 96.22 3.78
2001 12,708,837 12,054,664 94.85 95.18 4.82
2004 13,098,461 12,354,983 94.32 94.82 5.18
2007 13,646,539 12,930,814 94.76 96.05 3.95
2010 14,086,869 13,131,667 93.22 94.45 5.55
2013 14,723,385 13,726,070 93.23 94.09 5.91
2016 15,671,551 14,262,016 91.01 94.95 5.05
Senate
1984 9,869,217 9,331,165 94.55 95.73 4.27
1987 10,353,213 9,767,314 94.34 95.95 4.05
1990 10,728,435 10,278,943 95.81 96.60 3.40
1993 11,384,638 10,954,258 96.22 97.45 2.55
1996 11,740,568 11,294,479 96.20 96.50 3.50
1998 12,154,050 11,587,365 95.34 96.76 3.24
2001 12,708,837 12,098,490 95.20 96.11 3.89
2004 13,098,461 12,420,019 94.82 96.25 3.75
2007 13,646,539 12,987,814 95.17 97.45 2.55
2010 14,086,869 13,217,393 93.83 96.25 3.75
2013a 14,723,385 13,822,161 93.88 97.04 2.96
2016 15,671,551 14,406,706 91.93 96.06 3.94
(Australian Electoral Commission, 2016a)
a Senate turnout figures for 2013 reflect the 2013 Senate election for Western Australia, not the 2014 re-run of this election.2
Page 24 Voter turnout – 2016 House of Representatives and Senate elections
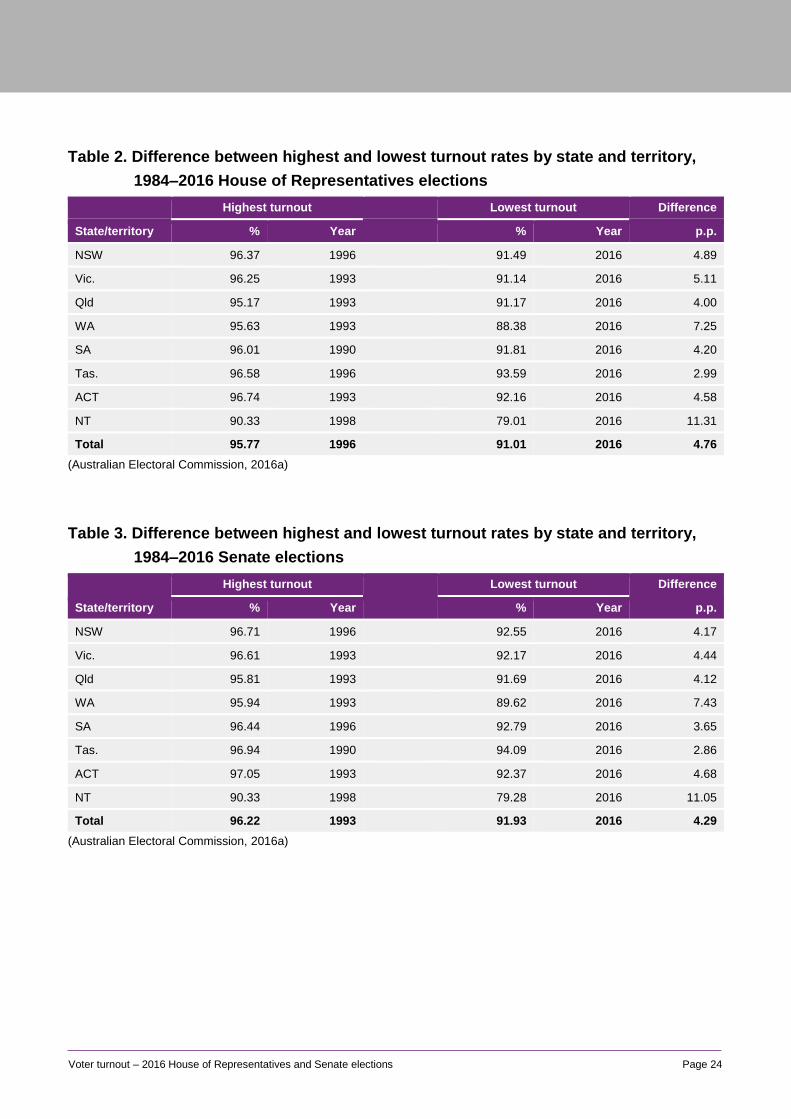
Table 2. Difference between highest and lowest turnout rates by state and territory,
1984–2016 House of Representatives elections
Highest turnout Lowest turnout Difference
State/territory % Year % Year p.p.
NSW 96.37 1996 91.49 2016 4.89
Vic. 96.25 1993 91.14 2016 5.11
Qld 95.17 1993 91.17 2016 4.00
WA 95.63 1993 88.38 2016 7.25
SA 96.01 1990 91.81 2016 4.20
Tas. 96.58 1996 93.59 2016 2.99
ACT 96.74 1993 92.16 2016 4.58
NT 90.33 1998 79.01 2016 11.31
Total 95.77 1996 91.01 2016 4.76
(Australian Electoral Commission, 2016a)
Table 3. Difference between highest and lowest turnout rates by state and territory,
1984–2016 Senate elections
Highest turnout Lowest turnout Difference
State/territory % Year % Year p.p.
NSW 96.71 1996 92.55 2016 4.17
Vic. 96.61 1993 92.17 2016 4.44
Qld 95.81 1993 91.69 2016 4.12
WA 95.94 1993 89.62 2016 7.43
SA 96.44 1996 92.79 2016 3.65
Tas. 96.94 1990 94.09 2016 2.86
ACT 97.05 1993 92.37 2016 4.68
NT 90.33 1998 79.28 2016 11.05
Total 96.22 1993 91.93 2016 4.29
(Australian Electoral Commission, 2016a)

Page 25 Voter turnout – 2016 House of Representatives and Senate elections
Table 4. Turnout history of divisions with the highest and lowest levels of turnouta in
2016, 2001–2016 House of Representatives elections
Division (state/territory)
2001
%
2004
%
2007
%
2010
%
2013
%
2016
%
Divisions with the ten highest turnouts in 2016
Mayo (SA) 95.86 95.21 95.88 94.88 94.60 94.19
Braddon (Tas.) 96.45* 96.04* 96.31* 95.65* 95.35* 94.09
Hughes (NSW) 96.15 95.45 95.70 94.21 94.24 93.94
Corangamite (Vic.) 96.32* 96.06* 96.47* 95.37* 95.54* 93.94
Franklin (Tas.) 96.30* 95.65 95.84 95.46* 95.09* 93.85
Wannon (Vic.) 96.61* 95.95* 96.40* 95.33* 95.61* 93.73
Bass (Tas.) 96.16 95.63 95.71 95.16* 94.42 93.68
Calare (NSW) 96.18 95.67 95.77 95.34* 95.32* 93.64
Hume (NSW) 95.73 95.57 96.24* 94.95 94.96* 93.57
Eden-Monaro (NSW) 95.70 95.28 95.97 94.39 94.53 93.55
Divisions with the ten lowest turnouts in 2016
Blaxland (NSW) 93.89 93.73 93.17 90.09† 90.32† 87.25
Brand (WA) 95.20 93.41 93.52 93.36 92.26 87.04
Swan (WA) 94.23 92.18† 93.17 91.97 91.02 86.84
Melbourne (Vic.) 90.97† 91.07† 91.50† 90.09† 90.69† 86.79
Melbourne Ports (Vic.) 91.68† 91.13† 91.72† 89.67† 90.04† 86.59
Wentworth (NSW) 91.73† 92.34 92.53† 89.47† 89.30† 86.24
Sydney (NSW) 90.14† 91.51† 90.84† 88.15† 88.33† 84.77
Solomon (NT) 91.99† 91.21† 92.06† 89.62† 89.31† 83.81
Durack (WA)b 86.81† 83.53† 84.58† 88.19† 87.06† 82.03
Lingiari (NT) 80.55† 77.71† 81.26† 75.87† 75.42† 73.70
* Division was also one of the ten highest informality divisions in this year.
† Division was also one of the ten lowest informality divisions in this year.
(Australian Electoral Commission, 2016a)
a Comparisons of informal voting in this table will be impacted by redistributions of electoral boundaries for New South Wales (in 2005, 2009 and 2016), Victoria (in 2002 and 2010), Queensland (in 2003, 2005 and 2009), Western Australia (in 2008 and 2016) and the Australian Capital Territory (in 2005 and 2016). (Australian Electoral Commission, 2016b)
b The division of Durack was formed as part of the 2008 electoral redistribution of Western Australia. It replaced parts of the division of Kalgoorlie (which was abolished as part of the redistribution) and parts of the division of O’Connor (Australian Electoral Commission, 2008). Figures for the 2001, 2004 and 2007 federal elections refer to the division of Kalgoorlie.
Page 26 Voter turnout – 2016 House of Representatives and Senate elections
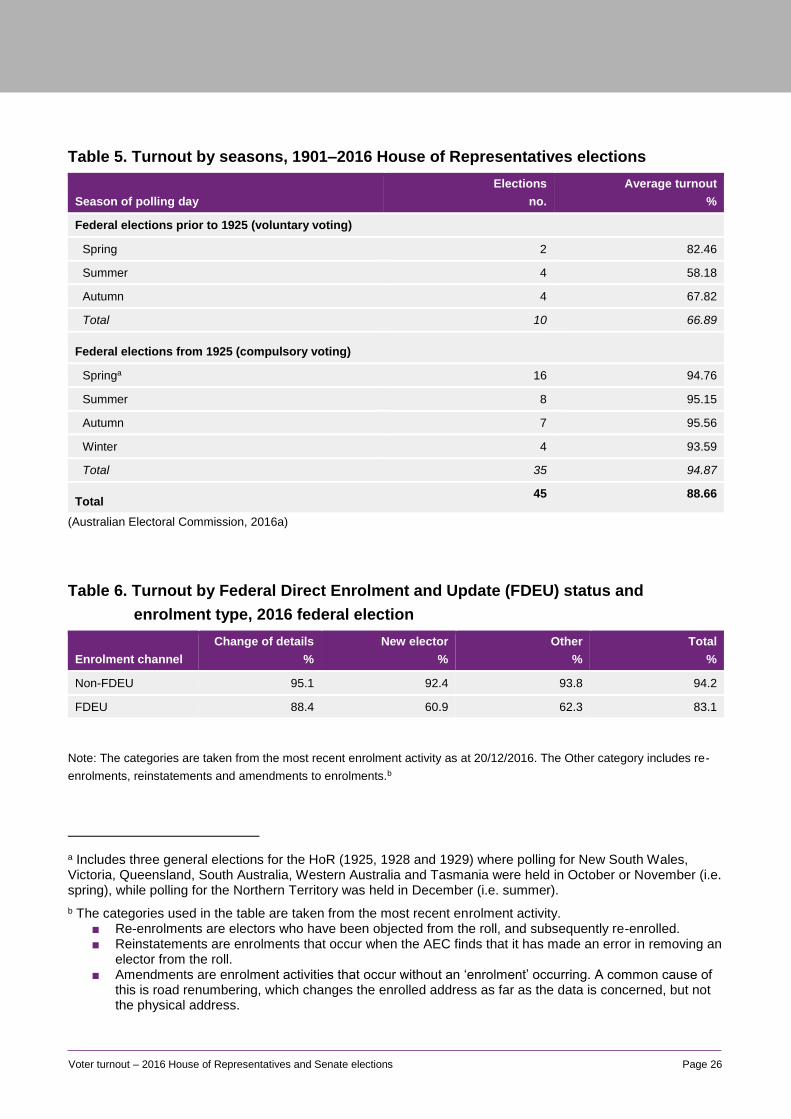
Table 5. Turnout by seasons, 1901–2016 House of Representatives elections
Season of polling day
Elections
no.
Average turnout
%
Federal elections prior to 1925 (voluntary voting)
Spring 2 82.46
Summer 4 58.18
Autumn 4 67.82
Total 10 66.89
Federal elections from 1925 (compulsory voting)
Springa 16 94.76
Summer 8 95.15
Autumn 7 95.56
Winter 4 93.59
Total 35 94.87
Total 45 88.66
(Australian Electoral Commission, 2016a)
Table 6. Turnout by Federal Direct Enrolment and Update (FDEU) status and
enrolment type, 2016 federal election
Enrolment channel
Change of details
%
New elector
%
Other
%
Total
%
Non-FDEU 95.1 92.4 93.8 94.2
FDEU 88.4 60.9 62.3 83.1
Note: The categories are taken from the most recent enrolment activity as at 20/12/2016. The Other category includes re-
enrolments, reinstatements and amendments to enrolments.b
a Includes three general elections for the HoR (1925, 1928 and 1929) where polling for New South Wales, Victoria, Queensland, South Australia, Western Australia and Tasmania were held in October or November (i.e. spring), while polling for the Northern Territory was held in December (i.e. summer).
b The categories used in the table are taken from the most recent enrolment activity. ■ Re-enrolments are electors who have been objected from the roll, and subsequently re-enrolled. ■ Reinstatements are enrolments that occur when the AEC finds that it has made an error in removing an
elector from the roll. ■ Amendments are enrolment activities that occur without an ‘enrolment’ occurring. A common cause of
this is road renumbering, which changes the enrolled address as far as the data is concerned, but not the physical address.

Page 27 Voter turnout – 2016 House of Representatives and Senate elections
References
Australian Election Study. (2016). About the Australian Election Study. Retrieved December 20,
2016, from https://australianelectionstudy.org/about.html
Australian Electoral Commission. (2008, December 18). 2008 Redistribution of Western Australia into
Electoral Divisions. Canberra: AEC. Retrieved November 23, 2016, from
http://www.aec.gov.au/Electorates/Redistributions/files/2008/wa/report/final/wa_final_redist_re
port.pdf
Australian Electoral Commission. (2016a). Historical Election Statistics Archive. Strategic Research
and Analysis Section, Internal electronic resource.
Australian Electoral Commission. (2016b, August 25). Previous redistributions. Retrieved February 3,
2017, from AEC: http://www.aec.gov.au/Electorates/Redistributions/dates.htm
Australian National University. (2016, December 20). Voter interest hits record low in 2016 - ANU
Election Study. Newsroom. Retrieved December 20, 2016, from
http://www.anu.edu.au/news/all-news/voter-interest-hits-record-low-in-2016-anu-election-
study
Desilver, D. (2016, August 2). U.S. voter turnout trails most developed countries. Factank: News in
the Numbers. Retrieved September 20, 2016, from Pew Research Center:
http://www.pewresearch.org/fact-tank/2016/08/02/u-s-voter-turnout-trails-most-developed-
countries/
Dowding, K. (2005). Is it rational to vote? Five types of answer and a suggestion. British Journal of
Politics and International Relations, 7(3), 442-459.
Ferrini, L. (2012, September 27). Why is Turnout at Elections Declining Across the Democratic
World? E-International Relations Students. Retrieved September 20, 2016, from http://www.e-
ir.info/2012/09/27/why-is-turnout-at-elections-declining-across-the-democratic-world/
Grofman, B. (1993). Is turnout the paradox that ate rational choice theory? In B. Grofman (Ed.),
Information, participation and choice. Ann Arbor: The University of Michigan Press.
Hasham, N. (2016, August 8). Election 2016: Voter turnout lowest since compulsory voting began in
1925. The Sydney Morning Herald. Retrieved August 11, 2016, from
http://www.smh.com.au/federal-politics/political-news/election-2016-voter-turnout-lowest-
since-compulsory-voting-began-in-1925-20160808-gqnij2.html
Joint Standing Committee on Electoral Matters. (2011). Report on the conduct of the 2010 Federal
Election and matters related thereto. Canberra: Commonwealth of Australia. Retrieved
Page 28 Voter turnout – 2016 House of Representatives and Senate elections
October 28, 2016, from
http://www.aph.gov.au/Parliamentary_Business/Committees/House_of_Representatives_Co
mmittees?url=em/elect10/report.htm
Kaplan, M. (2016, January 29). Iowa Caucus Snowstorm? Winter Weather Raises Voter Turnout
Fears for Trump and Sanders. International Business Times. Retrieved August 15, 2016, from
http://www.ibtimes.com/iowa-caucus-snowstorm-winter-weather-raises-voter-turnout-fears-
trump-sanders-2287052
Lam, L. (2015, October 28). Voter Turnout: the Undemocratic Nature of Democracy. Prospect:
Journal of International Affairs at UCSD. Retrieved September 20, 2016, from
https://prospectjournal.org/2015/10/28/voter-turnout-the-undemocratic-nature-of-democracy/
Leberfinger, M. (2016, February 1). Iowa caucuses 2016: Advancing snow may deter voters.
AccuWeather. Retrieved August 15, 2016, from http://www.accuweather.com/en/weather-
news/election-2016-iowa-caucus-snow-central-northern-plains-monday-night/55036213
Mather, J. (2016, July 5). Federal election 2016: Could winter be to blame? Australian Financial
Review. Retrieved August 11, 2016, from http://www.afr.com/news/politics/election/federal-
election-2016-could-winter-be-to-blame-20160705-gpyz01
McAllister, I., & Cameron, S. M. (2016). Trends in Australian political opinion: results from the
Australian election study, 1987-2016. Canberra: Australian National University. Retrieved
December 20, 2016, from https://australianelectionstudy.org/
McIlroy, T. (2016, May 31). Federal election 2016: Experts predict up to one third of voters will go to
the polls early. The Sydney Morning Herald. Retrieved August 18, 2016, from
http://www.smh.com.au/federal-politics/federal-election-2016/federal-election-2016-experts-
predict-up-to-one-third-of-voters-will-go-to-polls-early-20160529-gp6w42.html
Rolfe, M. (2012). Voter turnout: a social theory of political participation. Cambridge: Cambridge
University Press.
Sloan, A., & Lester, K. (2016, May 16). Election 2016: School holidays clash may cause a sausage
sizzle fizzle. ABC News. Retrieved August 18, 2016, from http://www.abc.net.au/news/2016-
05-16/school-holidays-election-day-clash-sausage-sizzle-fizzle/7417104
Wallis Market and Social Research. (2016). Voter Survey Report. Melbourne: Wallis Consulting
Group.
Page 29 Voter turnout – 2016 House of Representatives and Senate elections
End notes
1 Turnout for the House of Representatives excludes enrolments for uncontested elections. When analysing trends in voter turnout, it is important to consider changes to the electoral franchise and voting requirements. Key changes since 1901 have included:
■ The 1901 elections were conducted under the electoral systems of the various states. In New South Wales, Victoria, Queensland and Tasmania, men over 21 years were allowed to vote. In South Australia and Western Australia men and women over 21 years were allowed to vote. Enrolment and voting were both voluntary.
■ Compulsory enrolment for federal elections was introduced in 1912. ■ Compulsory voting at federal elections was introduced in 1924, and was first used at the 1925 federal
election. ■ In 1962 the franchise was extended to all Indigenous Australians, however enrolment was voluntary
(voting was compulsory for those who were enrolled). ■ In 1973 the qualifying age for enrolment, voting and candidature for all federal elections was lowered
from 21 years to 18 years. ■ In 1984 the franchise qualification changed to Australian citizenship (British subjects on the roll
immediately before 26 January 1984 retained enrolment rights). Compulsory enrolment and voting was introduced for all Indigenous Australians.
2 During a recount of results from the 2013 Senate election for Western Australia, 1,370 ballot papers were found to be missing and the result of this election was subsequently declared void. A new election was held on 5 April 2014. However, as comparisons using the 2014 Senate results may be potentially misleading (due to the unusual nature of this election), Senate turnout figures for 2013 in this paper use the 2013 Senate election for Western Australia.
3 No preferences recorded although other marks may be present.
4 Includes ‘Totally blank’ (20.9%) and ‘Scribbles, slogans and other protest vote marks’ (14.5%).
5 The division of Durack was formed as part of the 2008 electoral redistribution of Western Australia. It replaced parts of the division of Kalgoorlie (which was abolished as part of the redistribution) and parts of the division of O’Connor. (Australian Electoral Commission, 2008)
6 One of the recommendations from the JSCEM inquiry into the 2007 federal election was that the AEC be permitted to directly update address details of electors already on the roll based on third party data. In its review of the 2010 federal election, JSCEM recommended that the AEC be allowed to directly enrol or update eligible electors based on external agency data (Joint Standing Committee on Electoral Matters, 2011). On 21 June 2012, the Parliament passed two bills to adopt JSCEM's recommendations. These bills received Royal Assent on 24 July 2012.
■ The Electoral and Referendum Amendment (Maintaining Address) Act 2011 amends the Commonwealth Electoral Act 1918 to allow the AEC to update an elector's enrolled address based on approved data sources from an external agency.
■ The Electoral and Referendum Amendment (Protecting Elector Participation) Act 2012 amends the Commonwealth Electoral Act 1918 and Referendum (Machinery Provisions) Act 1984 to allow the Electoral Commissioner to directly enrol eligible Australians.
7 Professor Ian McAllister from the Australian National University has stated that ‘Literature [shows] the time of year is influential but only in the context of a small plus or minus….It’s normally more influential on voluntary voting systems because the weather influences voter turnout.’ (Mather, 2016)
The potential impact of winter campaigns on voter turnout is also likely to be greater in countries where there are more extreme differences between the seasons than in Australia. For example, the extreme winter weather in Iowa in early 2016 raised fears regarding voter turnout at caucuses due to heavy snow, blizzard conditions and slippery roads. (Kaplan, 2016; Leberfinger, 2016)
Page 30 Voter turnout – 2016 House of Representatives and Senate elections
8 The AEC’s 2016 Voter Survey found a statistically significant increase (up from 7 per cent in 2013 to 14 per cent in 2016) in persons indicating that they cast an early vote because they were travelling interstate. This might be expected during school holidays, however there was no significant increase in persons voting early because they were travelling within their state, or travelling overseas (as might also be expected during school holidays). It is difficult to determine how this relates to non-voters, as there were very few (17) respondents who indicated they did not cast a vote. Of these non-voters, two stated that they did not vote because they were travelling (Wallis Market and Social Research, 2016).
9 Age standardisation (a demographic technique used to compare populations with different age profiles) was used to test whether differences in age profiles were driving differences in turnout at the state and territory level. Age standardised turnout rates were produced using mark-off data. If age differences were a key driver, the turnout figures for each state and territory would converge after standardisation. This analysis found that while there was a clear relationship between age and turnout at the national level, age had relatively little impact on differences between state and territory turnout figures (less than 1 percentage point in all states and territories).
10 In order to test the possibility of a generational effect on turnout, apparent non-voter data by age was analysed going back to the 1996 federal election. While this did not provide a generation’s worth of data, it provided a longitudinal picture of turnout by birth cohort, with age groups compared across eight events (including the 1999 referendum). This analysis suggested the propensity to turn out to vote is related to the ages of electors, not their birth cohort.
11 These analyses use the Socio-Economic Indexes for Areas (SEIFA) Index of Relative Socio-economic Advantage and Disadvantage (IRSAD) from the 2011 Census of Population and Housing, adjusted to reflect 2016 electoral boundaries. Analyses using SEIFA indexes based on 2016 Census results cannot be conducted until these indexes are released in 2018.
Pearson product-movement correlation coefficients (denoted by r, with a value between –1 and +1) are used to measure the strength of the linear relationship between two variables. The square of the Pearson’s r (denoted by r2) measures the proportion of the total variation in one variable that is explained by variation in the other variable.
12 In the division of Macarthur, 89 per cent of the variation in non-turnout by polling place catchment area was explained by relative socio-economic advantage and disadvantage (r2=0.89). This compared with 85 per cent in the division of Chifley and 79 per cent in the division of Watson.
13 The introduction of FDEU essentially resulted in a break in series for turnout data. While 2013 and 2016 turnout rates are broadly compatible with previous elections, any reduction in the turnout rates attributable to FDEU is not a negative. More electors vote with FDEU than without it. It is just that the increase in the number of electors voting is not as great as the increase in enrolment.
14 Where a winning candidate receives less than 56 per cent of the vote, the seat is classified as ‘marginal’; 56–60 per cent is classified as ‘fairly safe’ and more than 60 per cent is considered ‘safe’.
15 Since 1993, the AES has asked respondents ‘And how much interest would you say you took in the election campaign overall?’. Response categories are ‘A good deal’, ‘Some’, ‘Not much’ and ‘None at all’. (McAllister & Cameron, 2016)
16 Australian National Political Attitudes Surveys conducted in 1969 and 1979 asked respondents ‘On the whole, how do you feel about the state of government and politics in Australia. Would you say that you were very satisfied, fairly satisfied or not satisfied?’. 23.4 per cent of respondents in 1969 and 44.5 per cent in 1979 indicated they were not satisfied.
The 1996 AES asked respondents ‘On the whole, are you satisfied, fairly satisfied, not very satisfied or not at all satisfied with the way democracy works in Australia’.
Since 1998, the AES has asked ‘On the whole are you very satisfied, fairly satisfied, not very satisfied or not at all satisfied with the way democracy works in Australia?’. In the 2016 AES, 29.7 per cent of respondents were not very satisfied and 10.2 per cent were not at all satisfied. (McAllister & Cameron, 2016)
17 Since 2001, the AES has asked respondents ‘Some people say that no matter who people vote for, it won’t make any difference to what happens. Other say that who people vote for can make a big difference to what
Page 31 Voter turnout – 2016 House of Representatives and Senate elections
happens. Using the scale below, where would you place yourself?’ A five point scale is used, with 1 being ‘Who people vote for can make a big difference’ and 5 being ‘Who people won’t make any difference. At the 2016 AES, 10.1 per cent of respondents recorded a 4 and another 10.1 per cent recorded a 5. (McAllister & Cameron, 2016)
18 Since 1993, the AES has asked respondents ‘In general, do you feel that the people in government are all too interested in looking after themselves or do you feel that they can be trusted to do the right thing nearly all the time?’ Response categories are ‘Usually look after themselves’, ‘Sometimes look after themselves’, ‘Sometimes can be trusted to do the right thing’ and ‘Usually can be trusted to do the right thing’. (McAllister & Cameron, 2016)