debris flow impact assessment along the al-raith road, kingdom of
TRANSCRIPT

Full Terms & Conditions of access and use can be found athttp://www.tandfonline.com/action/journalInformation?journalCode=tgnh20
Download by: [203.128.244.130] Date: 15 March 2016, At: 00:43
Geomatics, Natural Hazards and Risk
ISSN: 1947-5705 (Print) 1947-5713 (Online) Journal homepage: http://www.tandfonline.com/loi/tgnh20
Debris flow impact assessment along the Al-RaithRoad, Kingdom of Saudi Arabia, using remotesensing data and field investigations
Ahmed M. Youssef, Mohamed Al-kathery, Biswajeet Pradhan & Turki El-sahly
To cite this article: Ahmed M. Youssef, Mohamed Al-kathery, Biswajeet Pradhan & Turki El-sahly (2016) Debris flow impact assessment along the Al-Raith Road, Kingdom of Saudi Arabia,using remote sensing data and field investigations, Geomatics, Natural Hazards and Risk, 7:2,620-638, DOI: 10.1080/19475705.2014.933130
To link to this article: http://dx.doi.org/10.1080/19475705.2014.933130
© 2014 Taylor & Francis Published online: 01 Jul 2014.
Submit your article to this journal Article views: 137
View related articles View Crossmark data
Citing articles: 1 View citing articles

Debris flow impact assessment along the Al-Raith Road, Kingdomof Saudi Arabia, using remote sensing data and field investigations
AHMEDM. YOUSSEFyz, MOHAMED AL-KATHERYz,BISWAJEET PRADHAN x* and TURKI EL-SAHLYz
yGeology Department, Faculty of Science, Sohag University, Sohag 82524, Egypt
zGeological Hazards Department, Applied Geology Sector, Saudi Geological Survey,
Jeddah 21514, Kingdom of Saudi Arabia
xDepartment of Civil Engineering, Faculty of Engineering, Geospatial Information
Science Research Center (GISRC), University Putra Malaysia (UPM), Serdang 43400,
Malaysia
(Received 27 January 2014; accepted 6 June 2014)
Jizan mountainous areas in Kingdom of Saudi Arabia are suffering from a variety
of slope failures. Most of these failures happen due to heavy rainfalls from time to
time. These landslides include rock topples, rockslides, debris flow, and some
combination of these which affected many roads, highways, and buildings. The
Al-Raith Road is one of these roads connecting Red Sea coast cities with Asir and
Al-Hasher areas. The length of this road reaches about 45 km and it has been
exposed to landslides during each heavy rain storm. One of these events happened
in 24 August 2013, which caused huge debris flows that cut and damaged the
road. The current research aims to evaluate the debris flow assessment along this
highway using remote sensing data and field studies. According to the detailed
analysis of geological and geomorphological maps, as well as field investigation, it
is evident that the debris flow materials are mainly related to the different types of
landslides. These landslides included rock topples which are frequently observed
along the side walls of the channels (flexture which occur in foliated rocks and
block which occurs in massive rocks), rock sliding (planner failures) where many
rock joints and shear zones dip towards the channel, and rockfalls. Debris range
in their size from up to 2 m in diameter to fine materials less than 2 mm. These
materials can be easily moved with water causing a risk to vehicles, roads, and
housing in the area. Field study indicated that these debris channels especially at
the lower part have been reactivated several times in the past. Finally, suitable
solutions have been suggested to these critical sites to minimize and 6 or avoid the
debris flow hazards in the future.
1. Introduction
Western and southern regions of the Kingdom of Saudi Arabia are affected by vari-
ous natural disasters including earthquakes, flooding, earth fissures, and landslides
(Youssef, Maerz, et al. 2012; Youssef, Pradhan, et al. 2012; Youssef & Maerz 2013;
Youssef, Sabtan, et al. 2014). Landslides are the most catastrophic natural hazard all
over the world among the different types of geomorphological hazards (land
*Corresponding author. Email: [email protected]; [email protected]
� 2014 Taylor & Francis
Geomatics, Natural Hazards and Risk, 2016
Vol. 7, No. 2, 620�638, http://dx.doi.org/10.1080/19475705.2014.933130
Dow
nloa
ded
by [
203.
128.
244.
130]
at 0
0:43
15
Mar
ch 2
016

degradation processes) causing billions of dollars in damaging the infrastructuresand thousands of deaths each year (Aleotti & Chowdhury 1999). Landslides repre-
sent a type of mass movements that happened due to a variety and combination of
different processes including falls, topples, avalanches, slides, and flows (Shroder &
Bishop 1998; Regmi, Devkota, et al. 2014; Regmi, Yoshida, et al. 2013). Different
factors such as seismic activity, high groundwater pressures (after heavy rainfall),
geological factors, and human activities can trigger large rock 6 soil blocks or even
larger assemblages of rock to crash down on to the road surface below. The Califor-
nia Department of Transportation (CADOT) (McCauley et al. 1985; VanDine 1985;Church & Miles 1987; Guzzetti et al. 2008; Baum & Godt 2010; Iverson et al. 2011)
determined different factors that cause landslides. These factors include rainfall
intensity, freeze�thaw, fractured rock, wind, snowmelt, channel run-off, channel
profile, adverse planner fracture, burrowing animals, differential erosion, tree roots,
springs or seeps, wild animals, truck vibration, debris availability in streams, and soil
decomposition.
Swanston (1974) identified the composition of debris according to the texture and
found that debris is a mixture of sand, gravel, cobbles, and boulders with differentproportions of silt and clay, and sometimes it contains a significant amount of
organic materials such as logs and tree stumps. Debris flow occurs when masses of
poorly sorted sediment (different sizes) move downslopes due to the effect of water.
Many events identified as debris slides, debris torrents, debris floods, mud flows,
mudslides, mud spates, and lahars may be regarded as debris flow (Varnes 1978;
Johnson 1984; Pierson & Costa 1987; Youssef, Pradhan, et al. 2013). Many authors
studied the debris flows, their types, and mechanisms among them are Evans (1982),
O’Connor et al. (Forthcoming), Johnson (1984), Hungr et al. (2001), VanDine(1985), and Pierson (1986).
In addition, due to the high density and mobility of debris flows, they represent a
serious hazard, which impose serious problems for people, properties vehicles, and
infrastructure in mountainous regions. Different authors indicated the hazard impact
of the debris flows (e.g. Hungr et al. 1987; Prochaska et al. 2008). They indicated that
these problems are due to the indirect impact lower energy of coarse-grained and
fine-grained debris that can bury structures; and flood water that are forced from the
normal channel by debris deposits and have the potential to erode unprotected surfa-ces and cause flood damage.
Materials collected in the ravines, gullies, and streams are related to different types
of landslides along the sides of the networks. These slope failures can be classified
into one of the four categories depending on the geometrical and mechanical nature
of the discontinuities and the conditions of the rock masses which include circular,
planar, wedge, and toppling failures. In many areas, the discontinuities are oriented
in a way that contributes to create wedge, planar, or toppling failures. The dip 6 dipdirection measurements at any area can be measured to determine the rocksliding 6 toppling potentiality. Landslides such as rockfalls, rockslides, and rock top-
pling have been studied and described by many authors, e.g. Aydan & Kawamoto
(1992), Evans (1981), Farrokhnia et al. (2010), Goodman & Bray (1976), Ishida et al.
(1987), and Varnes (1978). Rock toppling usually develops in the slope of foliated
rock mass and can occur in cut slope in massive rock with regularly spaced joints,
which strike parallel to the slope and dip towards or away from the slope. Whereas,
planner and wedge failures can happen along structures such as shear zones, faults,
Geomatics, Natural Hazards and Risk 621
Dow
nloa
ded
by [
203.
128.
244.
130]
at 0
0:43
15
Mar
ch 2
016

and 6 or discontinuities that dip towards the highways. They can be analysed usinglimiting equilibrium analysis (Watts 2003). Other types of landslides are called rock
failure as ravelling mechanism cannot be analysed using limiting equilibrium analysis
Piteau (1979). This type of landslide is caused by many factors including adverse
groundwater, excavation methods (poor blasting practices during original construc-
tion or reconstruction), climatic conditions, weathering, and tree levering (Brawner
1994). Franklin and Senior (1997) analysed 415 rock-slope failures along highways
in Northern Ontario. They found that 33% of those failures involved toppling or pla-
nar blocks and wedges. While 67% of the rockslide incidents were identified to beinvolved in these complex mechanisms.
Debris flow mitigation structures may be required to minimize their risks which
have been applied in many research areas such as DeNatale et al. (1997), Frenez
et al. (2004), Rickenmann (1999), and Rimbock and Strobl (2002).
Few landslide hazard studies were carried out in the Kingdom of Saudi Arabia
along the road and highway sections. With the help of remote sensing and GIS tech-
niques, landslide studies such as susceptibility mapping become more easier and effi-
cient (Youssef et al. 2009; Pradhan et al. 2011; Akgun et al. 2012; Althuwaynee et al.2012; Tien Bui et al. 2012; Pourghasemi et al. 2012). This paper intends to describe
the debris flows that caused a serious hazard along the Al-Raith Road from time to
time. This research aims to determine various types of landslides occurring along the
sides of each debris channel and causing accumulation of debris later moved with
water; to recognize the structurally controlled landslides types and non-structural
types; detailed geomorphologic characteristics of the different types of landslides;
and the rock types that are most affected by landslides and forming the debris along
the channels. In addition, it is aimed to detect the impact of the anthropogenic activi-ties on the formation of the debris.
2. Study area and problem evaluation
2.1. Study area
Al-Raith Road section is one of the most landslide-affected roads and highways in
Jizan Region. The road section is about 46 km long, and it passes through areas thatare prone to debris flows. It is located in Al-Raith Governorate of the Jizan Region,
southwest of the Kingdom of Saudi Arabia (figure 1). It connects the Red Sea coastal
plain with Al-Hasher and Asir areas. It represents an important road, as it offers pri-
vate vehicles and light-duty trucks convenient access between these cities. The study
area is located at latitude between 17�3508.800 N and 17�3601.700 N, and a longitude
between 42�5203700 E and 42�5302900 E. Debris flows are the most common landslides
along the Al-Raith Road and they possess very high damaging effect. Many of the
debris flow channels crossing the road were not remediated effectively. They areobserved in relating to rock mass failures (natural phenomena) and man-made (due
to dumping materials in old channels) due to excavated slopes. Consequently, the
road is commonly closed from time to time due to landslides (debris flows).
Geologically, the study area represents part of the Wadi Baysh quadrangle (GM-
77c) that covers 17,550 km2 in the Asir and Tihamah provinces (Fairer 1985). It is
composed of the Baish group that consists of volcanic and volcaniclastic rocks
formed during the development of the Arabian ensimatic island arc (greenstone,
622 A.M. Youssef et al.
Dow
nloa
ded
by [
203.
128.
244.
130]
at 0
0:43
15
Mar
ch 2
016

metabasalt and minor metagraywacke, metachert, and marble) (figure 2). Later they
were intruded by mafic plutonic rocks that range in age from about 1000 to 760 Ma
(Fairer 1985).Extreme rainfall events were reported within the historical records according to the
data of rain gauge (SA145) that located about 9 km west of the study area. This rain
gauge is operated by the Ministry of Water and Electricity in the form of daily data.
The data in the rain gauge cover a time span from 1966 to 2013. The maximum daily
precipitation in a day noticed as amount of 99 mm on 8 December 1972, 99 mm on
13 January 1973, and 93 mm on 9 March 1999. In addition, the average annual pre-
cipitation is reported as about 290.4 mm 6 year, while the maximum sum of rainfall
value of 1441.9 mm in year 1972 and a minimum rainfall sum of 8 mm reported in1966. The seasonal average precipitation for the whole period is reported as about
290.4 mm in autumn and about 52.7 mm in summer.
2.2. Problem evaluation
Al-Raith Road encounters debris flow from time to time after rainfall storm event.
One of these debris flow events happened during the day of 24 August 2013 due to a
heavy rainfall that occurred for few hours along the Al-Raith area. The rainfall
caused huge amounts of debris to be flowed along different locations in the road sec-
tion causing serious hazard to the area (figure 3). This debris covered the entire road
section and led to close in both directions for few days. These debris were related to
two sources: one is related to the debris that accumulate inside the channels (natural
Figure 1. Location of the study area in the KSA map: (a) Kingdom of Saudi Arabia;(b) along Al-Raith Road; and (c) road section affected by debris flow problem.
Geomatics, Natural Hazards and Risk 623
Dow
nloa
ded
by [
203.
128.
244.
130]
at 0
0:43
15
Mar
ch 2
016

Figure 2. Geological map of the study area.
Figure 3. Panorama view showing Al-Raith landslide (debris flow). Several scarps at theupper part, thick debris in the channels, and serious road damage at the lower part of thelandslide can be seen in the image.
624 A.M. Youssef et al.
Dow
nloa
ded
by [
203.
128.
244.
130]
at 0
0:43
15
Mar
ch 2
016

materials) and the other source is according to anthropogenic activities (dumping
materials) that are related to road widening and modification. Figure 4 shows differ-
ent photos taken at the time of the debris flow occurrence along this section of the
road showing different features in the study area. It is also obvious from field studies
that the road and houses nearby are in critical hazard due to the debris that come
from these channels from time to time. In addition, several gabion walls are seen atthe mouth of the channels to control the debris; however, they are destroyed and the
debris come over them (figure 4). After getting these preliminary views of the land-
slide, further study was carried out at outcrop scale.
Figure 4. Photos taken at the time of debris flow that cut and accumulated above the road,where some of the road sections have been damaged.
Geomatics, Natural Hazards and Risk 625
Dow
nloa
ded
by [
203.
128.
244.
130]
at 0
0:43
15
Mar
ch 2
016
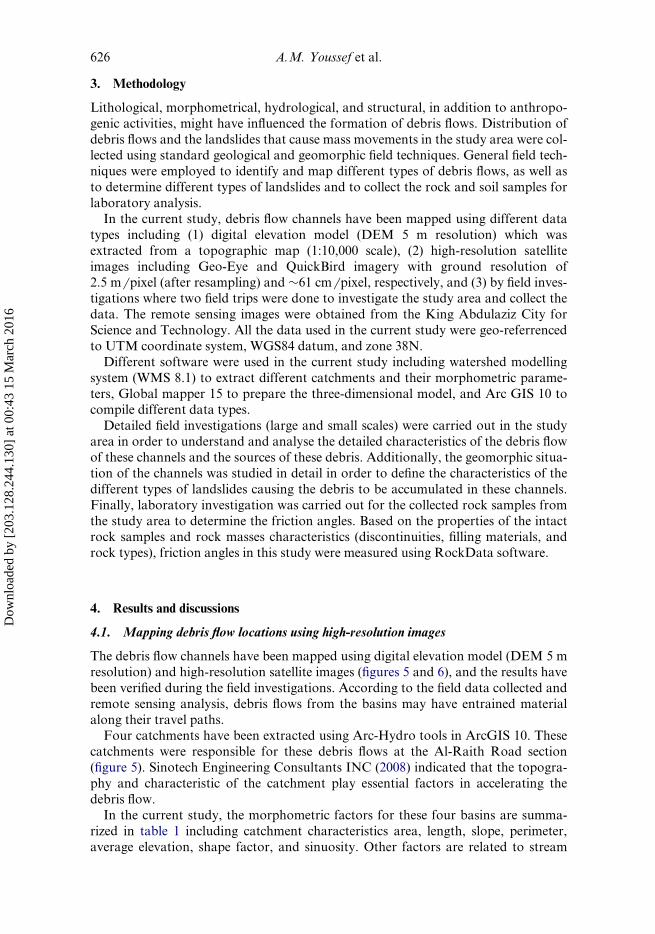
3. Methodology
Lithological, morphometrical, hydrological, and structural, in addition to anthropo-
genic activities, might have influenced the formation of debris flows. Distribution of
debris flows and the landslides that cause mass movements in the study area were col-lected using standard geological and geomorphic field techniques. General field tech-
niques were employed to identify and map different types of debris flows, as well as
to determine different types of landslides and to collect the rock and soil samples for
laboratory analysis.
In the current study, debris flow channels have been mapped using different data
types including (1) digital elevation model (DEM 5 m resolution) which was
extracted from a topographic map (1:10,000 scale), (2) high-resolution satellite
images including Geo-Eye and QuickBird imagery with ground resolution of2.5 m6 pixel (after resampling) and »61 cm 6 pixel, respectively, and (3) by field inves-
tigations where two field trips were done to investigate the study area and collect the
data. The remote sensing images were obtained from the King Abdulaziz City for
Science and Technology. All the data used in the current study were geo-referrenced
to UTM coordinate system, WGS84 datum, and zone 38N.
Different software were used in the current study including watershed modelling
system (WMS 8.1) to extract different catchments and their morphometric parame-
ters, Global mapper 15 to prepare the three-dimensional model, and Arc GIS 10 tocompile different data types.
Detailed field investigations (large and small scales) were carried out in the study
area in order to understand and analyse the detailed characteristics of the debris flow
of these channels and the sources of these debris. Additionally, the geomorphic situa-
tion of the channels was studied in detail in order to define the characteristics of the
different types of landslides causing the debris to be accumulated in these channels.
Finally, laboratory investigation was carried out for the collected rock samples from
the study area to determine the friction angles. Based on the properties of the intactrock samples and rock masses characteristics (discontinuities, filling materials, and
rock types), friction angles in this study were measured using RockData software.
4. Results and discussions
4.1. Mapping debris flow locations using high-resolution images
The debris flow channels have been mapped using digital elevation model (DEM 5 m
resolution) and high-resolution satellite images (figures 5 and 6), and the results have
been verified during the field investigations. According to the field data collected and
remote sensing analysis, debris flows from the basins may have entrained material
along their travel paths.Four catchments have been extracted using Arc-Hydro tools in ArcGIS 10. These
catchments were responsible for these debris flows at the Al-Raith Road section
(figure 5). Sinotech Engineering Consultants INC (2008) indicated that the topogra-
phy and characteristic of the catchment play essential factors in accelerating the
debris flow.
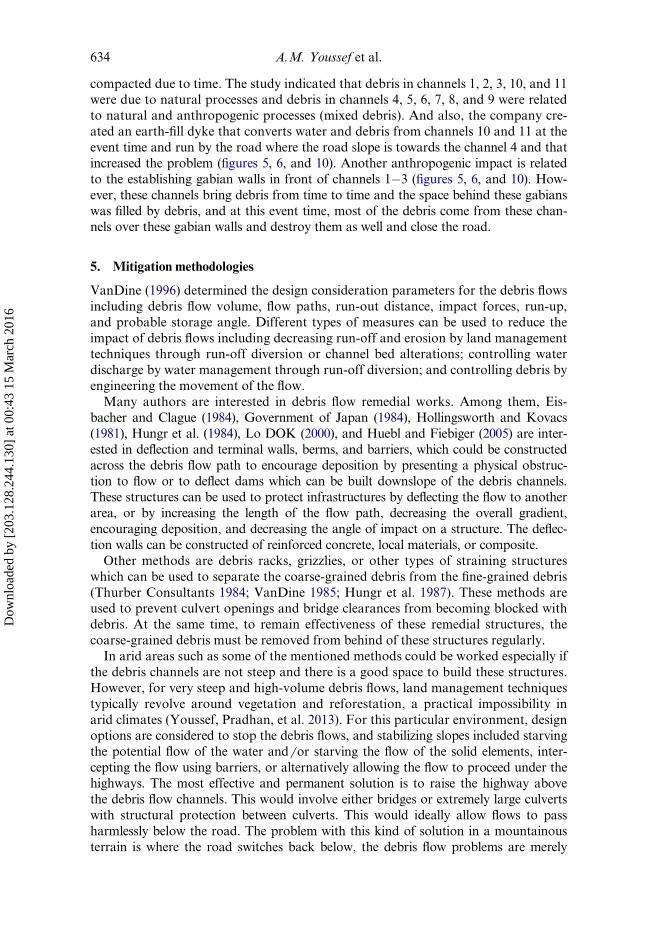
In the current study, the morphometric factors for these four basins are summa-
rized in table 1 including catchment characteristics area, length, slope, perimeter,
average elevation, shape factor, and sinuosity. Other factors are related to stream
626 A.M. Youssef et al.
Dow
nloa
ded
by [
203.
128.
244.
130]
at 0
0:43
15
Mar
ch 2
016

characteristics which include main flow length and slope, main stream length and
slope, and centroid out distance and slope. Other important factors including profileshape and availability of the debris were determined. It was found that parameters
that are related to catchment characteristics, channel characteristics, and debris
availability inside these channels have essential impacts on the formation of debris
flow in the study area. The catchment slope ranges from 0.735 m 6 m for catchment 1
to 0.873 m 6 m for catchment 3, main stream distance slope ranges from 0.4306 m 6 mfor catchment 2 to 0.544 m 6 m for catchment 3 (table 1). The study indicates that the
basin slope and the main stream distance slope are very high by representing the
most important factor to increase the water velocity. According to the Manningequation, the velocity of the water was calculated as follows:
V ¼ R2=3£S1=2
n(1)
where V D bottom slope of channel (m 6 s), R D hydraulic radius D A 6 P (m),
S D bottom slope of channel (m 6 m), n D Manning roughness coefficient (empirical
constant), A D cross-sectional area of flow perpendicular to the flow direction (m2),
and P D wetted perimeter of cross-sectional flow area (m).
According to the field survey and remote sensing analysis of the images, the aver-
age width of each channel was calculated and the average erosion height was found
Figure 5. Eleven debris channels, four basins, and drainage networks have been determinedand mapped in the study area.
Geomatics, Natural Hazards and Risk 627
Dow
nloa
ded
by [
203.
128.
244.
130]
at 0
0:43
15
Mar
ch 2
016
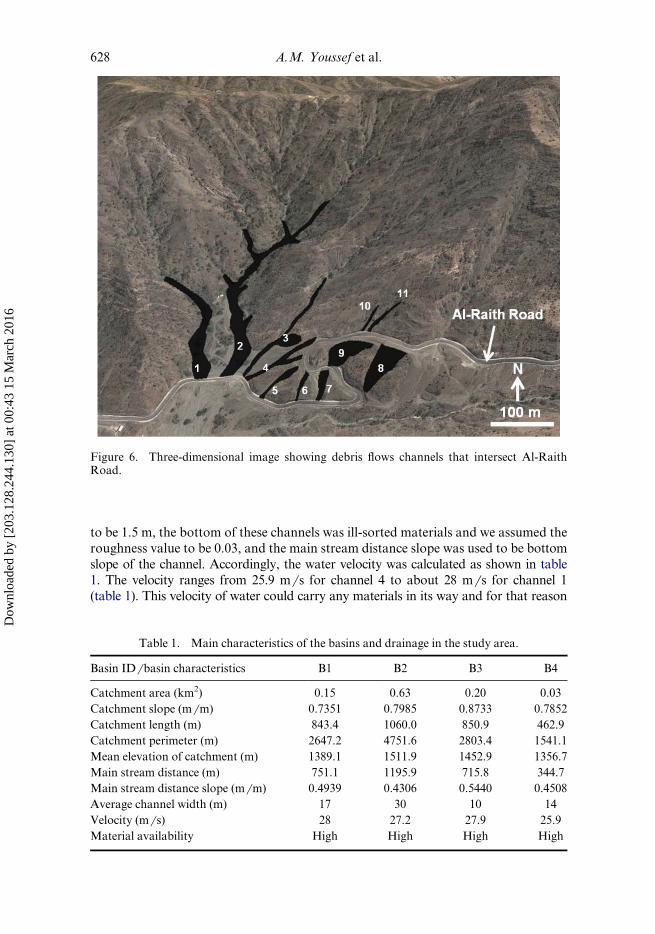
to be 1.5 m, the bottom of these channels was ill-sorted materials and we assumed the
roughness value to be 0.03, and the main stream distance slope was used to be bottom
slope of the channel. Accordingly, the water velocity was calculated as shown in table
1. The velocity ranges from 25.9 m6 s for channel 4 to about 28 m6 s for channel 1
(table 1). This velocity of water could carry any materials in its way and for that reason
Table 1. Main characteristics of the basins and drainage in the study area.
Basin ID 6 basin characteristics B1 B2 B3 B4
Catchment area (km2) 0.15 0.63 0.20 0.03
Catchment slope (m 6 m) 0.7351 0.7985 0.8733 0.7852
Catchment length (m) 843.4 1060.0 850.9 462.9
Catchment perimeter (m) 2647.2 4751.6 2803.4 1541.1
Mean elevation of catchment (m) 1389.1 1511.9 1452.9 1356.7
Main stream distance (m) 751.1 1195.9 715.8 344.7
Main stream distance slope (m 6 m) 0.4939 0.4306 0.5440 0.4508
Average channel width (m) 17 30 10 14
Velocity (m 6 s) 28 27.2 27.9 25.9
Material availability High High High High
Figure 6. Three-dimensional image showing debris flows channels that intersect Al-RaithRoad.
628 A.M. Youssef et al.
Dow
nloa
ded
by [
203.
128.
244.
130]
at 0
0:43
15
Mar
ch 2
016

the availability of debris along the channels is a very important factor. The study indi-cated that the larger the basin area, basin slope, and main stream distance slope, the
larger the water that can carry debris, and cause a serious problem to the
infrastructure.
4.2. General characteristics of the debris flow materials
This area of landslide is one of the active landslides (debris flow) along this highway
(figure 6). The rock debris accumulated in the channels that were generated by differ-
ent types of landslide mobilized into a disastrous debris flow in many events and cre-
ating many problems. This landslide happened in August 2013 and it was a huge one
about few hundred metres length and width. It came from different channels asshown in figures 5 and 6. These channels were filled by deposits which some were due
to natural processes due to the combination of rock toppling, sliding, ravelling, as
well as colluvium materials, and others were due to the anthropogenic effects by
dumping crashed rock materials that came from rock cuts along the roads. The depth
of the debris ranges from 3 to 20 m. The landslide is located in the rock formations
belonging to Baish group in which the rock units include greenstone, tholeiitic meta-
basalt (local pillow structures), and minor metagraywacke, metachert, and marble
(Fairer 1985).Field study indicated that most of the lower and central parts of the channels are
covered by thick debris. The thickness of these debris ranges from 3 to 20 m, and
they consist of different materials ranging in size from boulders up to 2 m to fine
materials (size less than 2 mm) (figures 7(a)�(d)). Some of the materials that accumu-
late inside the channels and along their sides are related to landslides processes and
these are characterized by ill-sorted materials and include large blocks that reach
sometimes to 2 m in diameter with irregular shape (figures 7(a)�(d)). Some of these
debris are coming from the colluviums that accumulate at the top of the mountains(forming a soil layer) due to weathering, trees, and erosional processes along these
soil materials. There are discrete trees along the valley wall where they are grown
along the fractured that filled with soil materials. Field study indicated that the
weathering degree of the rocks along the sides of the channels ranges from highly
weathered especially for the upper parts to slightly moderately weathered rocks for
lower part rocks; however, fresh rocks are encountered for dykes. Furthermore,
degree of fracturing ranges from highly fractured rocks as in foliated meta-
volcanics to low fracturing in the rocks range from highly fractured rocks and foli-ated especially in meta-volcanics and greenstones and close to the major structures
to less fractured rocks especially for marble and massive rocks.
Figures 7(a), (e), and (f) represent other debris that related to anthropogenic work
but these materials are characterized by their grey colour and its sizes range from few
30 cm to less than 2 cm with few boulders. These materials accumulate along the
sides of the channels and some of them are compactor.
4.3. Large- and small-scale investigation of one of the channels
4.3.1. Large-scale investigation. Detailed field investigation for one of the channels
(channel of basin 3) has been carried out in order to understand different processes
that cause debris to accumulate and prepare the different sources of the debris that
Geomatics, Natural Hazards and Risk 629
Dow
nloa
ded
by [
203.
128.
244.
130]
at 0
0:43
15
Mar
ch 2
016

accumulate in the different channels (figure 8). It was found that the debris accumu-
lated in the gullies and channels are due to a combination of different landslides
including rock topples, rockslides, ravelling (rockfalls), small debris slides, and
anthropogenic work (figure 9). It was found that the rock exposure exists along the
sides of the channels as we move towards the upstream part where as at the down-
stream part there are thick debris that are located along the channel base and sides.
Rockslides are observed in the valley walls at the central and upstream parts of the
Figure 7. (a) Large boulders up to 0.5 m deposited in the bottom of debris channel (note thatalong the left side of the debris channel are dumping materials and along the right side are col-luvium materials); (b) colluviums (ill-sorted) along the channel side slopes; (c) debris channelscut through old debris coherent materials; (d) debris channel with different material sizes alongsteep gully; (e) dumping materials in the channels were eroded and flown due to running wateralong the channel; (f) dumping materials accumulated in the channels (notice the height of thedimming materials more than 10 m).
630 A.M. Youssef et al.
Dow
nloa
ded
by [
203.
128.
244.
130]
at 0
0:43
15
Mar
ch 2
016

channel (figure 8). Also, it is seen that the slope of the channel gradually increases
from 21.5� in the lower part to the maximum of 28� in the middle section and
increases towards the upper reaches of the channel (figure 9).
4.3.2. Small-scale investigation. Most slope failures can be classified into one of
the four categories depending on the geometrical and mechanical nature of the dis-
continuities and the conditions of the rock masses which includes circular, planar,
wedge, and toppling failures. In many areas, the discontinuities are oriented in such
a way that they contribute to create wedge, planar, or toppling failures. The dip 6 dip
Figure 8. (a) Photographs showing plane failure dips towards the channel and some fallenblocks are located underneath these planes; (b) different types of toppling (flexture and blocktoppling); and (c) falling blocks in debris channels due to ravelling and trees’ effect.
Geomatics, Natural Hazards and Risk 631
Dow
nloa
ded
by [
203.
128.
244.
130]
at 0
0:43
15
Mar
ch 2
016

direction and friction angle measurements at all rock stations were plotted on stereo-
nets using ROCKPACK III (Watts 2003) and DIPs 5.1 software. Rock-slope stabil-
ity analysis utilizing the Markland Test Plot method was applied to determine the
potentiality for planar and toppling failures along the identified discontinuities in thestudy area.
4.3.2.1. Rock sliding. Different rocks have planar failures in which the planes have
dip direction towards the channel. The dip 6 dip direction values of the main joint
sets for both sides of the rock slopes from the channel were calculated and was found
as follows: (1) for the right side it was found that there are two main joint sets with a
dip6 dip direction of 38� 6 359� and 06� 6 353� (figures 9(a) and (b)); and (2) for the leftside there is only one main set of joints with a dip6 dip direction of 38� 6 175�(figures 9(a) and (c)). The joint vertical spacing is about 30 and 50 cm for the right
and left sides of the channel, respectively, and sometimes reaches 1 m for massive
rocks figure 8(a). The friction angle of the right-side samples ranges from 33� to 39�
with an average value of 36�, whereas the friction angle of the samples collected from
the left side ranges from 35� to 45� with an average value of 40�. To be more conserva-
tive, the lowest value of the friction angle for each side was used to test the planner
failure for both sides. Markland Test Plots for both sides showed that there is a
Figure 9. (a) An example of different types of landslides and materials on both sides of thedebris channel (PD planner failure; RD rockfalls by ravelling; TD toppling failure; CD collu-viums covering the mountain; and D D dumping materials by contractors working on theroads). (b) and (c) Markland stereonet test for the right side and left side, respectively.
632 A.M. Youssef et al.
Dow
nloa
ded
by [
203.
128.
244.
130]
at 0
0:43
15
Mar
ch 2
016

potential for planar failure as shown in Figures 9(b) and (c). Figure 8(a) shows one ofthese examples where clear surfaces appear after sliding.
4.3.2.2. Rock toppling. This type is located at the foliated rocks and meta-vol-
canics at the central and lower reaches of the channel (figure 9). Rock topples are
observed in most of the rock exposure especially along the outer part of rock out
crops. Figure 6(b) is the section of the lower part of the channel with a width of40 m. The lower part covered partially with debris in the middle and from both sides
there was a large thickness. The debris is the product of the landslides along the wadi
walls. There are two main types of the rock topple that were observed and detected
in the study area (figure 8(b)).
4.3.2.3. Rockfalls (rock ravelling). In most of the rock cuts, rockfalls are not sim-ple blocks and wedges, and are more difficult to analyse. In the current study, the
“Modified Colorado Rockfall Rating System” was applied for the study area
(Russell et al. 2008). The system indicated that many areas along both sides of the
channel fall from time to time and these sides are unstable (figure 8(c)). Rockfalls
(ravelling) in the study area happened in both crystalline rocks and colluvial sedi-
ments (boulders with fines at the top of the mountains) due to overhanging, under-
cutting, erosions, and the impact of trees as shown in figure 8(c).
4.4. Anthropogenic activities’ impact in accelerating the debris flow
Anthropogenic activities act as part of the causative factor of the problem. The
impact of the anthropogenic activities in this debris flow is obvious. Field investiga-
tion showed that a construction work has been done in widening the road, and inthis section, the road switches back for two times. The construction company used
these old debris channels to accumulate the materials that are related to widening the
road. These channels that have many dumping materials are shown in figure 10.
Some of these materials are loose and ready to flow down with rain and others are
Figure 10. The location of the debris channels influenced by natural and anthropogenicprocesses.
Geomatics, Natural Hazards and Risk 633
Dow
nloa
ded
by [
203.
128.
244.
130]
at 0
0:43
15
Mar
ch 2
016
compacted due to time. The study indicated that debris in channels 1, 2, 3, 10, and 11were due to natural processes and debris in channels 4, 5, 6, 7, 8, and 9 were related
to natural and anthropogenic processes (mixed debris). And also, the company cre-
ated an earth-fill dyke that converts water and debris from channels 10 and 11 at the
event time and run by the road where the road slope is towards the channel 4 and that
increased the problem (figures 5, 6, and 10). Another anthropogenic impact is related
to the establishing gabian walls in front of channels 1�3 (figures 5, 6, and 10). How-
ever, these channels bring debris from time to time and the space behind these gabians
was filled by debris, and at this event time, most of the debris come from these chan-nels over these gabian walls and destroy them as well and close the road.
5. Mitigation methodologies
VanDine (1996) determined the design consideration parameters for the debris flows
including debris flow volume, flow paths, run-out distance, impact forces, run-up,
and probable storage angle. Different types of measures can be used to reduce the
impact of debris flows including decreasing run-off and erosion by land managementtechniques through run-off diversion or channel bed alterations; controlling water
discharge by water management through run-off diversion; and controlling debris by
engineering the movement of the flow.
Many authors are interested in debris flow remedial works. Among them, Eis-
bacher and Clague (1984), Government of Japan (1984), Hollingsworth and Kovacs
(1981), Hungr et al. (1984), Lo DOK (2000), and Huebl and Fiebiger (2005) are inter-
ested in deflection and terminal walls, berms, and barriers, which could be constructed
across the debris flow path to encourage deposition by presenting a physical obstruc-tion to flow or to deflect dams which can be built downslope of the debris channels.
These structures can be used to protect infrastructures by deflecting the flow to another
area, or by increasing the length of the flow path, decreasing the overall gradient,
encouraging deposition, and decreasing the angle of impact on a structure. The deflec-
tion walls can be constructed of reinforced concrete, local materials, or composite.
Other methods are debris racks, grizzlies, or other types of straining structures
which can be used to separate the coarse-grained debris from the fine-grained debris
(Thurber Consultants 1984; VanDine 1985; Hungr et al. 1987). These methods areused to prevent culvert openings and bridge clearances from becoming blocked with
debris. At the same time, to remain effectiveness of these remedial structures, the
coarse-grained debris must be removed from behind of these structures regularly.
In arid areas such as some of the mentioned methods could be worked especially if
the debris channels are not steep and there is a good space to build these structures.
However, for very steep and high-volume debris flows, land management techniques
typically revolve around vegetation and reforestation, a practical impossibility in
arid climates (Youssef, Pradhan, et al. 2013). For this particular environment, designoptions are considered to stop the debris flows, and stabilizing slopes included starving
the potential flow of the water and6 or starving the flow of the solid elements, inter-
cepting the flow using barriers, or alternatively allowing the flow to proceed under the
highways. The most effective and permanent solution is to raise the highway above
the debris flow channels. This would involve either bridges or extremely large culverts
with structural protection between culverts. This would ideally allow flows to pass
harmlessly below the road. The problem with this kind of solution in a mountainous
terrain is where the road switches back below, the debris flow problems are merely
634 A.M. Youssef et al.
Dow
nloa
ded
by [
203.
128.
244.
130]
at 0
0:43
15
Mar
ch 2
016

passed down the side of the mountain to the next road where they still leaves the high-way at risk for overtopping or damage from high-volume debris flow events.
Another method is by starving the potential debris flow of water which is normally
an effective solution. This would require interception and diversion of surface flow.
This method will never work in high-steep slopes with significant rainfall events,
because the water has many sources that have to go somewhere, and ultimately may
find its way back to the debris flow channel or into another channel where it can be
equally as destructive.
Intercepting the debris flows, using structural barriers as the flow approaches thehighway is a solution that was originally implemented here during highway construc-
tion. Freestanding retaining walls and gabions extending the height of the structure
have been used to protect the highway from debris flows. This is probably the most
cost-effective solution, but the design fell short on these steep slopes with high vol-
umes of debris flow resulting in overflow of the physical barriers.
For this study area, our recommended solutions are as follows:
(1) For channels 1�3, walls and berms can be good solutions especially as theycan be built from local materials, as well as for gabians located in front of
channels 1�3. It is recommended to increase the volume capacity of the bulk-
head-type barriers by implementing a method of removing the debris from
behind the barriers. Therefore, that debris can be removed following flow
events, creating more catchment space for future flow events, and removing
the materials behind these barriers.
(2) For moderately sloped areas, diversion of water could be a good solution as
for channels 10 and 11 especially along the road section.(3) It is recommended to clean all debris from the high-steep debris channels such
as channels 4�9.
(4) Increase and develop a proactive maintenance programme and incur an indefi-
nite maintenance liability.
The use of techniques to block debris emanating above the highway will also serve
to starve the debris flow channels below the highway from mobilizing and affecting
the switch back below.
6. Conclusions
Heavy rainfalls in Al-Raith area caused different debris to flow downward and block
the road in different locations. There are two types of debris that have been recog-
nized in the study area: one is related to natural processes (natural debris) and the
other one is related to anthropogenic activities that damp the products of the roadwidening along the old debris channels (mixed debris). Different factors affect the
mobilization of these different types of debris including intense rainfall, steepness of
the channels, area of watershed, and the presence of materials.
The current study indicated that no method has been used to stabilize the debris
along the different channels or to make suitable remedial work along the large catch-
ment areas. Furthermore, no any attempt has been done in order to establish any
drainage system to divert the water away from the channels that contain debris.
Detailed analysis has been done in the study area to determine the different sources of
Geomatics, Natural Hazards and Risk 635
Dow
nloa
ded
by [
203.
128.
244.
130]
at 0
0:43
15
Mar
ch 2
016

debris and to recognize the main influential factors that can cause debris flow. The find-ings of this research showed that the natural debris are formed due to different land-
slides along the sides of the channels including rock sliding, toppling, and ravelling, as
well as related to fall of the colluviums that located at the top of the mountain slopes.
Finally, suitable mitigation techniques have been suggested to minimize and6 or preventthe impact of these debris channels on the infrastructure in the study area.
ORCID
Biswajeet Pradhan http://orcid.org/0000-0001-9863-2054
References
Akgun A, Sezer EA, Nefeslioglu HA, Gokceoglu C, Pradhan B. 2012. An easy-to-use
MATLAB program (MamLand) for the assessment of landslide susceptibility using a
Mamdani fuzzy algorithm. Comput Geosci. 38:23�34.
Aleotti P, Chowdhury R. 1999. Landslide hazard assessment: summary review and new per-
spectives. Bull Eng Geol Environ. 58:21�44.
Althuwaynee OF, Pradhan B, Lee S. 2012. Application of an evidential belief function model
in landslide susceptibility mapping. Comput Geosci. 44:120�135
Aydan O, Kawamoto T. 1992. Stability of slopes and underground openings against flexural
toppling and their stabilisation. Rock Mech Rock Eng. 25:143�165.
Baum RL, Godt JW. 2010. Early warning of rainfall- induced shallow landslides and debris
flows in the USA. Landslides. 7:259�272.
Brawner CO. 1994. Rockfall Hazard Mitigation Methods, Participant Workbook, NHI
Course No. 13219. Publication No. FHWA SA-93-085. Washington (DC): U.S.
Department of Transportation, Federal Highway Administration.
Church M, Miles M. 1987. Meteorological antecedents to debris flow in southwestern British
Columbia: some case histories. In: Costa JE, Wieczorek GF, editors. Debris flows 6avalanches: process, recognition and mitigation. Reviews in Engineering Geology.
Boulder (CO): Geological Society of America; p. 63�79.
DeNatale JS, Fiegel GL, Iverson RM, Major JJ, LaHusen RG, Duffy JD, Fisher GD. 1997.
Response of flexible wire rope barriers to debris-flow loading. Paper presented at: Pro-
ceedings of the First International Conference on Debris-Flow Hazards Mitigation;
San Francisco, CA.
Eisbacher GH, Clague JJ. 1984. Destructive mass movements in high mountains: hazard and
management, Geological Survey of Canada Paper 84-16. Ottawa: Geological Survey
of Canada.
Evans RS. 1981. An analysis of secondary toppling rock failures � the stress redistribution
method. J Eng Geol. 14:77�86.
Evans SG. 1982. Landslides and surficial deposits in urban areas of British Columbia: a
review. Can Geotech J. 19:269�288.
Fairer GM. 1985. Geologic map of the Wadi Baysh quadrangle, Kingdom of Saudi Arabia.
Ministry of Petroleum and Mineral Resources, Deputy Ministry for Mineral Resour-
ces. Sheet 17 F, GM-77, scale 1:250,000.
Farrokhnia A, Pirasteh S, Pradhan B, Pourkerman M, Arian M. 2010. A recent scenario of
mass wasting and its impact on the transportation in Alborz Mountains, Iran: contri-
bution from Geo information technology. Arab J Geosci. 4:1337�1349.
Franklin JA, Senior SA. 1997. Rockfall Hazards � strategies for detection, assessment, and
remediation. Paper presented at: Proceedings International Symposium on Engineer-
ing Geology and the Environment; Athens, Greece; p. 657�663.
636 A.M. Youssef et al.
Dow
nloa
ded
by [
203.
128.
244.
130]
at 0
0:43
15
Mar
ch 2
016

Frenez T, Roth A, Kaestli A. 2004. Debris flow mitigation by means of flexible barriers. Paper
presented at: Proceedings of the 10th Congress Interpraevent 2004; Trento, Italy.
Goodman RE, Bray JW. 1976. Toppling of rock slopes. In: Proceedings of a Specialty Confer-
ence on Rock Engineering for Foundation and Slope; August 15�18; Boulder (CO).
American Society of Civil Engineering, Vol. 2, p. 201�234.
Government of Japan. 1984. Basics of planning the measures against debris flows and planning
countermeasure facilities against debris flow. Kyoto (Japan): Mininstry of Construction;
p. 39.
Guzzetti F, Peruccacci S, Rossi M, Stark CP. 2008. The rainfall intensity duration control of
shallow landslides and debris flows: an update. Landslides. 5:3�17.
Hollingsworth R, Kovacs GS. 1981. Soil slumps and debris flows: prediction and protection.
Bull Assoc Eng Geol. 18:17�28.
Huebl J, Fiebiger G. 2005. Debris flow mitigation measures. In: Jakob M, Hungr O, editors.
Debris-flow hazards and related phenomena. Berlin: Springer; p. 445�488.
Hungr O, Evans SG, Bovis MJ, Hutchinson JN. 2001. A review of the classification of land-
slides in the flow type. Environ Eng Geosci. VII:221�228.
Hungr O, Morgan GC, Kellerhals R. 1984. Quantitative analysis of debris torrent hazards for
design of remedial measures. Can Geotech J. 21:663�677.
Hungr O, Morgan GC, VanDine DF, Lister DR. 1987. Debris flow defences in British Columbia.
In: Costa E, Wieczorek GF, editors. Debris flows6 avalanches: process, recognition and
mitigation. Reviews in Engineering Geology. Boulder (CO) Geological Society of America;
p. 201�222.
Ishida T, Chigira M, Hibino S. 1987. Application of the distinct element method for analysis of
toppling observed on a fissured slope. Rock Mech Rock Eng. 20:277�283.
Iverson RM, Reid ME, Logan M, LaHusen RG, Godt JW, Griswold JP. 2011. Positive feed-
back and momentum growth during debris-flow entrainment of wet bed sediment. Nat
Geosci. 4:116�121.
Johnson AM. 1984. Debris flow. In: Brunsden D, Prior DB, editors. Slope instability. New
York (NY): Wiley; p. 257�361.
Lo DOK. 2000. Review of natural terrain landslide debris-resisting barrier design. GEO
Report No. 104. Hong Kong: Civil Engineering Department, Geotechnical Engineer-
ing Office, The Government of Hong Kong Special Administrative Region.
McCauley ML, Works BW, Naramore SA. 1985. Rockfall mitigation. Report FHWA6 CA6 TL-856 12. FHWA, U.S. Department of Transportation.
O’Connor JE, Hardison JH, Costa JE. Forthcoming. Debris flows from moraine-dammed
lakes in the Three Sisters and Mt. Jefferson Wilderness areas, Oregon. Oregon: USGS
Water Supply Paper.
Pierson TC. 1986. Flow behavior of channelized debris flows, Mount St. Helens, Washington.
In: Abra-hams AD, editor. Hill slope processes. Winchester: Allen and Unwin;
p. 269�296.
Pierson TC, Costa JE. 1987. A rheologic classification of subaerial sediment-water flows. In:
Costa JE, Wieczorek GF, editors. Debris flows 6 avalanches: process, recognition and
mitigation. Reviews in Engineering Geology. Washington (DC): Geological Society of
America; p. 1�12.
Piteau DR. 1979. Engineering geology considerations and basic approach to rock slope stabil-
ity analysis for highways. Part A. Rock Slope Engineering Reference Manual: FHWA
Report � FHWA-TS-79-208. Washington (DC); p. 78.
Pourghasemi HR, Pradhan B, Gokceoglu C. 2012. Application of fuzzy logic and analytical
hierarchy process (AHP) to landslide susceptibility mapping at Haraz watershed. Iran
Nat Hazards. 63:965�996.
Pradhan B, Mansor S, Pirasteh S, Buchroithner M. 2011. Landslide hazard and risk analyses
at a landslide prone catchment area using statistical based geospatial model. Int J
Remote Sens. 32:4075�4087.
Geomatics, Natural Hazards and Risk 637
Dow
nloa
ded
by [
203.
128.
244.
130]
at 0
0:43
15
Mar
ch 2
016

Prochaska AB, Santi PM, Higgins JD, Cannon SH. 2008. A study of methods to estimate
debris flow velocity. Landslides. 5:431�444.
Regmi AD, Devkota KC, Yoshida K, Pradhan B, Pourgasemi HR, Kumamoto T, Akgun K.
2014. Application of frequency ratio, statistical index, and weights-of evidence models
and their comparison in landslide susceptibility mapping in Central Nepal Himalaya.
Arab J Geosci. 7:725�742.
Regmi AD, Yoshida K, Dhital MR, Devkota K. 2013. Effect of rock weathering, clay mineral-
ogy, and geological structures in the formation of large landslide, a case study from
Dumre Besei landslide, Lesser Himalaya Nepal. Landslides. 10:1�13.
Rickenmann D. 1999. Empirical relationships for debris flows. Nat Hazards. 19:47�77.
Rimbock A, Strobl T. 2002. Rope nets for woody debris entrapmentin torrents. Technical
Document. Rimb€ock: Technische Universitat Muchen.
Russell CP, Santi P, Humphrey JD. 2008. Modification and statistical analysis of the Colorado
Rockfall Hazard Rating System: Report No. CDOT-2008-7. Colorado; p. 139.
Shroder JF, Bishop MP. 1998. Mass movement in the Himalaya: new insights and research
directions. Geomorphology. 26:13�35.
Sinotech Engineering Consultants INC. 2008. [The investigation of vulnerability factors and
risk analysis, risk management of debris flows]. Report to the Soil and Water Conser-
vation Bureau. Council of Agriculture, Executive Yuan. Chinese.
Swanston DN. 1974. Slope stability problems associated with timber harvesting in mountainous
regions of the western United States. General Technical Report PNW-021. Portland
(OR): Forest Service, U.S. Department of Agriculture; p. 14.
Thurber Consultants Ltd. 1984. Debris Torrents: a review of mitigative measures. A report to
Ministry of Transportation and Highways, British Columbia. Saanich: Thurber Con-
sultants Limited.
Tien Bui D, Pradhan B, Lofman O, Revhaug I, Dick OB. 2012. Landslide susceptibility assess-
ment in the Hoa Binh province of Vietnam: a comparison of the Levenberg�Marquardt
and Bayesian regularized neural networks. Geomorphology. 171:12�29.
VanDine DF. 1985. Debris flows and debris torrents in the southern Canadian Cordillera. Can
Geotech J. 22:44�68.
VanDine DF. 1996. Debris flow control structures for forest engineering. Working Paper
08 6 1996. Victoria: Research Board, British Columbia Ministry of Forests.
Varnes DJ. 1978. Slope movement types and processes. In: Schuster RL, Krizek RJ, editors.
Landslides � analysis and control, transportation. Special Report 176. Washington
(DC): Transport Research Board, National Research Council; p. 11�33.
Watts CF. 2003. User’s Manual Rockpack III for Windows. Rock Slope Stability Computer-
ized Analysis Package, Part One - Stereonet Analyses. North Carolina: C.F. Watts &
Associates; p. 48.
Youssef AM, Maerz NH. 2013. Overview of some geological hazards in the Saudi Arabia.
Environ Earth Sci. 70:3115�3130.
Youssef AM, Maerz HN, Al-Otaibi AA. 2012. Stability of rock slopes along Raidah escarpment
road, Asir Area, Kingdom of Saudi Arabia. J Geogr Geol. doi:10.55396 jgg.v4n2p48Youssef AM, Maerz NH, Hassan AM. 2009. Remote sensing applications to geological prob-
lems in Egypt: case study, slope instability investigation, Sharm El-Sheikh 6 Ras-
Nasrani area, Southern Sinai. Landslides. 6:353�360.
Youssef AM, Pradhan B, Maerz NH. 2013. Debris flow impact assessment caused by 14 April
2012 rainfall along the Al-Hada Highway, Kingdom of Saudi Arabia using high-
resolution satellite imagery. Arab J Geosci. doi:10.10076 s12517-013-0935-0Youssef AM, Pradhan B, Sabtan AA, El-Harbi HM. 2012. Coupling of remote sensing data
aided with field investigations for geological hazards assessment in Jazan area, Kingdom
of Saudi Arabia. Environ Earth Sci. 65:119�130.
Youssef AM, Sabtan AA, Maerz NH, Zabramawi YA. 2014. Earth fissures in Wadi Najran,
Kingdom of Saudi Arabia. Nat. Hazards 71:2013�2027.
638 A.M. Youssef et al.
Dow
nloa
ded
by [
203.
128.
244.
130]
at 0
0:43
15
Mar
ch 2
016