dashboarding marketing channel roi and and making optimal channel spend decisions every week 2015...
TRANSCRIPT

Dashboarding Channel ROI
(…and making smart channel spend decisions
every week)
Etail West, Palm Springs, CAFebruary 19, 2015
2014 Budget Review
Wyndham divisions and family of brands
[email protected] @jon_isernhagen
World’s largest hotel company, based on
number of hotels
World’s largest lodging loyalty program,
based on participating hotels
Approximately 7,500 hotels and 646,900
rooms
More than 121 million room-nights sold in
2013
More than 9% of U.S. hotel room supply
World’s largest vacation ownership developer
and marketer
Approximately 185 vacation ownership
resorts with approx. 23,000 units throughout
North America, the Caribbean and South
Pacific
More than 900,000 owners of vacation
ownership interests
World’s largest vacation exchange network
World’s largest professionally managed
vacation rentals business
Approximately 107,000 properties in nearly
100 countries
More than 3.7 million exchange members
Send approximately 4 million consumers on
vacation through vacation rentals

2014 Budget Review
Top Worldwide Lodging Franchisors
[email protected] @jon_isernhagen
# of Rooms # of Hotels
InterContinental Hotels Group 675,982 4,602
Marriott International 660,394 3,800
Hilton Worldwide 652,957 3,966
Wyndham Hotel Group 627,437 7,342
Choice Hotels International 538,222 6,725
Accor SA 450,487 3,516
Starwood Hotels & Resorts Worldwide 335,415 1,134
Best Western International 312,467 4,050
Shanghai Jin Jiang International Hotels 214,796 1,401
Home Inns & Hotels Management 214,070 1,772
2014 Budget Review
Session description
Optimizing Campaign Measurement And Generating Dashboards To Share Your Data Insights:
1) Getting the right model for measurement
2) Measuring channels’ effectiveness at driving conversion and understanding their impact on one another
3) Getting the right mix of tools to enable consistent measurement
[email protected] @jon_isernhagen
2014 Budget Review
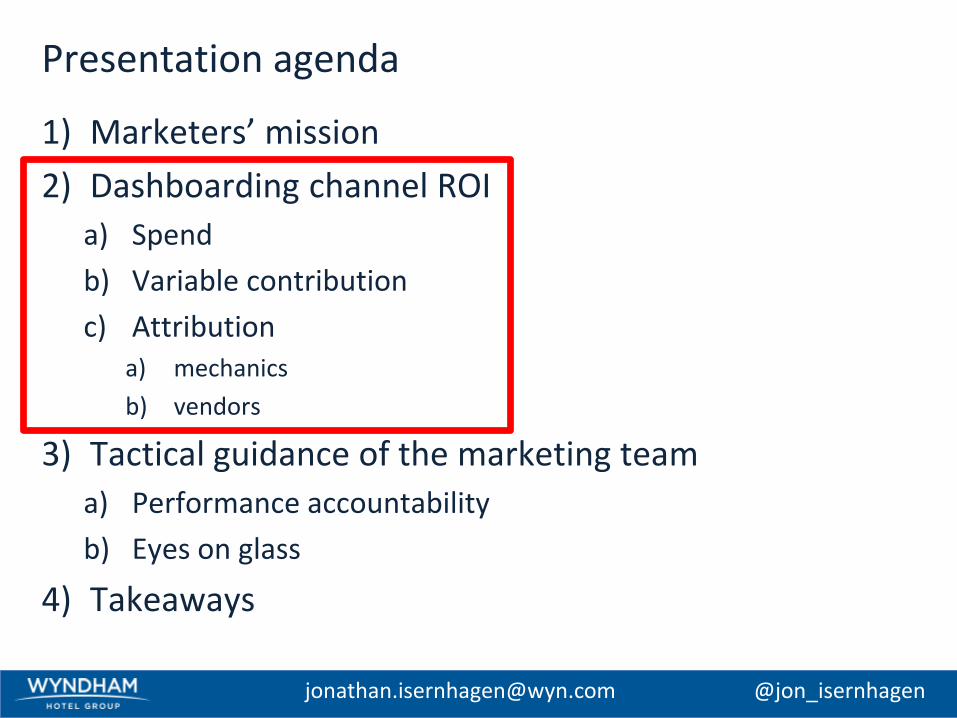
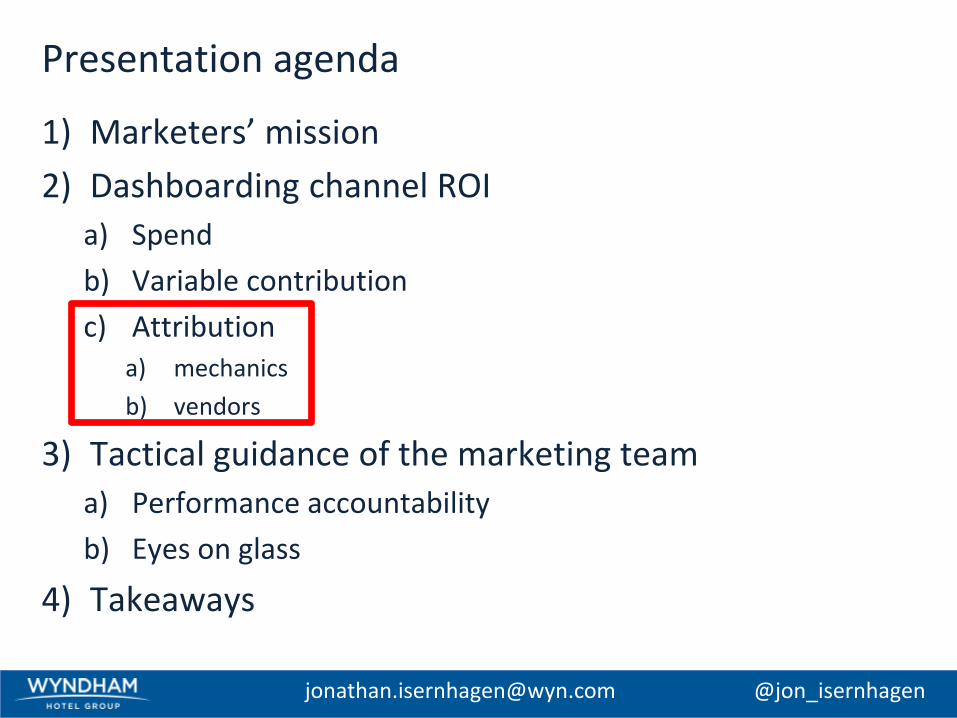
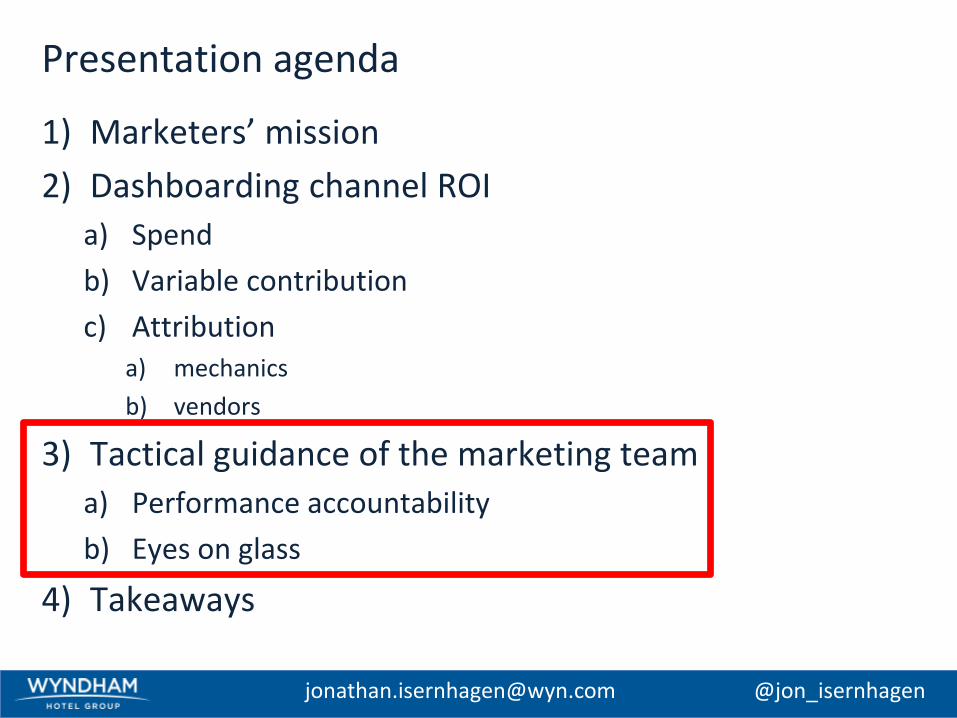
Presentation agenda
1) Marketers’ mission
2) Dashboarding channel ROI
a) Spend
b) Variable contribution
c) Attributiona) mechanics
b) vendors
3) Tactical guidance of the marketing team
a) Performance accountability
b) Eyes on glass
4) Takeaways
[email protected] @jon_isernhagen
2014 Budget Review
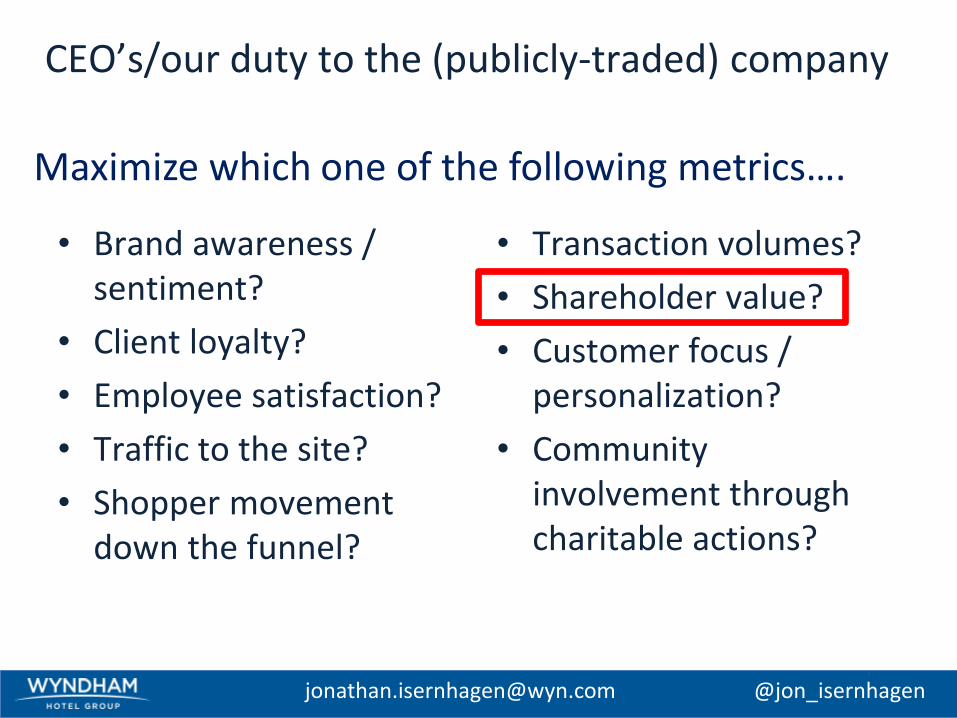
CEO’s/our duty to the (publicly-traded) company
• Brand awareness / sentiment?
• Client loyalty?
• Employee satisfaction?
• Traffic to the site?
• Shopper movement down the funnel?
• Transaction volumes?
• Shareholder value?
• Customer focus / personalization?
• Community involvement through charitable actions?
[email protected] @jon_isernhagen
Maximize which one of the following metrics….
2014 Budget Review
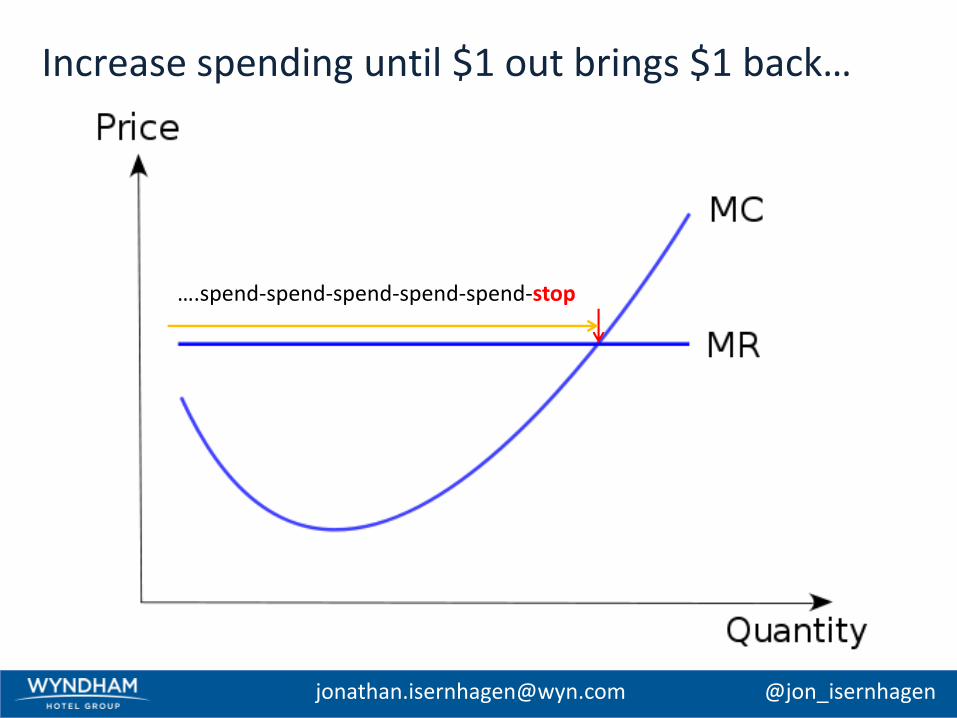
Increase spending until $1 out brings $1 back…
….spend-spend-spend-spend-spend-stop
[email protected] @jon_isernhagen
2014 Budget Review
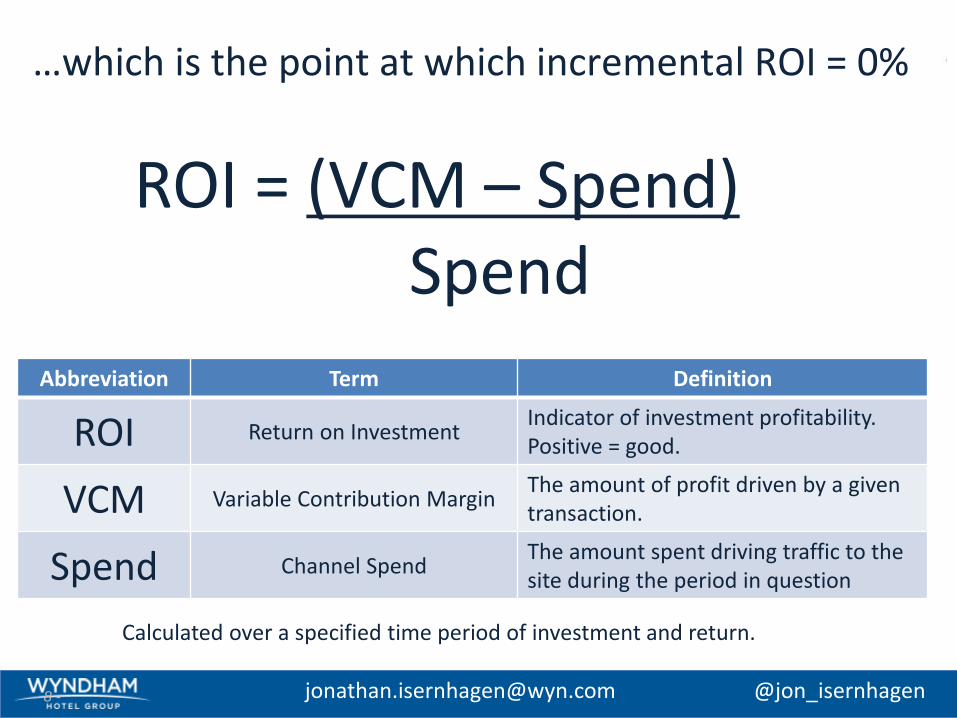
…which is the point at which incremental ROI = 0%
- 8 -
ROI = (VCM – Spend)Spend
Abbreviation Term Definition
ROI Return on InvestmentIndicator of investment profitability. Positive = good.
VCM Variable Contribution MarginThe amount of profit driven by a given transaction.
Spend Channel SpendThe amount spent driving traffic to the site during the period in question
Calculated over a specified time period of investment and return.
[email protected] @jon_isernhagen
2014 Budget Review
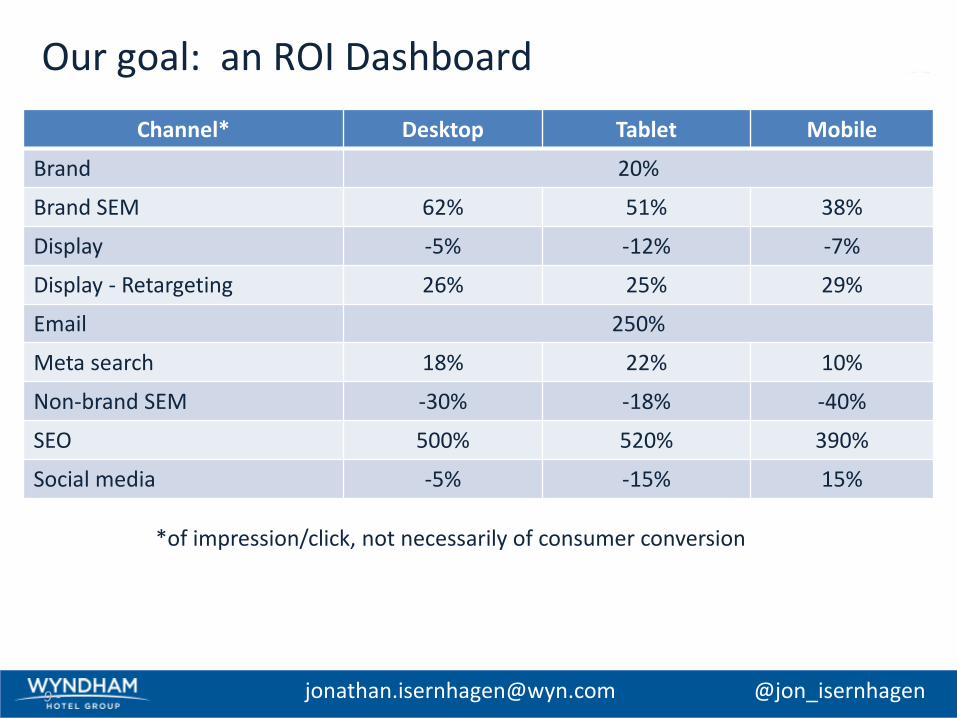
Our goal: an ROI Dashboard
Channel* Desktop Tablet Mobile
Brand 20%
Brand SEM 62% 51% 38%
Display -5% -12% -7%
Display - Retargeting 26% 25% 29%
Email 250%
Meta search 18% 22% 10%
Non-brand SEM -30% -18% -40%
SEO 500% 520% 390%
Social media -5% -15% 15%
- 9 -
*of impression/click, not necessarily of consumer conversion
[email protected] @jon_isernhagen
2014 Budget Review
Presentation agenda
1) Marketers’ mission
2) Dashboarding channel ROI
a) Spend
b) Variable contribution
c) Attributiona) mechanics
b) vendors
3) Tactical guidance of the marketing team
a) Performance accountability
b) Eyes on glass
4) Takeaways
[email protected] @jon_isernhagen
2014 Budget Review
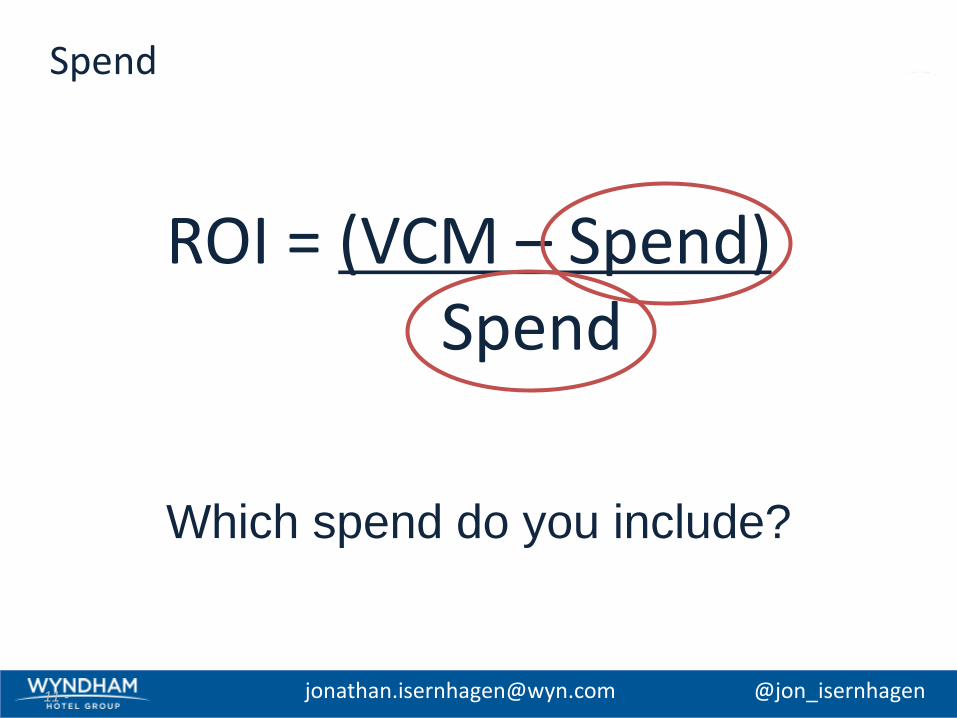
ROI = (VCM – Spend)Spend
Spend
- 11 -
Which spend do you include?
[email protected] @jon_isernhagen

2014 Budget Review
Marketing ≈ Farming
1) Seed = impressions
2) Transactions = fruit
- 12 -
…but
marketers plant
& harvest constantly.
[email protected] @jon_isernhagen
2014 Budget Review
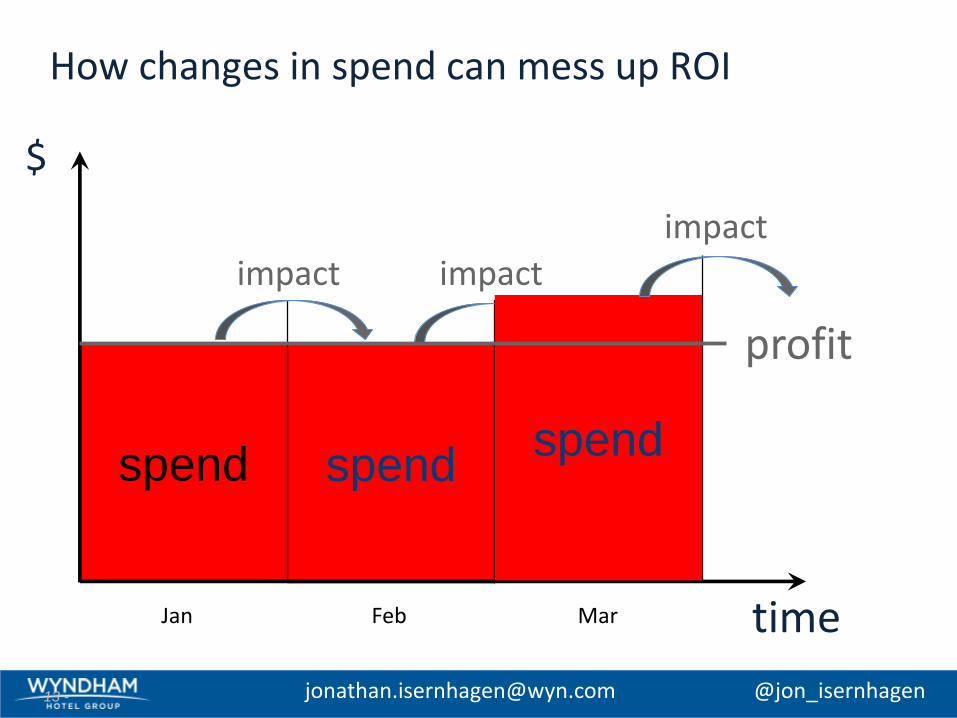
spendspendspendspend
How changes in spend can mess up ROI
- 13 -
$
time
profit
impact impact
spend
impact
Jan Feb Mar
[email protected] @jon_isernhagen
2014 Budget Review
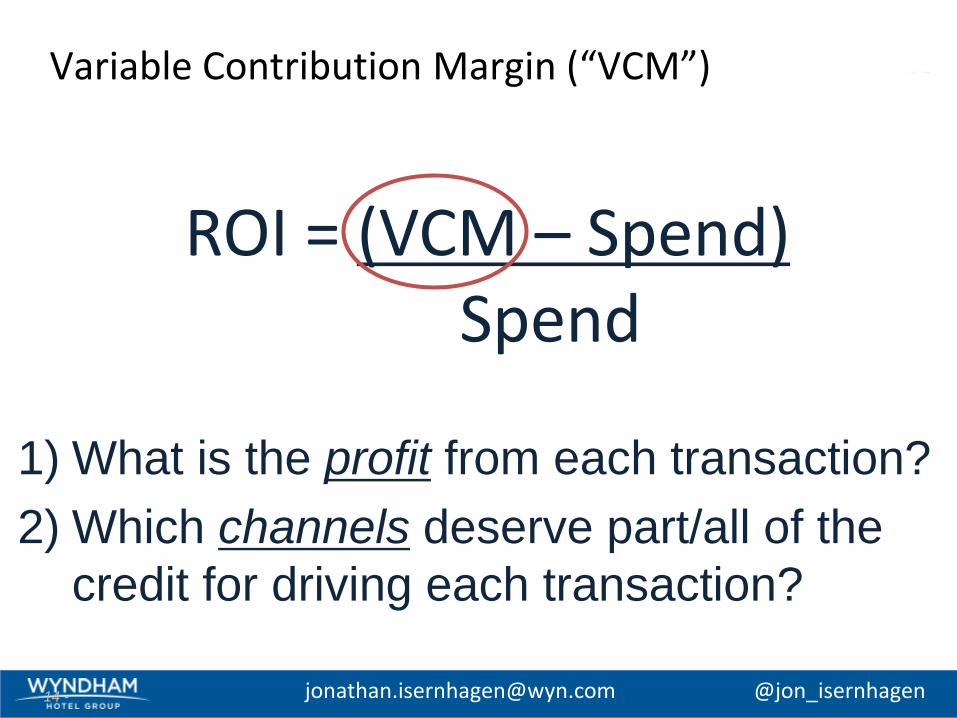
Variable Contribution Margin (“VCM”)
- 14 -
ROI = (VCM – Spend)Spend
1) What is the profit from each transaction?
2) Which channels deserve part/all of the
credit for driving each transaction?
[email protected] @jon_isernhagen
2014 Budget Review
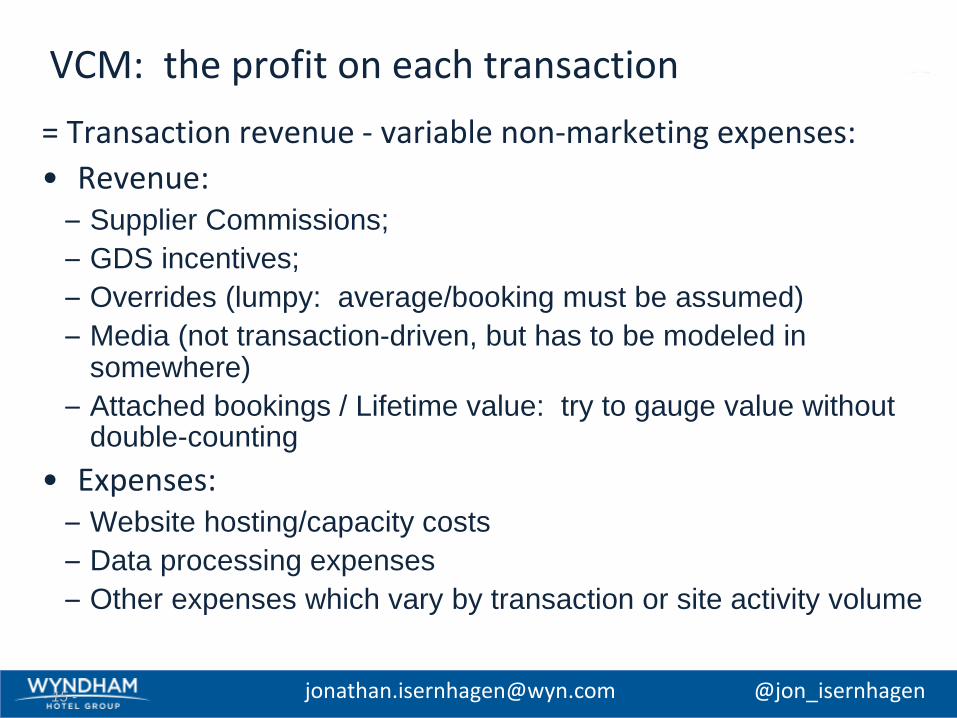
VCM: the profit on each transaction
= Transaction revenue - variable non-marketing expenses:
• Revenue: – Supplier Commissions;
– GDS incentives;
– Overrides (lumpy: average/booking must be assumed)
– Media (not transaction-driven, but has to be modeled in somewhere)
– Attached bookings / Lifetime value: try to gauge value without double-counting
• Expenses: – Website hosting/capacity costs
– Data processing expenses
– Other expenses which vary by transaction or site activity volume
- 15 - [email protected] @jon_isernhagen
2014 Budget Review
Which treatment(s) triggered the purchase?
"Half the money I spend on advertising is wasted;
the trouble is, I don't know which half.“
-John Wanamaker Father of Modern Advertising
[email protected] @jon_isernhagen

2014 Budget Review
How badly do you want to know?
Raylan: You'll pay to find that out.Boyd: What are you packing?
[email protected] @jon_isernhagen
2014 Budget Review
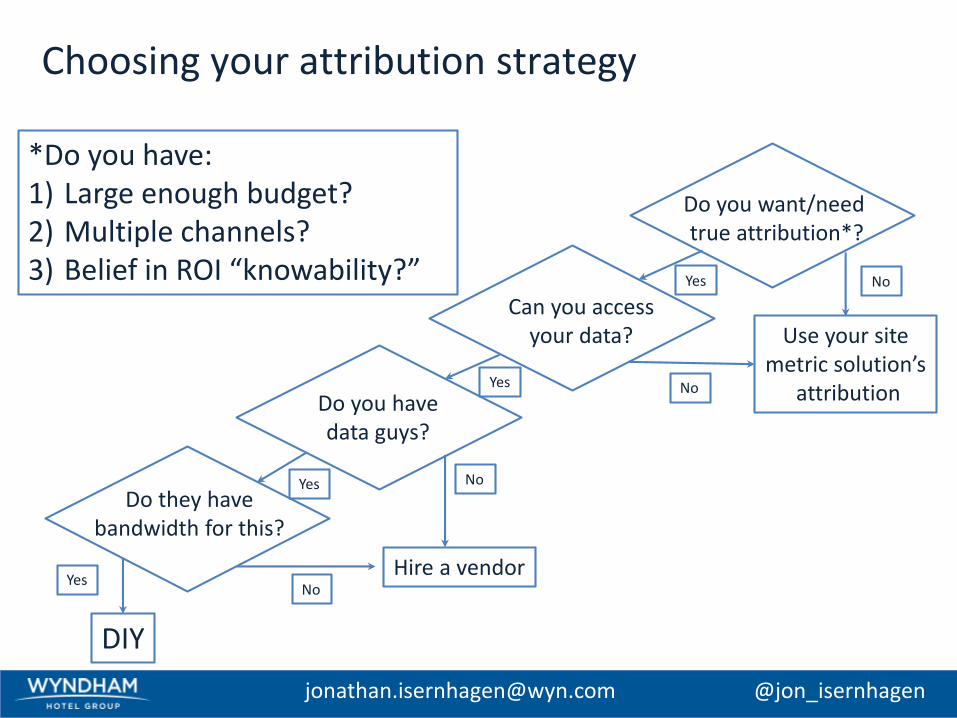
Choosing your attribution strategy
Do you want/need true attribution*?
Do you havedata guys?
Do they havebandwidth for this?
Yes
No
No
Use your sitemetric solution’s
attribution
Yes
YesHire a vendor
Can you accessyour data?
Yes
No
*Do you have:1) Large enough budget?2) Multiple channels?3) Belief in ROI “knowability?”
DIY
No
[email protected] @jon_isernhagen

2014 Budget Review
• Sends• Opens
Collecting the necessary data
Analysis space
• Clicks• Visitors
• Transactions• VCM• Media impressions
Site metrics tool
Back office system
• Channel-specific phone #s
Email service provider
Call Center IVR
• Impressions• Clicks• Spend
Display ad server
e.g. SAS, Revolution Analytics,SPSS, Teradata Warehouse Miner
SEM bid management tool
• Impressions• Clicks• Spend
• GRPs• Spend
Television plan
• Impressions• Clicks• Spend
Meta search feeds
Spend
Manual spend entry table
[email protected] @jon_isernhagen
2014 Budget Review
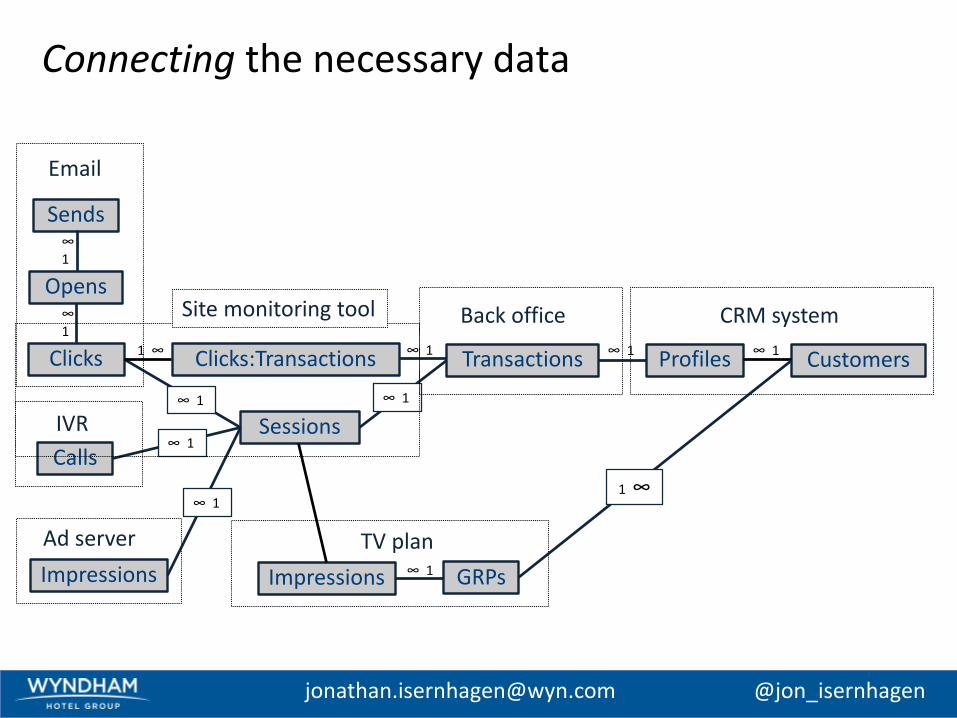
Connecting the necessary data
Transactions Profiles Customers
Sessions
∞ 1∞ 1Clicks:TransactionsClicks ∞ 11 ∞
∞ 1∞ 1
Calls
Sends
Opens∞1
∞1
IVR
GRPs
TV plan
Impressions
Ad server
Impressions
∞ 1
∞ 1
∞ 1
Back officeSite monitoring tool CRM system
1 ∞
[email protected] @jon_isernhagen
2014 Budget Review
Presentation agenda
1) Marketers’ mission
2) Dashboarding channel ROI
a) Spend
b) Variable contribution
c) Attributiona) mechanics
b) vendors
3) Tactical guidance of the marketing team
a) Performance accountability
b) Eyes on glass
4) Takeaways
[email protected] @jon_isernhagen

2014 Budget Review
Forrester surveys of algorithmic attribution vendors
[email protected] @jon_isernhagen
2012 2014
2014 Budget Review
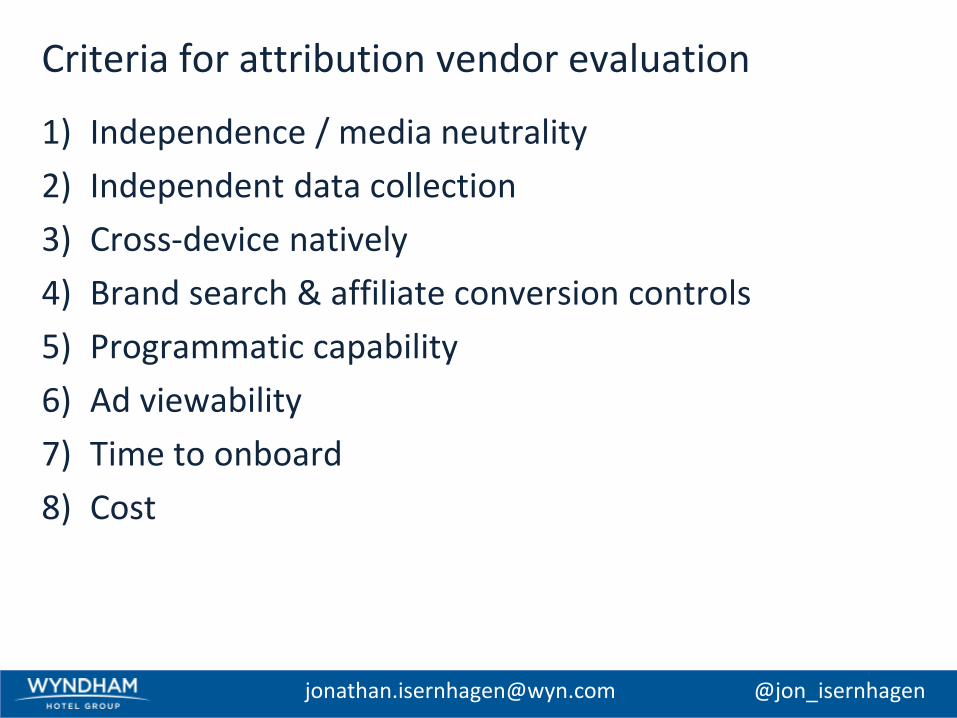
Criteria for attribution vendor evaluation
1) Independence / media neutrality
2) Independent data collection
3) Cross-device natively
4) Brand search & affiliate conversion controls
5) Programmatic capability
6) Ad viewability
7) Time to onboard
8) Cost
[email protected] @jon_isernhagen
2014 Budget Review
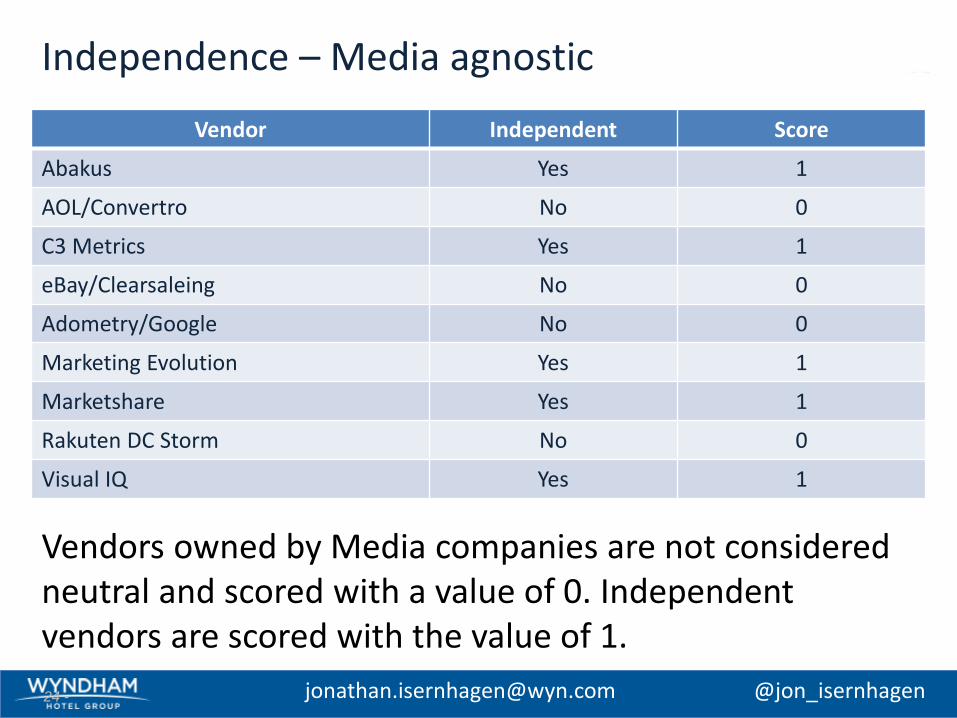
Independence – Media agnostic
Vendor Independent Score
Abakus Yes 1
AOL/Convertro No 0
C3 Metrics Yes 1
eBay/Clearsaleing No 0
Adometry/Google No 0
Marketing Evolution Yes 1
Marketshare Yes 1
Rakuten DC Storm No 0
Visual IQ Yes 1
- 24 - [email protected] @jon_isernhagen
Vendors owned by Media companies are not considered neutral and scored with a value of 0. Independent vendors are scored with the value of 1.
2014 Budget Review
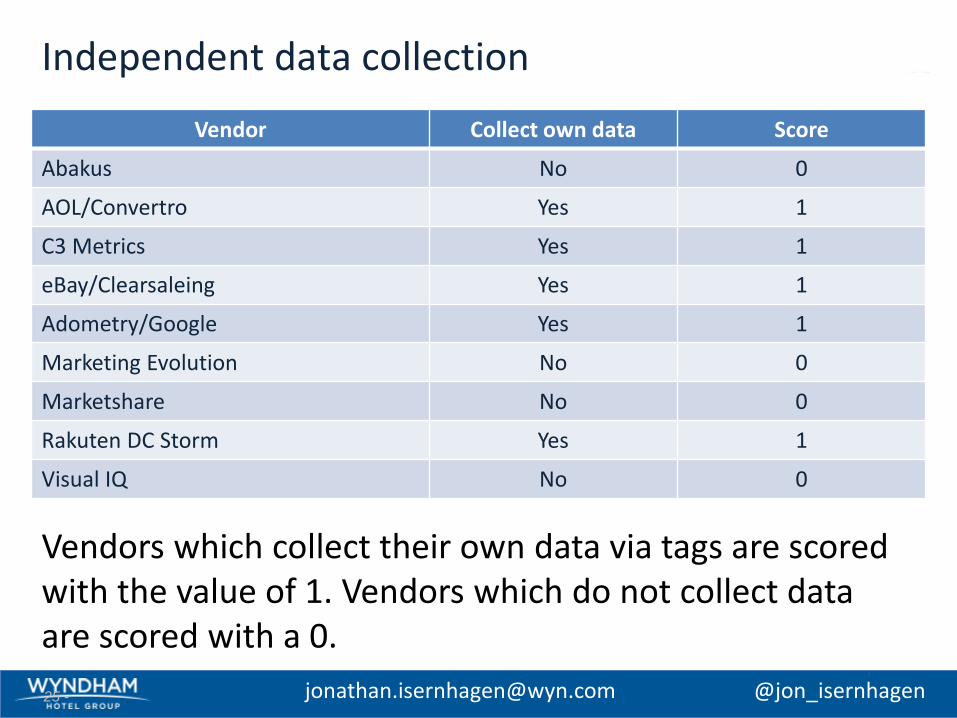
Independent data collection
Vendor Collect own data Score
Abakus No 0
AOL/Convertro Yes 1
C3 Metrics Yes 1
eBay/Clearsaleing Yes 1
Adometry/Google Yes 1
Marketing Evolution No 0
Marketshare No 0
Rakuten DC Storm Yes 1
Visual IQ No 0
- 25 - [email protected] @jon_isernhagen
Vendors which collect their own data via tags are scored with the value of 1. Vendors which do not collect data are scored with a 0.
2014 Budget Review
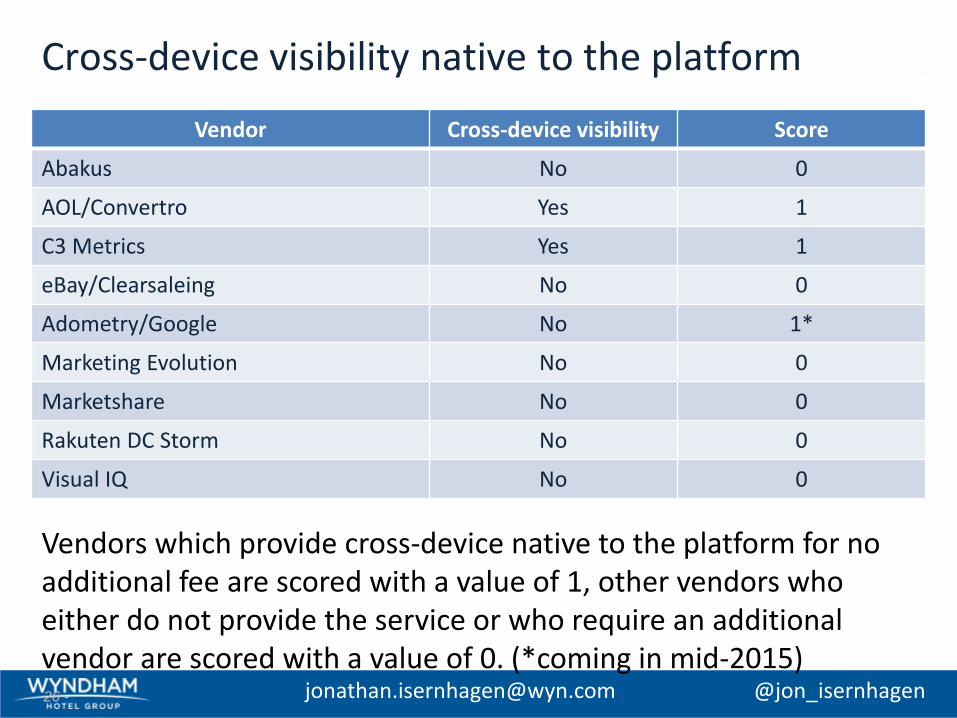
Cross-device visibility native to the platform
Vendor Cross-device visibility Score
Abakus No 0
AOL/Convertro Yes 1
C3 Metrics Yes 1
eBay/Clearsaleing No 0
Adometry/Google No 1*
Marketing Evolution No 0
Marketshare No 0
Rakuten DC Storm No 0
Visual IQ No 0
- 26 - [email protected] @jon_isernhagen
Vendors which provide cross-device native to the platform for no additional fee are scored with a value of 1, other vendors who either do not provide the service or who require an additional vendor are scored with a value of 0. (*coming in mid-2015)
2014 Budget Review
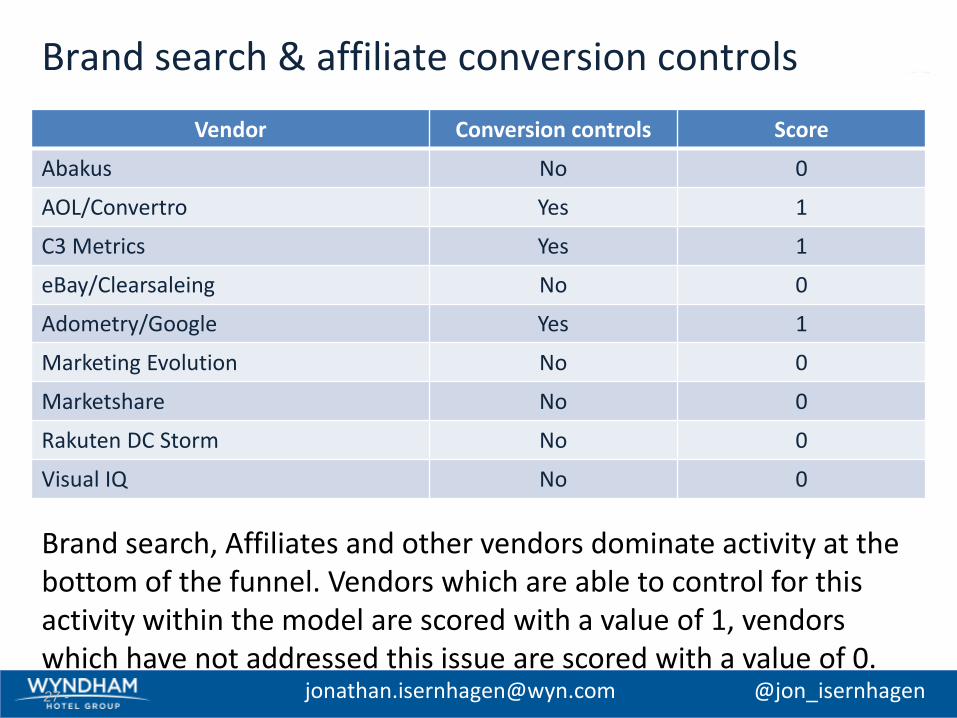
Brand search & affiliate conversion controls
Vendor Conversion controls Score
Abakus No 0
AOL/Convertro Yes 1
C3 Metrics Yes 1
eBay/Clearsaleing No 0
Adometry/Google Yes 1
Marketing Evolution No 0
Marketshare No 0
Rakuten DC Storm No 0
Visual IQ No 0
- 27 - [email protected] @jon_isernhagen
Brand search, Affiliates and other vendors dominate activity at the bottom of the funnel. Vendors which are able to control for this activity within the model are scored with a value of 1, vendors which have not addressed this issue are scored with a value of 0.
2014 Budget Review
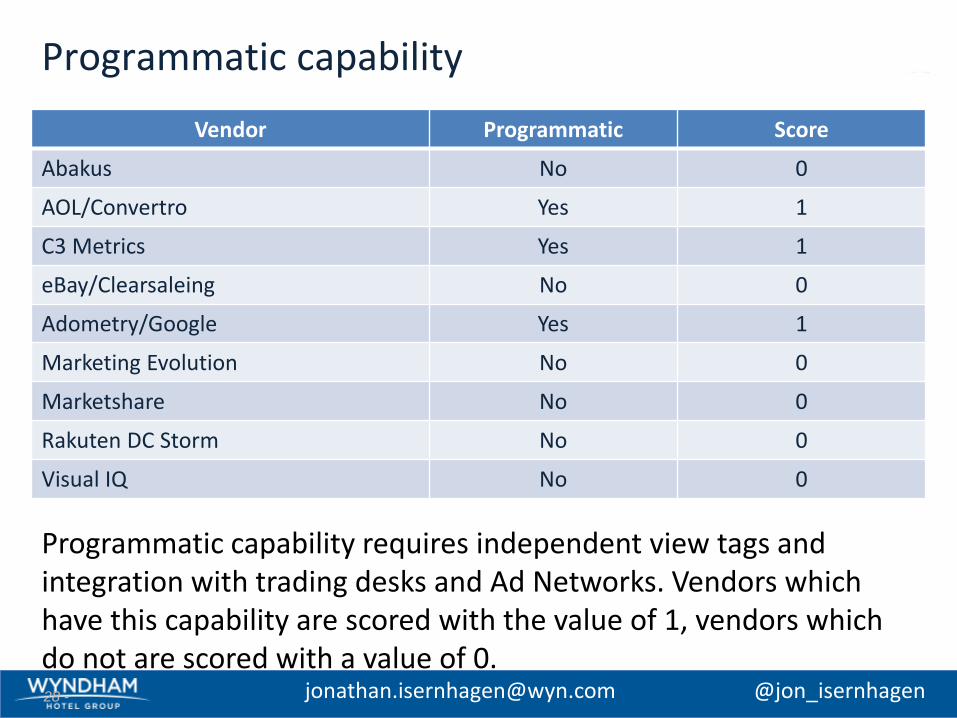
Programmatic capability
Vendor Programmatic Score
Abakus No 0
AOL/Convertro Yes 1
C3 Metrics Yes 1
eBay/Clearsaleing No 0
Adometry/Google Yes 1
Marketing Evolution No 0
Marketshare No 0
Rakuten DC Storm No 0
Visual IQ No 0
- 28 - [email protected] @jon_isernhagen
Programmatic capability requires independent view tags and integration with trading desks and Ad Networks. Vendors which have this capability are scored with the value of 1, vendors which do not are scored with a value of 0.
2014 Budget Review
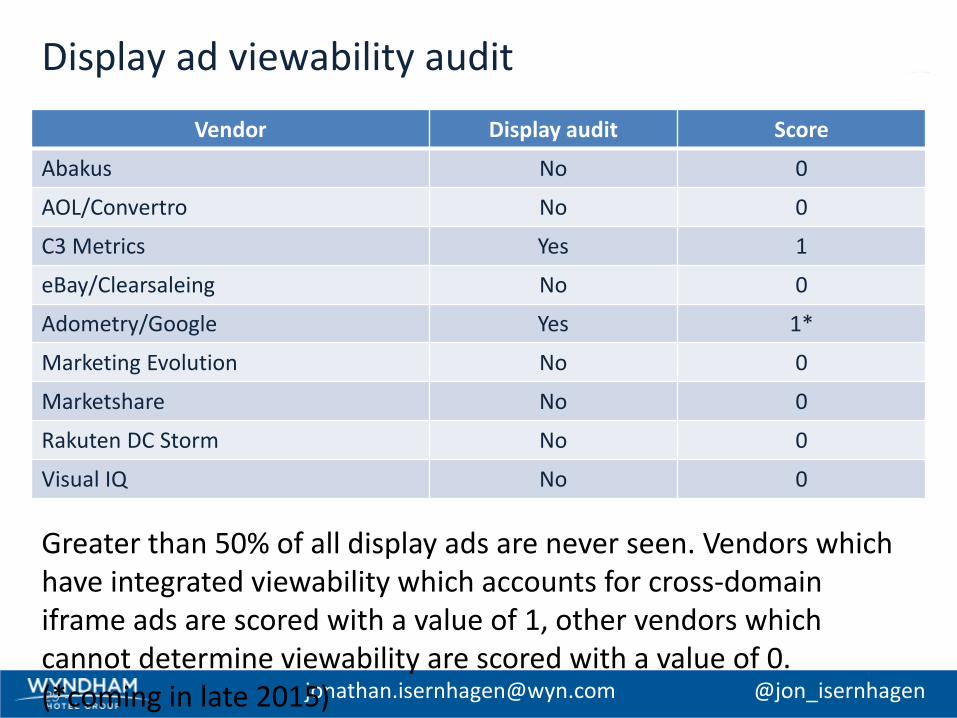
Display ad viewability audit
Vendor Display audit Score
Abakus No 0
AOL/Convertro No 0
C3 Metrics Yes 1
eBay/Clearsaleing No 0
Adometry/Google Yes 1*
Marketing Evolution No 0
Marketshare No 0
Rakuten DC Storm No 0
Visual IQ No 0
- 29 - [email protected] @jon_isernhagen
Greater than 50% of all display ads are never seen. Vendors which have integrated viewability which accounts for cross-domain iframe ads are scored with a value of 1, other vendors which cannot determine viewability are scored with a value of 0. (*coming in late 2015)
2014 Budget Review
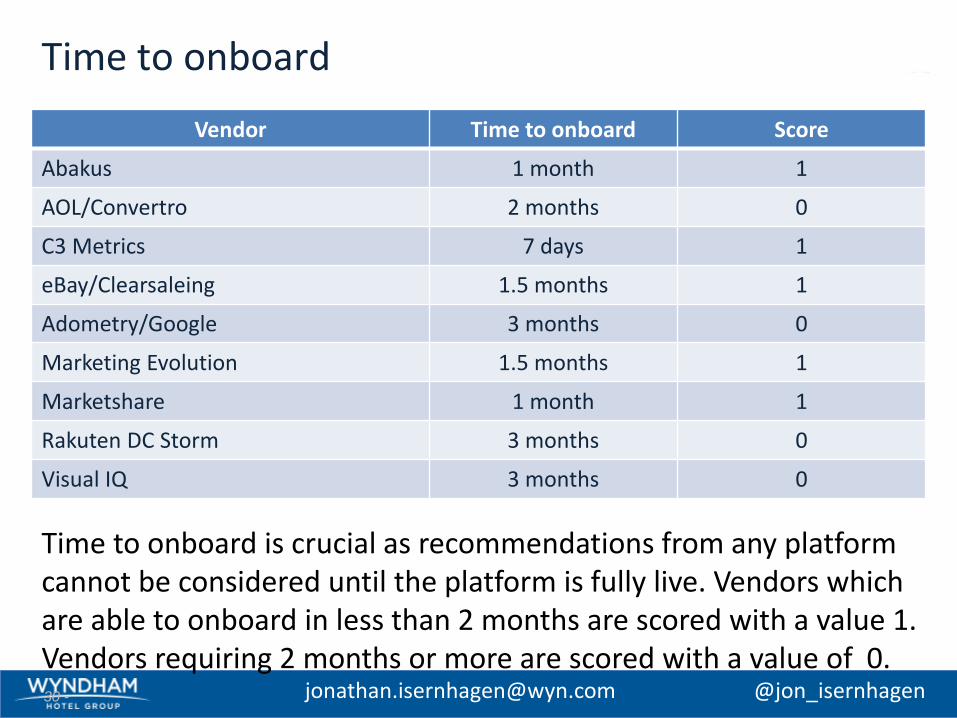
Time to onboard
Vendor Time to onboard Score
Abakus 1 month 1
AOL/Convertro 2 months 0
C3 Metrics 7 days 1
eBay/Clearsaleing 1.5 months 1
Adometry/Google 3 months 0
Marketing Evolution 1.5 months 1
Marketshare 1 month 1
Rakuten DC Storm 3 months 0
Visual IQ 3 months 0
- 30 - [email protected] @jon_isernhagen
Time to onboard is crucial as recommendations from any platform cannot be considered until the platform is fully live. Vendors which are able to onboard in less than 2 months are scored with a value 1. Vendors requiring 2 months or more are scored with a value of 0.
2014 Budget Review
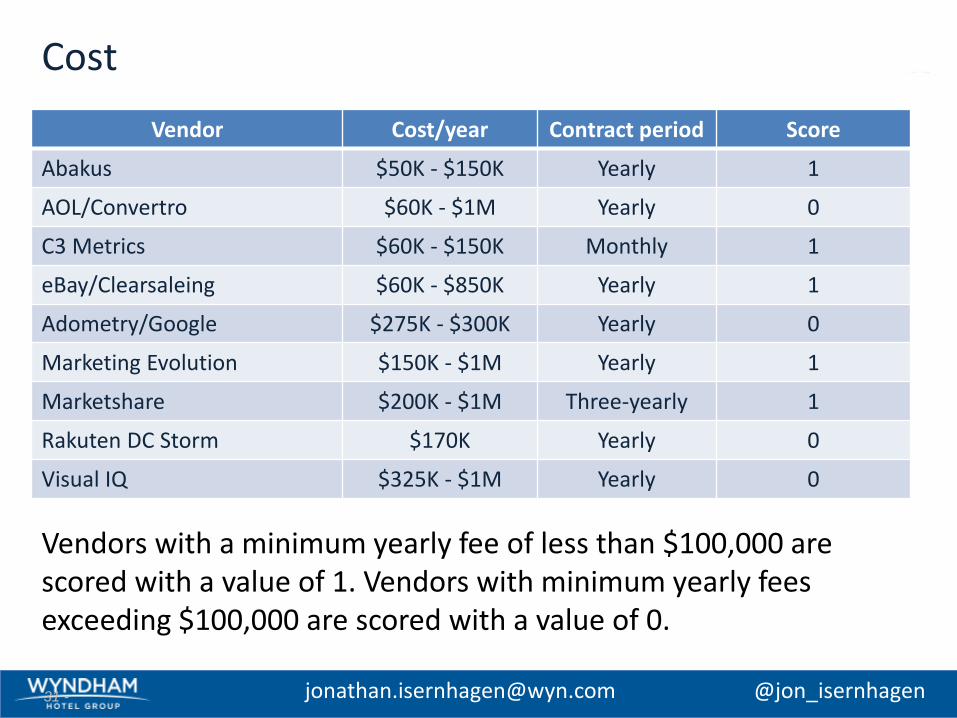
Cost
Vendor Cost/year Contract period Score
Abakus $50K - $150K Yearly 1
AOL/Convertro $60K - $1M Yearly 0
C3 Metrics $60K - $150K Monthly 1
eBay/Clearsaleing $60K - $850K Yearly 1
Adometry/Google $275K - $300K Yearly 0
Marketing Evolution $150K - $1M Yearly 1
Marketshare $200K - $1M Three-yearly 1
Rakuten DC Storm $170K Yearly 0
Visual IQ $325K - $1M Yearly 0
- 31 - [email protected] @jon_isernhagen
Vendors with a minimum yearly fee of less than $100,000 are scored with a value of 1. Vendors with minimum yearly fees exceeding $100,000 are scored with a value of 0.
2014 Budget Review
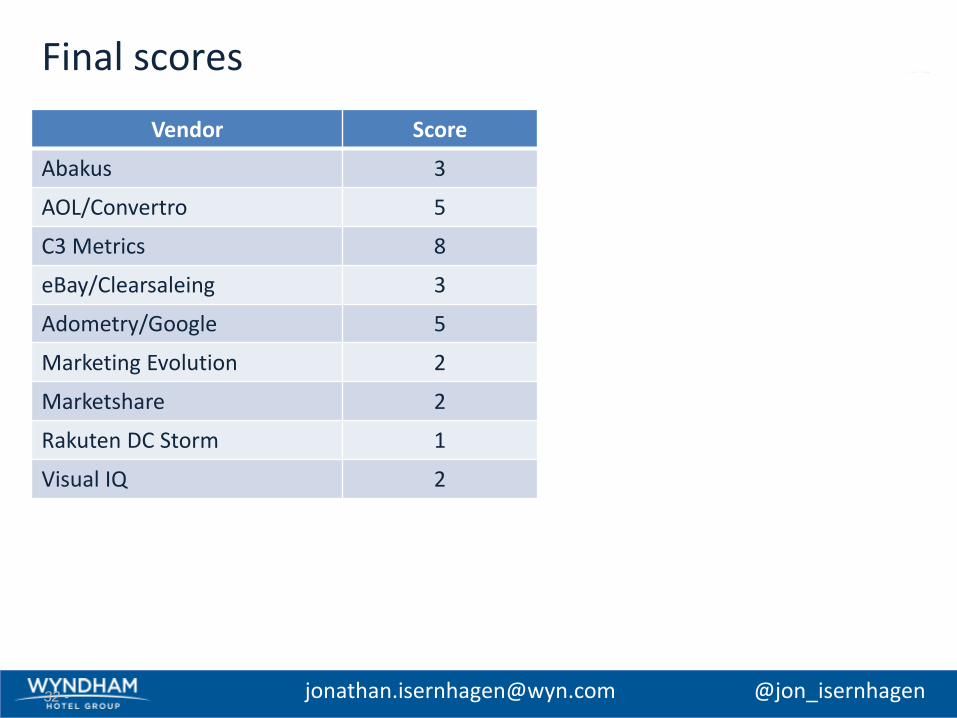
Final scores
Vendor Score
Abakus 3
AOL/Convertro 5
C3 Metrics 8
eBay/Clearsaleing 3
Adometry/Google 5
Marketing Evolution 2
Marketshare 2
Rakuten DC Storm 1
Visual IQ 2
- 32 - [email protected] @jon_isernhagen
2014 Budget Review
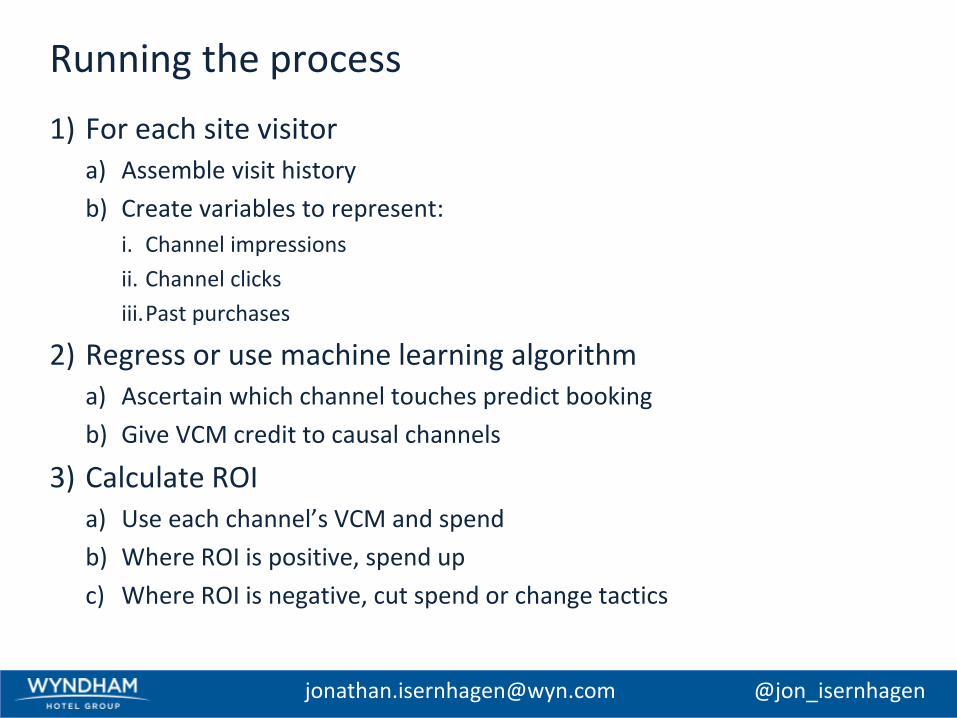
Running the process
1) For each site visitora) Assemble visit history
b) Create variables to represent:
i. Channel impressions
ii. Channel clicks
iii.Past purchases
2) Regress or use machine learning algorithma) Ascertain which channel touches predict booking
b) Give VCM credit to causal channels
3) Calculate ROIa) Use each channel’s VCM and spend
b) Where ROI is positive, spend up
c) Where ROI is negative, cut spend or change tactics
[email protected] @jon_isernhagen
2014 Budget Review
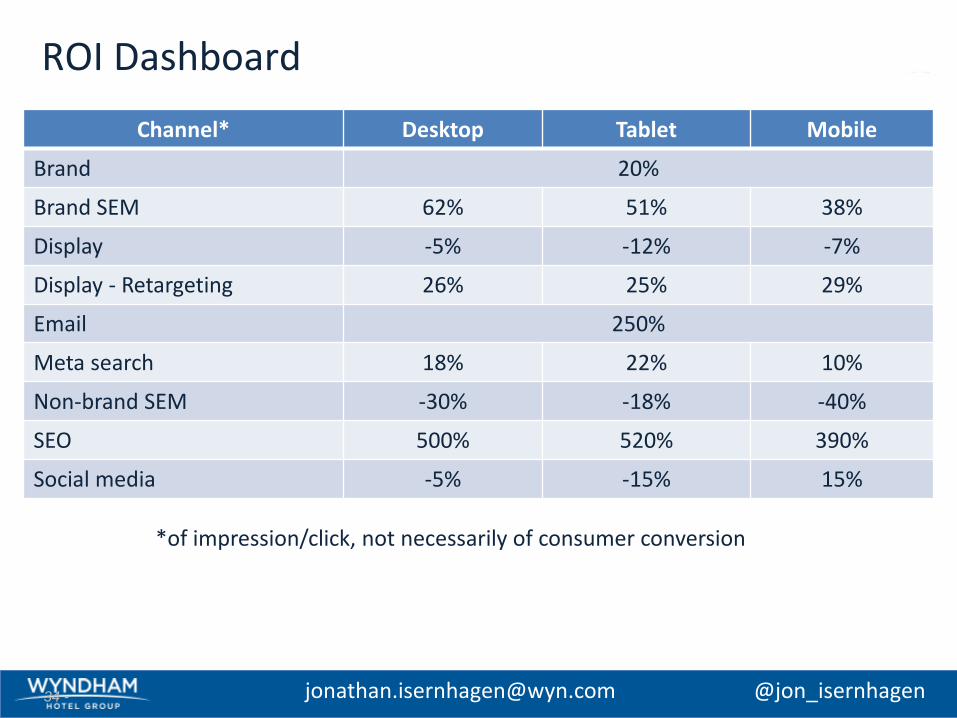
ROI Dashboard
Channel* Desktop Tablet Mobile
Brand 20%
Brand SEM 62% 51% 38%
Display -5% -12% -7%
Display - Retargeting 26% 25% 29%
Email 250%
Meta search 18% 22% 10%
Non-brand SEM -30% -18% -40%
SEO 500% 520% 390%
Social media -5% -15% 15%
- 34 -
*of impression/click, not necessarily of consumer conversion
[email protected] @jon_isernhagen
2014 Budget Review
Presentation agenda
1) Marketers’ mission
2) Dashboarding channel ROI
a) Spend
b) Variable contribution
c) Attributiona) mechanics
b) vendors
3) Tactical guidance of the marketing team
a) Performance accountability
b) Eyes on glass
4) Takeaways
[email protected] @jon_isernhagen
2014 Budget Review
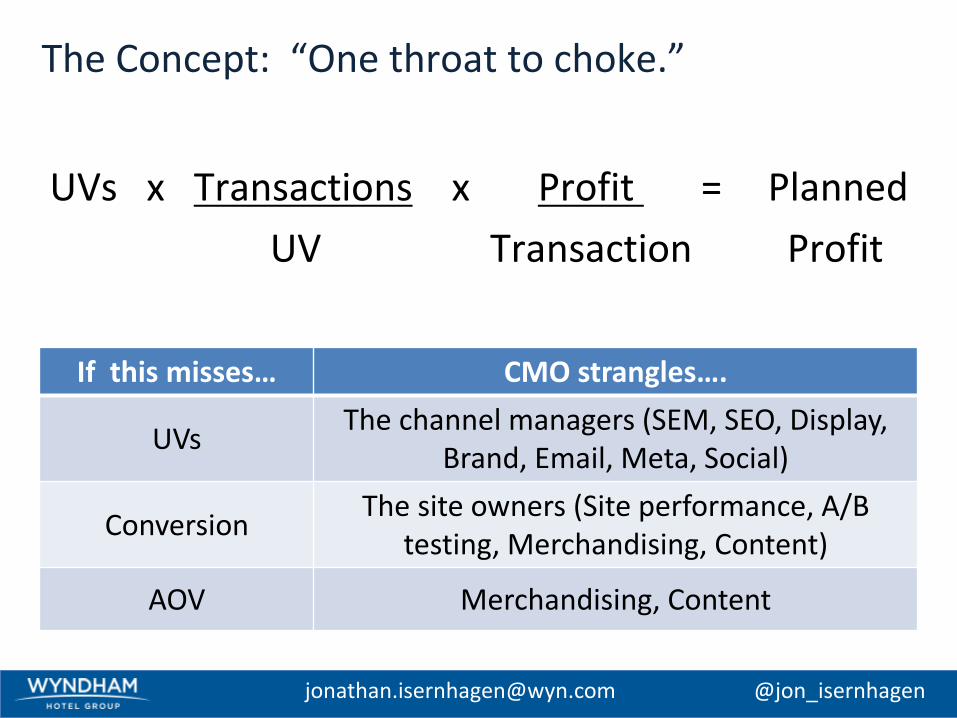
The Concept: “One throat to choke.”
UVs x Transactions x Profit = Planned
UV Transaction Profit
[email protected] @jon_isernhagen
If this misses… CMO strangles….
UVsThe channel managers (SEM, SEO, Display,
Brand, Email, Meta, Social)
ConversionThe site owners (Site performance, A/B
testing, Merchandising, Content)
AOV Merchandising, Content
2014 Budget Review
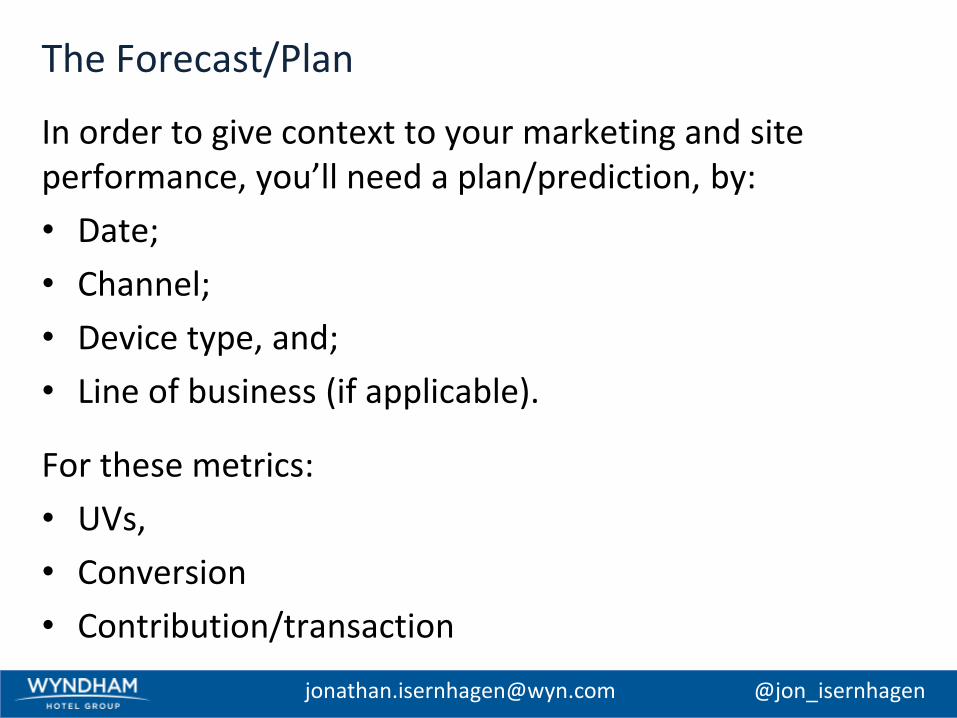
The Forecast/Plan
In order to give context to your marketing and site performance, you’ll need a plan/prediction, by:
• Date;
• Channel;
• Device type, and;
• Line of business (if applicable).
For these metrics:
• UVs,
• Conversion
• Contribution/transaction
[email protected] @jon_isernhagen
2014 Budget Review
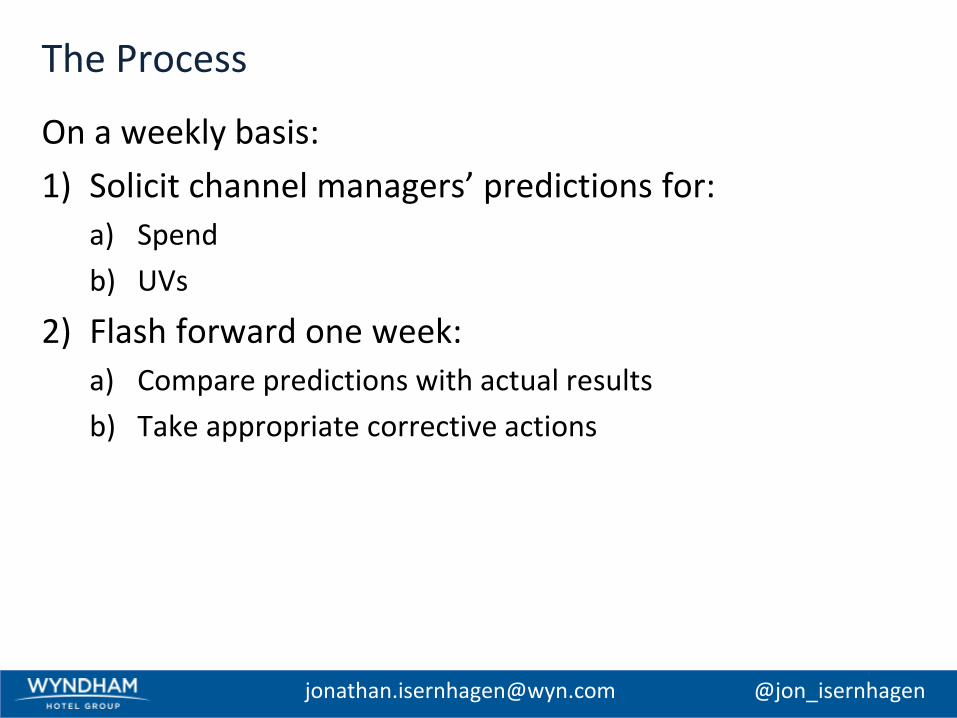
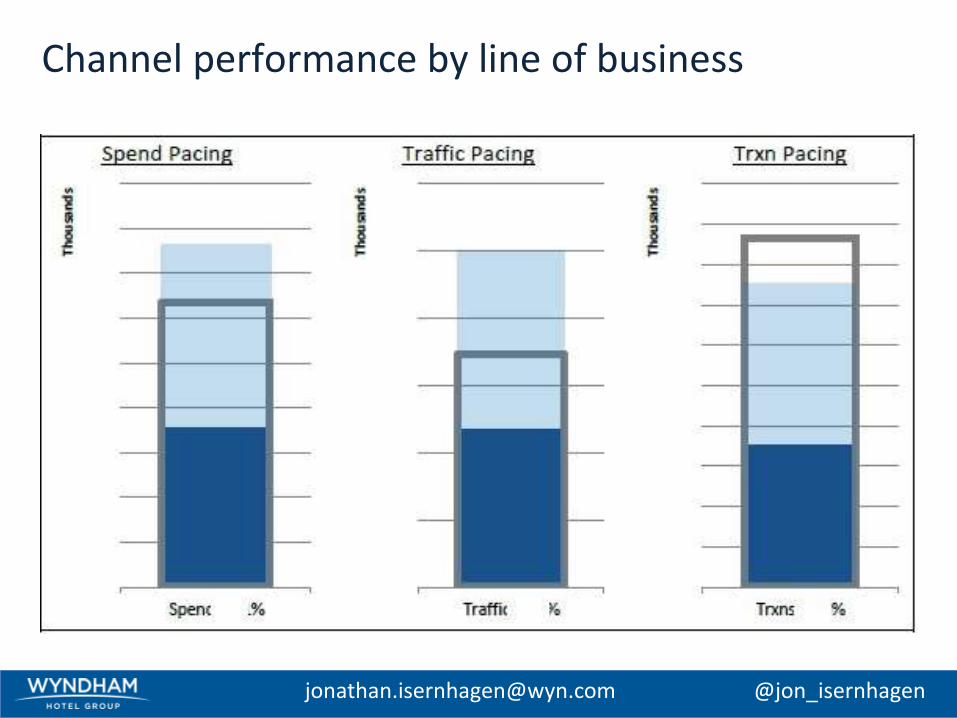
The Process
On a weekly basis:
1) Solicit channel managers’ predictions for:
a) Spend
b) UVs
2) Flash forward one week:
a) Compare predictions with actual results
b) Take appropriate corrective actions
[email protected] @jon_isernhagen
2014 Budget Review
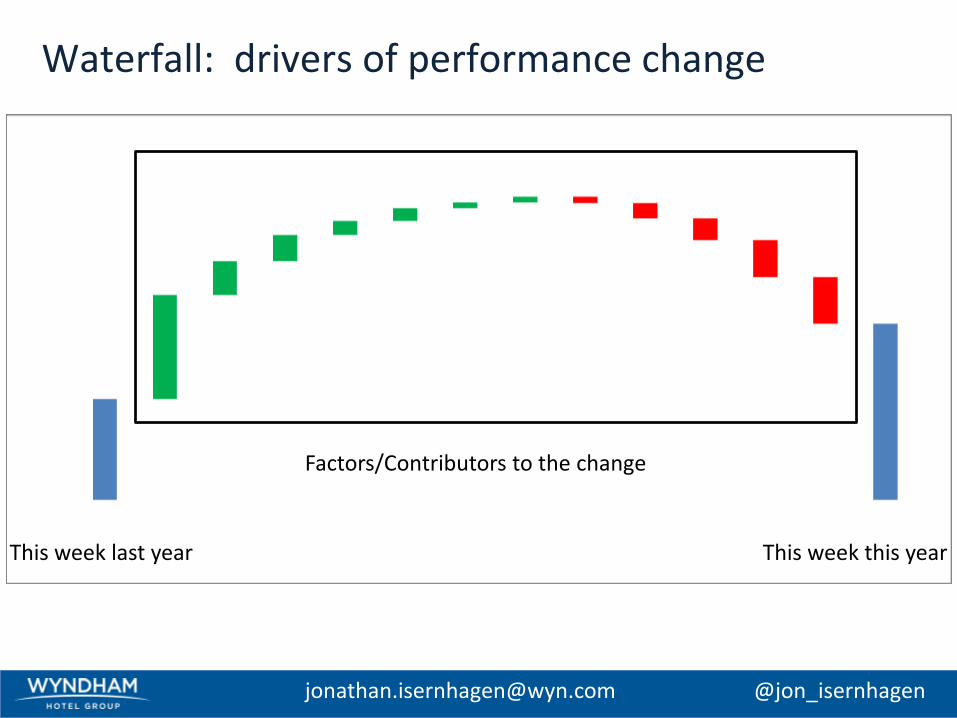
Waterfall: drivers of performance change
[email protected] @jon_isernhagen
This week last year This week this year
Factors/Contributors to the change
2014 Budget Review
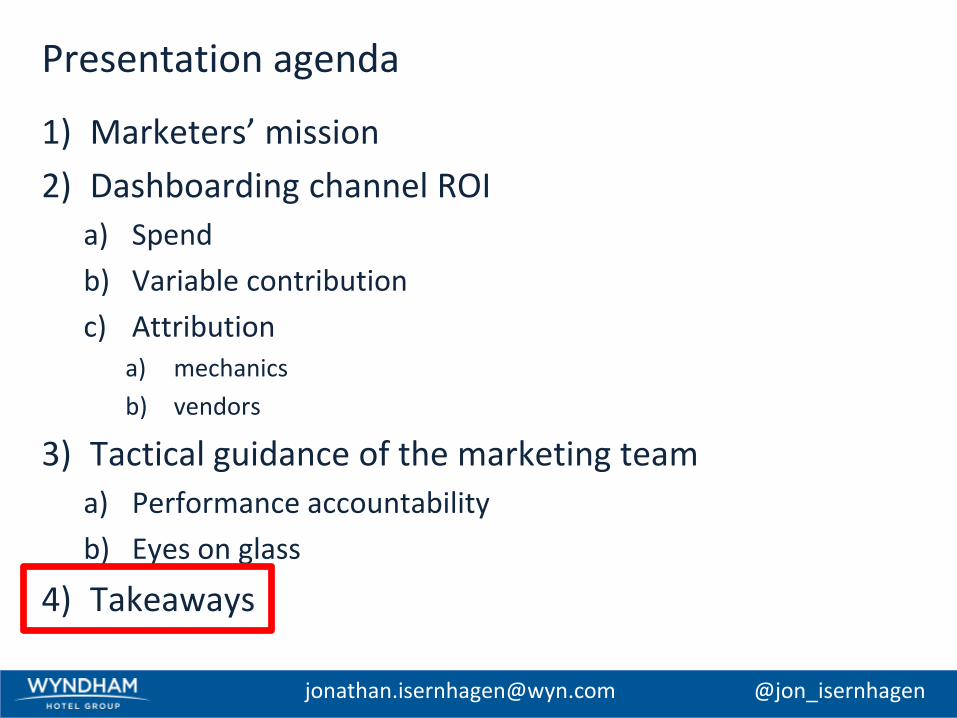
Presentation agenda
1) Marketers’ mission
2) Dashboarding channel ROI
a) Spend
b) Variable contribution
c) Attributiona) mechanics
b) vendors
3) Tactical guidance of the marketing team
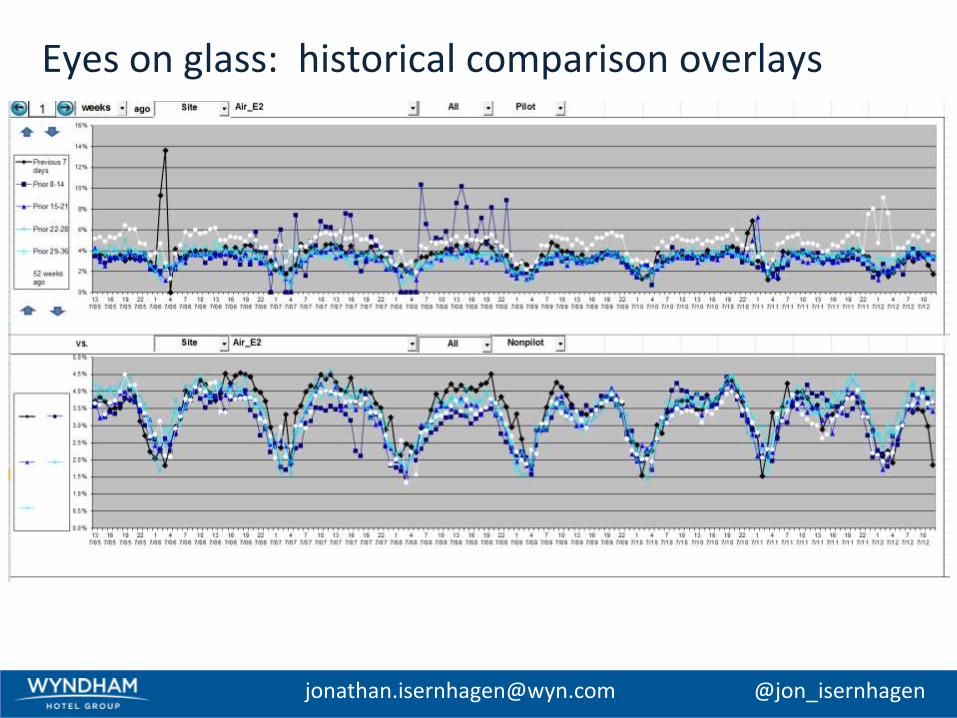
a) Performance accountability
b) Eyes on glass
4) Takeaways
[email protected] @jon_isernhagen
2014 Budget Review
Takeaways
1) Always know how your activities boost profits
2) Focus on:
a) What [spend/efforts] you need to change
b) What site functionality problems you need to fix
3) Know the drivers of your site’s performance:
a) Use market research/market share resources
b) Maintain a log of performance-impacting events
c) Understand what’s working for you & competitors
4) Place every metric in a context (vs. LY, vs. plan…)
a) Report generation is a commoditized activity
b) Curation for senior management is the killer app.
[email protected] @jon_isernhagen