dart training for pams and csn - us epa€¦ · dart training for pams and csn (data analysis and...
TRANSCRIPT

DART Training for PAMS and CSN(Data Analysis and Reporting Tool for
Photochemical Assessment Monitoring Station andChemical Speciation Network Data)
Jennifer DeWinter, Steve Brown, and Hilary Hafner Sonoma Technology, Inc.
Beth Landis and Kevin Cavender U.S. EPA
for
National Ambient Air Monitoring Conference Data Validation Training Session
St. Louis, MO
August 8, 2016
6561

2
Outline for Training Session • DART overview
– Accessing and navigating DART – Bringing data into DART
• Using DART as part of the new CSN data reviewprocess (with live demo)
• Using DART for PAMS (and other) data validation andanalysis (with live demo)
• Future enhancements
• Q&A

3
Data Analysis & Reporting Tool
• DART is a web-based data validation and analysis tool that allowsmonitoring agencies to manage, explore, validate, and flag data.
• DART includes automated screening, statistical summaries, andAQS-formatted data.

4
DART Features • Manage data
– Upload data files for validation – Request data from AQS – Convert units – Aggregate data

5
DART Features • Explore data
– Create time-series plots – Edit data – Create scatter plots
– Create bar plots

6
• Validate data – Screen data – “DART Smarts”
• Export data – Create AQS-ready files
– Obtain summary statistics
DART Features

7
Accessing DARThttp://www.airnowtech.org
Requires anAirNow-Tech account

8
Navigating DART
DART Home Page

9
Bringing Data into DART Three ways to add data to DART
1. Upload data files from your computer • AQS format • CSV format • TX0 format
2. Request data from AQS 3. Receive data automatically from a laboratory
transfer • Currently available for CSN data from UC Davis (UCD)

10
Bringing Data into DART
Choose “Upload” or “AQS Request”
Click the “add data” link from the “Manage” page

11
Your Data in DART When you upload your PAMS (or other) data, or makean AQS Request:
– Currently, it’s unique to you – In future, you will be able to share your data within your
agency (and potentially with other AirNow-Tech users)

12
Your Data in DART CSN data from UC Davis are available to approved CSN validators in your agency
Agency data tablewith CSN data sets

13
CSN Data Review Process 1. UC Davis generates laboratory data; acquires mass data
from continuous FEMs (as available) from AirNow-Tech. 2. UCD conducts data validation (details on next slide). 3. UCD sends the data batch to DART. 4. DART ingests the batch data, then automatically alerts CSN
data reviewers (details on following slides) that data areavailable in DART.
5. CSN data reviewers then have 30 days to review andapprove the data.
6. After 30 days, the data are sent back to UCD for final reviewand submission to AQS.

14
DART Data Flow for CSN
UCD sends data to DART
Data Validation Contacts
are informed electron-ically of
data available for review (30-daywindow)
Data Validation Contacts
review data and any
suggested flags in DART
Data Validation Contacts approvedata, or suggest
additional/different flagging,
with option to include comments
to UCD
UCD makes any
necessary changes to
the data and
uploads thedata to
AQS

15
CSN Data Validators • One agency is responsible for data validation for each
site (e.g., New York DEC reviews Rochester site data). • For each site, EPA provided a list of data validators and
their associated agency. • All listed data validators for an individual agency have
access to the agency data in DART; they do not haveaccess to data that are not for their agency.
• Once data are available in DART for review, the data validators will be contacted automatically via email.

16
CSN Data Review in DART • Once data are in DART, validators have 30 days to
review and approve the CSN batch. • DART provides summary statistics
– flags and comments that UCD applied – other data characteristics (percent complete, percent above
detection limit, etc.)
• In DART, validators can flag and comment on data forUCD to review, and use sortable tables to review the CSN batch.
• Time-series and bar plots are linked to the data tableso validators can also graph the data.

17
CSN Data Review in DART
Automated Notification Via Email
“Review by”
Data sets
Help!

18
CSN Data Review in DART Approval Modefor review of data from the lab

19
CSN Data Review in DART
Flag as reviewed
“Review by” Date

20
CSN Data Review in DART
Changes andcomments log
Apply null orqualifier codes
21
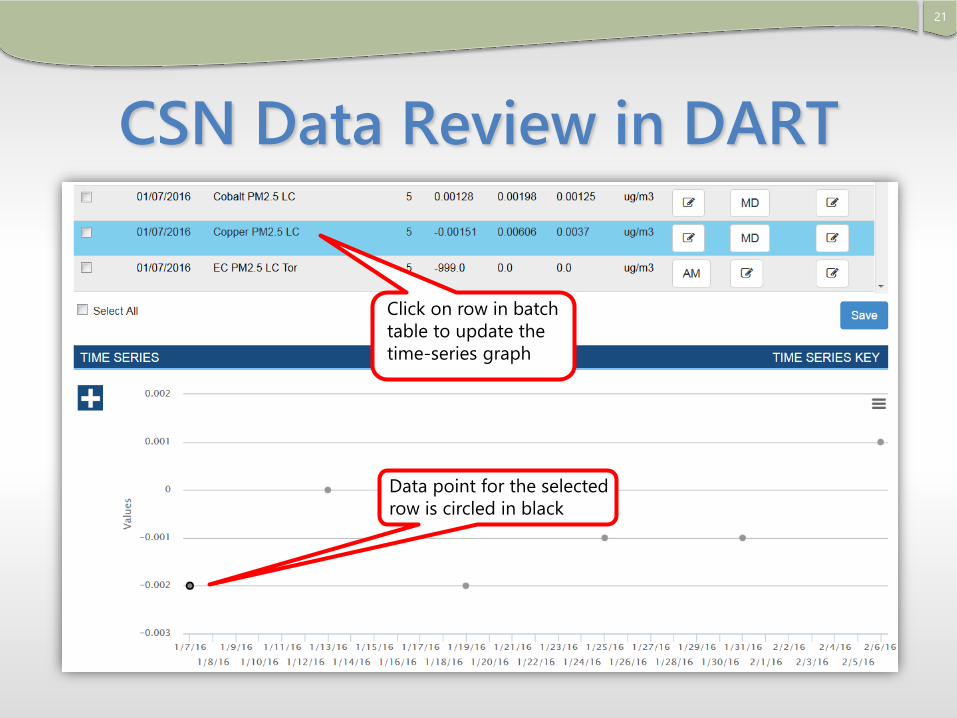
CSN Data Review in DART
Click on row in batch table to update the time-series graph
Data point for the selectedrow is circled in black

22
CSN Data Review in DART
Regular Fingerprint
23
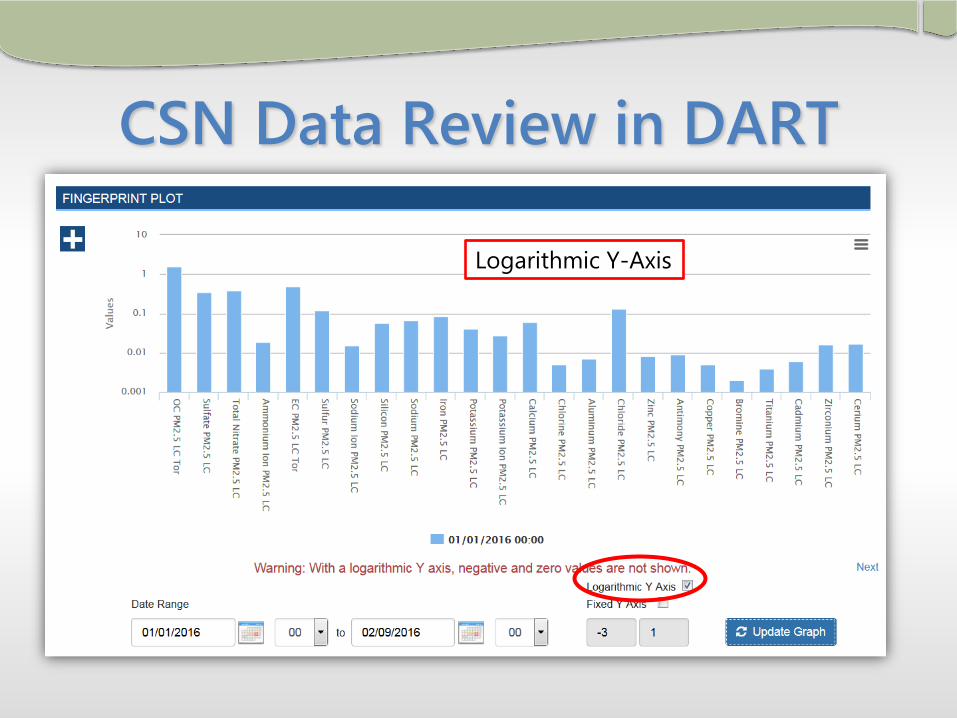
CSN Data Review in DART
Logarithmic Y-Axis

24
CSN Data Review in DART

25
Transition To PAMS Training

26
Time-Series Graphs

27
Scatter Plots

28
Bar Plots

29
Stacked Bar Charts

30
Auto-Validation: Screening Check Fails If ... DART Smarts Action
If Check Fails
Abundant Species Any of Benzene, Propane, N-Butane, Isoprene, N-Hexane, Ethylbenzene are missing or 0
If two or more species missing or= 0, flag sample with code “AQ”
TNMOC
-TNMOC is missing or 0; or -Unidentified exceeds 50% of TNMOC; or -Sum of PAMS exceeds TNMOC
-Flag TNMOC and Unidentified with code “AN” -Flag Unidentified with code “DA” -Flag TNMOC and Sum of PAMS with code “DA”
Variability Species concentration exceeds the mean + 4*standard deviation None
Sticking Species has same non-zero value for 3 or more consecutive samples Flag species with code “DA”
Benzene : Toluene Benzene exceeds 0.2 and exceeds Toluene
Flag Benzene and Toluene with code “DA”
Ethylene : Ethane Ethylene exceeds 0.5 and exceeds Ethane
Flag Ethylene and Ethane with code “DA”
Propylene : Propane Propylene exceeds 0.5 and exceeds Propane
Flag Propylene and Propane with code “DA”
All checks done in ppbC. AQ = collection error; AN = machine malfunction; DA = aberrant data; BH = interference/coelution/misidentification. .

31
Auto-Validation: Screening Check Fails If ... DART Smarts Action
If Check Fails
O-Xylene : M/P Xylene
Methylpentanes
Undecane : Decane
O-Xylene exceeds 0.5 and exceeds M/P Xylene
3-Methylpentane exceeds 0.1 and exceeds 0.6*2-Methylpentane
N-Undecane exceeds 0.5 and exceeds N-Decane
Flag Xylenes with code “DA”
If 3-Methylpentane exceeds 0.1 and exceeds 0.65*2-Methylpentane, then flag Methylpentanes with code “BH”
Flag N-Undecane and N-Decane with code “DA”
Olefins : Paraffins Sum of Olefins exceeds Sum of Paraffins Flag Olefins and Paraffins with code “DA”
Carbon Tetrachloride Carbon Tetrachloride exceeds 0.16 ppb Flag Carbon Tetrachloride with code “AQ”
Formaldehyde
Nighttime Isoprene
Formaldehyde is less than 0.3 ppb Isoprene increases between 8 pm and3 am local time
None
Flag Isoprene with code “DA”
All checks done in ppbC, except carbon tetrachloride and formaldehyde checks, which use ppb.. AQ = collection error; AN = machine malfunction; DA = aberrant data; BH = interference/coelution/misidentification.

32
Auto-Validation: Workflow
Set up customscreening checks

33 Auto-Validation: Workflow

34
Auto-Validation: Workflow

35
Auto-Validation: Workflow

36
Getting Help

37
Feedback button
Getting Help

38
Important CSN Contacts [email protected]
Role Contact Phone Number Email
EPA Project Officer Jeff Yane 919-541-2962 [email protected]
EPA Project Manager Elizabeth Landis 919-541-2262 [email protected]
EPA QA Officer Jenia Tufts 919-541-0371 [email protected]
Shipping & Handling (Amec) Justin Knoll 352-333-6621 [email protected]
Gravimetric Analysis (Amec) Bill Barnard 352-333-6617 [email protected]
Laboratory Analysis (UCD) Nicole Hyslop 530-754-8979 [email protected]
DART (STI) Jennifer DeWinter Steve Brown
707-665-9900 [email protected] [email protected]
CSN Regional Representatives R1 - Alan VanArsdale & Catie Taylor R6 – Frances Verhalen R2 – Mazeeda Khan R7 – Leland Grooms R3 – Lori Hyden R8 – Joshua Rickard R4 – Keith Harris R9 – Anna Mebust & Dena Vallano R5 – Scott Hamilton R10 – Chris Hall & Keith Rose
39
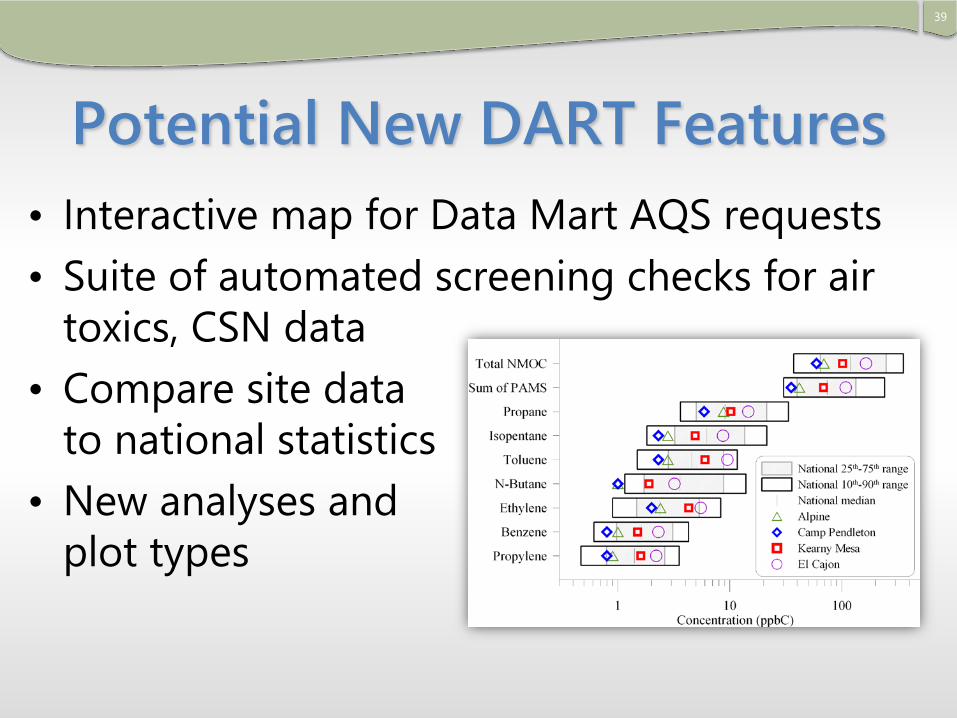
Potential New DART Features • Interactive map for Data Mart AQS requests • Suite of automated screening checks for air
toxics, CSN data •
•
Compare site datato national statistics New analyses andplot types

40
Potential New DART Features • • • •
•
Plot concentrations with MDL values Plot concentrations with annual averages Support for more import file formats Connection to AirNow-Tech features Pollution and wind roses

41
Potential CSN Features in DART • Plot concentrations with MDL values • Plot concentrations with annual averages • Compare site data to national statistics • Stacked bar and scatter plots in approval
mode • Pollution and wind roses

42
Acknowledgments • Joann Rice, CSN Program Support, EPA • National Association of Clean Air Agencies
Steering Committee • Nick Mangus and Robert Coats, AQS Support,
EPA

43
Contact Us Jennifer DeWinter Kevin Cavender
DART Project Manager (STI) EPA PAMS Lead [email protected] [email protected]
Steve Brown Beth Landis Senior Atmospheric Scientist EPA CSN Lead [email protected] [email protected]