dairy marketing dr. roger ginder econ 338a fall 2007 lecture # 3
TRANSCRIPT

Dairy MarketingDr. Roger Ginder
Econ 338a
Fall 2007
Lecture # 3

MILK SUPPLY &DEMAND MILK SUPPLY &DEMAND
Supply – Farms & Cows– Regions– Production Systems– Quantities
Demand & Trends– Utilization– Consumers

TOTAL MILK SUPPLY
NO. COWS
X PROD. PER COW
____________________________
= MILK SUPPLY (TOT. PRODUCTION)

Total U.S. Milk ProductionTotal U.S. Milk Production
100,000
110,000
120,000
130,000
140,000
150,000
160,000
170,000
180,000
190,000
70 72 74 76 78 80 82 84 86 88 90 92 94 96 98 '00 '02 '04 '06
Mill
ion
s o
f lb
s.
Source: Dairy Yearbook, ERS & NASS

TOTAL MILK DEMAND
NO. CONSUMERS
X PER CAPITA MILK CONSUMPTION
________________________________
= MILK DEMAND

Total U.S. Milk Production and Total Commercial Disappearance, 1980-2006
Total U.S. Milk Production and Total Commercial Disappearance, 1980-2006
110,000
120,000
130,000
140,000
150,000
160,000
170,000
180,000
190,000
80 81 82 83 84 85 86 87 88 89 90 91 92 93 94 95 96 97 98 99 '00 '01 '02 '03 '04 '05 '06
Total Milk Production
Total Commercial Disapperance
Sources: Agricultural Statistics, NASS, USDA & Livestock, Dairy & Poultry, ERS, USDA
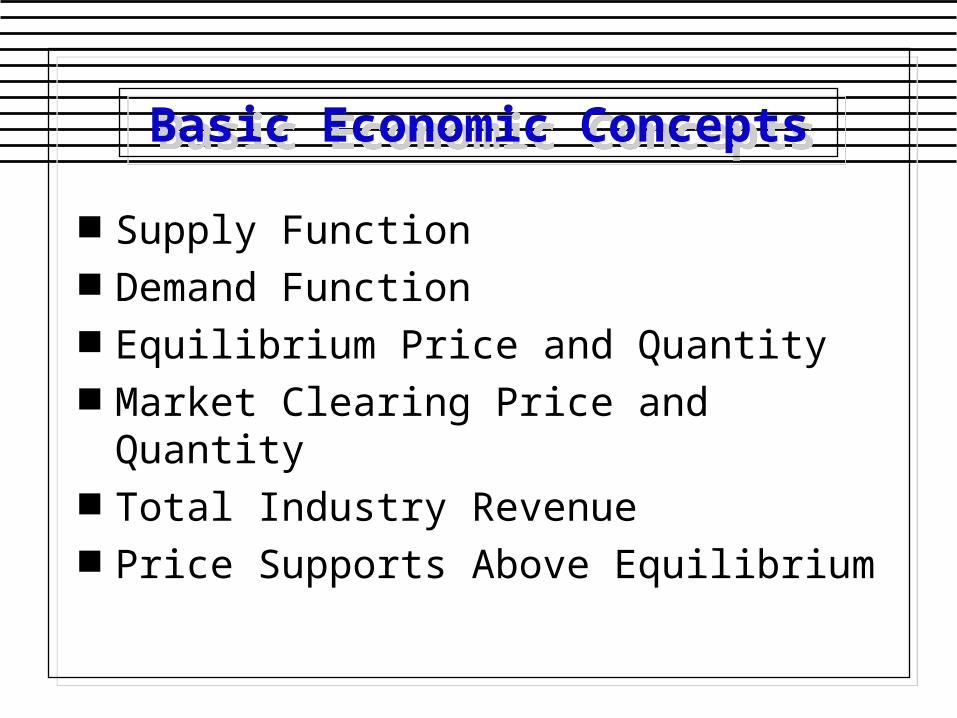
Basic Economic ConceptsBasic Economic Concepts
Supply Function Demand Function Equilibrium Price and Quantity Market Clearing Price and Quantity Total Industry Revenue Price Supports Above Equilibrium

Price
$/#
Pe
Supply
QeQuantity
# of milk supplied# of milk
demanded

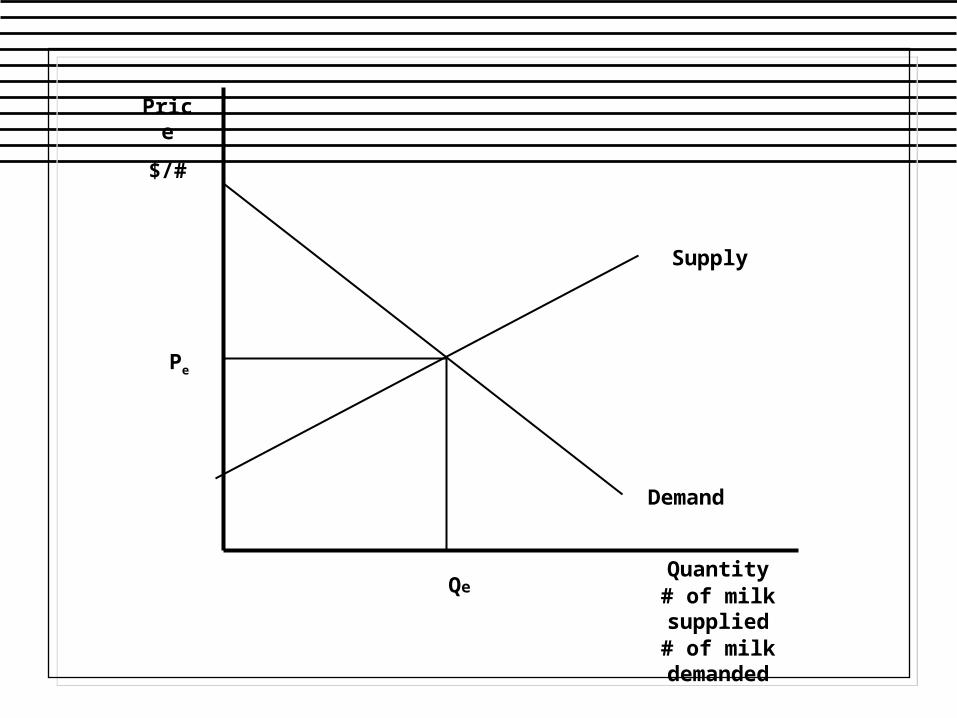
Price
$/#
Pe
Supply
Demand
QeQuantity
# of milk supplied# of milk
demanded
Price
$/#
Pe
Supply
Demand
QeQuantity
# of milk supplied# of milk
demanded

Price
$/#
Pe
Supply
Demand
QeQuantity
# of milk supplied# of milk
demandedTotal Revenue = P * Q

Total U.S. Milk Production and Total Commercial Disappearance, 1980-2006
Total U.S. Milk Production and Total Commercial Disappearance, 1980-2006
110,000
120,000
130,000
140,000
150,000
160,000
170,000
180,000
190,000
80 81 82 83 84 85 86 87 88 89 90 91 92 93 94 95 96 97 98 99 '00 '01 '02 '03 '04 '05 '06
Total Milk Production
Total Commercial Disapperance
Sources: Agricultural Statistics, NASS, USDA & Livestock, Dairy & Poultry, ERS, USDA
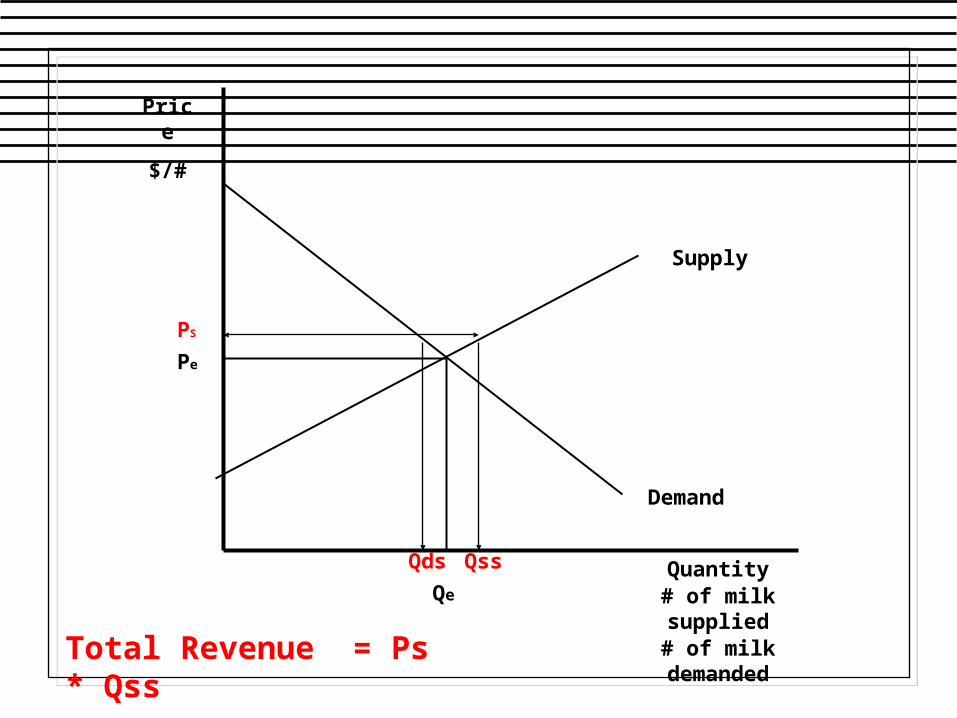
Price
$/#
Pe
Supply
Demand
Qe
Quantity# of milk supplied
# of milk demanded
PS
QssQds
Total Revenue = Ps * Qss
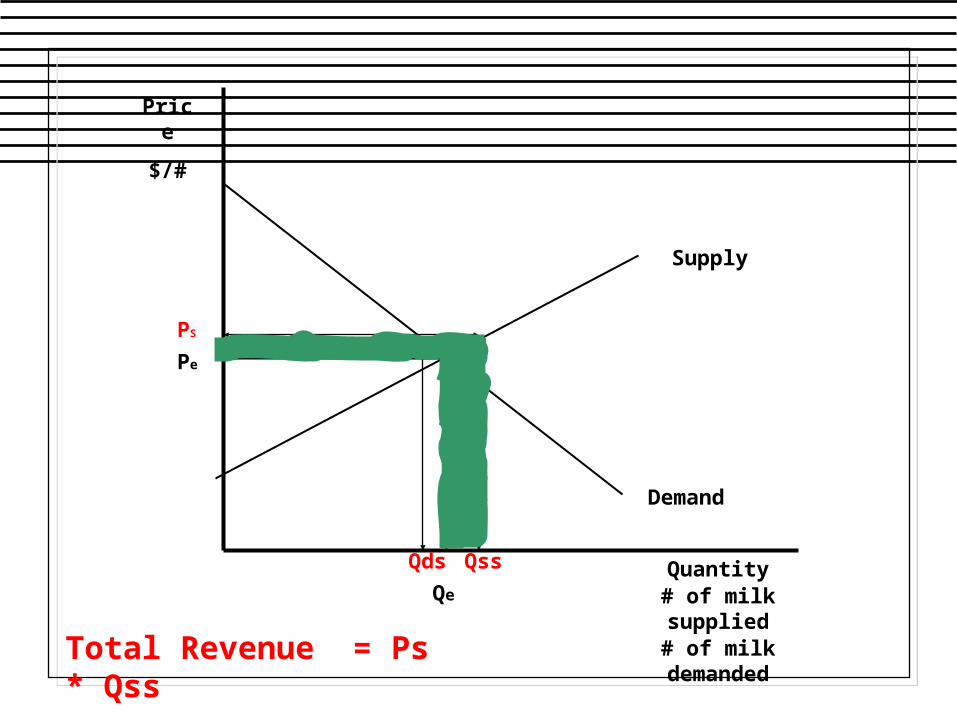
Price
$/#
Pe
Supply
Demand
Qe
Quantity# of milk supplied
# of milk demanded
PS
QssQds
Total Revenue = Ps * Qss

Total U.S. Milk Production and Total Commercial Disappearance, 1980-2006
Total U.S. Milk Production and Total Commercial Disappearance, 1980-2006
110,000
120,000
130,000
140,000
150,000
160,000
170,000
180,000
190,000
80 81 82 83 84 85 86 87 88 89 90 91 92 93 94 95 96 97 98 99 '00 '01 '02 '03 '04 '05 '06
Total Milk Production
Total Commercial Disapperance
Sources: Agricultural Statistics, NASS, USDA & Livestock, Dairy & Poultry, ERS, USDA

SUPPLY ISSUESSUPPLY ISSUES
FARMS
PRODUCTION SYSTEMS
COWS
PRODUCTION PER COW
LOCATION OF PRODUCTION
COSTS AND RETURNS

DEMAND ISSUESDEMAND ISSUES
PRODUCTS CONSUMED
PER CAPITA CONSUMPTION
POPULATION GROWTH
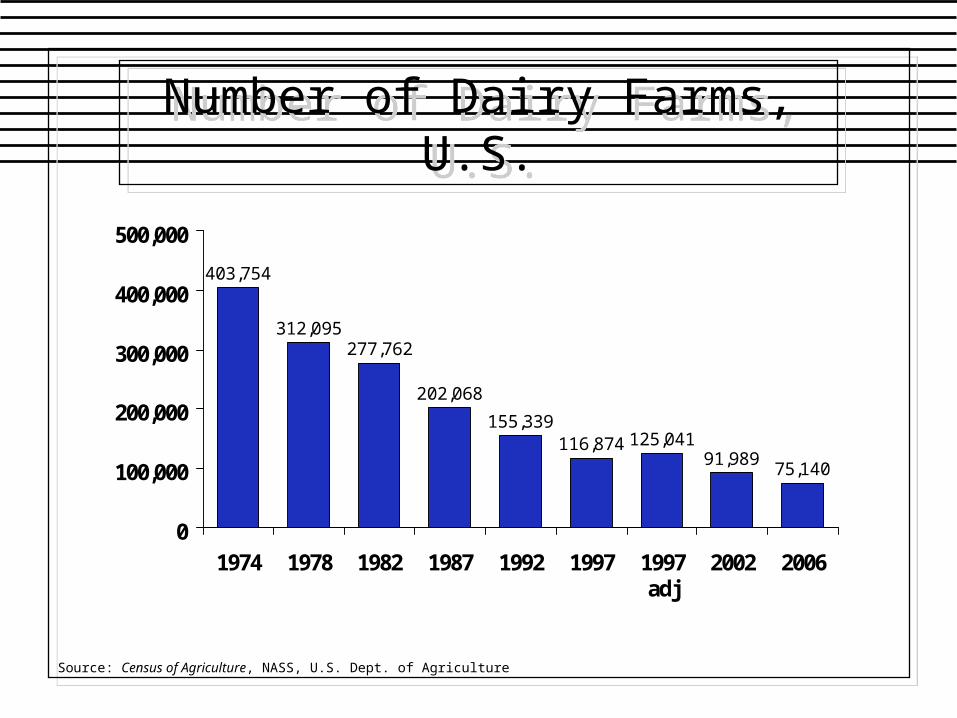
Number of Dairy Farms, U.S.Number of Dairy Farms, U.S.
403,754
312,095277,762
202,068
155,339116,874 125,041
91,98975,140
0
100,000
200,000
300,000
400,000
500,000
1974 1978 1982 1987 1992 1997 1997adj
2002 2006
Source: Census of Agriculture, NASS, U.S. Dept. of Agriculture

Number of Iowa Dairy FarmsNumber of Iowa Dairy Farms
18,213
12,623
10,485
7,748
5,878
4,208 4,2723,034 2,400
0
5,000
10,000
15,000
20,000
1974 1978 1982 1987 1992 1997 1997adj
2002 2006
Source: Census of Agriculture, NASS, U.S. Dept. of Agriculture
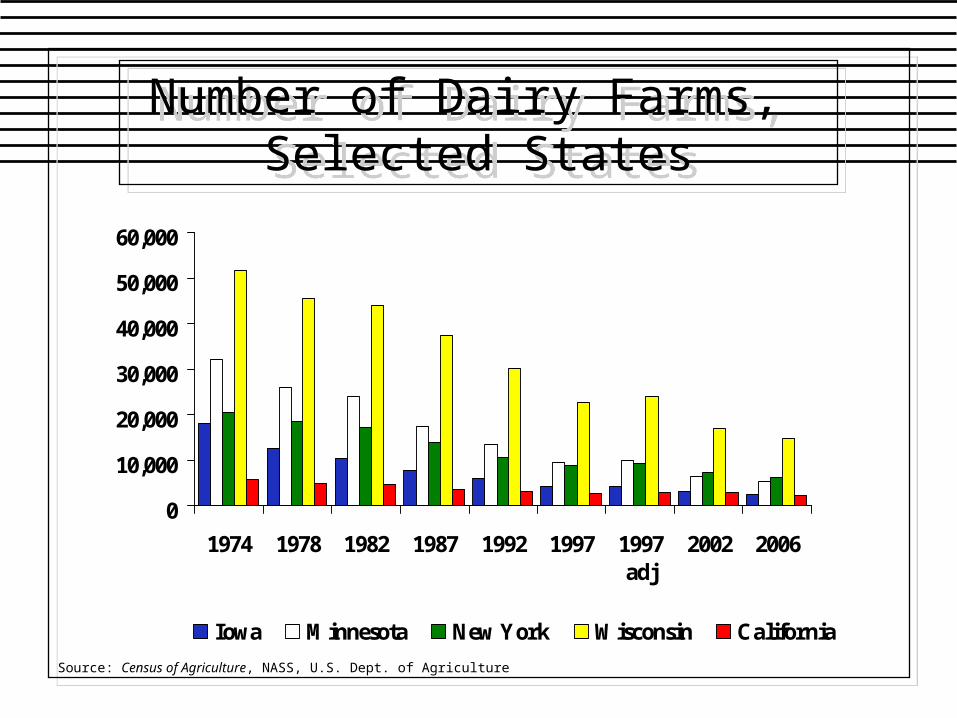
Number of Dairy Farms, Selected States
Number of Dairy Farms, Selected States
0
10,000
20,000
30,000
40,000
50,000
60,000
1974 1978 1982 1987 1992 1997 1997adj
2002 2006
Iowa Minnesota New York Wisconsin California
Source: Census of Agriculture, NASS, U.S. Dept. of Agriculture

Number of Dairy Cows, U.S.Number of Dairy Cows, U.S.
10,224
10,0469,993
9,826
9,6889,581
9,4949,4669,372
9,2529,1569,206
9,115 9,0839,010
9,154 9,1399,1209,041
9,030 proj.
8,400
8,600
8,800
9,000
9,200
9,400
9,600
9,800
10,000
10,200
10,400
88 90 92 94 96 98 '00
'02
'04
'06
Th
ou
san
ds
of
Co
ws
Source: NASS, USDA, on-line database, 3/28/05

Number of Dairy Cows, IowaNumber of Dairy Cows, Iowa
264255 251
241230 225 220 215 210 209 201 193 194
205 210
0
50
100
150
200
250
300
93 94 95 96 97 98 99 '00 '01 '02 '03 '04 '05 '06 '07
Th
ou
san
ds
of
Co
ws
Source: NASS, USDA, on-line database, 3/23/05
Proj.
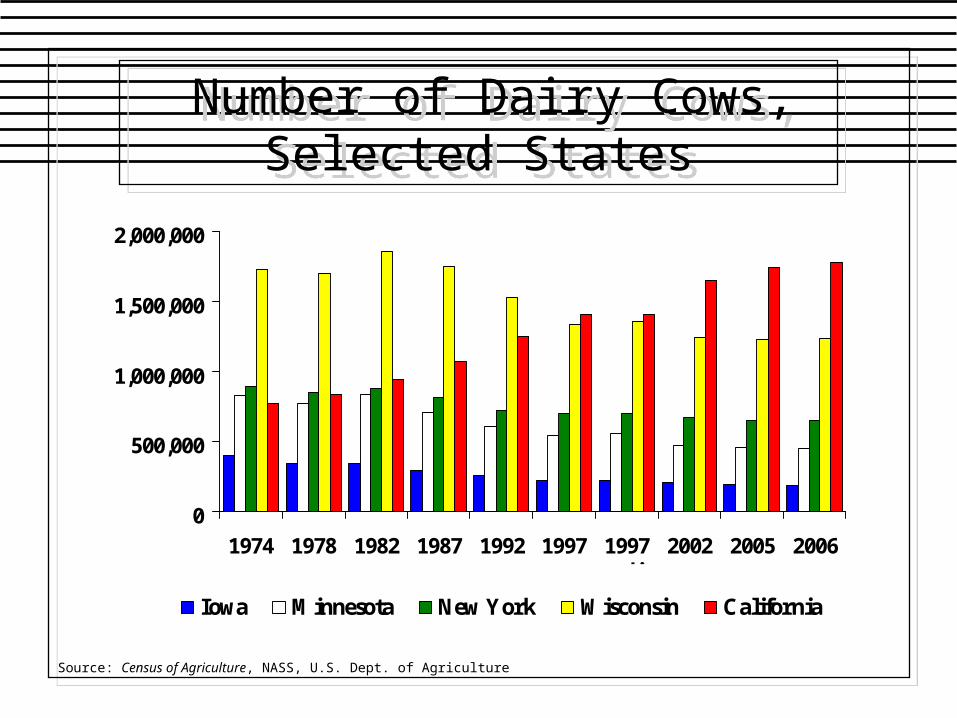
Number of Dairy Cows,Selected States
Number of Dairy Cows,Selected States
0
500,000
1,000,000
1,500,000
2,000,000
1974 1978 1982 1987 1992 1997 1997adj
2002 2005 2006
Iowa Minnesota New York Wisconsin California
Source: Census of Agriculture, NASS, U.S. Dept. of Agriculture
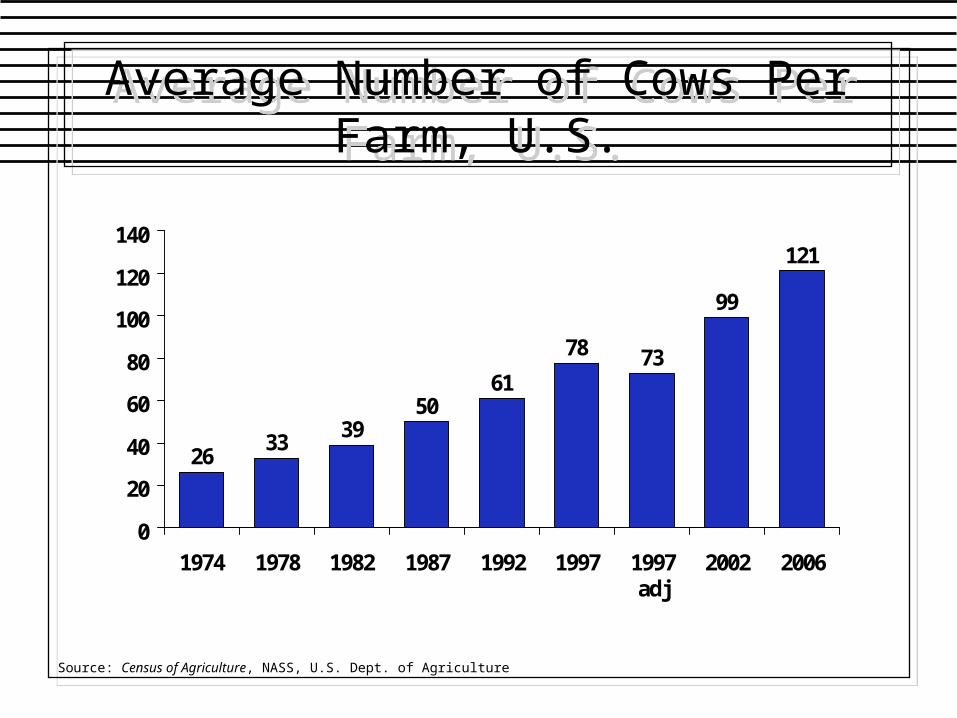
Average Number of Cows Per Farm, U.S.Average Number of Cows Per Farm, U.S.
2633
3950
61
78 73
99
121
0
20
40
60
80
100
120
140
1974 1978 1982 1987 1992 1997 1997adj
2002 2006
Source: Census of Agriculture, NASS, U.S. Dept. of Agriculture
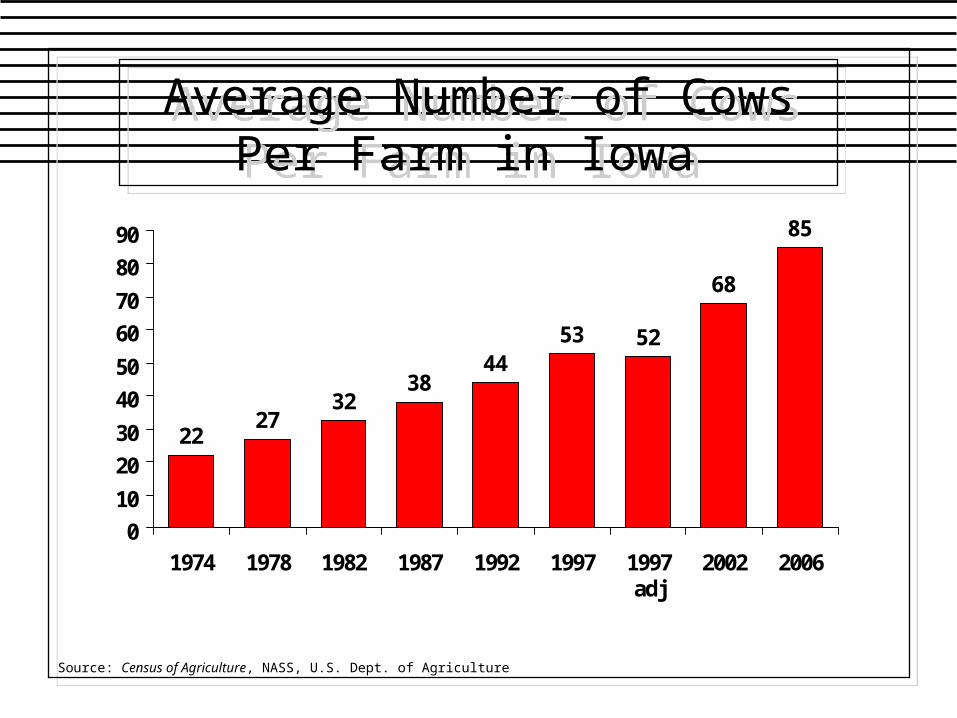
Average Number of Cows Per Farm in Iowa
Average Number of Cows Per Farm in Iowa
2227
3238
4453 52
68
85
0
10
20
30
40
50
60
70
80
90
1974 1978 1982 1987 1992 1997 1997adj
2002 2006
Source: Census of Agriculture, NASS, U.S. Dept. of Agriculture

Average Number of Cows Per Farm, Selected States
Average Number of Cows Per Farm, Selected States
0100200300400500600700800900
Iowa Minnesota New York Wisconsin California
Source: Census of Agriculture, NASS, U.S. Dept. of Agriculture
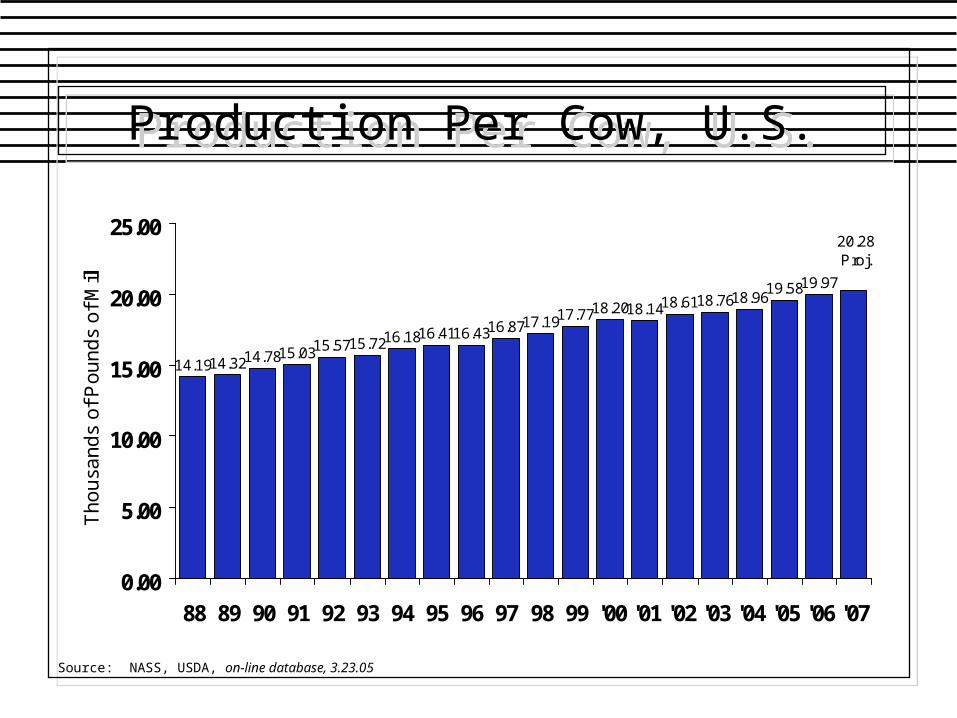
Production Per Cow, U.S.Production Per Cow, U.S.
14.1914.3214.7815.0315.5715.7216.1816.4116.4316.8717.1917.7718.2018.1418.6118.7618.9619.5819.97
20.28Proj.
0.00
5.00
10.00
15.00
20.00
25.00
88 89 90 91 92 93 94 95 96 97 98 99 '00 '01 '02 '03 '04 '05 '06 '07
Th
ou
san
ds
of
Po
un
ds
of
Milk
Source: NASS, USDA, on-line database, 3.23.05
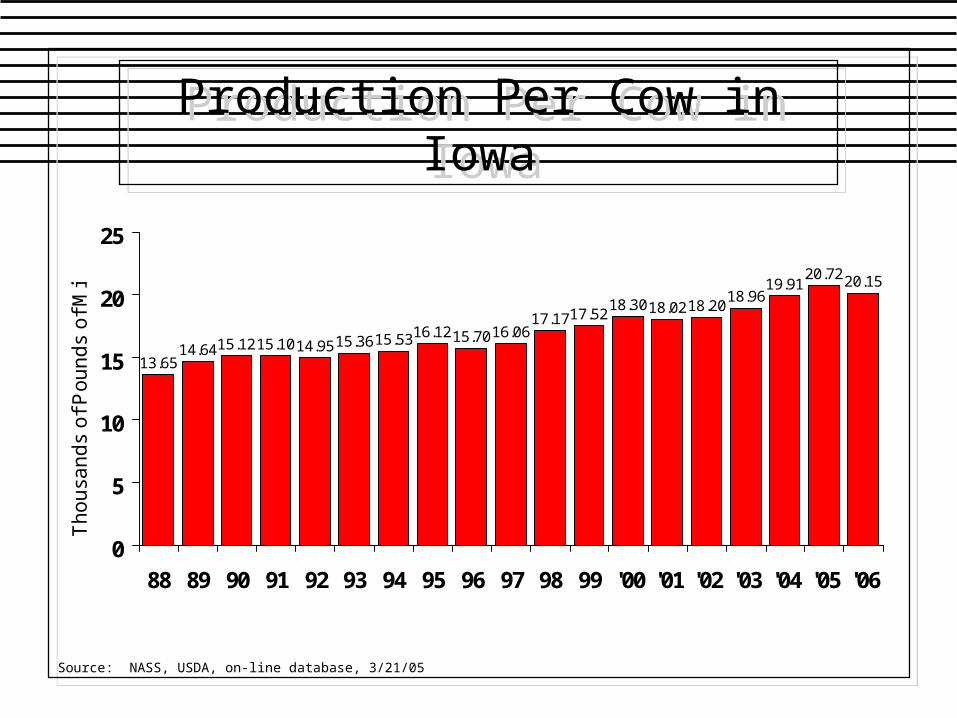
Production Per Cow in IowaProduction Per Cow in Iowa
13.6514.6415.1215.1014.9515.3615.5316.1215.7016.06
17.1717.5218.3018.0218.20
18.9619.91
20.7220.15
0
5
10
15
20
25
88 89 90 91 92 93 94 95 96 97 98 99 '00 '01 '02 '03 '04 '05 '06
Th
ou
san
ds
of
Po
un
ds
of
Milk
Source: NASS, USDA, on-line database, 3/21/05

Production Per Cow, Selected StatesProduction Per Cow, Selected States
0
5,000
10,000
15,000
20,000
Po
un
ds o
f M
ilk
Iowa Minnesota New York Wisconsin California
Source: NASS, USDA, on-line database, 3/21/05

USDA, Federal Milk Market Administrator, Tulsa, 2/2002

USDA, Federal Milk Market Administrator, Tulsa, 2/2005

USDA, Federal Milk Market Administrator, Tulsa, 2/2005

Number of Cows & Production Per Cow, U.S.
Number of Cows & Production Per Cow, U.S.
8,4008,6008,8009,0009,2009,4009,6009,800
10,00010,20010,400
88 90 92 94 96 98 '00
'02
'04
'06
Th
ou
san
ds
of
Co
ws
0
5,000
10,000
15,000
20,000
25,000
Lb
s. of M
ilk
Number of Cows Production Per Cow
Source: NASS, USDA, on-line database, 3/21/05
U.S.DAIRY PRODUCTION--SUPPLY
U.S.DAIRY PRODUCTION--SUPPLY
The Production “Plant”– Production Systems used– Producer Size Vs. Production
Share
Geographic Distribution of Milk Production
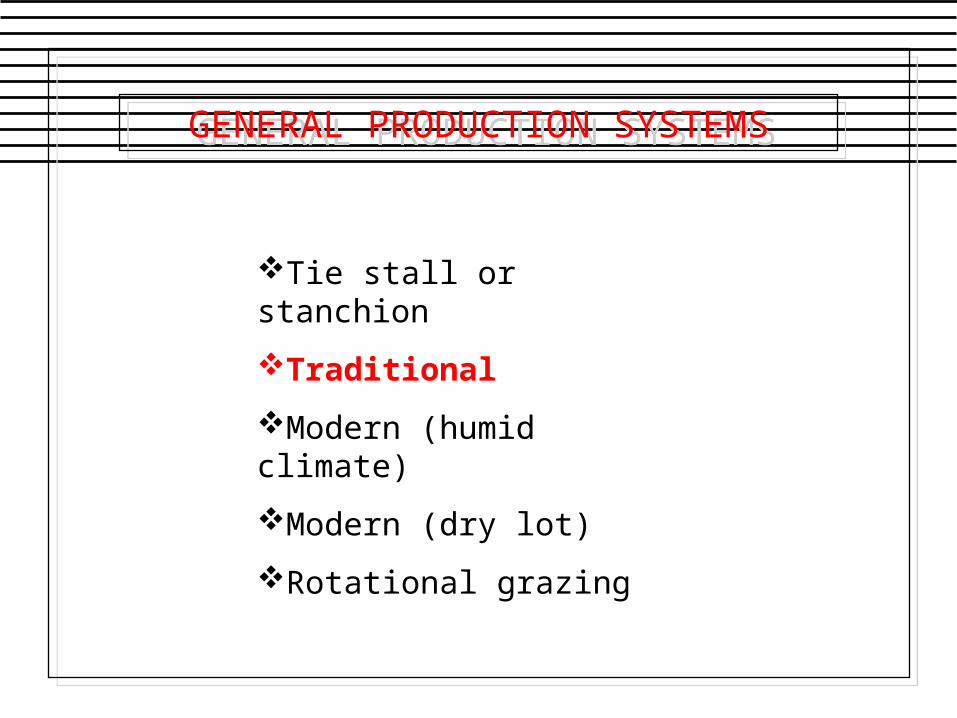
GENERAL PRODUCTION SYSTEMSGENERAL PRODUCTION SYSTEMS
Tie stall or stanchion
Traditional
Modern (humid climate)
Modern (dry lot)
Rotational grazing

DAIRY PRODUCTION METHODS AND FACILITIES
DAIRY PRODUCTION METHODS AND FACILITIES
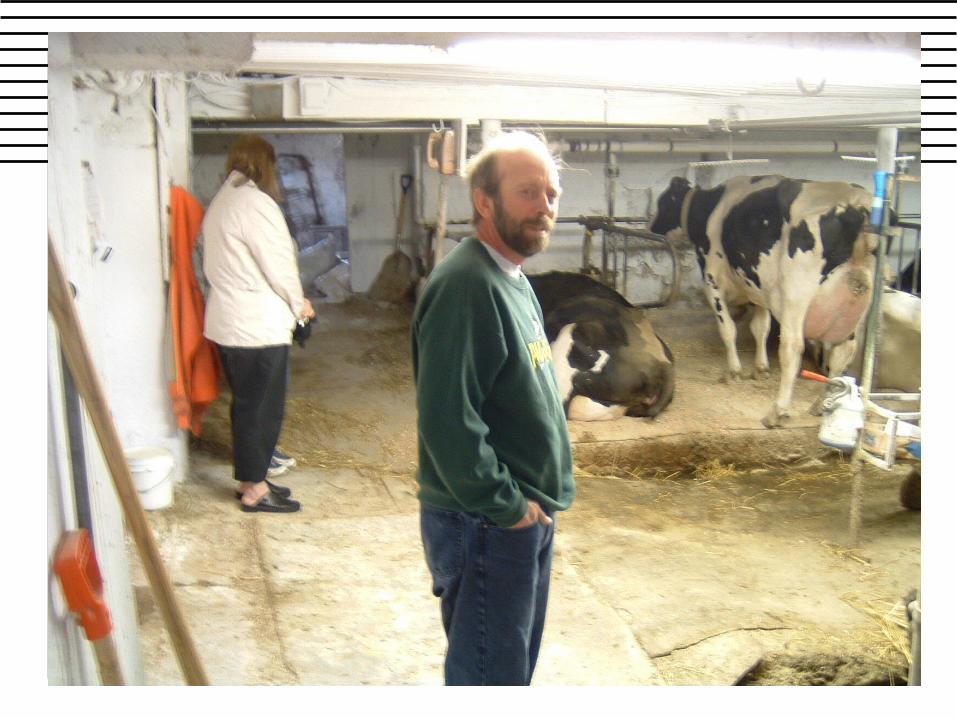
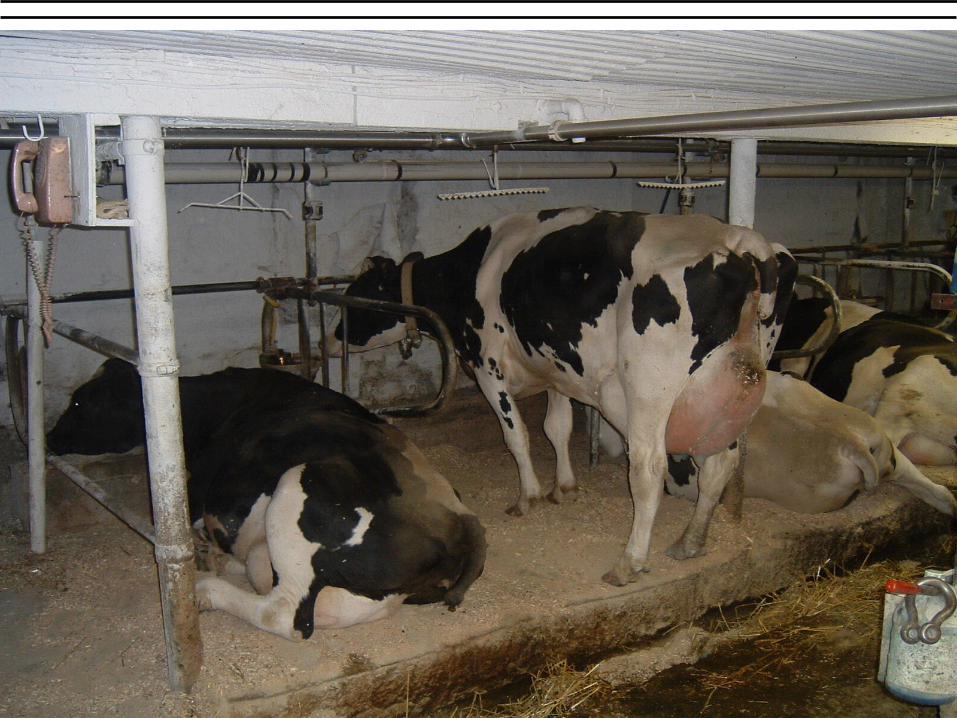
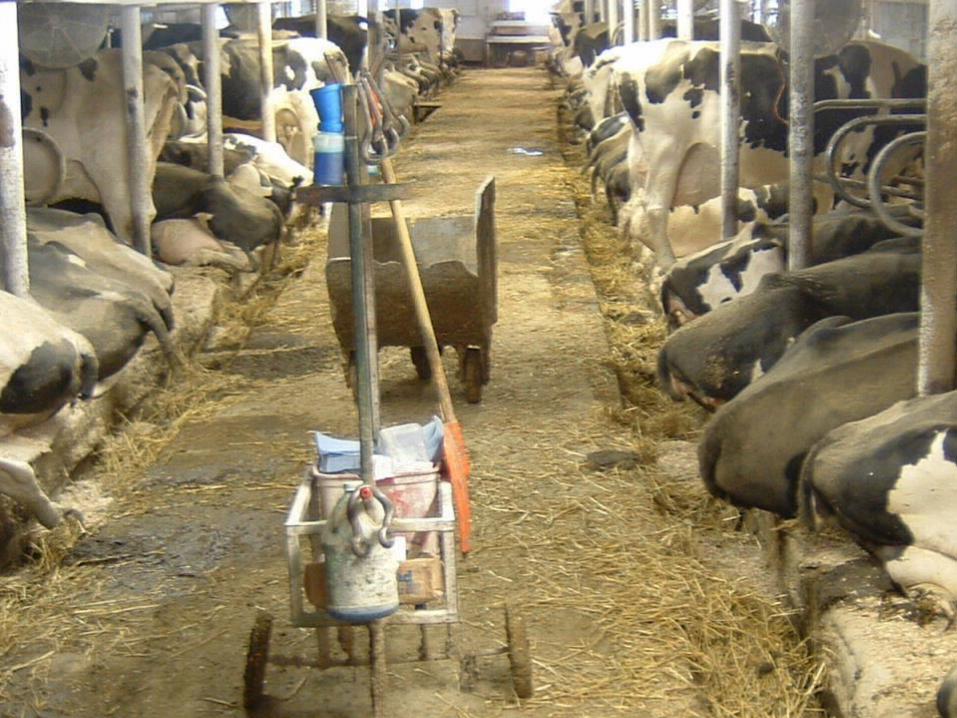
Tie stall (stanchion) barn system– Cows tethered, milked, bedded in
stall– Milking unit moved stall-to-stall– Pipeline system through barn– Feed brought to cow– Loft and silo for feed– Smaller operations (less 100 cows)

DAIRY PRODUCTION METHODS AND FACILITIES
DAIRY PRODUCTION METHODS AND FACILITIES
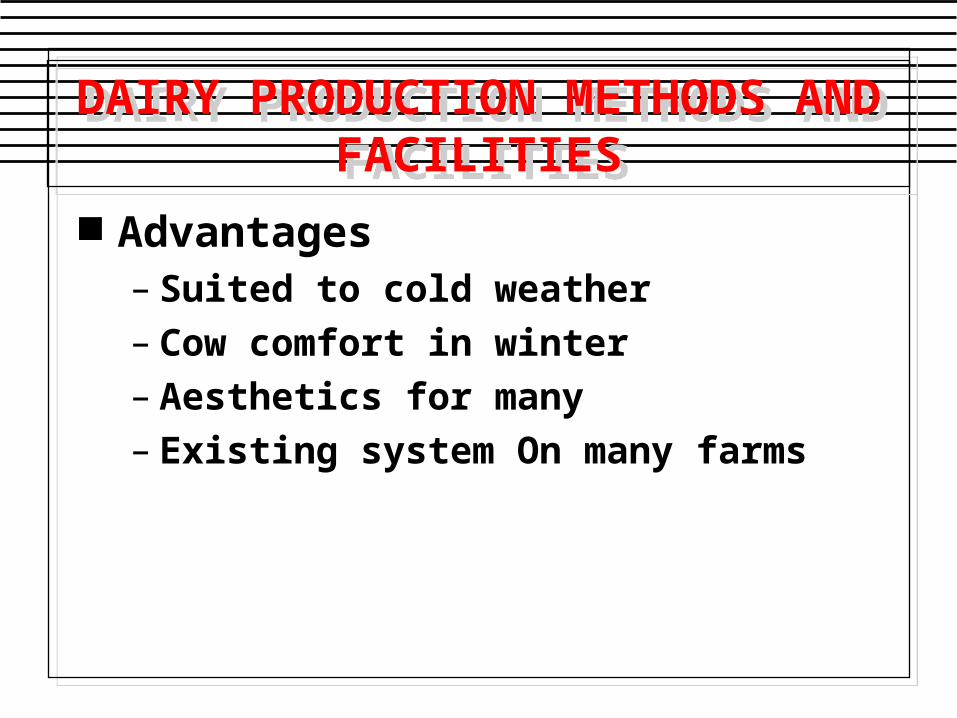
Advantages– Suited to cold weather– Cow comfort in winter– Aesthetics for many– Existing system On many farms
DAIRY PRODUCTION METHODS AND FACILTIES
DAIRY PRODUCTION METHODS AND FACILTIES
Problems– Labor intensive– High cost - $7,000-$10,000/cow
(with land and cows)– Expansion is difficult– Purchasing and handling
ingredients in volume can be difficult


DAIRY PRODUCTION METHODS AND FACILITIES
DAIRY PRODUCTION METHODS AND FACILITIES
Advantages– Suited to cold weather– Cow comfort in winter– Aesthetics for many– Existing system On many farms

DAIRY PRODUCTION METHODS AND FACILTIES
DAIRY PRODUCTION METHODS AND FACILTIES
Problems– Labor intensive– High cost - $7,000-$10,000/cow
(with land and cows)– Expansion is difficult– Purchasing and handling
ingredients in volume can be difficult
GENERAL PRODUCTION SYSTEMSGENERAL PRODUCTION SYSTEMS
Tie stall or stanchion
Traditional
Modern (humid climate)
Modern (dry lot)
Rotational grazing

DAIRY PRODUCTION METHODS AND FACILITIES
DAIRY PRODUCTION METHODS AND FACILITIES
“Traditional” system– Milking and housing are
separated– Housing in some type of
confinement system»Concrete corrals»“Utah” stalls (open with roof over
head)»Free stall housing (dry stalls)
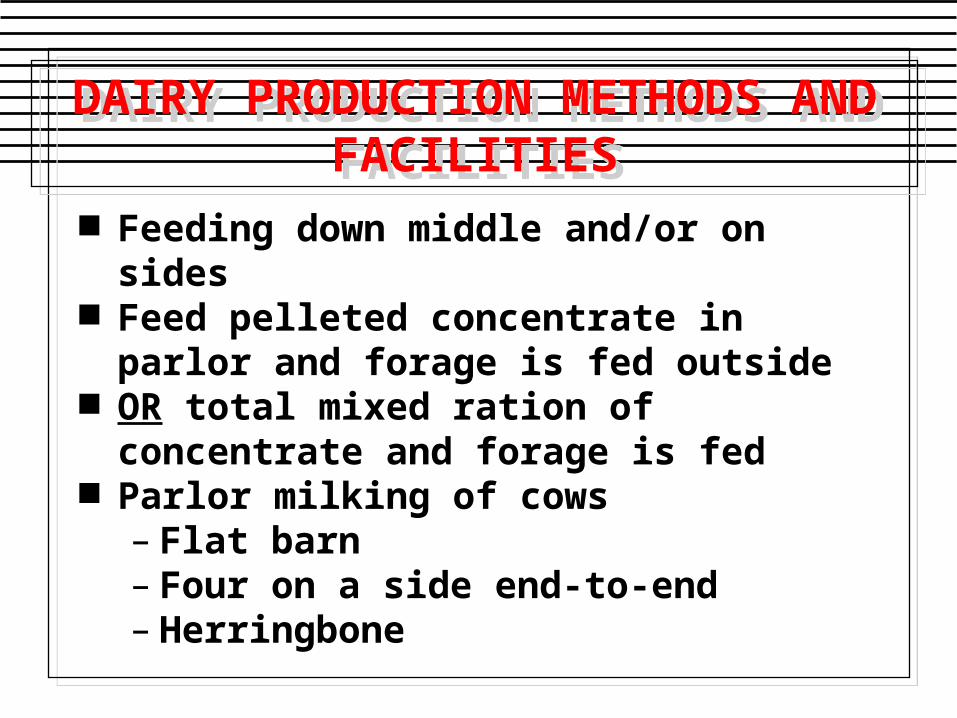
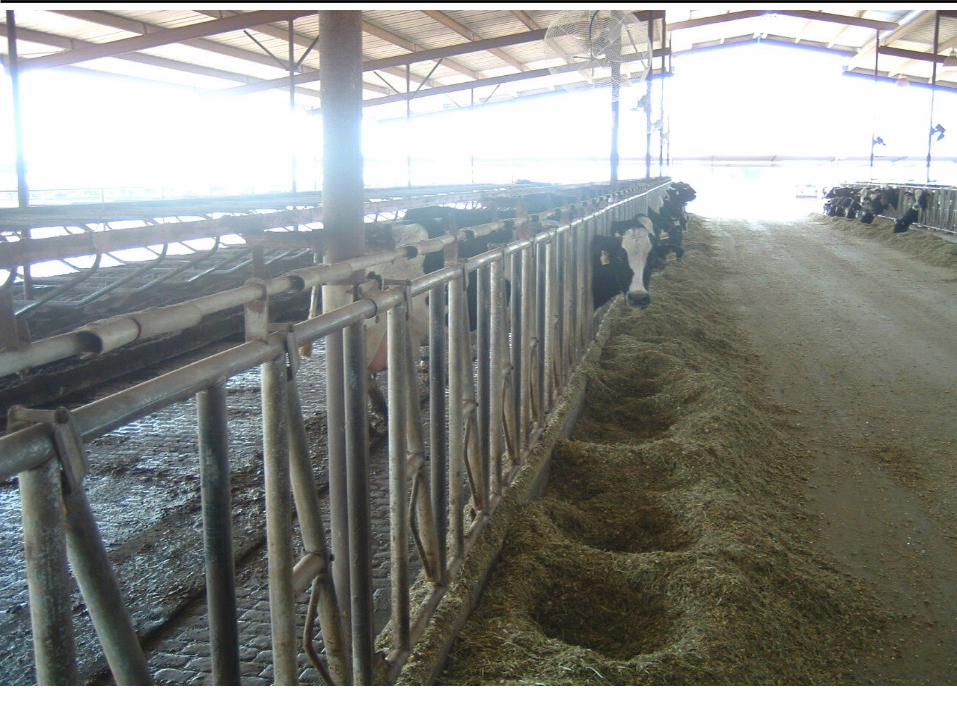
DAIRY PRODUCTION METHODS AND FACILITIES
DAIRY PRODUCTION METHODS AND FACILITIES
Feeding down middle and/or on sides
Feed pelleted concentrate in parlor and forage is fed outside
OR total mixed ration of concentrate and forage is fed
Parlor milking of cows– Flat barn– Four on a side end-to-end– Herringbone

DAIRY PRODUCTION METHODS AND FACILITIES
DAIRY PRODUCTION METHODS AND FACILITIES
Advantages– Adaptable to climate variability– Adapted to home production of
forages/grains– Adaptable to diversified family farm
Problems– Labor requirements– Cost $4,000-$7,000/cow (with land and
cows)– Smaller size and input purchasing levels

GENERAL PRODUCTION SYSTEMSGENERAL PRODUCTION SYSTEMS
Tie stall or stanchion
Traditional
Modern (humid climate)
Modern (dry lot)
Rotational grazing
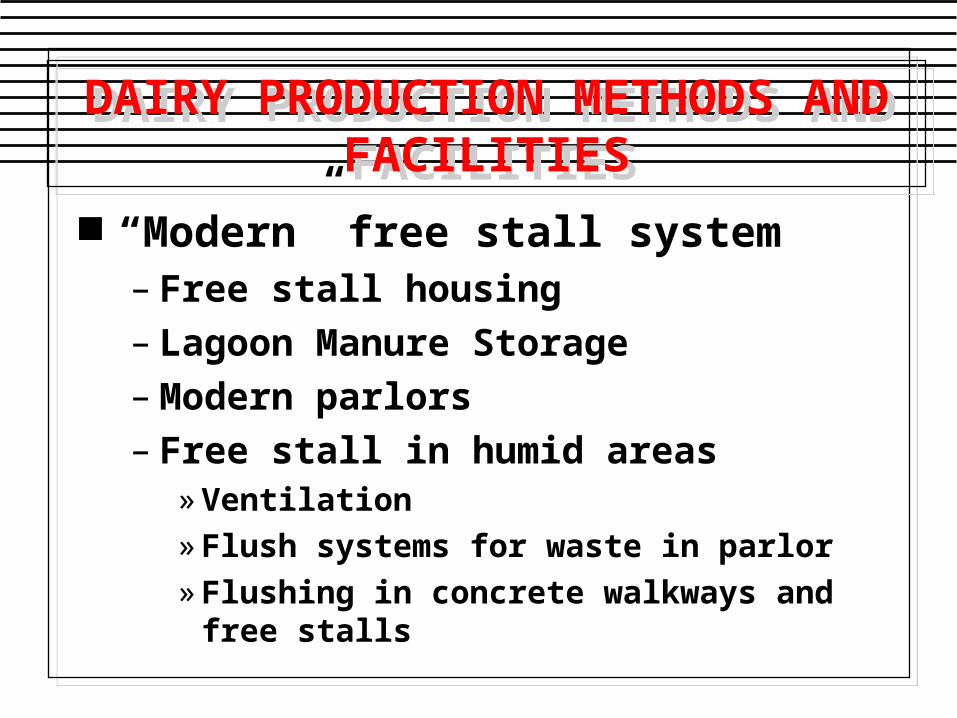
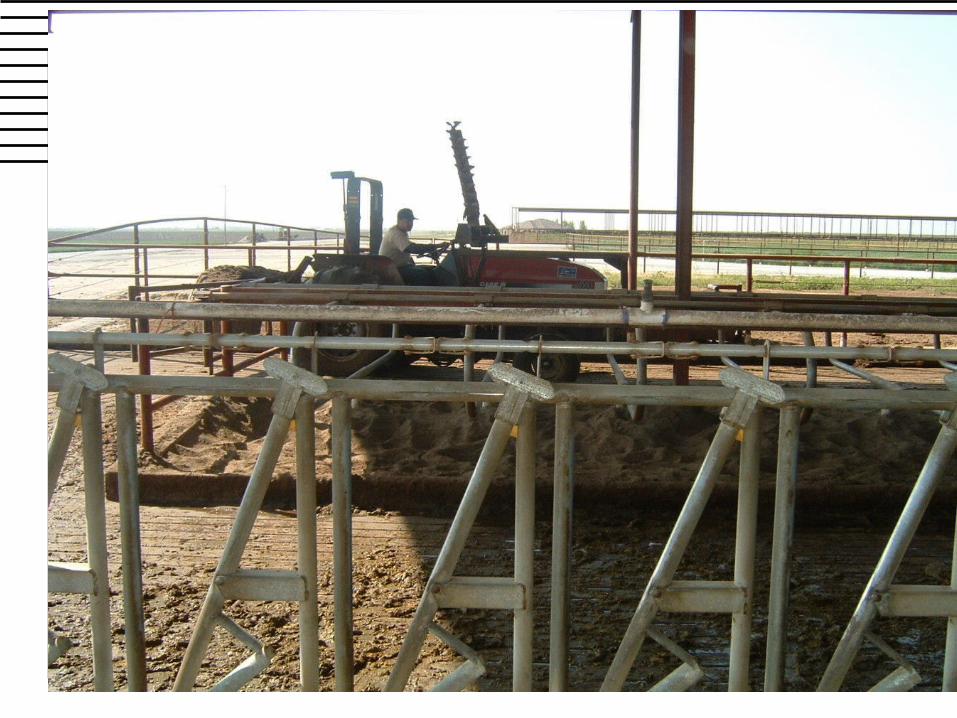
DAIRY PRODUCTION METHODS AND FACILITIES
DAIRY PRODUCTION METHODS AND FACILITIES
“Modern” free stall system– Free stall housing– Lagoon Manure Storage– Modern parlors– Free stall in humid areas
»Ventilation»Flush systems for waste in parlor»Flushing in concrete walkways and
free stalls
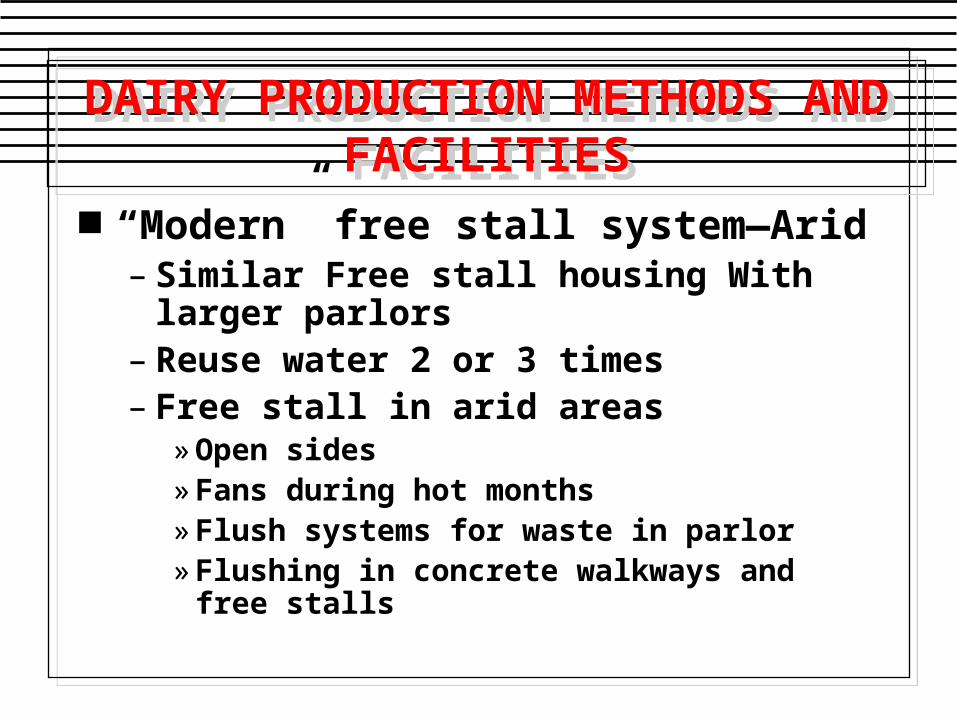
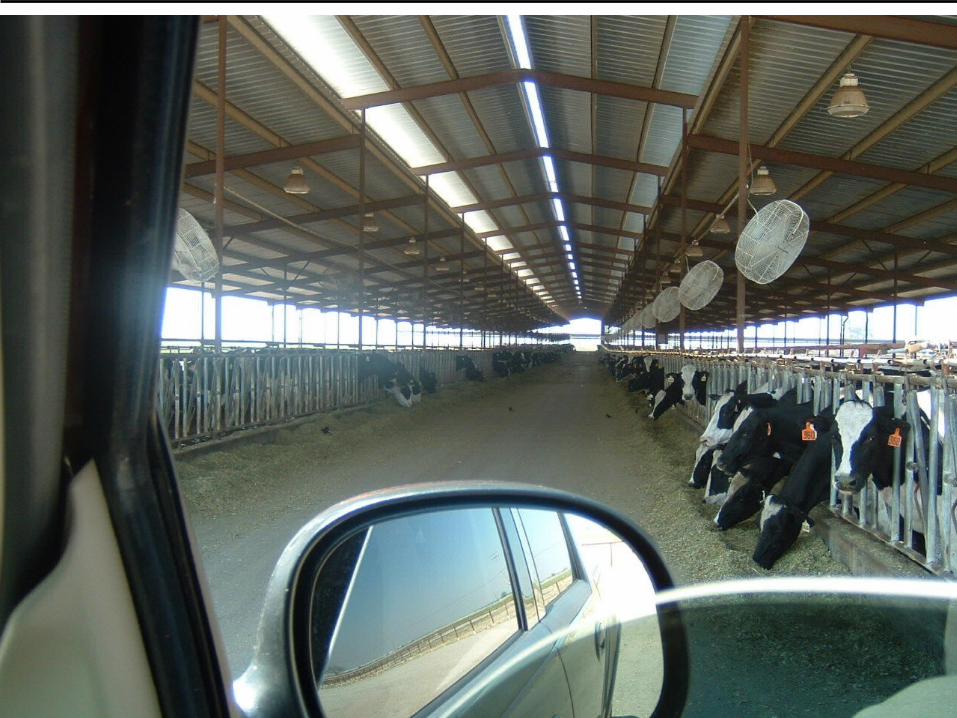
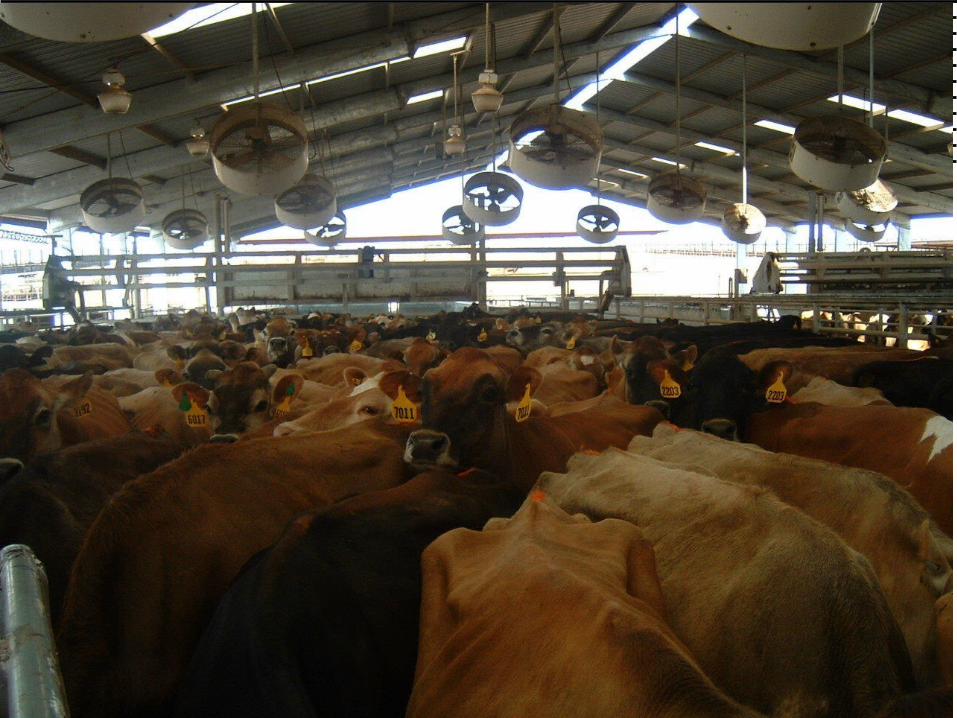
DAIRY PRODUCTION METHODS AND FACILITIES
DAIRY PRODUCTION METHODS AND FACILITIES
“Modern” free stall system—Arid – Similar Free stall housing With
larger parlors– Reuse water 2 or 3 times– Free stall in arid areas
»Open sides »Fans during hot months»Flush systems for waste in parlor»Flushing in concrete walkways and
free stalls


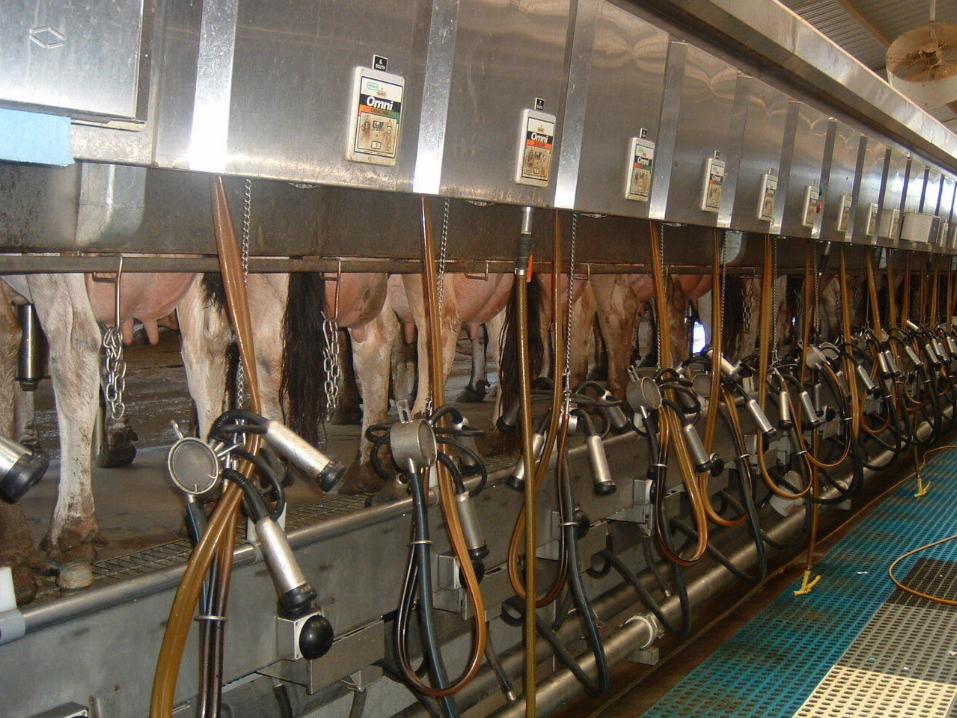
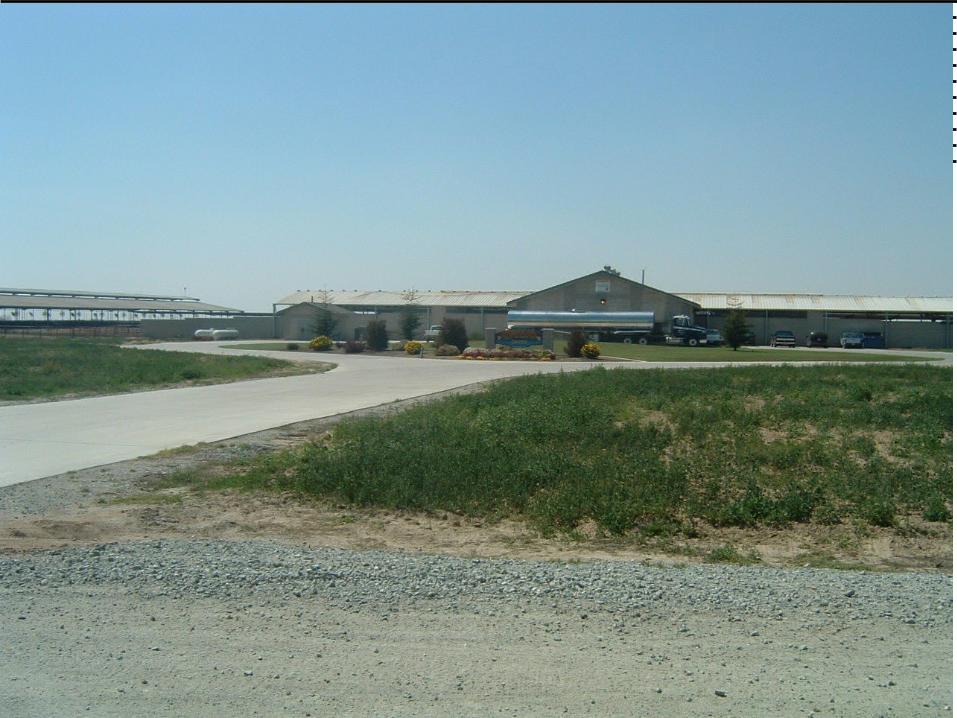
DAIRY PRODUCTION METHODS AND FACILITIES
DAIRY PRODUCTION METHODS AND FACILITIES
Milking Parlors – High Capacity– Many use 3X milking schedule– Operate more or less continuously
24/7– Large bulk tank capacity geared to
tanker pickup


Questions?Questions?