daimler ag: corporate presentation / spring 2015
TRANSCRIPT

1
Corporate Presentation Spring 2015
Contents
2
HIGHLIGHTS AND RESULTS FOR Q1 2015
OUTLOOK FOR 2015
DIVISIONAL INFORMATION
APPENDIX
DAIMLER GROUP STRATEGY

Mercedes-Benz Cars: product highlights
3
Research vehicle F 015 Luxury in Motion
New Mercedes-Benz GLE Coupé New Mercedes-Benz CLA Shooting Brake
New Mercedes-Maybach S 600 Pullman

Daimler Trucks: product highlights
4
BharatBenz tractor trailers
Mercedes-Benz Actros wins the “Fuel Duel” Mercedes-Benz Econic NGT with natural-gas engine
Western Star 5700XE
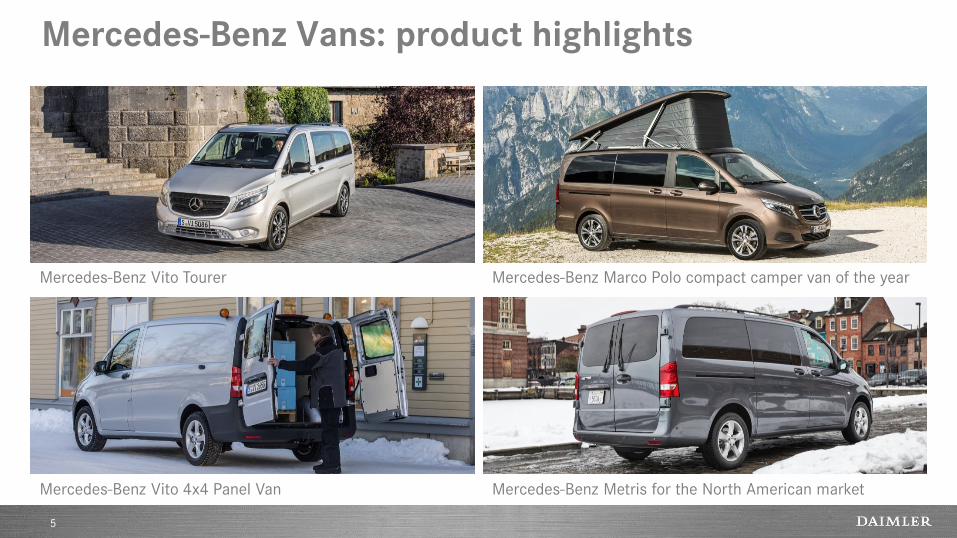
Mercedes-Benz Vans: product highlights
5
Mercedes-Benz Metris for the North American market
Mercedes-Benz Vito Tourer Mercedes-Benz Marco Polo compact camper van of the year
Mercedes-Benz Vito 4x4 Panel Van

Daimler Buses: product highlights
6
Setra TopClass 400 double-decker bus
Mercedes-Benz CapaCity L Mercedes-Benz and Setra buses in annual winter tests
Setra ComfortClass 500 and TopClass 500

Highlights of Q1 2015
7
+13%
+18%
+41%
641,600
459,700
€2.9bn
Group unit sales
Highest unit sales ever at Mercedes-Benz Cars
Increase in EBIT from ongoing business
Start of production of the new Mercedes-Benz CLA Shooting Brake
World premiere of the new research vehicle F 015 Luxury in Motion
World debut of the new Mercedes-Maybach S 600 Pullman
Premiere of the new Mercedes-Benz GLE Coupé
Premiere of the new Mercedes-Benz Metris mid-size van for North America

Key financials
8
– in billions of euros –
Q1 2014 Q1 2015
Revenue 29.5 34.2
EBIT
as reported 1.8 2.9
from ongoing business 2.1 2.9
Net profit 1.1 2.1
Earnings per share (in euros) 0.96 1.83
Net liquidity industrial business (2014: year-end) 17.0 20.5
Free cash flow industrial business 0.7 2.3

Key balance sheet figures
9
Daimler Group Dec. 31, 2014 March 31, 2015
Equity ratio 22.1% 21.0%
Gross liquidity 16.3 19.0
Industrial business
Equity ratio 40.8% 37.7%
Net liquidity 17.0 20.5
– in billions of euros –
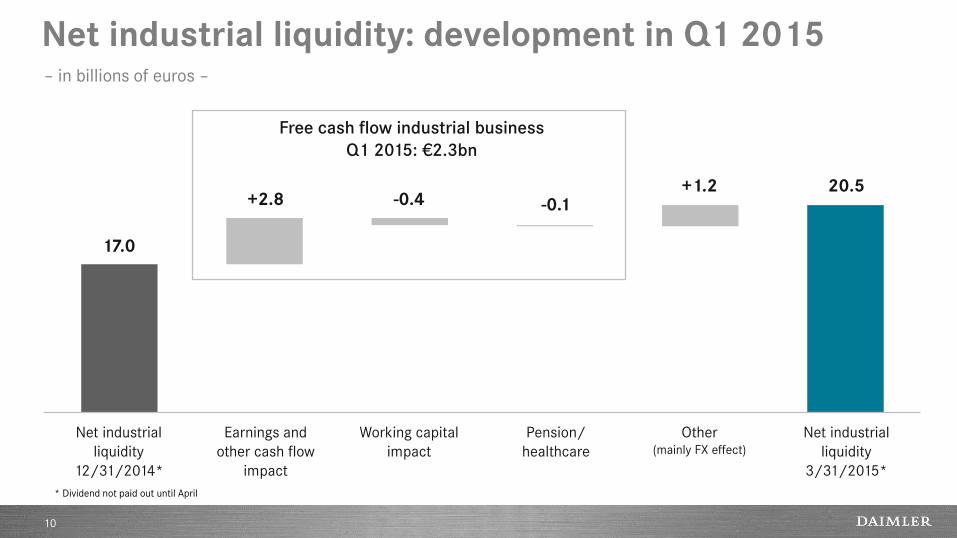
Net industrial liquidity: development in Q1 2015
10
– in billions of euros –
Free cash flow industrial business
Q1 2015: €2.3bn
Net industrial
liquidity
12/31/2014*
Earnings and
other cash flow
impact
Working capital
impact
Other (mainly FX effect)
Net industrial
liquidity
3/31/2015*
-0.4 20.5 +1.2
17.0
+2.8 -0.1
Pension/
healthcare
* Dividend not paid out until April

Unit sales
11
Q1 2014 Q1 2015 % change
Daimler Group 565.8 641.6 +13
of which
Mercedes-Benz Cars 389.5 459.7 +18
Daimler Trucks 108.5 112.4 +4
Mercedes-Benz Vans 61.1 63.8 +4
Daimler Buses 6.7 5.7 -15
– in thousands of units –

Revenue by division
12
Q1 2014 Q1 2015 % change
Daimler Group 29.5 34.2 +16
of which
Mercedes-Benz Cars 17.0 19.5 +15
Daimler Trucks 7.1 8.4 +18
Mercedes-Benz Vans 2.2 2.4 +9
Daimler Buses 0.9 0.9 +2
Daimler Financial Services 3.8 4.5 +19
Contract volume of
Daimler Financial Services* 99.0 108.7 +10
– in billions of euros –
* Figures as of December 31, 2014 and March 31, 2015.
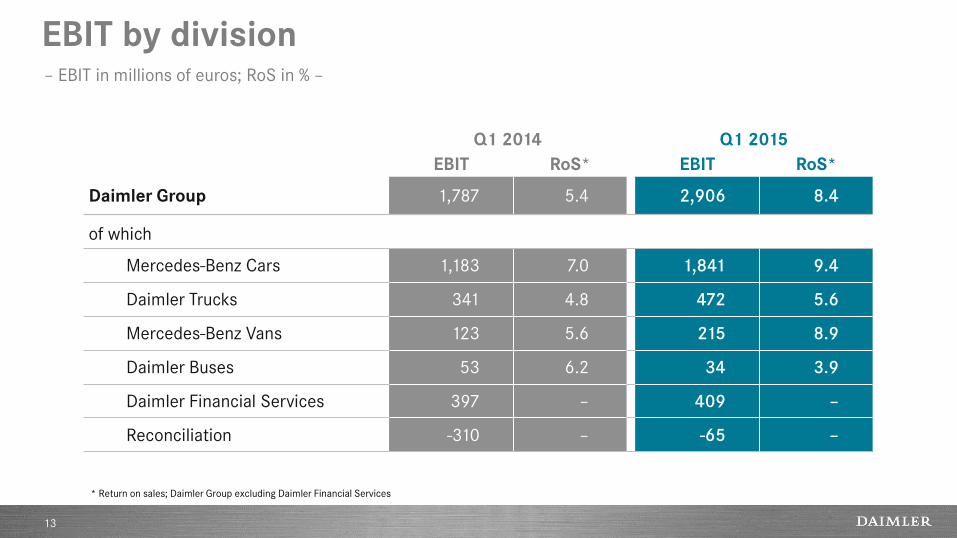
EBIT by division
13
Q1 2014 Q1 2015
EBIT RoS* EBIT RoS*
Daimler Group 1,787 5.4 2,906 8.4
of which
Mercedes-Benz Cars 1,183 7.0 1,841 9.4
Daimler Trucks 341 4.8 472 5.6
Mercedes-Benz Vans 123 5.6 215 8.9
Daimler Buses 53 6.2 34 3.9
Daimler Financial Services 397 – 409 –
Reconciliation -310 – -65 –
* Return on sales; Daimler Group excluding Daimler Financial Services
– EBIT in millions of euros; RoS in % –
Contents
14
HIGHLIGHTS AND RESULTS FOR Q1 2015
OUTLOOK FOR 2015
DIVISIONAL INFORMATION
APPENDIX
DAIMLER GROUP STRATEGY

Clear aspiration for all our divisions
15
15
Daimler Buses Daimler Trucks Mercedes-Benz
Vans Daimler Financial
Services
“Most successful
premium
manufacturer”
Mercedes-Benz Cars
“No 1 in
the global truck
business”
“Best financial
and mobility
services
provider”
“No 1 in the
global bus
business”
“Most successful
player in
worldwide van
business”

Profit targets
16
Profit targets [Return on Sales / Return on Equity1) in %]
1) Daimler Financial Services
Return on sales-target for the automotive business : 9 percent
9 6 17 10
Mercedes-Benz
Cars
8 Daimler
Trucks Mercedes-Benz
Vans
Daimler
Buses
Daimler
Financial Services

The four strategic growth areas of Daimler
17
Core business
Clean, safe, connected Mobility concepts &
DigitalLife
New growth markets

Contents
18
HIGHLIGHTS AND RESULTS FOR Q1 2015
OUTLOOK FOR 2015
DIVISIONAL INFORMATION
APPENDIX
DAIMLER GROUP STRATEGY

19
Mercedes-Benz Cars

20
Mercedes-Benz GLE Coupe
4 new high-margin
Mercedes-Benz
SUVs in 2015
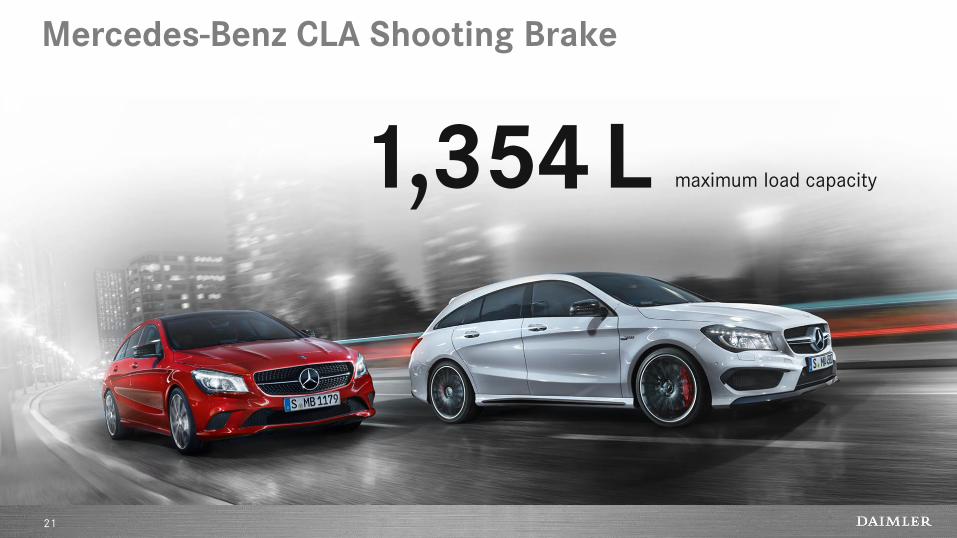
21
maximum load capacity 1,354 L
Mercedes-Benz CLA Shooting Brake

22
from zero to 100 km/h
3.8 s
Mercedes-AMG GT S: Fuel consumption urban/extra-urban/combined: 12,5-12,2/7,9-7,8/9,6-9,4 l/100 km,
CO2 emissions combined: 224-219 g/km.
Mercedes-AMG GT

23
Mercedes-AMG GT S: Fuel consumption urban/extra-urban/combined: 12,5-12,2/7,9-7,8/9,6-9,4 l/100 km,
CO2 emissions combined: 224-219 g/km.
By significantly expanding our portfolio we create the basis for further profitable growth
… +
24
Mercedes-AMG GT S: Fuel consumption urban/extra-urban/combined: 12,5-12,2/7,9-7,8/9,6-9,4 l/100 km,
CO2 emissions combined: 224-219 g/km.
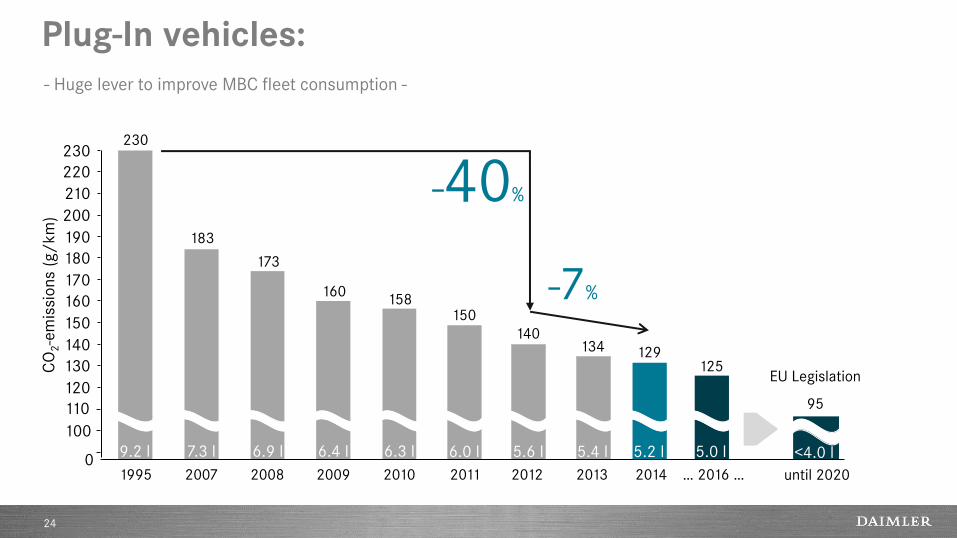
Plug-In vehicles:
24
- Huge lever to improve MBC fleet consumption -
230
220
210
200
190
180
170
160
150
140
2009
173
2008
183
0 2007
158
1995
120
2011 2010
130
160
CO
2-e
mis
sio
ns
(g/
km
)
9.2 l 7.3 l 6.9 l 6.3 l 6.4 l
150
6.0 l
2012
125
5.0 l
… 2016 …
100
110
140
5.6 l
230
-40%
until 2020
95
<4.0 l
EU Legislation
2013
134
5.4 l
-7%
129
5.2 l
2014
25
Mercedes-AMG GT S: Fuel consumption urban/extra-urban/combined: 12,5-12,2/7,9-7,8/9,6-9,4 l/100 km,
CO2 emissions combined: 224-219 g/km.
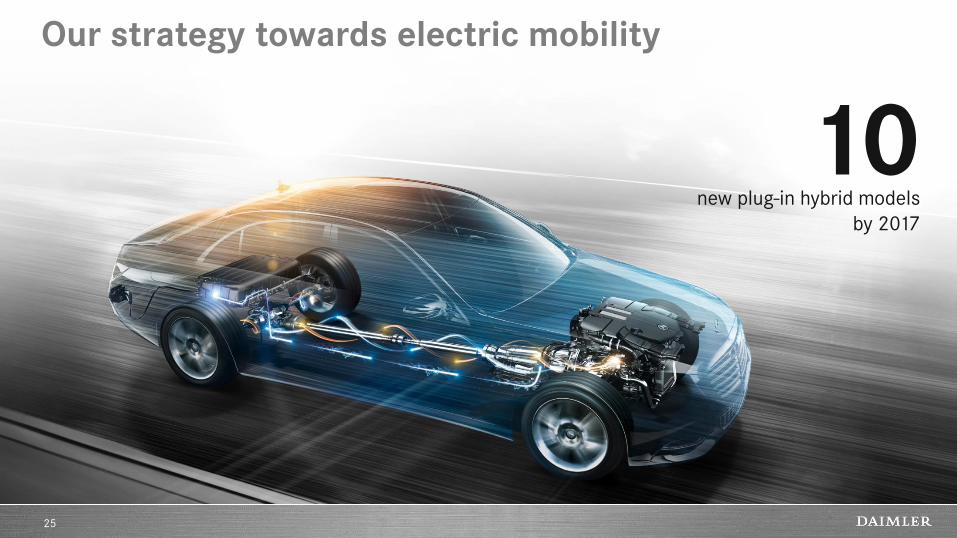
10 new plug-in hybrid models
by 2017
Our strategy towards electric mobility
25

26
Mercedes-AMG GT S: Fuel consumption urban/extra-urban/combined: 12,5-12,2/7,9-7,8/9,6-9,4 l/100 km,
CO2 emissions combined: 224-219 g/km.
C-Class 350 e
26
31 km range in all-electric mode
2.1 l fuel per 100 kilometres

Product offensive to fuel our sales offensive
2014 1992 2025
Current Product
offensive
Mercedes-Benz sales development
First product
offensive
530 k
1.63 m
Schematic
representation
27
Current Product
offensive
First product
offensive

Mercedes-AMG GT S: Fuel consumption urban/extra-urban/combined: 12,5-12,2/7,9-7,8/9,6-9,4 l/100 km,
CO2 emissions combined: 224-219 g/km.
Efficiency increase for profitable growth
28
2020 Today
Asset and fixed cost development
Revenue growth
Our growth plan
Schematic
representation

China: key market for our growth plans
≫300,000 2015 units sales target
for Mercedes-Benz in China
29
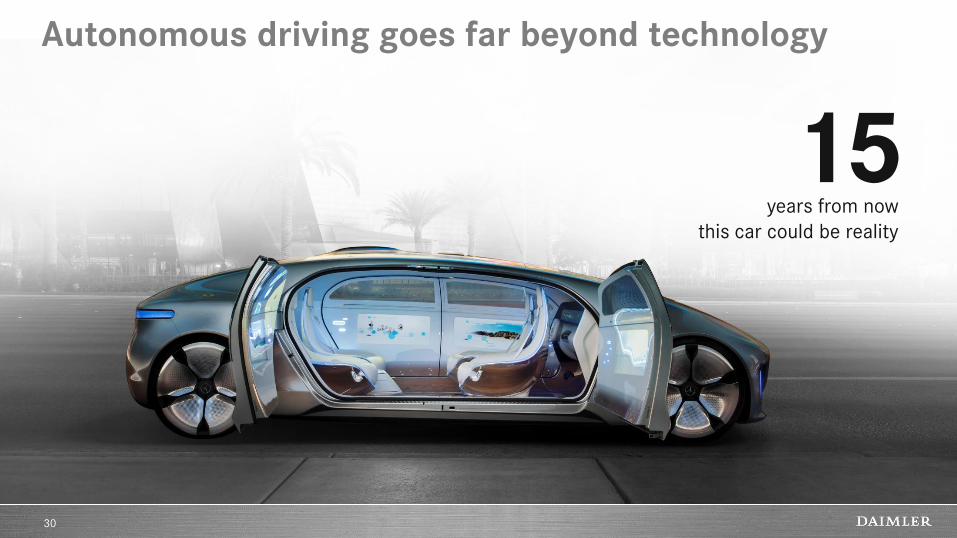
30
15 years from now
this car could be reality
Autonomous driving goes far beyond technology

31
Daimler Trucks

Broadest and strongest truck portfolio in history
32

We’re focusing our energy on the right issues
33
Technology leadership in efficiency, safety and
connectivity
Global Market Presence in traditional and
emerging markets
Intelligent Platforms for tailored products and
decisive economies of scale

Efficiency: the most efficient trucks are Daimler Trucks
34
~11% ~7% ~5%
*Average saving versus competitor vehicles in over 600 so-called “fuel duels” in European fleets in 2014.
Mercedes-Benz Actros Freightliner Cascadia Evolution Fuso Super Great V
less fuel than “fuel duel” competitors* less fuel than previous model
below Fuel Efficiency Standard in Japan

Safety: step by step towards autonomous driving with the Future Truck 2025
35

Connectivity: the truck becomes part of an interacting environment
36
+6% uptime Driver Headquarters
Technician Service
-20% repair costs

Grow our strong position in core markets, develop our position in emerging markets
37
China NAFTA
Japan
Europe
Brazil
India
Southeast
Asia
Latin America
Middle
East
Africa
Asia Business Model
Russia

India, Africa: product offensive continues
38
New BharatBenz trucks for India
New FUSO trucks from India for
Africa, Asia, and Latin America
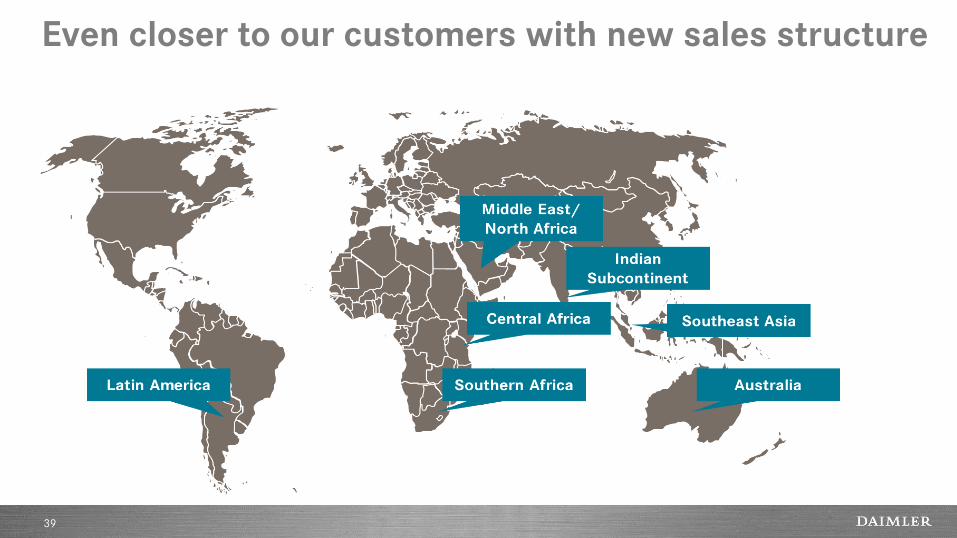
Even closer to our customers with new sales structure
39

NAFTA: integrated powertrain components are real game-changers
40
Heavy Duty Engines - DD15 & DD13
89% Penetration
Automated Manual Transmission – DT12
23% Penetration
Front Axle
70% Penetration
Rear Axle
50% Penetration
Status: Year end 2014
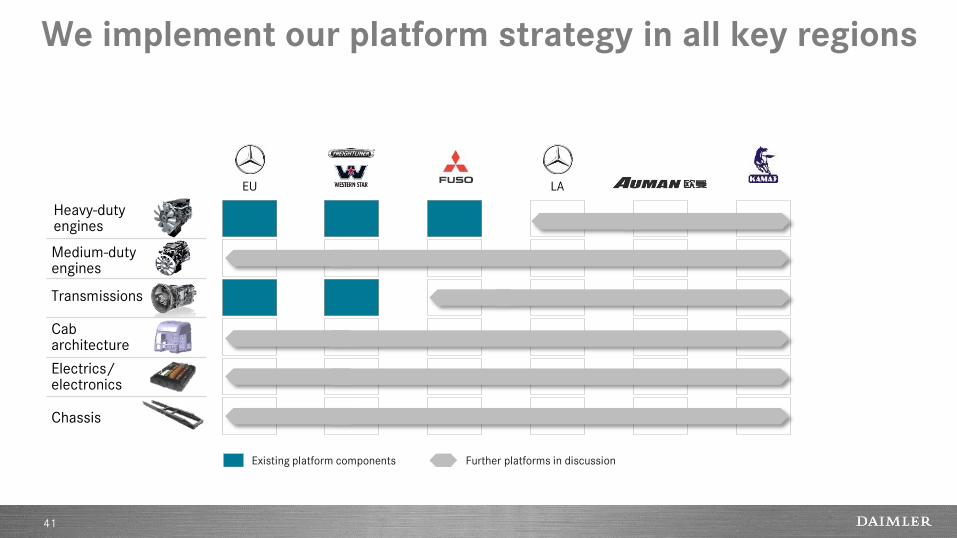
We implement our platform strategy in all key regions
41
Transmissions
Cab architecture
Electrics/ electronics
Chassis
EU LA
Medium-duty engines
Heavy-duty engines
Existing platform components Further platforms in discussion

Our target: undisputed leader in the truck industry
42
Sales target In thousand units
496
2014
>500
2015
700
2020
Profitability target Return on Sales in %
over the cycle

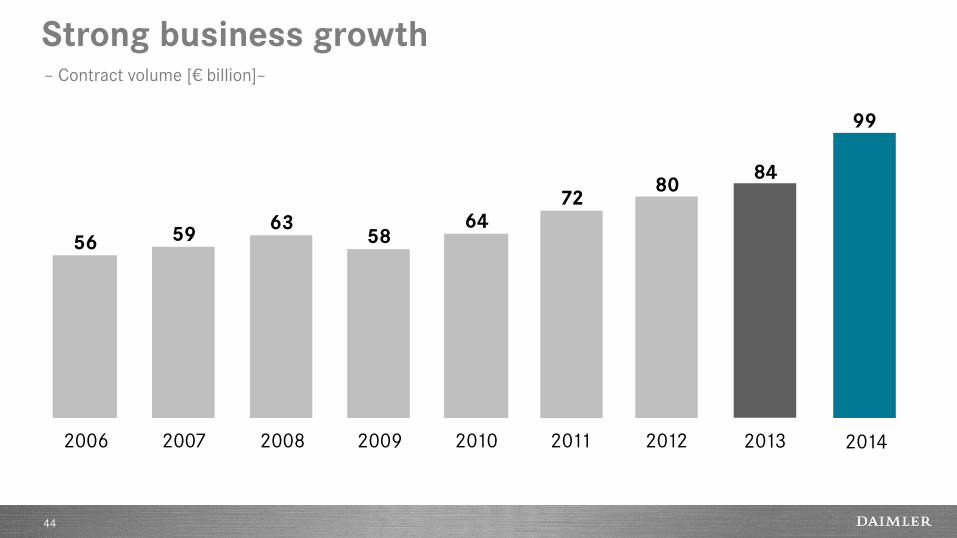
44
Strong business growth – Contract volume [€ billion]–
56 59 63
58 64
72
2006 2007 2008 2009 2010 2011
80
2012
84
2013
99
2014

Services become an ever-more important part of our business model
45
* Global average penetration rate with regard to passenger cars and commercial vehicles
Financing
Leasing Insurance
Fleet Management
Banking Services
Mobility Services
Mercedes-Benz Rent
Nearly every second vehicle
delivered to customers worldwide
is being financed or leased*

46
>1,000,000 people use our mobility services
Mobility services on growth path

Contents
47
HIGHLIGHTS AND RESULTS FOR Q1 2015
OUTLOOK FOR 2015
DIVISIONAL INFORMATION
APPENDIX
DAIMLER GROUP STRATEGY
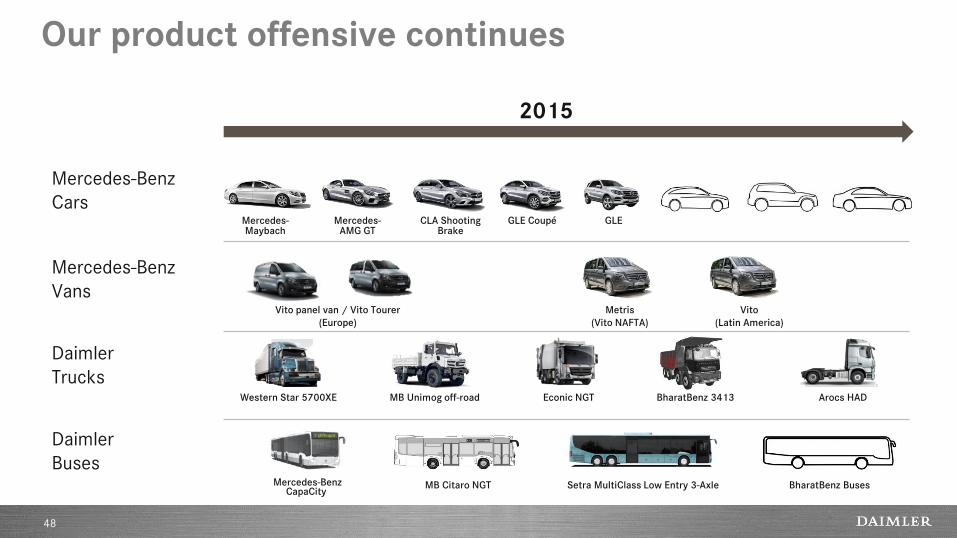
Our product offensive continues
2015
Mercedes-Benz
Vans
Daimler
Buses
Daimler
Trucks
Mercedes-Benz
Cars Mercedes-
AMG GT
Western Star 5700XE Econic NGT MB Unimog off-road
BharatBenz Buses
Arocs HAD
Setra MultiClass Low Entry 3-Axle
BharatBenz 3413
MB Citaro NGT
• 2015
Mercedes-Maybach
CLA Shooting Brake
GLE Coupé
Metris
(Vito NAFTA)
Vito
(Latin America)
Vito panel van / Vito Tourer
(Europe)
Mercedes-Benz CapaCity
GLE
48

Assumptions for automotive markets in 2015
49
Car markets
Global
Western Europe
Medium- and
heavy-duty truck
markets
NAFTA region
Europe
Japan*
Brazil
Europe
Bus markets Europe
Brazil
around +3%
slight growth
+10 to 15%
+5 to 10%
around the prior year level
around -30%
slight growth
slight growth
at least -20%
USA slight growth
Van markets
* including light-duty trucks
Indonesia* around -20%
China significant growth
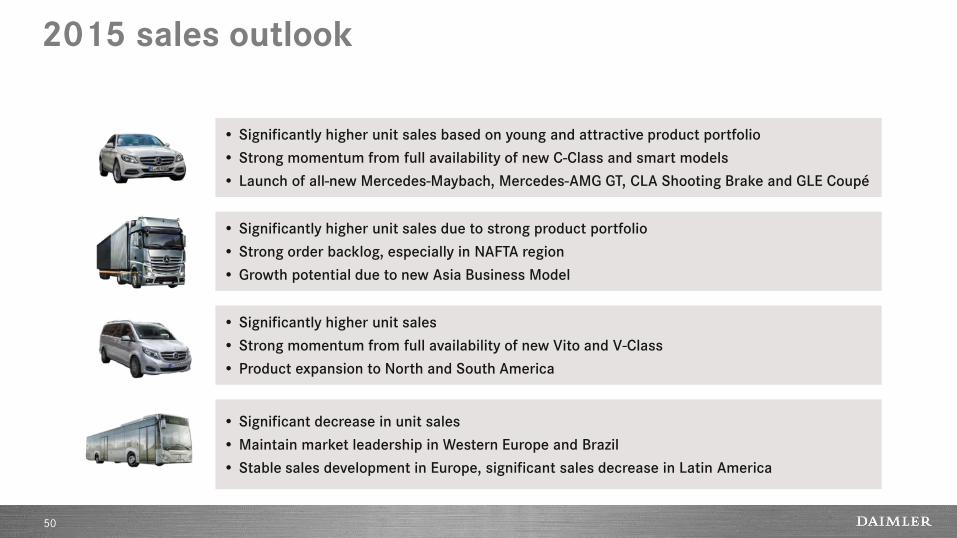
2015 sales outlook
50
• Significantly higher unit sales based on young and attractive product portfolio
• Strong momentum from full availability of new C-Class and smart models
• Launch of all-new Mercedes-Maybach, Mercedes-AMG GT, CLA Shooting Brake and GLE Coupé
• Significant decrease in unit sales
• Maintain market leadership in Western Europe and Brazil
• Stable sales development in Europe, significant sales decrease in Latin America
• Significantly higher unit sales
• Strong momentum from full availability of new Vito and V-Class
• Product expansion to North and South America
• Significantly higher unit sales due to strong product portfolio
• Strong order backlog, especially in NAFTA region
• Growth potential due to new Asia Business Model
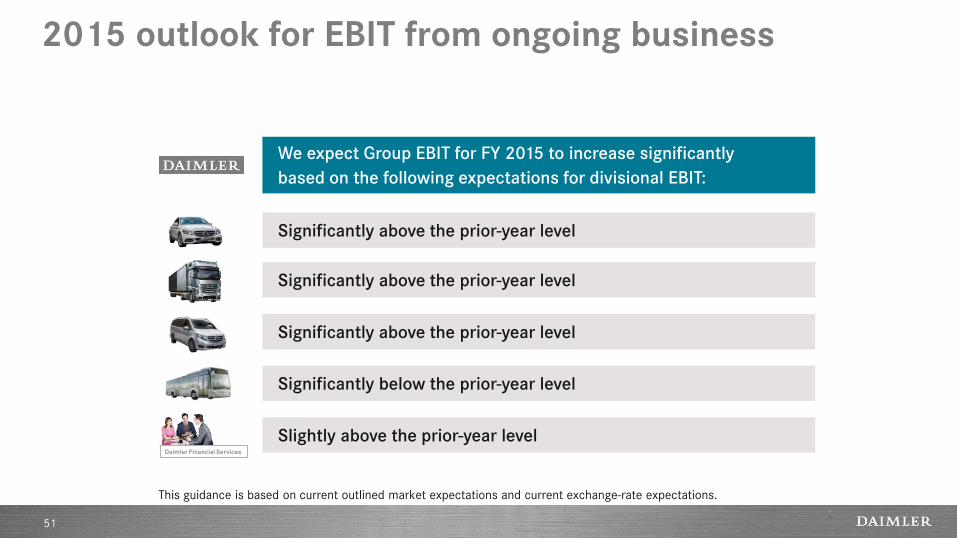
2015 outlook for EBIT from ongoing business
51
This guidance is based on current outlined market expectations and current exchange-rate expectations.
Significantly above the prior-year level
Significantly above the prior-year level
Significantly above the prior-year level
Significantly below the prior-year level
Slightly above the prior-year level
We expect Group EBIT for FY 2015 to increase significantly
based on the following expectations for divisional EBIT:
Daimler Financial Services

Contents
52
HIGHLIGHTS AND RESULTS FOR Q1 2015
OUTLOOK FOR 2015
DIVISIONAL INFORMATION
APPENDIX
DAIMLER GROUP STRATEGY

EBIT from ongoing business
53
Q1 2014 Q1 2015
EBIT RoS* EBIT RoS*
Daimler Group 2,072 6.5 2,930 8.5
of which
Mercedes-Benz Cars 1,183 7.0 1,794 9.2
Daimler Trucks 346 4.9 536 6.4
Mercedes-Benz Vans 123 5.6 221 9.2
Daimler Buses 54 6.3 35 4.0
Daimler Financial Services 397 – 409 –
Reconciliation -31 – -65 –
* Return on sales; Daimler Group excluding Daimler Financial Services
– EBIT in millions of euros; RoS in % –
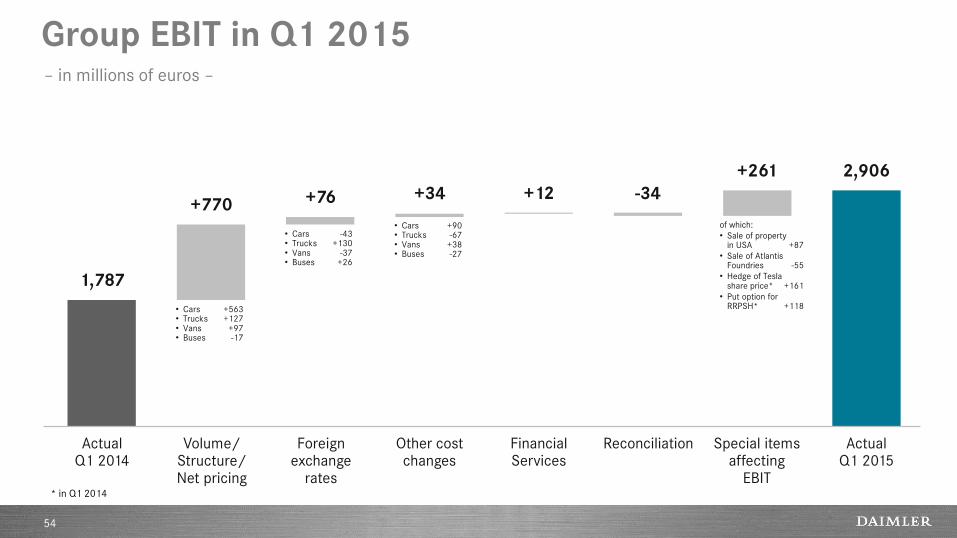
Group EBIT in Q1 2015
54
Actual Q1 2014
Volume/ Structure/ Net pricing
Foreign exchange
rates
Other cost changes
Reconciliation Actual Q1 2015
Financial Services
+34
+261 2,906
+12
1,787
+76 +770
• Cars +563 • Trucks +127 • Vans +97 • Buses -17
• Cars -43 • Trucks +130 • Vans -37 • Buses +26
• Cars +90 • Trucks -67 • Vans +38 • Buses -27
of which:
• Sale of property in USA +87
• Sale of Atlantis Foundries -55
• Hedge of Tesla share price* +161
• Put option for RRPSH* +118
Special items affecting
EBIT
-34
– in millions of euros –
* in Q1 2014

Special items affecting EBIT
55
1st quarter
Mercedes-Benz Cars 2014 2015
Restructuring of sales organization in Germany* – -20
Relocation of MBUSA headquarters – -20
Sale of property in USA – +87
Daimler Trucks
Workforce adjustments** -5 -5
Restructuring of sales organization in Germany* – -4
Sale of Atlantis Foundries – -55
Mercedes-Benz Vans
Restructuring of sales organization in Germany* – -4
Relocation of MBUSA headquarters – -2
Daimler Buses
Business repositioning -1 –
Restructuring of sales organization in Germany* – -1
Reconciliation
Measurement of put option for Rolls-Royce Power Systems Holding -118 –
Hedge of Tesla share price -161 –
* We expect expenses for the restructuring of the sales organization in Germany in a total of up to €500 million in 2015 and 2016.
** Daimler Trucks expects expenses of up to €50 million in 2015.
– in millions of euros –

Mercedes-Benz Cars: further growth through success of attractive models
56
Unit sales – in thousands of units –
Q1 2014 Q1 2015
Revenue – in billions of euros –
EBIT from ongoing business – in millions of euros –
389
460
Q1 2014 Q1 2015
17.0 19.5
Q1 2014 Q1 2015
1,183
1,794
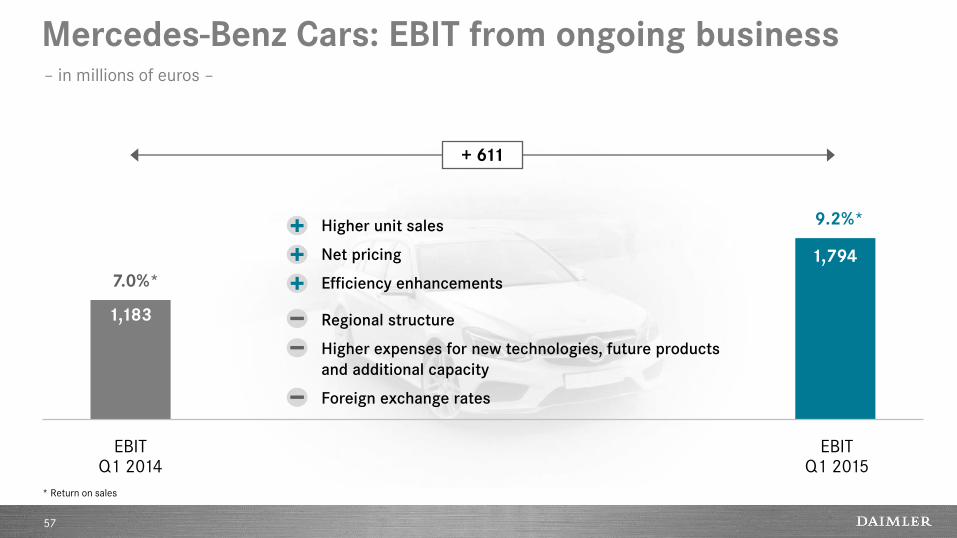
Mercedes-Benz Cars: EBIT from ongoing business
57
EBIT Q1 2014
EBIT Q1 2015
1,183
1,794
+ 611
7.0%*
9.2%*
* Return on sales
Higher unit sales
Net pricing
Efficiency enhancements
Regional structure
Higher expenses for new technologies, future products
and additional capacity
Foreign exchange rates
– in millions of euros –

Mercedes-Benz Cars: sales volume at new record level
58
– in thousands of units –
Q1 2014
389
460
Q1 2015
32
71
113
129
86
29
81
75
100
81
smart
C-Class
E-Class
S-Class
Compact cars
SUV segment
30
23
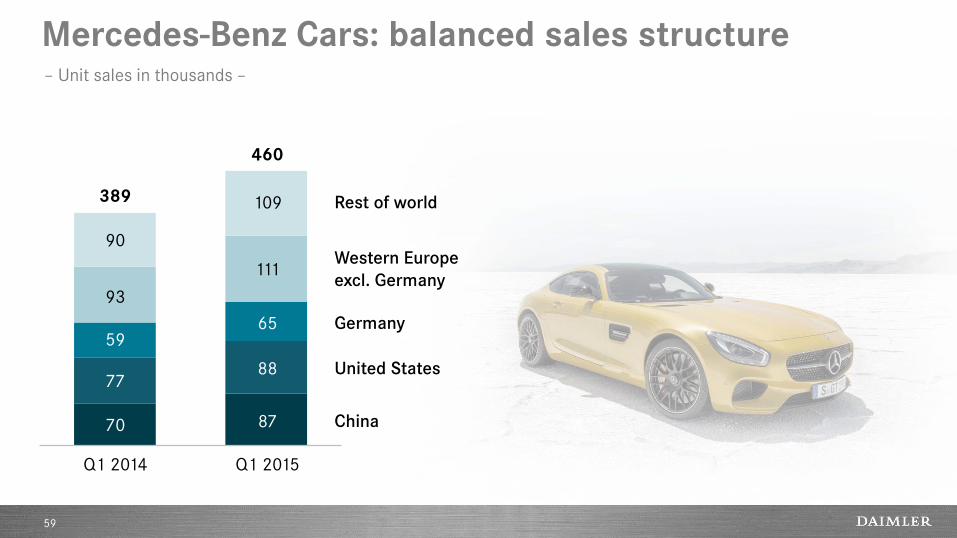
Mercedes-Benz Cars: balanced sales structure
59
Q1 2014
Rest of world
Germany
United States
China
389
Western Europe
excl. Germany
460
Q1 2015
87
88
65
111
109
70
77
59
93
90
– Unit sales in thousands –
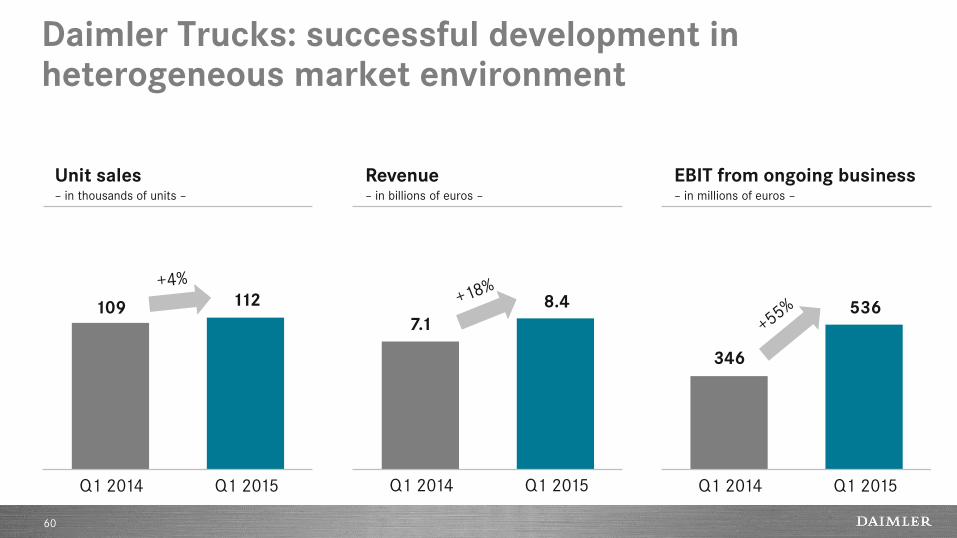
Daimler Trucks: successful development in heterogeneous market environment
60
109 112
7.1
8.4
346
536
Unit sales – in thousands of units –
Revenue – in billions of euros –
EBIT from ongoing business – in millions of euros –
Q1 2014 Q1 2015 Q1 2014 Q1 2015 Q1 2014 Q1 2015
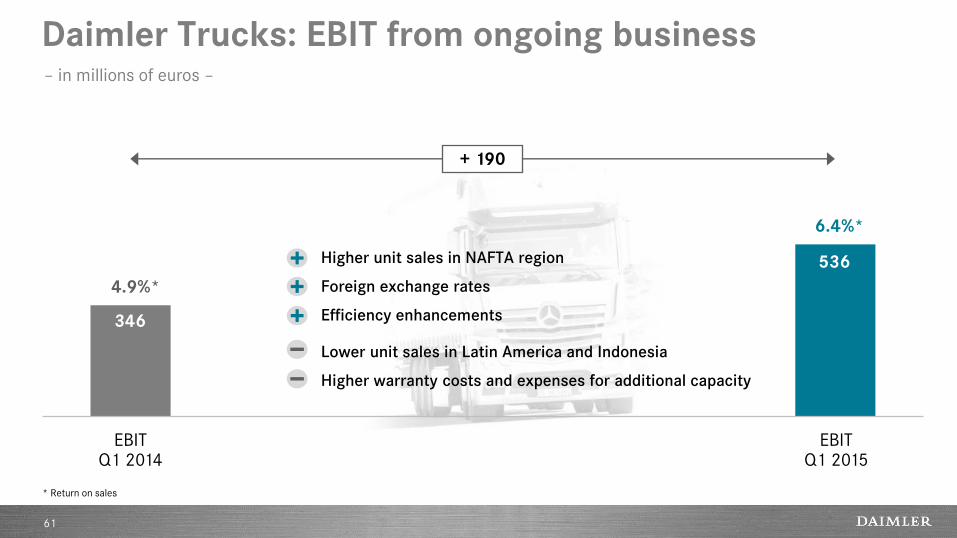
Daimler Trucks: EBIT from ongoing business
61
EBIT Q1 2014
EBIT Q1 2015
346
536
+ 190
4.9%*
6.4%*
* Return on sales
Higher unit sales in NAFTA region
Foreign exchange rates
Efficiency enhancements
Lower unit sales in Latin America and Indonesia
Higher warranty costs and expenses for additional capacity
– in millions of euros –
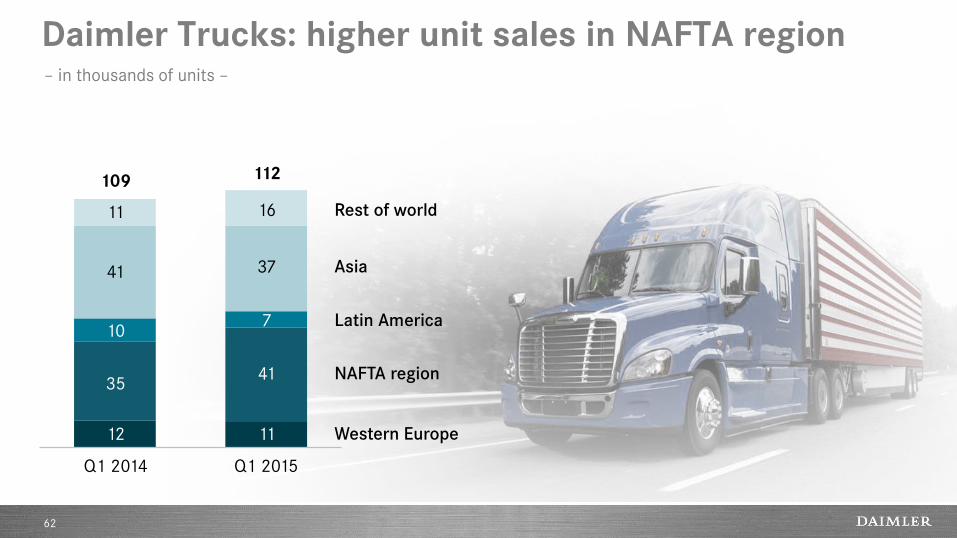
Daimler Trucks: higher unit sales in NAFTA region
62
Q1 2014
Rest of world
109
Asia
112
Q1 2015
11
41
7
37
16
12
35
10
41
11
Western Europe
NAFTA region
Latin America
– in thousands of units –
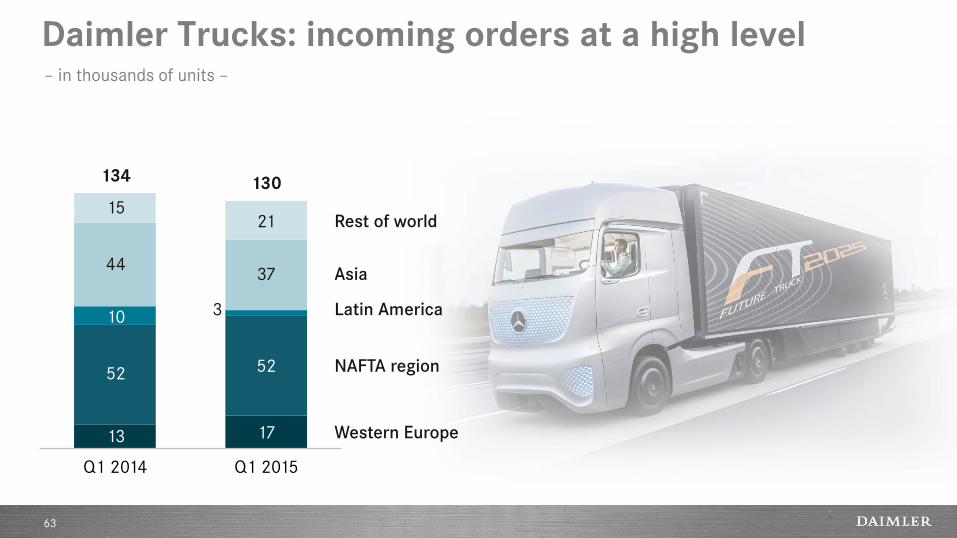
Daimler Trucks: incoming orders at a high level
63
134 130
17
52
3
37
21
13
52
10
44
15
Asia
Western Europe
NAFTA region
Rest of world
Latin America
Q1 2014 Q1 2015
– in thousands of units –

Mercedes-Benz Vans: success in volatile markets
64
61.1 63.8 2.2
2.4
123
221
Unit sales – in thousands of units –
Revenue – in billions of euros –
EBIT from ongoing business – in millions of euros –
Q1 2014 Q1 2015 Q1 2014 Q1 2015 Q1 2014 Q1 2015
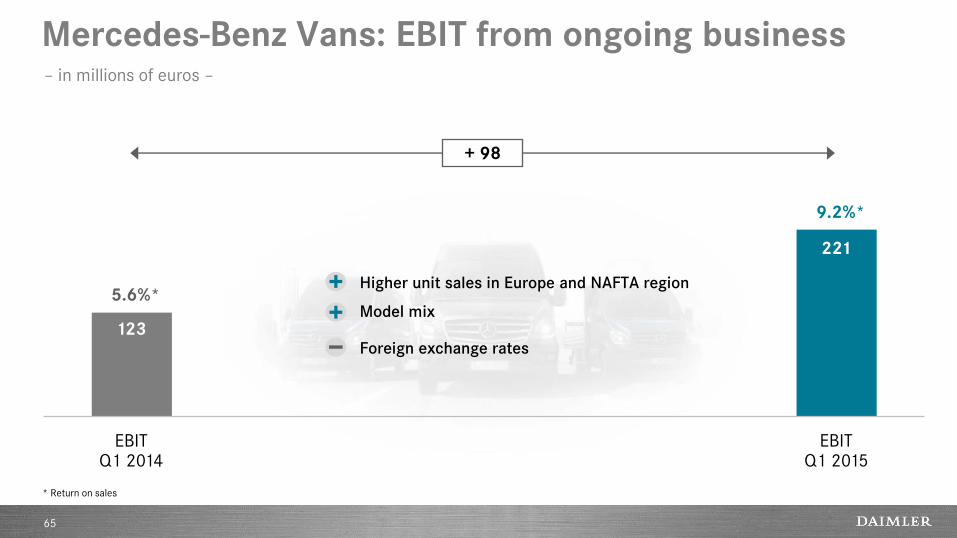
Mercedes-Benz Vans: EBIT from ongoing business
65
EBIT Q1 2014
EBIT Q1 2015
123
221
+ 98
5.6%*
9.2%*
* Return on sales
Higher unit sales in Europe and NAFTA region
Model mix
Foreign exchange rates
– in millions of euros –

Mercedes-Benz Vans: higher unit sales
66
61.1 63.8
3.8
13.2
40.9
5.5
13.5
37.3
0.2
V-Class
Sprinter
Vario
Vito
5.9 Citan
Q1 2014 Q1 2015
4.7
– in thousands of units –

Daimler Buses: EBIT at a high level despite significant market contraction in Latin America
67
6.7 5.7
0.9 0.9
54
35
Unit sales – in thousands of units –
Revenue – in billions of euros –
EBIT from ongoing business – in millions of euros –
Q1 2014 Q1 2015 Q1 2014 Q1 2015 Q1 2014 Q1 2015

Daimler Buses: EBIT from ongoing business
68
EBIT Q1 2014
EBIT Q1 2015
54
35
- 19
6.3%*
4.0%*
* Return on sales
Higher unit sales and model mix in Western Europe
Foreign exchange rates
Significantly lower unit sales in Latin America
– in millions of euros –

Daimler Buses: lower demand for bus chassis
69
Europe
Mexico
Rest of world
Brazil
Latin America (excl. Brazil and Mexico)
0.5
6.7
1.5
0.7
3.5
0.5 5.7
1.7
0.6
2.2
0.5
0.7
Q1 2014 Q1 2015
– in thousands of units –
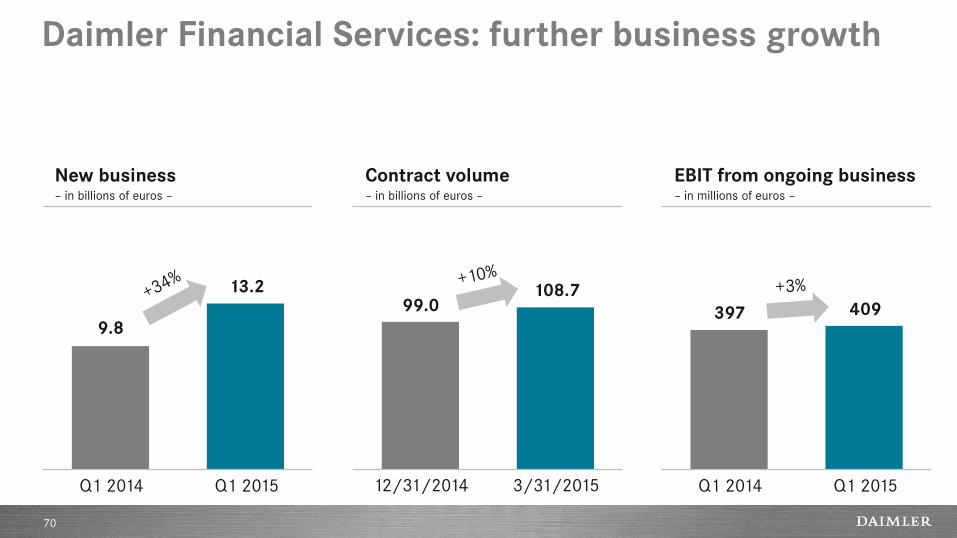
Daimler Financial Services: further business growth
70
9.8
13.2
12/31/2014 3/31/2015
99.0 108.7
397 409
New business – in billions of euros –
Contract volume – in billions of euros –
EBIT from ongoing business – in millions of euros –
Q1 2014 Q1 2015 Q1 2014 Q1 2015

Daimler Financial Services: EBIT from ongoing business
71
EBIT Q1 2014
EBIT Q1 2015
397 409
+ 12
23.7%* 20.4%*
* Return on equity
Higher contract volume
Foreign exchange rates
Higher expenses due to business growth
– in millions of euros –
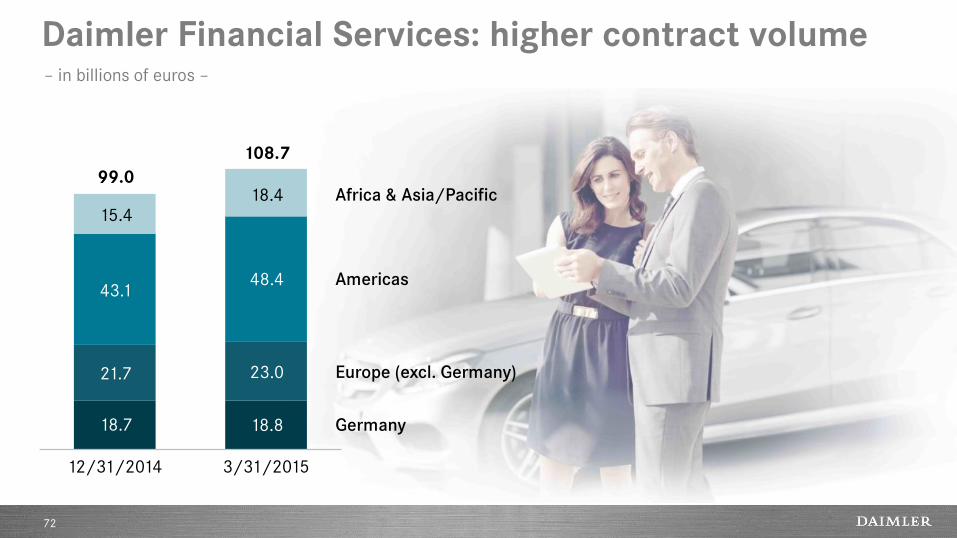
Daimler Financial Services: higher contract volume
72
12/31/2014 3/31/2015
Europe (excl. Germany)
Americas
Africa & Asia/Pacific
Germany
99.0
18.7
21.7
43.1
15.4
108.7
18.8
23.0
48.4
18.4
– in billions of euros –

Daimler Financial Services: net credit losses* at low level
73
0,69% 0,68%
0,50% 0,61%
0,36%
0,51%
0,89% 0,83%
0,43% 0,34% 0,37%
0,31%
* as a percentage of portfolio, subject to credit risk
0.20%
2003 2004 2005 2006 2007 2008 2009 2010 2011 2012 2013 2014 2015
YTD

Disclaimer
74
This document contains forward-looking statements that reflect our current views about future events. The words “anticipate,” “assume,” “believe,”
“estimate,” “expect,” “intend,” “may,” ”can,” “could,” “plan,” “project,” “should” and similar expressions are used to identify forward-looking
statements. These statements are subject to many risks and uncertainties, including an adverse development of global economic conditions, in
particular a decline of demand in our most important markets; a worsening of the sovereign-debt crisis in the euro zone; an increase in political
tension in Eastern Europe; a deterioration of our refinancing possibilities on the credit and financial markets; events of force majeure including
natural disasters, epidemics, acts of terrorism, political unrest, industrial accidents and their effects on our sales, purchasing, production or financial
services activities; changes in currency exchange rates; a shift in consumer preferences towards smaller, lower-margin vehicles; a possible lack of
acceptance of our products or services which limits our ability to achieve prices and adequately utilize our production capacities; price increases for
fuel or raw materials; disruption of production due to shortages of materials, labor strikes or supplier insolvencies; a decline in resale prices of used
vehicles; the effective implementation of cost-reduction and efficiency-optimization measures; the business outlook for companies in which we hold
a significant equity interest; the successful implementation of strategic cooperations and joint ventures; changes in laws, regulations and
government policies, particularly those relating to vehicle emissions, fuel economy and safety; the resolution of pending official investigations and
the conclusion of pending or threatened future legal proceedings; and other risks and uncertainties, some of which we describe under the heading
“Risk and Opportunity Report” in the current Annual Report. If any of these risks and uncertainties materializes or if the assumptions underlying any
of our forward-looking statements prove to be incorrect, the actual results may be materially different from those we express or imply by such
statements. We do not intend or assume any obligation to update these forward-looking statements since they are based solely on the
circumstances at the date of publication.