d5: flow diagrams for railway infrastructure · project code 218662 reference code ... followed by...
TRANSCRIPT
SCS7-GA-2008-218662
InfraGuidER
<INFRAG_WP2_VUT_DV5 > Page 1 of 46 15.09.2009
Grant Agreement N°. SCS7-GA-2008-218662
InfraGuidER
Instrument:
Thematic priority: Sustainable Surface Transport
D5: Flow diagrams for Railway Infrastructure Due date of deliverable: 15.09.2009
Actual submission date: 15.09.2009
Start date: 01/01/2009 Duration: 24 months
Organisation name of lead contractor for this deliverable: VUT
Revision: [Final]
Dissemination Level PU Public xPP Restricted to other programme participants (including the Commission Services) RE Restricted to a group specified by the consortium (including the Commission Servic-
CO Confidential, only for members of the consortium (including the Commission Servic-es)
SCS7-GA-2008-218662
InfraGuidER
<INFRAG_WP2_VUT_DV5 > Page 2 of 46 15.09.2009
Document history
Revision Date Description
A 18.08.2009 Draft
B 19.08.2009 Draft
C 03.09.2009 Draft
D 03.09.2009 Draft
E 15.09.2009 Final
Title D5: Flow diagrams for Railway infrastructure Author Ulrich Kral, Paul H. Brunner Partner VUT Date Project Code 218662 Reference Code Status Final

SCS7-GA-2008-218662
InfraGuidER
<INFRAG_WP2_VUT_DV5 > Page 3 of 46 15.09.2009
Table of contents
Table of contents ............................................................................................................................. 3 Table of figures ............................................................................................................................... 5 List of tables .................................................................................................................................... 6 List of Acronyms ............................................................................................................................. 6 1 Executive SummAry ............................................................................................................... 7 2 Introduction ............................................................................................................................. 8
2.1 Context .............................................................................................................................. 8 2.2 Central questions .............................................................................................................. 8 2.3 Chapter overview .............................................................................................................. 8
3 Main Tasks and links to other Deliverables and Work packages ........................................... 9 4 MFA methodology ................................................................................................................ 10
4.1 What is MFA? ................................................................................................................ 10 4.2 Framework for MFA within EMS .................................................................................. 11 4.3 Evaluation methods for MFA results .............................................................................. 12
5 Universal Model: MFA for a railway system ........................................................................ 14
5.1 Stock & Flow Diagram of railway infrastructure .......................................................... 14 5.2 MFA definition procedure .............................................................................................. 14 5.3 MFA system boundaries (Task 2.1) ............................................................................... 16
5.3.1 Definition of spatial system boundaries .................................................................. 16 5.3.2 Definition of temporal system boundaries .............................................................. 16
5.4 MFA processes & flows (Task 2.2) ................................................................................ 17
5.4.1 Description of internal processes and related flows ................................................ 17 5.4.2 Definition of internal processes ............................................................................... 17
5.5 Relevant contributions from partners ............................................................................. 19
6 Case Study: MFA for 1km railway line ................................................................................ 22
6.1 Context ............................................................................................................................ 22 6.2 Applying the mass balance principle .............................................................................. 22 6.3 MFA system definition ................................................................................................... 23
6.3.1 Stock & Flow Diagram of 1 km railway line .......................................................... 23 6.3.2 MFA definition procedure ....................................................................................... 25 6.3.3 MFA system boundaries .......................................................................................... 25
6.3.3.1 Definition of spatial system boundaries ............................................................ 25 6.3.3.2 Definition of temporal system boundaries ........................................................ 26
6.3.4 MFA processes & flows .......................................................................................... 26
6.3.4.1 Description of internal processes and related flows ......................................... 26 6.3.4.2 Definition of internal processes ........................................................................ 27
6.4 Emission potentials ......................................................................................................... 29

SCS7-GA-2008-218662
InfraGuidER
<INFRAG_WP2_VUT_DV5 > Page 4 of 46 15.09.2009
7 Summary and Conclusion ..................................................................................................... 30 8 Appendix ............................................................................................................................... 31
8.1 Universal MFA model .................................................................................................... 31
8.1.1 Decomposition of MFA system .............................................................................. 31 8.1.2 Sub models .............................................................................................................. 32
8.2 MFA model for case study ............................................................................................. 35
8.2.1 Decomposition of MFA system .............................................................................. 35 8.2.2 Sub models .............................................................................................................. 36
8.2.2.1 Sub model of the process “immobile infrastructure” ........................................ 36 8.2.2.2 Sub model of the process “rolling stock” ......................................................... 40
9 Determination of MFA quantities ......................................................................................... 41
9.1 Technical Profiles ........................................................................................................... 41 9.2 Stock & flow matrices .................................................................................................... 42
9.2.1 Operating material ................................................................................................... 42 9.2.2 Immobile Infrastructure ........................................................................................... 44
10 Procedures creating a MFA ................................................................................................... 46 11 Acknowledgements ............................................................................................................... 46 12 Bibliography .......................................................................................................................... 46
SCS7-GA-2008-218662
InfraGuidER
<INFRAG_WP2_VUT_DV5 > Page 5 of 46 15.09.2009
Table of figures figure 1: stock & flow diagram ..................................................................................................... 10
figure 2: Generic InfraGuidER MFA model showing appropriate definition of material stocks & flows ...................................................................................................................................... 15
figure 3: Schematic representation of material flows through the commercial life-cycle of products and InfraGuidER common system boundaries for MFA ([2], modified) ............... 16
figure 4: Stock & Flow Diagram of 1 km railway line (Case Study) ............................................ 24
figure 5: Schematic representation of material flows through the commercial life-cycle of products and system boundaries for the MFA case study ([2], modified) ............................ 25
figure 6: MFA system definition for 1 km railway line ([3], modified; blue dotted line: system boundary of immobile infrastructure, red dotted line: system boundary of rolling stock) ... 26
figure 7: Simplified physical decomposition of the railway system ............................................. 31
figure 8: Subsystem “immobile infrastructure”, MFA diagram on 2nd level ................................ 32
figure 9: Subsystem “rolling stock, MFA diagram on 2nd level .................................................... 33
figure 10: Simplified physical decomposition of 1 km railway line ............................................. 35
figure 11: Submodel for “immobile infrastructure”, MFA diagram on 2nd level .......................... 36
figure 12: Submodel for “track system”, MFA diagram on 3rd level ............................................ 37
figure 13: Submodel for “track profile type T1”, MFA diagram on 4th level ............................... 38
figure 14: Submodel “overhead contact line”, MFA diagram on 3rd level ................................... 38
figure 15: Submodel for “overhead contact line type P1”, MFA diagram on 4rd level ................. 39
figure 16: Submodel for “rolling stock”, MFA diagram on 2nd level ........................................... 40
figure 17: rolling stock profiles related to MFA subsystems ........................................................ 41
figure 18: immobile infrastructure profiles related to MFA subsystems ...................................... 41
figure 19: Example of one immobile Infrastructure Profile: Power Supply Profile Type P1 and contained infrastructure components (it’s a 3 kV overhead contact line) ............................. 42
figure 20: Procedures creating a MFA [1] .................................................................................... 46

SCS7-GA-2008-218662
InfraGuidER
<INFRAG_WP2_VUT_DV5 > Page 6 of 46 15.09.2009
List of tables table 1: Main tasks and links with other deliverables and work packages ...................................... 9
table 2: Material flow related analyses and associated issues of concern ([2], modified) ............ 13
table 3: Agreed process list ........................................................................................................... 19
table 4: Selected emissions ............................................................................................................ 29
table 5: Identification of potential emission sources ..................................................................... 29
table 6: Material Inflow Matrix of the Wearing Parts Profile Type W1 (brake elements) ........... 43
table 7. Material Lost Matrix of the Wearing Parts Profile Type W1 (brake elements) ............... 43
table 8. Material Outflow Matrix of the Wearing Parts Profile Type W1 (brake elements) ......... 44
table 9: Material Inflow Matrix of the Power Supply Profile Type P1 (overhead contact line: 3kV open track construction) ........................................................................................................ 44
table 10: Material Stock Matrix of the Power Supply Profile Type P1 (overhead contact line: 3kV open track construction) supported by BBRail ............................................................. 45
table 11: Material Outflow Matrix of the Power Supply Profile Type P1 (overhead contact line: 3kV open track construction) ................................................................................................ 45
LIST OF ACRONYMS CA Coordinated Action VUT Vienna University of Technology UoB University of Birmingham ECO2WIN Eco2Win IM Infrastructure Manager SP Scientific Partner TC Technical Contribution WP Work Package EPI Environmental Performance Indicator EKPI Environmental Key Performance Indicator MFA Material Flow Analysis SFA Substance Flow Analysis

SCS7-GA-2008-218662
InfraGuidER
<INFRAG_WP2_VUT_DV5 > Page 7 of 46 15.09.2009
1 EXECUTIVE SUMMARY The goal is to facilitate the use of MFA in a uniform way so that IM have a common method in their toolboxes for solving resource and environmental oriented problems. Based on law of the conservation of matter, MFA traces materials through railway infrastructure systems at every life-cycle stage, pinpoints critical states of accumulating and depleting material stocks and visi-ble environmental loads. MFA enables traceability today of what may be identified as an issue in the future.
First, the general idea behind Deliverable 51 is presented by contextualizing material flow analy-sis within the InfraGuidER project. Two key questions are identified, followed by the main tasks and links to other deliverables.
The framework for MFA within environmental management systems is described as well as evaluation methods for MFA results.
According to Task 2.1 and 2.2 a qualitative based, universal MFA system of railway infrastruc-ture is developed and displayed. This includes the definition of system boundaries, processes, stock and flows, as well as the selection of diffuse emissions resulting from static and dynamic sources. The MFA system can be developed further and used as physical-backbone tool for as-sessment applications at European railway infrastructure companies.
Further, a qualitative based, European standardized MFA model of 1 km railway line is devel-oped and displayed. A standardized information gathering process to quantify Material Stock & Flow Matrices and to create a first draft of inventory list is also developed and displayed. This offers the possibility to analyze material scenarios in view of environmental loads at every stage of life-cycle. Therefore, it allows benchmarking of different track profiles and operational activi-ties of different railway companies. Consequently, mutual exchange of best practice and know-how is instrumental for improving environmental performance of railway infrastructure.
The last chapter is directed towards Infrastructure Managers and sums up the necessity to incor-porate MFA into environmental management systems in order to improve environmental railway performance.
1 According to Annex I, p. 38 Deliverable 5 is entitled with “Flow diagrams for Railway Infrastructure – Flow Charts of identified flows of goods”. It is related to task 2.1 (Identification of Material System Boundaries) and task 2.2 (Processes, Flows and Stocks), defined in Annex 1, p. 37.

SCS7-GA-2008-218662
InfraGuidER
<INFRAG_WP2_VUT_DV5 > Page 8 of 46 15.09.2009
2 INTRODUCTION In this chapter, the general idea behind Deliverable 52 is presented by contextualizing material flow analysis within the InfraGuidER project. The two key questions are identified, followed by an overview of all chapters comprised in this report.
2.1 CONTEXT Sustainable surface transport receives increasing public awareness, because of environmental impacts of transport services and limited natural resources. How can these aspects be integrated in the planning phase, to avoid unexpected progresses during the design and operating phase? Several European Railway Infrastructure Managers, the International Union of Railways (UIC), scientific and industrial partners work together within the EU funded Coordinated Action Infra-GuidER to develop infrastructure guidelines for environmental railway performance. The goal is to provide and recommend tools for analyzing and evaluating material-related environmental impacts for the attention of European Infrastructure managers as well as to define uniform, mea-surable indicators on a European level.
Deliverable 5 is a starting point to facilitate the use of MFA in a uniform way so that IMs have a common method in their toolboxes for solving resource and environmental oriented problems.
Analyzing material stock & flows of railway infrastructure delivers backbone information in view of goal oriented decisions on environmental management level. Material flow analysis (MFA) holds a pivotal role holds, based on the law of conservation of matter. By this method mutual interactions between infrastructure components and environmental spheres can be inves-tigated.
2.2 CENTRAL QUESTIONS The intention of D5 is to answer two central questions:
• What is the additional value for applying MFA within environmental management sys-tems?
• Which MFA system definition is appropriate to investigate the material flows and stocks of a railway infrastructure?
2.3 CHAPTER OVERVIEW After explaining MFA methodology and their principles, the framework for MFA within envi-ronmental management systems is outlined, and it is discussed how MFA results can be used as a base for evaluation systems such as LCA. Generally, two types of MFA models are developed and displayed.
First, a qualitative based, universal MFA model representing the infrastructure of railway sys-tems is developed and displayed. Compiled contributions from InfraGuidER partners to the WP2 progress are attached, as well as related comments by VUT.
2 According to Annex I, p. 38 Deliverable 5 is entitled with “Flow diagrams for Railway Infrastructure – Flow Charts of identified flows of goods”. It is related to task 2.1 (Identification of Material System Boundaries) and task 2.2 (Processes, Flows and Stocks), defined in Annex 1, p. 37.

SCS7-GA-2008-218662
InfraGuidER
<INFRAG_WP2_VUT_DV5 > Page 9 of 46 15.09.2009
Second, a case study representing the material turnover and stocks of 1 km railway line is pre-sented. Therefore, the universal MFA model is adopted and restricted to focus on this bounded area. As a starting point, emission potentials are listed to model diffuse emissions along railway tracks.
Finally, sub models of both MFA models are represented, showing refined stock & flow dia-grams. As a starting point to determine MFA quantities and establish a first draft of material list, a standardized information gathering process to determine stock & flow matrices is developed and described.
3 MAIN TASKS AND LINKS TO OTHER DELIVERABLES AND WORK PACKAGES
In this short chapter, the work necessary to produce deliverable D5 is summarized emphasizing links to other work packages and deliverables. Information exchange between related InfraGuid-ER tasks is crucial because it improves common understanding and progress. Therefore, D5 main-tasks are listed in table 1 as starting point or additional input for related tasks within WP1, WP3 and WP4. D5 main-tasks Direct links to other deliverables and work
packages
Description of the framework for MFA within envi-ronmental management systems.
WP1 reports on the range of existing environmental management tools and impact assessment tools.
Description of evaluation methods for MFA results.
Development and display of a qualitative based, uni-versal stock & flow diagram of railway infrastruc-ture. This includes the definition of spatial and tem-poral system boundaries, as well as defining main processes, stocks and flows. Additionally, emission potentials of infrastructure components are identified.
Task 3.1 refines the MFA system by implementing additional subsystems. Task 3.2 includes the quanti-fication of the model in interaction with IMs. The ob-jective of D13 is to display balanced quantities of materials and emission loads.
D14 reports suggestions for a process model for cho-sen components and explains the standardized and environmentally relevant processes. D5 contains sys-tem definitions and can be used as a starting point developing a standard model on European level.
The MFA methodology is applied in a case study. This MFA system can be developed further and used as physical-backbone tool for assessment applica-tions at European railway infrastructure companies.
Selection of diffuse emissions resulting from static and dynamic sources.
The result is one input to Task 2.3 (Environmental impact workshop) which deals with environmental loads and delivers prioritized substances to be fo-cused on at the standardized model on European lev-el.
D9 reports an initial definition of EKPI. D5 provides information regarding emission flows that can be de-fined as EPI.
Development and display of a standardized informa-tion gathering process to quantify Material Stock & Flow Matrices and to create a first draft of inventory list. With respect to different layouts of railway infra-structure the approach can be adjusted.
D7 requires a data acquisition process to establish a first draft of database (material list). Consequently, preliminary work has been done.
Within Task 4.1 a database is built up to mimic a general material content. The database will be cor-rected on the basis of inventories.
table 1: Main tasks and links with other deliverables and work packages

SCS7-GA-2008-218662
InfraGuidER
<INFRAG_WP2_VUT_DV5 > Page 10 of 46 15.09.2009
Equation of balance for every process:
Δ Stock = Σ Import - Σ Export
4 MFA METHODOLOGY Representing the MFA methodology with its terminology and principles facilitates understand-ing what MFA is. Reasons are given for applying the MFA methodology within environmental management systems. The link between MFA results and evaluation methods is outlined.
4.1 WHAT IS MFA? According to “The Practical Handbook of Material Flow Analysis” [1], MFA (material flow analysis) is a systematic approach to display material flows and stocks within spatial and tem-poral system boundaries. It extends input/output analysis which only identifies flows entering and exiting defined boundaries. MFA traces materials through the bounded system. Therefore it links sources, pathways and temporary or final sinks.
MFA considers the mass balance principle based on law of the conservation of matter. Balancing all inflows and outflows of a process allows calculating unknown flows in consideration of data uncertainties.
MFA delivers a comprehensive spectrum of information, displayed with “stock & flow dia-grams” (see figure 1, p. 10). Balancing inflows and outflows for every process and tracing the material through the system offers subsequent possibilities:
• Identifying sources (e.g.: sleepers) of exiting flows (e.g.: waste flows, environmental loads).
• Pinpointing the accumulation or depletion of materials within stocks.
A common language is needed for the investigation of material flows into complex systems. Enabling comprehensive, transparent and reproducible results, terms are defined as followed:
System boundary: Defines spatial and temporal system boundaries as a function of the goals.
Process: Defined as the transformation, transport or storage of materials.
Flow: “mass flow rate” [mass per unit time]
Material: umbrella term for goods and substances
Goods: Economic entities of matter with a positive or negative economic value. Goods are made up of one or several substances.
Substances: Chemical elements and compounds.
Processes are linked by flows. Material flows entering the process are called inputs, while those exiting are called outputs.
figure 1: stock & flow diagram
stock
process
Import
Export

SCS7-GA-2008-218662
InfraGuidER
<INFRAG_WP2_VUT_DV5 > Page 11 of 46 15.09.2009
4.2 FRAMEWORK FOR MFA WITHIN EMS According to EN ISO 14001:2004, an environmental management system is part of the enter-prise management system. It develops and designs environmental policies in order to manage environmental aspects. The objective of management and engineering measures is to ensure that a) substance flows and concentrations in water, air and soil are kept at a level that allows the genuine functioning of natural systems and b) the associated costs can be carried by the actors involved [1]. Derived indicators have to fulfill specific criteria like measurability, reproducibility and comparability. To be up to the mark, IMs have several EMS tools to implement environmen-tal concerns into the management system.
MFA is an existing tool applied in many engineering fields dealing with complex systems. Be-neath environmental management the most important application areas are industrial ecology, re-source management and investigations to analyze, evaluate and optimize key processes and ma-terial flows of the anthropogenic metabolism.
MFA/SFA can be used to develop and design strategies minimizing diffuse emissions along railway tracks. An effective prevention and reduction strategy includes the procurement process, substance monitoring programs and waste strategies. All of these actions require common know-ledge of material flows and stocks within the railway system, as the mutual interaction flows be-tween environmental spheres. Without such knowledge, the relevant measures might not be fo-cused on priority sources and pathways, and thus they could be inefficient and costly [1].
There are clear limits applying MFA in the field of environmental management. MFA is a tool to analyze material related processes and flows, after defining a spatial and temporal system boun-dary. It identifies sources (e.g.: brake pads), flows (e.g.: wear from brake pads) and sinks (e.g.: ballast) of railway goods and related substances. MFA is based on appropriate scientific laws and principles. In contrast to other EMS-tools, MFA is characterized by the law of the conservation of matter. Balancing all inflows and outflows of a stock allows forecasting critical states of dep-letion or accumulation (e.g.: Accumulation of hydrocarbons and metals in ballast). Stock & flow diagrams offer the opportunity to pinpoint resource and environmentally relevant stocks and flows. This basic requirement is needed to choose the most effective strategy for reduction and prevention strategies. The application of the MFA/SFA procedure offers the possibility to devel-op requirements for rolling stock which can feed back and improve the third-party contamination problems.3 Consequently, MFA reveals possible problems in view of present and future legal framework. It enables traceability today of what may be identified as an issue in the future.
MFA is not a standalone tool. It is rather a tool that can provide a detailed overview of the physi-cal material and substance flows of an organization, hence providing the environmental man-agement system with valuable guidance. It delivers at set of information for superimposed tools regarding evaluation and design. In order to evaluate MFA results, MFA needs to be combined with an evaluation system, which means that the quantitative information about physical flows needs to be interpreted by the state of ecological knowledge and the socio-economic value sys-tem.
3 Further details: Minutes of meeting, WP2, 22nd July 2009, Network Rail Offices

SCS7-GA-2008-218662
InfraGuidER
<INFRAG_WP2_VUT_DV5 > Page 12 of 46 15.09.2009
4.3 EVALUATION METHODS FOR MFA RESULTS To draw an MFA, following procedures [see figure 20, p. 46] have to be optimized iteratively:
1. Definition of problem and adequate goals 2. Selection of system boundaries, processes, goods and substances 3. Mass flow of goods and substance concentrations in this flows are defined. Unknown
stocks and flows are calculated, based on law of the conservation of matter where uncer-tainties are considered.
4. Presenting quantified results with material stock & flow diagrams.
If the MFA system is carefully outlined there are little discussions among identified and quanti-fied flows and stocks. In contrast to the analyzing process the interpretation and evaluation of MFA results is a subjective approach. Evaluation criteria are determined by the state of ecologi-cal knowledge and the socio-economic value system. Hence, they are
• exogenic factors with regard to railway systems and • changing with time and • varying among cultures.
The right to live is not exclusively ruled by scientific criteria. Decisions among that and derived levels that allow the genuine functioning could be expressed by the definition of EPIs. If a scien-tific approach is necessary to quantify material related EPIs within a complex system, MFA is suitable for analyzing emission sources, pathways and sinks at every stage in the life cycle of materials.
Consequently, this physical backbone information is the basis for familiar evaluation methods like a) material intensity per service-unit, b) sustainable process index, c) Life-Cycle Assessment d) Swiss Ecopoints, e) Exergy, f) Cost-Benefit Analysis or Material flow cost accounting g) Anthropogenic vs. Geogenic Flows and h) Statistical Entropy Analysis.
For example, the link between MFA and one evaluation tool, called Life-Cycle Analysis and As-sessment, is outlined. EN ISO 14040:2006 describes the principles and framework for life cycle assessment (LCA) including:
1) Definition of the goal and scope of the LCA: Apart from the goal of the study, the scope is defined by e.g.: the function of the systems, the functional unit, the system boundaries and selected impact categories.
2) The life cycle inventory analysis (LCI) phase: Data for each unit process within the systems boundary can be classified under major headings, including input/output tables.
3) The life cycle impact assessment (LCIA) phase: In general, this process involves associating inventory data with specific environmental impact categories and category indicators, thereby attempting to understand these im-pacts. The LCIA results contain mandatory steps: a) Selection of Impact categories , b) Assignment of LCI results (classification) and c) Calculation of category indicator results (characterization); optional steps calculating the magnitude of category indicator results relative to reference information (normalization): a) grouping, b) weighting.
SCS7-GA-2008-218662
InfraGuidER
<INFRAG_WP2_VUT_DV5 > Page 13 of 46 15.09.2009
4) The life cycle interpretation phase: The results from the inventory analysis and the impact assessment are considered to-gether. Results are interpreted in context to the goal and the scope of the study. Hence, recommendations are provided.
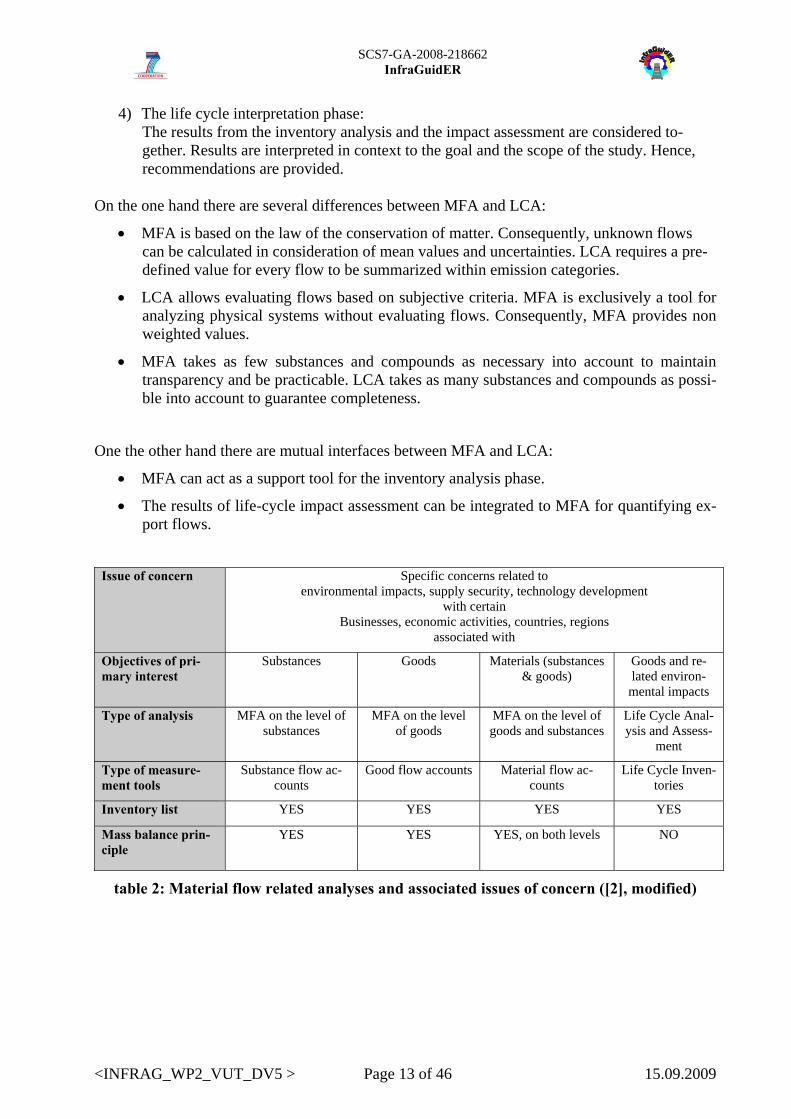
On the one hand there are several differences between MFA and LCA:
• MFA is based on the law of the conservation of matter. Consequently, unknown flows can be calculated in consideration of mean values and uncertainties. LCA requires a pre-defined value for every flow to be summarized within emission categories.
• LCA allows evaluating flows based on subjective criteria. MFA is exclusively a tool for analyzing physical systems without evaluating flows. Consequently, MFA provides non weighted values.
• MFA takes as few substances and compounds as necessary into account to maintain transparency and be practicable. LCA takes as many substances and compounds as possi-ble into account to guarantee completeness.
One the other hand there are mutual interfaces between MFA and LCA:
• MFA can act as a support tool for the inventory analysis phase.
• The results of life-cycle impact assessment can be integrated to MFA for quantifying ex-port flows.
Issue of concern Specific concerns related to
environmental impacts, supply security, technology development with certain
Businesses, economic activities, countries, regions associated with
Objectives of pri-mary interest
Substances
Goods
Materials (substances & goods)
Goods and re-lated environ-
mental impacts
Type of analysis MFA on the level of substances
MFA on the level of goods
MFA on the level of goods and substances
Life Cycle Anal-ysis and Assess-
ment
Type of measure-ment tools
Substance flow ac-counts
Good flow accounts Material flow ac-counts
Life Cycle Inven-tories
Inventory list YES YES YES YES
Mass balance prin-ciple
YES YES YES, on both levels NO
table 2: Material flow related analyses and associated issues of concern ([2], modified)

SCS7-GA-2008-218662
InfraGuidER
<INFRAG_WP2_VUT_DV5 > Page 14 of 46 15.09.2009
5 UNIVERSAL MODEL: MFA FOR A RAILWAY SYSTEM The chapter starts displaying the result, namely the qualitative based, universal MFA system to model material stock & flows of railway infrastructure. Subsequently, the procedure to define the MFA system is explained, as well as the definition of system boundaries, relevant processes and flows. Finally, compiled contributions from InfraGuidER partners and related comments by VUT are listed.
5.1 STOCK & FLOW DIAGRAM OF RAILWAY INFRASTRUCTURE The stock & flow diagram (see figure 2) displays processes and flows on 1st level. The processes “rolling stock” and “immobile infrastructure” represent several subsystems on lower level. A simplified model structure of processes and related subsystems are pictured at figure 7, p. 31. Se-lected MFA subsystems are pictured at section 8.1.2, p. 32.
5.2 MFA DEFINITION PROCEDURE Referring to section 1, p. 7 the central question is: “Which MFA system definition is appropriate to investigate the material flows and stocks of a railway infrastructure?”
According to ÖNORM S 2096-2 it is a creative procedure to design an MFA. The structure of a system (system boundaries, processes, flows of goods, substances and compounds) depends on the concrete question. An MFA model always simplifies reality and reduces complexity. It only illustrates essential processes and flows to be practicable.
Defining the MFA system requires the following steps:
• Defining spatial and temporal system boundaries (see section 5.3, p. 16)
• Defining processes and flows (see section 5.4, p. 17)

SCS7-GA-2008-218662
InfraGuidER
<INFRAG_WP2_VUT_DV5 > Page 15 of 46 15.09.2009
figure 2: Generic InfraGuidER MFA model showing appropriate definition of material stocks & flows
SCS7-GA-2008-218662
InfraGuidER
<INFRAG_WP2_VUT_DV5 > Page 16 of 46 15.09.2009
5.3 MFA SYSTEM BOUNDARIES (TASK 2.1)
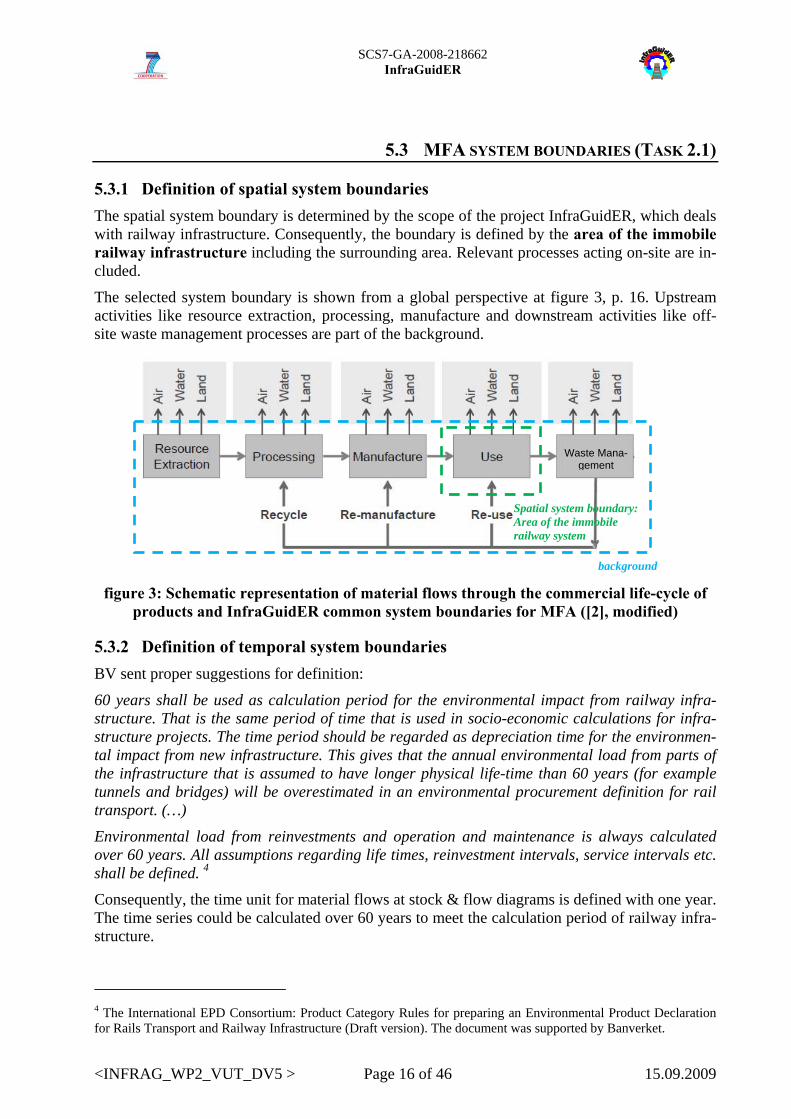
5.3.1 Definition of spatial system boundaries The spatial system boundary is determined by the scope of the project InfraGuidER, which deals with railway infrastructure. Consequently, the boundary is defined by the area of the immobile railway infrastructure including the surrounding area. Relevant processes acting on-site are in-cluded.
The selected system boundary is shown from a global perspective at figure 3, p. 16. Upstream activities like resource extraction, processing, manufacture and downstream activities like off-site waste management processes are part of the background.
figure 3: Schematic representation of material flows through the commercial life-cycle of
products and InfraGuidER common system boundaries for MFA ([2], modified)
5.3.2 Definition of temporal system boundaries BV sent proper suggestions for definition:
60 years shall be used as calculation period for the environmental impact from railway infra-structure. That is the same period of time that is used in socio-economic calculations for infra-structure projects. The time period should be regarded as depreciation time for the environmen-tal impact from new infrastructure. This gives that the annual environmental load from parts of the infrastructure that is assumed to have longer physical life-time than 60 years (for example tunnels and bridges) will be overestimated in an environmental procurement definition for rail transport. (…)
Environmental load from reinvestments and operation and maintenance is always calculated over 60 years. All assumptions regarding life times, reinvestment intervals, service intervals etc. shall be defined. 4
Consequently, the time unit for material flows at stock & flow diagrams is defined with one year. The time series could be calculated over 60 years to meet the calculation period of railway infra-structure.
4 The International EPD Consortium: Product Category Rules for preparing an Environmental Product Declaration for Rails Transport and Railway Infrastructure (Draft version). The document was supported by Banverket.
Waste Mana-
gement
Spatial system boundary: Area of the immobile railway system
background

SCS7-GA-2008-218662
InfraGuidER
<INFRAG_WP2_VUT_DV5 > Page 17 of 46 15.09.2009
5.4 MFA PROCESSES & FLOWS (TASK 2.2) The chapter contains the description of processes and related flows, displayed at the stock & flow diagram (figure 2, p. 15), as well as the definition of internal processes.
5.4.1 Description of internal processes and related flows Generally, all flows entering the bounded system result from external processes. It illustrates that the background interacts with the railway system.5 Subsequently, all internal processes on 1st level and related flows are described.
The process “rolling stock” acts as material stock and consists of vehicle components with emissions entering the immobile infrastructure. The inflows result from off-site installation ac-tivities for rolling stock components. One part of the outflows is determined by removed rolling stock components and operational material. Another part, results from sub processes of the roll-ing stock (e.g.: the abrasion of wearing parts, leaking lubricants and leaking or lost energy carri-ers). They enter the processes “atmosphere” or “immobile infrastructure”.
One import flow of the process “on-site activities to install infrastructure material” results from delivered materials to the railway system. The second import results from a reused material flow from “on-site recovery operations”. Delivered operating material to the track system enters the process “on-site activities to add operating material”. The outflow enters the subsystem “tracks system” within the process “immobile infrastructure”.
The process “immobile infrastructure” 6 acts as material stock, because it covers all infrastruc-ture components over the whole lifetime and operational material to maintain the immobile in-frastructure. The inflows result from the process “on-site activities to install infrastructure ma-terial“ and “on-site activities to add operating material”. The inflow “material flow resulting from train operation” has its origin at the process “rolling stock”. A natural inflow to the “immo-bile infrastructure” is called “atmospheric deposition” and “precipitation”. The emission related outflows end up in “pedosphere and hydrosphere”, as well as in the “atmosphere”. The “disman-tled materials” end up at the process “on-site activities to dismantle infrastructure material”.
The process “on-site activities to dismantle infrastructure material” imports “dismantled ma-terial from the immobile infrastructure” and exports material to the process “on-site recovery op-erations”, as well as to “off-site recovery operations” and “off-site disposal operations”. Re-moved operating materials resulting from the subsystem “track system” enter the process “on-site activities to remove operating material”.
The inflow of the process “on-site recovery operations” results from dismantled infrastructure materials. Recovered material is going to be installed and enters “on-site activities to install in-frastructure material” or it is exported to off-site disposal activities. The process also causes emissions to “pedosphere and hydrosphere”, as well as to the “atmosphere”.
5.4.2 Definition of internal processes Processes within the bounded system are called internal processes and are subsequently defined.
• Process “rolling stock” (transformation process with material stock)
The process contains rolling stock components and operational material with emissions entering the immobile infrastructure. They result from all vehicles frequenting the track.
5 It’s essential to know, that within this study, these processes are not liable to the law of mass balance. 6 It consists of 7 subsystems that provide train operation.

SCS7-GA-2008-218662
InfraGuidER
<INFRAG_WP2_VUT_DV5 > Page 18 of 46 15.09.2009
• Process “immobile infrastructure” (transformation process with material stock)
The process contains all required, immobile infrastructure subsystems to provide train operation. Therefore, the process is divided into 5 subsystems which exist at most of the European railway systems7 (track system, power supply system, telecommunication system, signaling system, structures).
• Process “on-site activities to install infrastructure material” (transformation process)
The process is defined of activities in the life cycle of infrastructure8, which provide the installa-tion of immobile infrastructure components. Activities in the life cycle of infrastructure
Description
New constructions Construction of new railway infrastructure, e.g.: a whole new line or part of it
Renewals Like for replacement of infrastructure components e.g. the relaying of track; although new components will be installed, a renewal is where the new components don't provide any significant change in form or function from the original position (otherwise it is an upgrade, not a renewal).
Upgrades Work which makes improvements or additions to an existing piece of in-frastructure, for example electrification upgrades
• Process: “on-site activities to dismantle infrastructure material” (transformation process)
The process is defined of activities in the life cycle of infrastructure, which provide the disman-tling of immobile infrastructure components. Activities in the life cycle of infrastructure
Description
Dismantling Dismantling of railway infrastructure, e.g.: a whole old line or part of it
Renewals Like for replacement of infrastructure components e.g. the relaying of track; although new components will be installed, a renewal is where the new components don't provide any significant change in form or function from the original position (otherwise it is an upgrade, not a re-newal).
• Process “On-site activities to add operating material” (transformation process) The process covers all on-site operation activities which add operating material to the track sys-tem. Activities in the life cycle of infrastructure
Description
Operation All the routine operation tasks associated with adding operational material. e.g.: lubricants for flanges, pesticides for vegetation control.
7 InfraGuidER document: D3 – Strategic Plan: Recognition of differences and specificities from country to country is necessary, but evaluation and comparison of Environmental Performances at European level shall be possible: this is what InfraGuidER is committed to address. 8 Source: INFRAG_WP1_UOB-ECO2_PR_001_a.ppt, modified

SCS7-GA-2008-218662
InfraGuidER
<INFRAG_WP2_VUT_DV5 > Page 19 of 46 15.09.2009
• Process “On-site activities to remove operating material” (transformation process)
The process covers all on-site removal activities which remove operating material from the track system. Activities in the life cycle of infrastructure
Description
Operation All the routine operation tasks associated with removing operational ma-terial. e.g.: old lubricants for flanges
• Process: “on-site recovery operations” (transformation process)
The process consists of recovery operations, which take place directly on the area of the railway system, e.g.: Recycling and cleaning the ballast with automatic facilities on vehicles.
5.5 RELEVANT CONTRIBUTIONS FROM PARTNERS The chapter lists compiled contributions from InfraGuidER-Partners regarding the definition of an MFA system for railway infrastructure. Related comments by VUT are added to document the creative development of the MFA system and to improve the understanding of the displayed stock & flow diagram (figure 2, p. 15).
a) Contribution 1: At the WP2 kick off meeting in London a discussion around MFA processes lead to agreements of included and excluded processes9.
processes
INCLUDED EXCLUDED
Structure Points heating Vehicles
Signaling system Oils Offices
Barriers Points Motors Station
Noise Abatement Flange Lubricators Depots (to be confirmed)
Rail Plant Vehicles
Sleepers Pesticides
Substructure Maintenance Chemical
Slab Track Ballast Information Signals
Electrical Sub Stations Communication equipment
Contact lines Refueling points
table 3: Agreed process list
Comment by VUT: Items from table 3 acts as starting point for VUT to develop the MFA sys-tem.
• Comment regarding included processes: Single processes were assigned to infrastruc-ture subsystems. Therefore, all “included” processes are part of the MFA model.
9 Source: Minutes of meeting from the WP2-Kickoff meeting (INFRAG_WP0_NIT_MM_014.doc)

SCS7-GA-2008-218662
InfraGuidER
<INFRAG_WP2_VUT_DV5 > Page 20 of 46 15.09.2009
• Comment regarding excluded processes: They are generally not part of the designed MFA model, with exception of the emissions resulting from the vehicles entering the immobile infrastructure. It would not be thorough to look at substance accumulation in temporal and final sinks (e.g.: ballast, soil, water, atmosphere) without considering this aspect. Most of the contamination on the railway seems to originate from parties operating the railway. IMs tend to take responsibility for cleaning up. Actually, IMs are not aware of any provision for charging the costs back to the originator. In some cases the source of emissions is still unknown. An MFA/SFA provides information that would assist IMs with understanding this risk.
b) Contribution 2: During several WP1 meetings, IMs were asked to pronounce relevant envi-ronmental aspects. These aspects were ranked according to enterprises’ priorities. The infor-mation were compiled by Joe Silmon and presented as a preliminary result10.
Ranked priority list:
1. Industrial waste
2. Energy consumption
3. Physical resource use
4. Water contamination
5. Soil contamination
Comment by VUT: Non material impacts cannot be investigated by an MFA. MFA is well suited for solid, liquid and gaseous forms of energy. In other words, only material related energy carriers are part of MFA (e.g.: leaking fuel). Although there are links between MFA and energy consumption, MFA does not seem to be the appropriate analytical tool for investi-gating in these fields of environmental concern. Thus, other methodologies are needed for these issues.
c) Contribution 3: IM sent information, based on the WP2-TC request. The feedback was refined during individual telephone conferences and was finally compiled by VUT
• WL act as benchmark partner at this project step. They presented system boundaries, re-lated processes and flows at the WP2 kickoff meeting on the 29th April 2009. The final definition of the system boundary was modified to consider more resource and environ-mental oriented aspects of railway systems. Hence, modifications were done, because the public transport system of WL serves several transport modes. WL agreed with this project step, because they also operate underground line 6, which is comparable to main-line tracks.
• BBRail suggested excluding the production process of railway materials, because it ex-ceeds estimated time budgets to gather comprehensive data. Additionally, BBRail sug-gested adding “on-site recovery”, “off-site recovery” and “off-site disposal” processes.
• BV actually applies an LCA of the Bothnia Line. It will be the base for environmental product declarations. They consider following processes: a) upstream process 1: extrac-
10 Source: Mail from UoB to all InfraGuidER partners on 13.07.2009, 12:45
SCS7-GA-2008-218662
InfraGuidER
<INFRAG_WP2_VUT_DV5 > Page 21 of 46 15.09.2009
tion and production of raw materials, production of railway specific materials (substruc-ture, track, power supply system, signaling system, telecom system, station installations, other installations b) Operation & maintenance of infrastructure, reinvestments c) Dis-mantling and recycling is not included .
• NR mentioned that determination of system boundaries is pending.
• CFR suggested excluding the production process.

SCS7-GA-2008-218662
InfraGuidER
<INFRAG_WP2_VUT_DV5 > Page 22 of 46 15.09.2009
6 CASE STUDY: MFA FOR 1KM RAILWAY LINE A qualitative based MFA system is developed and displayed (see figure 4, p.24). Therefore, the universal MFA system (see figure 2, p. 15) is adapted to model material stock & flows of 1 km railway track. The case study11 analyses the material usage and related diffuse emissions result-ing from static and dynamic sources on qualitative level.
6.1 CONTEXT IMs are responsible for sustaining the quality of infrastructure. Preservation of the physical sys-tem requires the management of resources concerning long term environmental aspects. Diffuse emissions along railway tracks are accumulating at temporal and final sinks e.g.: ballast, soil, water, and atmosphere. European and national legislation set specific substance contents within the sinks to limit environmental impacts. In other words, environmental impacts are often de-tected and restricted on substance level.
Environmental impacts to water and soil are listed at the top 5 priorities (see section 5.3.1, page 16). According to the Directive 2000/60/EC (water framework directive) diffuse impacts from harmful substances (e.g. metals) ending up in the water and have to be minimized. Further, the directive defines harmful substances with high priority. One of them, polycyclic aromatic hydro-carbons (PAHs), is emitted by different processes at railway lines. Possible sources are: creosote resulting from wooden sleepers, abrasion from brake pads, and lubricants. Consequently, railway companies have to identify relevant sources of substance emissions and related sinks.
IMs are also responsible to dispose industrial waste according to national law. One of the biggest mass flows in railway systems is the ballast. At the end of lifetime the ballast has to be analyzed, to determine whether it is allowed to be reused or if it has to be deposited. Land filling implicates costs that could be minimized if inflows on substance level are identified and reduced. There-fore, material specifications could be defined at the procurement process to have proper condi-tions during the whole life time of products.
6.2 APPLYING THE MASS BALANCE PRINCIPLE Using data of existing railway infrastructure, installed materials resulting from new construction, renewal and upgrading activities and operating material to maintain the infrastructure, as well as existing data of procured and operating rolling stock helps to identify relevant material flows and existing stocks.
Through the balancing of inflows, stocks and outflows, environmental loads (e.g.: abrasion of wearing parts or leaking operating material) become visible. The mass difference between in-stalled and replaced wearing parts inevitably emits to environment. Transfer coefficients define the amount of flows resulting from goods, entering different environmental spheres.
MFA traces materials through the railway systems and pinpoints sources, pathways and sinks. Displaying material stocks and flows deliver the basis of decision-making to develop emission reduction and prevention strategies.
11 Three possible case studies are mentioned at the InfraGuidER document “D3 – strategic plan”: a) Vegetation con-trol, b) Sleeper replacement and c) Ballast management. All this aspects are considered within the case study on hand.

SCS7-GA-2008-218662
InfraGuidER
<INFRAG_WP2_VUT_DV5 > Page 23 of 46 15.09.2009
6.3 MFA SYSTEM DEFINITION The chapter starts displaying the result, namely the qualitative based material stocks & flows of 1 km railway track. Subsequently, the procedure to define the MFA system is explained, as well as the definition of system boundaries, relevant processes and flows.
6.3.1 Stock & Flow Diagram of 1 km railway line The stock & flow diagram of 1 km railway line is shown at figure 4. The processes “rolling stock” and “immobile infrastructure” contain several subsystems on lower level. A simplified model structure of processes and related subsystems are pictured at figure 18, p.41. Selected MFA subsystems are pictured at section 8.1.2, p. 32.

SCS7-GA-2008-218662
InfraGuidER
<INFRAG_WP2_VUT_DV5 > Page 24 of 46 15.09.2009
figure 4: Stock & Flow Diagram of 1 km railway line (Case Study)

SCS7-GA-2008-218662
InfraGuidER
<INFRAG_WP2_VUT_DV5 > Page 25 of 46 15.09.2009
6.3.2 MFA definition procedure According to ÖNORM S 2096-2 it is a creative procedure to design an MFA. The structure of a system (system boundaries, processes, flows of goods, substances and compounds) depends on the concrete question. An MFA model always simplifies reality and reduces complexity. It only illustrates essential processes and flows to provide a practicable model.
Defining the MFA system requires following steps:
• Defining spatial and temporal system boundaries (see section 6.3.3, p. 25)
• Defining processes and flows (see section 6.3.4, p.26)
• Emission potentials (see section 6.4, p. 29)
6.3.3 MFA system boundaries
6.3.3.1 Definition of spatial system boundaries The spatial system boundary from the universal model (see 5.3.1, p. 16) is restricted and defined by the area of 1km railway line with a certain distance to surrounding. Relevant processes act-ing on-site are included.
The selected system boundary is shown from a global perspective at figure 5. Upstream activities like resource extraction, processing, manufacture and downstream activities like off-site waste management processes are part of the background.
figure 5: Schematic representation of material flows through the commercial life-cycle of
products and system boundaries for the MFA case study ([2], modified)
Spatial system boundary: Area of 1 km railway line
background
Waste Mana-gement

SCS7-GA-2008-218662
InfraGuidER
<INFRAG_WP2_VUT_DV5 > Page 26 of 46 15.09.2009
figure 6: MFA system definition for 1 km railway line ([3], modified; blue dotted line: sys-
tem boundary of immobile infrastructure, red dotted line: system boundary of rolling stock)
6.3.3.2 Definition of temporal system boundaries The time unit for material flows at MFA diagrams is defined with one year. The time series could be calculated over 60 years to meet the calculation period of railway infrastructure.
6.3.4 MFA processes & flows In comparison to the universal MFA system structure (see figure 7, p. 31) the case study only in-cludes the subsystem “track system” and “power supply system” within the “immobile infra-structure”12. The process “rolling stock” remains the same.
6.3.4.1 Description of internal processes and related flows Generally, all flows entering the bounded system result from external processes. It illustrates that the hinterland interacts with the railway system13. Subsequently, all internal processes on 1st lev-el and related flows are described.
The process “rolling stock” acts as material stock and consists of vehicle components with emissions entering the immobile infrastructure. The inflows result from off-site installation ac-tivities for rolling stock components. One part of the outflows is determined by removed rolling stock components and operational material. Another part, results from sub processes of the roll-ing stock (e.g.: the abrasion of wearing parts, leaking lubricants and leaking or lost energy carri-ers). They enter the processes “atmosphere” or “immobile infrastructure”.
One import flow of the process “on-site activities to install infrastructure material” results from delivered materials to the railway system. The second import results from a reused material flow from “on-site recovery operations”. Delivered operating material to the track system enters the process “on-site activities to add operating material”. The outflow enters the subsystem “tracks system” within the process “immobile infrastructure”.
12 Following processes are excluded: telecommunication system, signaling system, structures. 13 It’s essential to know, that within this study, these processes are not liable to the law of mass balance.
Emissions resul-ting from rolling
stock
Emissions resulting from immobile infrastructure
groundwater
Pre-flooder
Drainage
soil
superstructure

SCS7-GA-2008-218662
InfraGuidER
<INFRAG_WP2_VUT_DV5 > Page 27 of 46 15.09.2009
The process “immobile infrastructure” 14 acts as material stock, because it covers all infrastruc-ture components over the whole lifetime and operational material to maintain the immobile in-frastructure. The inflows result from the process “on-site activities to install infrastructure ma-terial” and “on-site activities to add operating material”. The inflow “material flow resulting from train operation” has his origin at the process “rolling stock”. A natural inflow to the “im-mobile infrastructure” is called “atmospheric deposition” and “precipitation”. The emission re-lated outflows end up in “pedosphere and hydrosphere”, as well as in the “atmosphere”. The “dismantled materials” end up at the process “on-site activities to dismantle infrastructure ma-terial”.
The process “on-site activities to dismantle infrastructure material” imports “dismantled ma-terial from the immobile infrastructure” and exports material to the process “on-site recovery op-erations”, as well as to “off-site recovery operations” and “off-site disposal operations”. Re-moved operating materials resulting from the subsystem “track system” enter the process “on-site activities to remove operating material”.
The inflow of the process “on-site recovery operations” results from dismantled infrastructure materials. Recovered material is going to be installed and enters “on-site activities to install in-frastructure material” or it is exported to off-site disposal activities. The process also causes emissions to “pedosphere and hydrosphere”, as well as to the “atmosphere”.
Decisive inflows to “immobile infrastructure” are caused by the process “rolling stock” and “on-site-material installation activities”. Emissions resulting from abrasion and weathering of infra-structure elements and wearing parts attain temporal and final sinks within the immobile infra-structure or at the pedosphere, hydrosphere, and atmosphere.
6.3.4.2 Definition of internal processes Processes within the bounded system are called internal processes and are subsequently defined.
• Process “rolling stock” (transformation process with material stock)
The process contains rolling stock components and operational material with potential emissions entering the immobile infrastructure. They result from all vehicles frequenting the track and are listed at section 6.4, p. 29.
• Process “immobile infrastructure” (transformation process with material stock)
The process contains all required, immobile infrastructure systems within 1 km railway track. Therefore, the process is divided into 2 subsystems: a) track system, b) power supply system.
• Process “on-site activities to install infrastructure material” (transformation process)
The process is defined of several activities in the life cycle of infrastructure15, which provide the installation of immobile infrastructure components. Activities in the life cycle of infrastructure
Description
Renewals Like replacement of infrastructure components e.g. the relaying of track; although new components will be installed, a renewal is where the new components don't provide any significant change in form or function from the original position (otherwise it is an upgrade, not a renewal).
14 It consists of 2 subsystems that provide train operation. 15 Source: INFRAG_WP1_UOB-ECO2_PR_001_a.ppt, modified

SCS7-GA-2008-218662
InfraGuidER
<INFRAG_WP2_VUT_DV5 > Page 28 of 46 15.09.2009
Upgrades Work which makes improvements or additions to an existing piece of in-frastructure, for example electrification upgrades
• Process: “on-site activities to dismantle infrastructure material” (transformation process)
The process is defined as activities in the life cycle of infrastructure, which provide the disman-tling of immobile infrastructure components. Activities in the life cycle of infrastructure
Description
Renewals Like replacement of infrastructure components e.g. the relaying of track; although new components will be installed, a renewal is where the new components don't provide any significant change in form or function from the original position (otherwise it is an upgrade, not a renewal).
• Process “On-site activities to add operating material” (transformation process)
The process covers all on-site operation activities which add operating material to the track sys-tem. Activities in the life cycle of infrastructure
Description
Operation All the routine operation tasks associated with adding operational material. e.g.: lubricants for flanges, pesticides for vegetation control.
• Process “On-site activities to remove operating material” (transformation process)
The process covers all on-site removal activities which remove operating material from the track system. Activities in the life cycle of infrastructure
Description
Operation All the routine operation tasks associated with removing operational ma-terial. e.g.: lubricants for flanges
• Process: “on-site recovery operations” (transformation process)
The process consists of recovery operations, which take place directly on the area of the railway system, e.g.: Recycling and cleaning the ballast with automatic facilities on vehicles.

SCS7-GA-2008-218662
InfraGuidER
<INFRAG_WP2_VUT_DV5 > Page 29 of 46 15.09.2009
6.4 EMISSION POTENTIALS In contrast to road traffic, few comprehensive studies and reports dealing with diffuse emissions along railway tracks are published. Therefore, a detailed work has been done by SBB and EA-WAG [3]. This report is a good starting point to select emissions resulting from railway systems and to identify potential emission sources.
Metals Organic compounds
Others Hydrocarbons Pesticides
a) Main metals: lead, cadmium, chrome, iron, copper, manganese, nickel, zinc
b) Additional metals: aluminum, tin, molybdenum, silver, etc
a) polycyclic aromatic hy-drocarbons (PAHs)
b) aromatic hydrocarbon, ali-phatic hydrocarbon, halo-genic hydrocarbon
microorganisms
table 4: Selected emissions
Emissions resulting from immobile infrastructure:
Emissions resulting from rolling stock:
1. Corrosion protection 2. Lubricants for mechanical facili-
ties 3. Oil for flange lubrication at fixed
stations 4. Catenary wire / third rail 5. Rail 6. Sleepers made of wood, concrete,
steel and fiber reinforced polyu-rethane sleepers
1. Corrosion protection of vehicles 2. Oil for flange lubrication on train 3. Rail brake (sand) 4. Leaking diesel fuel 5. Lubricants for mechanical facilities (leaking oil) 6. Contact shoe 7. Brake pads / Brake discs / electromagnetic rail brake 8. Monobloc wheel / resilient wheel
table 5: Identification of potential emission sources

SCS7-GA-2008-218662
InfraGuidER
<INFRAG_WP2_VUT_DV5 > Page 30 of 46 15.09.2009
7 SUMMARY AND CONCLUSION This chapter which is directed towards Infrastructure Managers, sums up the necessity to incor-porate MFA into environmental management systems in order to improve environmental railway performance.
MFA as backbone tool for the attention of European Infrastructure managers IMs are responsible to sustain the quality of infrastructure that provides train operation. Every life-cycle stage of railway infrastructure requires the management of physical resources includ-ing environmental concerns. These aspects have to be integrated in the planning phase, to avoid unexpected changes during the design and operating phase. Therefore, IMs require several tools to be up to the mark.
Material flow analysis is one appropriate tool in their toolbox for solving resource and environ-mental oriented problems. It is not a standalone tool, rather the physical backbone of environ-mental evaluation methods such as LCA or EIA.
MFA enables traceability today of what may be identified as an issue in the future. Based on law of the conservation of matter, MFA traces materials through railway infrastructure systems at every life-cycle stage, pinpoints critical states of accumulating and depleting material stocks and visible environmental loads. MFA identifies and quantifies material sources, related pathways and emissions, sinks and hence, measurable indicators on substance level.
The application of material/substance flow analysis may enable IM to develop requirements for rolling stock which can feed back and improve the third-party contamination problems. Further, it allows defining procurement guidelines for infrastructure components to avoid unknown risk during operation (e.g.: resulting from diffusive emissions along railway tracks) and waste dis-posal (e.g.: hazardous waste flows).
Consequently, analyzing material stocks & flows supports goal oriented decisions on environ-mental management level in terms of choosing the most effective way for reduction and preven-tion strategies. Without knowing balanced material stocks & flows, the relevant measures might not be focused on priority sources and pathways, and thus they could be inefficient and costly [1].
European standardized MFA model of 1 km railway line Quantified material stocks & flows of 1 km railway line offer the possibility to analyse material scenarios in view of environmental loads at every stage of life-cycle. A standardized model al-lows benchmarking of different track profiles and operational activities for different railway companies. Consequently, mutual exchange of best practice and know-how is instrumental for improving environmental performance of railway infrastructure.
SCS7-GA-2008-218662
InfraGuidER
<INFRAG_WP2_VUT_DV5 > Page 31 of 46 15.09.2009
8 APPENDIX
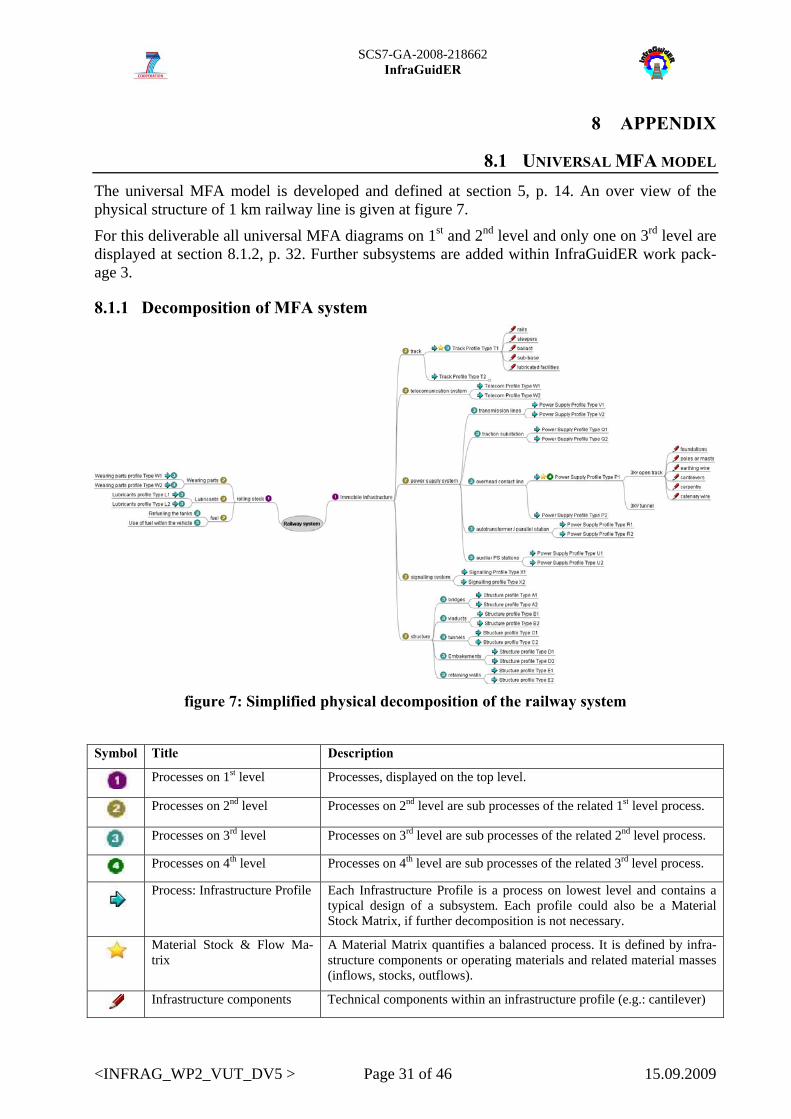
8.1 UNIVERSAL MFA MODEL The universal MFA model is developed and defined at section 5, p. 14. An over view of the physical structure of 1 km railway line is given at figure 7.
For this deliverable all universal MFA diagrams on 1st and 2nd level and only one on 3rd level are displayed at section 8.1.2, p. 32. Further subsystems are added within InfraGuidER work pack-age 3.
8.1.1 Decomposition of MFA system
figure 7: Simplified physical decomposition of the railway system
Symbol Title Description
Processes on 1st level Processes, displayed on the top level.
Processes on 2nd level Processes on 2nd level are sub processes of the related 1st level process.
Processes on 3rd level Processes on 3rd level are sub processes of the related 2nd level process.
Processes on 4th level Processes on 4th level are sub processes of the related 3rd level process.
Process: Infrastructure Profile Each Infrastructure Profile is a process on lowest level and contains a
typical design of a subsystem. Each profile could also be a Material Stock Matrix, if further decomposition is not necessary.
Material Stock & Flow Ma-trix
A Material Matrix quantifies a balanced process. It is defined by infra-structure components or operating materials and related material masses (inflows, stocks, outflows).
Infrastructure components Technical components within an infrastructure profile (e.g.: cantilever)
SCS7-GA-2008-218662
InfraGuidER
<INFRAG_WP2_VUT_DV5 > Page 32 of 46 15.09.2009
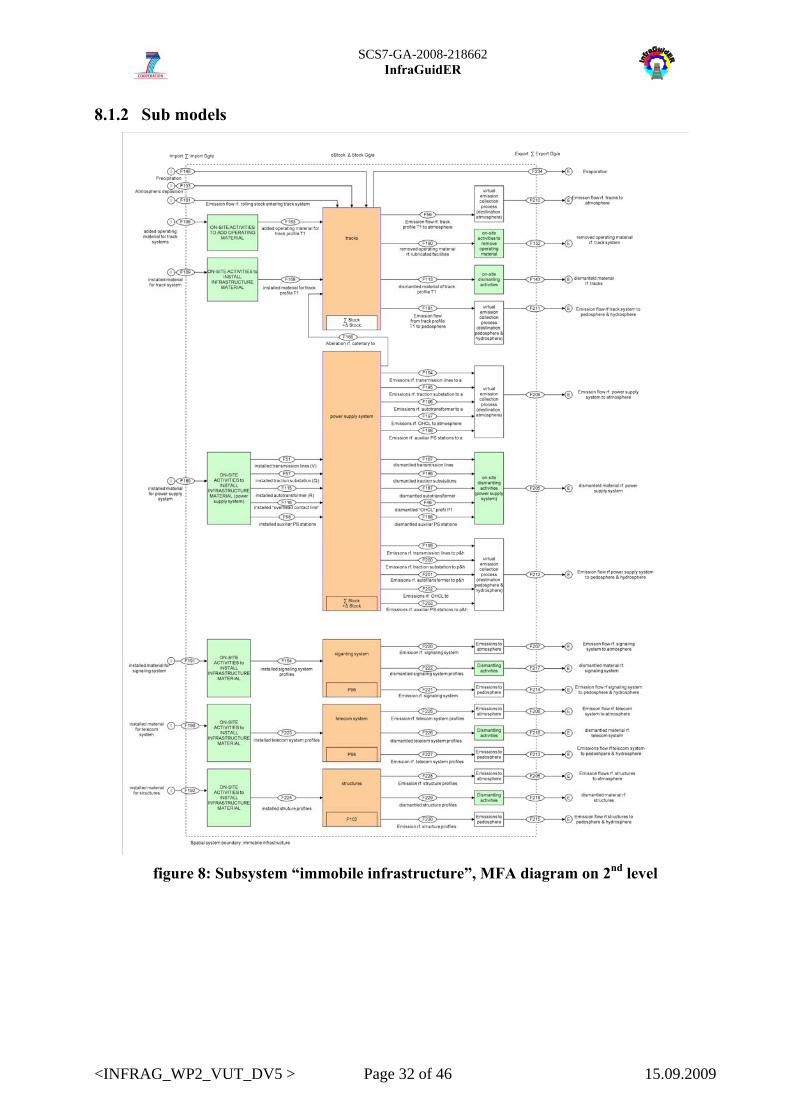
8.1.2 Sub models
figure 8: Subsystem “immobile infrastructure”, MFA diagram on 2nd level

SCS7-GA-2008-218662
InfraGuidER
<INFRAG_WP2_VUT_DV5 > Page 33 of 46 15.09.2009
figure 9: Subsystem “rolling stock, MFA diagram on 2nd level
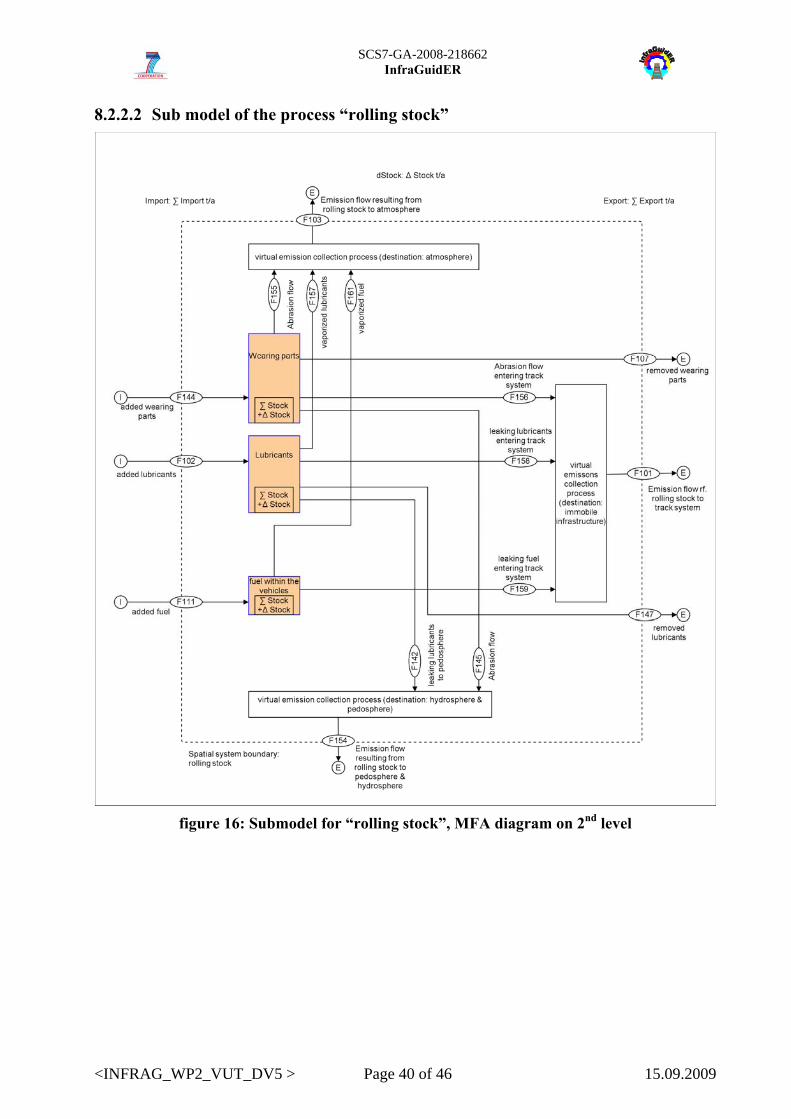
Virtual processes: They are created to keep a better overview of the system model on top level. Virtual processes, like “virtual emission collection process” are part of the MFA subsystems and only sum up sin-gle material flows. They always have only one export flow, which appears on the upper MFA level. Otherwise each single flow would appear on upper level. Consequently it reduces the number of flows on top levels.

SCS7-GA-2008-218662
InfraGuidER
<INFRAG_WP2_VUT_DV5 > Page 34 of 46 15.09.2009
Subsystem “power supply system”, MFA diagram on 3rd level

SCS7-GA-2008-218662
InfraGuidER
<INFRAG_WP2_VUT_DV5 > Page 35 of 46 15.09.2009
Subsystem “overhead contact line” profile P1, MFA diagram on 3rd level
8.2 MFA MODEL FOR CASE STUDY The universal MFA model is developed and defined at section 6, p. 22. An over view of the physical structure of 1 km railway line is given at figure 10.
For this deliverable all MFA diagrams on 1st and 2nd level and only one on 3rd level are displayed at section 8.2.2, p. 36. Further subsystems are added within InfraGuidER work package 3.
8.2.1 Decomposition of MFA system
figure 10: Simplified physical decomposition of 1 km railway line
Symbol Title Description

SCS7-GA-2008-218662
InfraGuidER
<INFRAG_WP2_VUT_DV5 > Page 36 of 46 15.09.2009
Processes on 1st level Processes, displayed on the top level.
Processes on 2nd level Processes on 2nd level are sub processes of the related 1st level process.
Processes on 3rd level Processes on 3rd level are sub processes of the related 2nd level process.
Processes on 4th level Processes on 4th level are sub processes of the related 3rd level process.
Process: Infrastructure Profile Each Infrastructure Profile is a process on lowest level and contains a
typical design of a subsystem. Each profile could also be a Material Stock Matrix, if further decomposition is not necessary.
Material Stock & Flow Ma-trix
A Material Matrix quantifies a balanced process. It is defined by infra-structure components or operating materials and related material masses (inflows, stocks, outflows).
Infrastructure components Technical components within an infrastructure profile (e.g.: cantilever)
8.2.2 Sub models
8.2.2.1 Sub model of the process “immobile infrastructure”
figure 11: Submodel for “immobile infrastructure”, MFA diagram on 2nd level
SCS7-GA-2008-218662
InfraGuidER
<INFRAG_WP2_VUT_DV5 > Page 37 of 46 15.09.2009
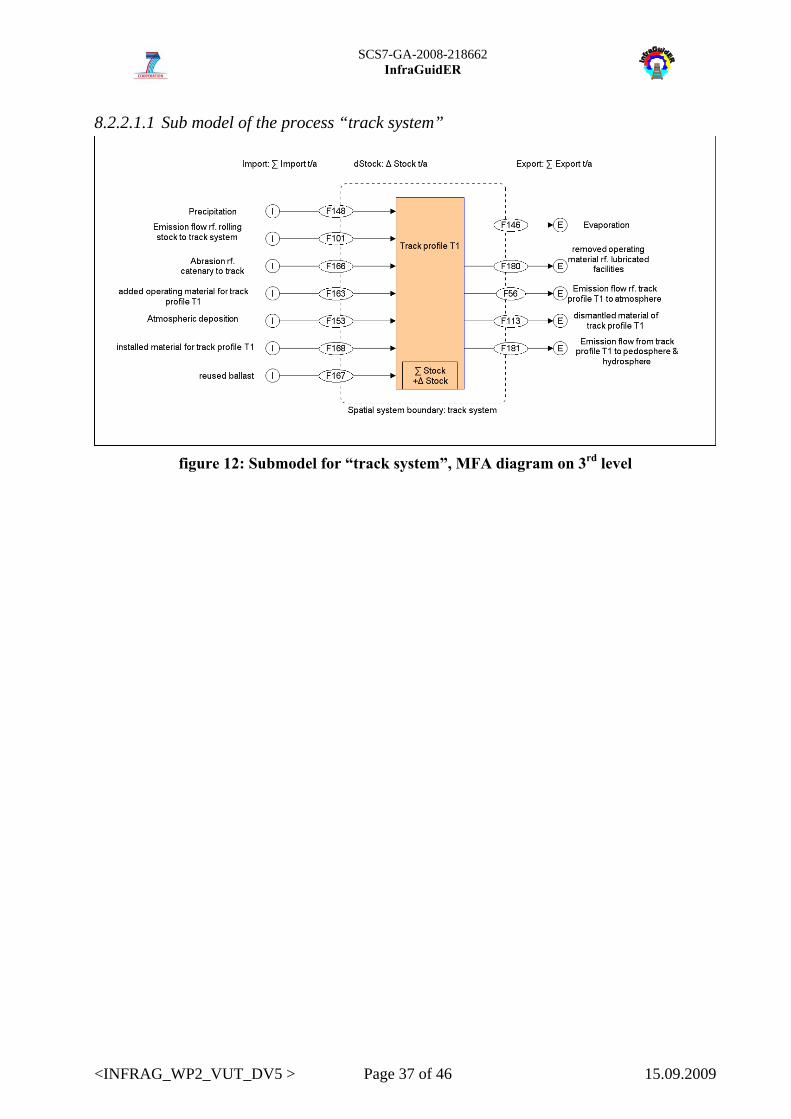
8.2.2.1.1 Sub model of the process “track system”
figure 12: Submodel for “track system”, MFA diagram on 3rd level

SCS7-GA-2008-218662
InfraGuidER
<INFRAG_WP2_VUT_DV5 > Page 38 of 46 15.09.2009
figure 13: Submodel for “track profile type T1”, MFA diagram on 4th level
8.2.2.1.2 Sub model of the process “power supply system”
figure 14: Submodel “overhead contact line”, MFA diagram on 3rd level
SCS7-GA-2008-218662
InfraGuidER
<INFRAG_WP2_VUT_DV5 > Page 39 of 46 15.09.2009
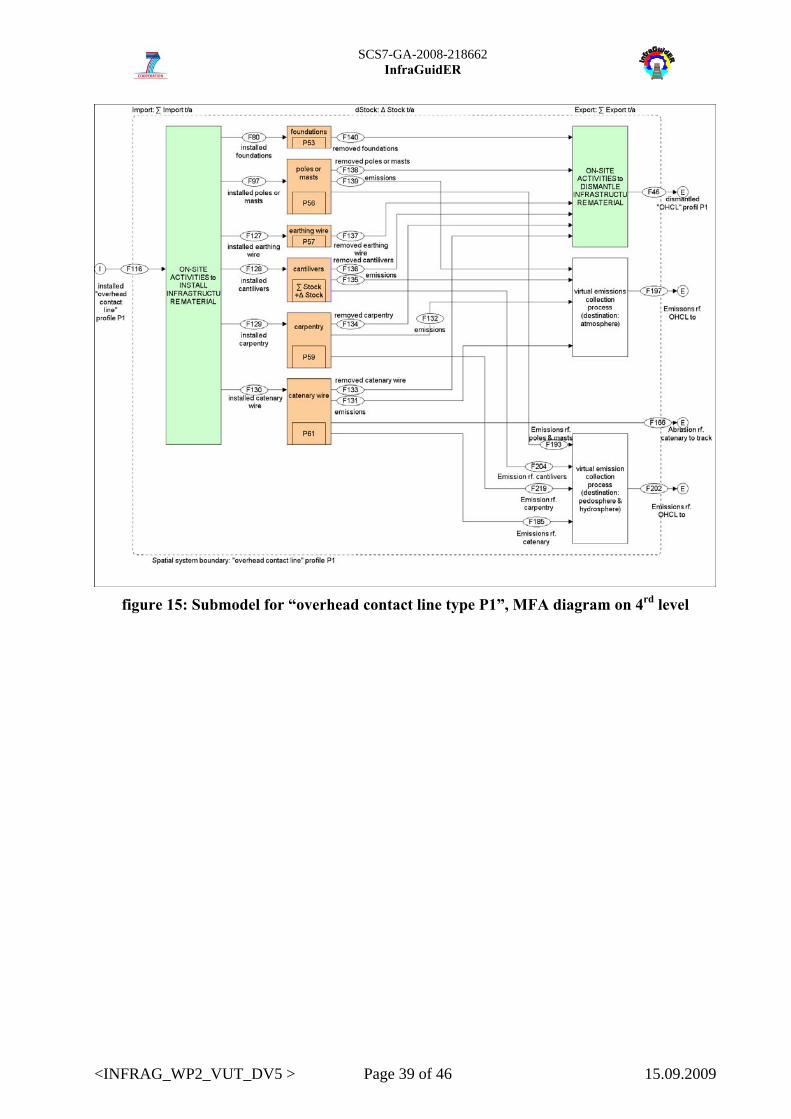
figure 15: Submodel for “overhead contact line type P1”, MFA diagram on 4rd level
SCS7-GA-2008-218662
InfraGuidER
<INFRAG_WP2_VUT_DV5 > Page 40 of 46 15.09.2009
8.2.2.2 Sub model of the process “rolling stock”
figure 16: Submodel for “rolling stock”, MFA diagram on 2nd level

SCS7-GA-2008-218662
InfraGuidER
<INFRAG_WP2_VUT_DV5 > Page 41 of 46 15.09.2009
9 DETERMINATION OF MFA QUANTITIES The data acquisition procedure has to be coordinated with WP3 participants before it is applied in view of D7 (draft material list) and D13 (Report on flows of good). BBRail and VUT devel-oped a standardized information gathering process to accelerate the acquisition procedure.
1. Naming all relevant Technical Profiles.
2. Stock & flow matrices for every profile: Defining related infrastructure components and related masses of goods.
3. Quantifying emission potentials.
9.1 TECHNICAL PROFILES Technical Profiles are placeholder for special types of infrastructure sub systems. According to the differences from railway system to railway system they could be individually named and de-fined by each IM. Rolling stock profiles are related to subsystems of the process “rolling stock” and displayed at figure 17; immobile infrastructure profiles are displayed at figure 18. Each pro-file is a new sub system within MFA diagrams and contains infrastructure components.
figure 17: rolling stock profiles related to MFA subsystems
figure 18: immobile infrastructure profiles related to MFA subsystems

SCS7-GA-2008-218662
InfraGuidER
<INFRAG_WP2_VUT_DV5 > Page 42 of 46 15.09.2009
figure 19: Example of one immobile Infrastructure Profile: Power Supply Profile Type P1
and contained infrastructure components (it’s a 3 kV overhead contact line)
9.2 STOCK & FLOW MATRICES Each technical profile is quantified by stock & flow matrices.
The Material Stock matrix defines material masses of existing infrastructure components with-in the railway system. The Material Inflow Matrix defines the material mass flow related to ex-isting infrastructure components caused by renewal and upgrading activities. The Material Out-flow Matrix defines the material mass flows, caused by renewal activities, related to the entering process.
Balancing the Material Inflow Matrix and Material Outflow Matrix results the depletion or ac-cumulation of materials within the stock respectively the amount of lost operating material (e.g.: abrasion of wearing parts or leaking oil).
The selection of materials is oriented on two aspects:
a) the material is part of the top 10 mass flows in the railway system or
b) the material causes environmental loads.
Summing up all material stock matrices results a first draft of material list (Deliverable 7). Ba-lancing all technical profiles quantifies the qualitative based MFA Diagram, which is developed and displayed within the deliverable on hand.
Section 9.2.1, p. 42 contains a set of example matrices dominated by materials which cause envi-ronmental loads. Section 9.2.2, p. 44 displays a set of example matrices dominated by material which are part of the top 10 mass flows.
9.2.1 Operating material Balancing the inflow and outflow matrices results the yearly amount of lost operating materials.

SCS7-GA-2008-218662
InfraGuidER
<INFRAG_WP2_VUT_DV5 > Page 43 of 46 15.09.2009
Brake pads Brake discsElectromagnetic Rail brake
finite element
n°
length (m)
volume (m3)
1 iron (kg/a)2 carbon (kg/a)3 silicon (kg/a)4 phosphorus (kg/a)5 manganese (kg/a)6 chrome (kg/a)7 copper (kg/a)8 sulphur (kg/a)9 tin (kg/a)10 boron (kg/a)11 molybdenum (kg/a)
…..
Technical d
ata
Material DataN°
INPUT FLOWS, Wearing parts profile Type W1: brake elements, REPLACEMENT
table 6: Material Inflow Matrix of the Wearing Parts Profile Type W1 (brake elements)
table 7. Material Lost Matrix of the Wearing Parts Profile Type W1 (brake elements)

SCS7-GA-2008-218662
InfraGuidER
<INFRAG_WP2_VUT_DV5 > Page 44 of 46 15.09.2009
table 8. Material Outflow Matrix of the Wearing Parts Profile Type W1 (brake elements)
9.2.2 Immobile Infrastructure Balancing the inflow and outflow matrices results the depletion or accumulation of materials within the stock.
Example: A Material Stock Matrix of the “Power Supply Profile Type P1” (3 kV overhead con-tact line) is shown at figure 19, page 42. The material stocks of this profile were quantified by BBRail (see table 10, p. 45).
foundationspoles or masts catenary wire earthing wire cantilevers carpentry
finite element 1,2 km 1,2 km 1,2 km 1,2 km 1,2 km 1,2 km
n° 26 26
length (m) 5190 2626
volume (m3) 4,1
1 steel (kg/a)2 stainless steel (kg/a)3 cast steel (kg/a)4 copper (kg/a)5 bronze (kg/a)6 alluminium (kg/a)7 silicone rubber glass (kg/a)8 concrete (kg/a)
Technical d
ata
Material DataN°
INPUT FLOWS, OHCL profile Type P1: 3 kVdc open track, RENEWALS
table 9: Material Inflow Matrix of the Power Supply Profile Type P1 (overhead contact
line: 3kV open track construction)

SCS7-GA-2008-218662
InfraGuidER
<INFRAG_WP2_VUT_DV5 > Page 45 of 46 15.09.2009
foundationspoles or masts catenary wire earthing wire cantilevers carpentry
Total OHCL material stock
finite element 1,2 km 1,2 km 1,2 km 1,2 km 1,2 km 1,2 km 1,2 km
n° 26 26
length (m) 5190 2626
volume (m3) 4,1
1 steel (kg) 4170 10174 203 2341 581 174692 stainless steel (kg) 57 573 cast steel (kg) 1700 17004 copper (kg) 4780 53 48335 bronze (kg) 134 1346 alluminium (kg) 842 36 8787 silicone rubber glass (kg) 168 1688 concrete (kg) 159930 159930
EXISTING MATERIAL STOCK, OHCL profile Type P1: 3 kVdc open track
Material DataN°
Technical d
ata
table 10: Material Stock Matrix of the Power Supply Profile Type P1 (overhead contact
line: 3kV open track construction) supported by BBRail
MATERIAL SENT FOR ON‐SITE RECOVERY OPERATIONS
WASTE SENT FOR OFF‐SITE RECYCLING OPERATIONS
WASTE SENT TO OFF‐SITE
INCINERATION
WASTE SENT FOR OFF‐SITE COMPOSTING
WASTE SENT TO OFF‐SITE LANDFILL
INERT MATERIAL
SENT TO OFF‐SITE
RECYCLING OPERATIONS
INERT MATERIAL
SENT TO OFF‐SITE LANDFILL
HAZARDOUS WASTE SENT FOR OFF‐SITE RECYCLING OPERATIONS
HAZARDOUS WASTE SENT TO OFF‐SITE
INCINERATION
HAZARDOUS WASTE SENT FOR OFF‐SITE LANDFILL
finite element 1 km 1 km 1 km 1 km 1 km 1 km 1 km 1 km 1 km
n°
length (m)
volume (m3)
1 steel (kg/a)2 stainless steel (kg/a)3 cast steel (kg/a)4 copper (kg/a)5 bronze (kg/a)6 alluminium (kg/a)7 silicone rubber glass (kg/a)8 concrete (kg/a)
N°
Technical d
ata
Material Data
OUTPUT FLOWS, OHCL profile Type P1: 3 kVdc open track, RENEWALS
table 11: Material Outflow Matrix of the Power Supply Profile Type P1 (overhead contact
line: 3kV open track construction)

SCS7-GA-2008-218662
InfraGuidER
<INFRAG_WP2_VUT_DV5 > Page 46 of 46 15.09.2009
10 PROCEDURES CREATING A MFA To draw an MFA, following procedures [see figure 20, p. 46] have to be optimized iteratively:
5. Definition of problem and adequate goals 6. Selection of system boundaries, processes, goods and substances 7. Mass flow of goods and substance concentrations in this flows are considered. Substance
flows and stocks are calculated, uncertainties considered. 8. Illustration and presentation
figure 20: Procedures creating a MFA [1]
11 ACKNOWLEDGEMENTS The authors wish to thank Joe Silmon (UoB, WP1 leader), Raul Carlson (eco2win, WP4 leader) and Paul Steckler (VUT) for revising and improving deliverable 5.
12 BIBLIOGRAPHY
1. Brunner, P.H. and H. Rechberger, Practical handbook of material flow analysis. Advanced methods in resource and waste management 1. 2004, Boca Raton, FL: CRC/Lewis. 318 p.
2. OECD, Measuring Material Flows and Resource Productivity - The OECD Guide. 2007, OECD.
3. Burkhardt, M., et al., Gewässerschutz bei Bahnanlagen. 2005, EAWAG.