customer perception of service, store image and product assortment
TRANSCRIPT
VAASA UNIVERSITY OF APPLIED SCIENCES
Emma Aspfors
CUSTOMER PERCEPTION OF SERVICE,
STORE IMAGE AND PRODUCT
ASSORTMENT – FROM AN INTERIOR
STORE PERSPECTIVE
Business Economics and Tourism
2010
FOREWORD
The importance of customer perceptions, how the perceptions are formed and the
impacts they have on the success of a business has always fascinated me, hence
the subject of this thesis was rather clear to me, however, the opportunity to write
about this from an interior store perspective made the work even more interesting
to me.
Therefore, I first would like to thank my case company, Sisustus CASA, for all
their time and support; this project was only possible with their help. I also would
like to express my thankfulness to my supervisor, Rosmeriany Nahan-Suomela,
for all her time, assistance, advices and support.
Finally, I would like to thank everybody who has encouraged me and influenced
me during the entire process.
Vaasa, 17 May 2010 _______________________________________
VAASA UNIVERSITY OF APPLIED SCIENCES
Degree Program of International Business
ABSTRACT
Author Emma Aspfors
Topic Customer perception of service, store image and product
assortment – from an interior store perspective
Year 2010
Language English
Pages 65 + 1 Appendix
Name of Supervisor Rosmeriany Nahan-Suomela
It is only when you know your customers’ perceptions of your business, your service and your products, that you truly know whether your business is going in the right direction or not. Everything what the customers see, hear and experience is linked together and forms their overall perception of the company. A substantial amount of studies on customer perceptions have been done but findings from an interior store perspective are few, moreover, the findings are very industry specific and therefore, not necessary applicable. This study is done for a case company, an interior store, specialized in design furniture.
The purpose of this thesis is to find out how the case company’s customers perceive them, both when it comes to the actual store itself but also, more importantly, how the customers experience the service they receive and the products they are offered. The first objective of the study is to analyze the existing customers’ perceptions of the store, the products and the service. The second objective is to investigate how the case company can use this knowledge and develop the business and customer service even further. In addition, the thesis refers to several international articles about customer perceptions, these articles will also be examined in order to find out if the findings are applicable for the local case company.
The answers to the stated research questions were gathered by conducting a quantitative questionnaire among the case company’s customers. The results showed on the strengths and the weaknesses of the case company. The customers deemed that the case company sell products of high quality and unique products that cannot be found elsewhere in the region, however even though they offer
excellent customer service this cannot be seen as the one factor that gives the case company most advantage compared to other stores.
Keywords Customer perception, image, customer service, product
range
VASA YRKESHÖGSKOLA
Internationell handel
ABSTRAKT
Författare Emma Aspfors
Lärdomsprovets titel Customer perception of service, store image and product
assortment – from an interior store perspective
År 2010
Språk Engelska
Sidantal 65 + 1 Appendix
Handledare Rosmeriany Nahan-Suomela
Det är endast när man vet kundernas uppfattning om ett företag, dess service och de produkter företaget erbjuder som man på riktigt vet i vilken riktning företaget går. Allt det som kunderna hör, ser och upplever påverkar i någon mån deras uppfattning om företaget. Det har redan tidigare gjorts en hel del undersökningar kring detta ämne men undersökningar ur ett inredningsföretags synvinkel är få, dessutom är resultaten oftast användbara endast inom den specifika bransch de är gjorda. Därför är denna studie gjord utifrån detta perspektiv, för ett inredningsföretag, specialiserat på design möbler och inredning.
Syftet med denna studie är att ta reda på hur företagets kunder uppfattar dem, både när det gäller specifikt deras butik men också när det gäller den service och de produkter de erbjuder. Målet med studien är att analysera kundernas uppfattning samt undersöka hur företaget kan använda sig av denna kunskap i framtiden för att utveckla deras affärsverksamhet och kundservice ännu mera.
Svaren till de framställda frågorna samlades in genom en kvantitativ undersökning bland företagets kunder. Resultaten från frågeformuläret visade klart på företagets styrkor och svagheter. Bland annat ansåg kunderna att företaget säljer unika produkter av hög kvalitet, även deras service var av hög kvalitet men denna faktor kan inte ses som deras största konkurrenskraftiga fördel jämfört med andra företag.
Ämnesord kunduppfattning, kundservice, image, produktutbud
6
CONTENTS
List of figures 9
List of tables 9
1. INTRODUCTION 10
1.1. Research problems and objectives 11
1.2. Research methods and limitations 12
1.3. General company introduction 12
1.3.1. Ab Sisustus CASA Oy 12
1.4. Importance of customer perception 13
2. CUSTOMER PERCEPTION OF SERVICE 15
2.1. Quality elements 15
2.1.1. Quality as a loyalty factor 17
2.2. SERVQUAL 18
3. CUSTOMER PERCEPTION OF STORE IMAGE 22
3.1. Store image 22
3.2. Store atmosphere 25
3.2.1. Sight 28
3.2.2. Hearing 28
3.2.3. Touch 29
3.2.4. Smell 29
7
3.2.5. Taste 30
3.2.6. The Mehrabian-Russell model 30
4. CUSTOMER PERCEPTION OF PRODUCT RANGE 32
4.1. Product strategy 33
4.1.1. A width vs. a depth assortment 34
4.2. The portfolio matrix 36
4.3. Arranging and displaying of merchandise 37
4.4. Summery of theory 38
5. RESEARCH METHODOLOGY 41
5.1. Research methods 41
5.1.1. Questionnaire design 44
5.2. Validity and Reliability 45
5.3. The structure of the questionnaire 46
5.4. Data analysis 46
5.4.1. Part one - General 47
5.4.2. Part two – Image 49
5.4.3. Part three - Service 51
5.4.4. Part four- Products 53
6. CONCLUSION AND DISCUSSION 56
6.1. Discussions with Sisustus CASA 56

8
6.2. Suggestions for improvements 58
7. SUMMARY 60
LITERATURE 63
APPENDIX
9
LIST OF FIGURES AND TABLES
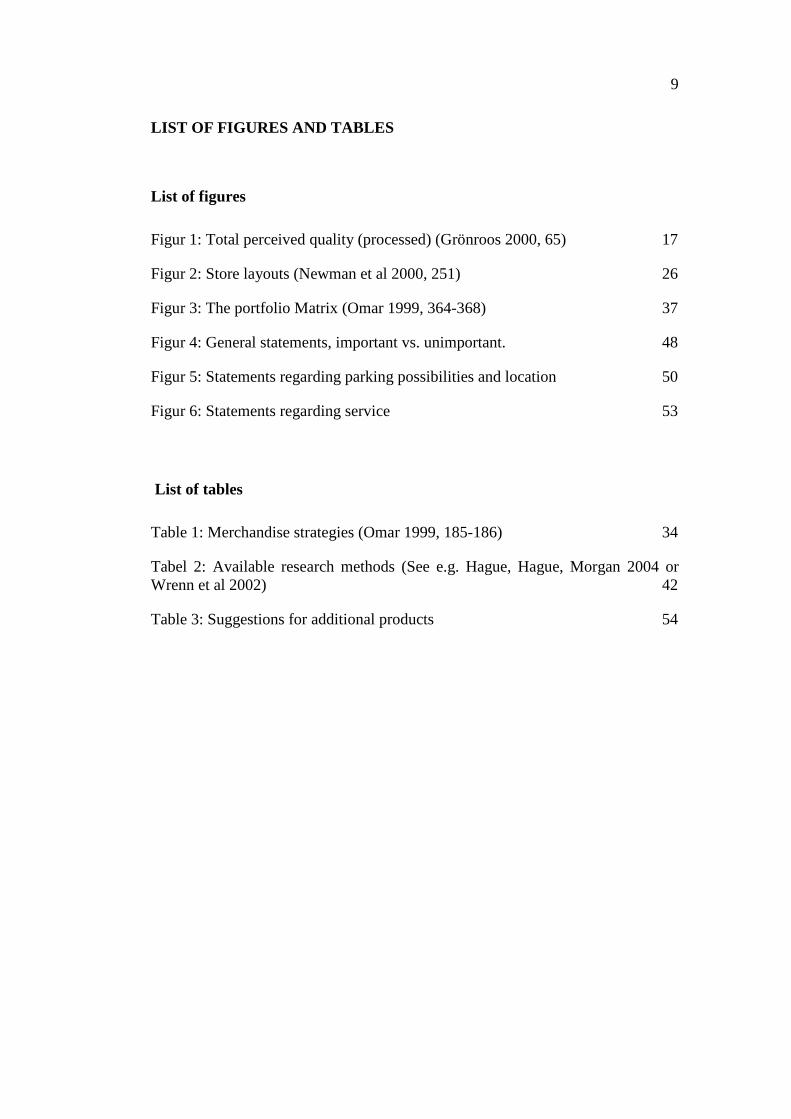
List of figures
Figur 1: Total perceived quality (processed) (Grönroos 2000, 65) 17
Figur 2: Store layouts (Newman et al 2000, 251) 26
Figur 3: The portfolio Matrix (Omar 1999, 364-368) 37
Figur 4: General statements, important vs. unimportant. 48
Figur 5: Statements regarding parking possibilities and location 50
Figur 6: Statements regarding service 53
List of tables
Table 1: Merchandise strategies (Omar 1999, 185-186) 34
Tabel 2: Available research methods (See e.g. Hague, Hague, Morgan 2004 or Wrenn et al 2002) 42
Table 3: Suggestions for additional products 54
10
1. INTRODUCTION
One of the best ways to raise the service level is by knowing the customers
perceptions (Zemke, Woods 1998, 273). Therefore, the focus of this thesis will be
on how a small retail business can develop their customer service, image and
product range by knowing how their customers experience them. Retail businesses
do not only nowadays face competition from other retailers; they also face
competition from, for example, mail order catalogues and internet shopping, in
addition retailing have nowadays become much more international. For that
reason, it is essential to recognize customers’ needs and wants, as well as which
the elements are that attract them to visit particular stores. (Paulins, Geistfeld
2003, 371) Ab Sisustus Interior CASA Oy is the case company. The company is
an interior store situated in Vaasa. The store is specialized in classic and trendy
design furniture and lightning.
The concept of customer perception is built up by customer experiences, how they
perceive the service they are offered and ultimately by whether they actually are
satisfied with their experiences or not. One way of competing more successfully
for small businesses today is by offering true customer service and service quality
(Wilson, Zeithaml, Bitner and Gremler 2008, 78). Eventually, the success of the
business is settled by how strongly the image of the store and the products the
store is selling meet the customers expectations. (Porter, Claycomb 1997, 373)
Personal customer service is a crucial aspect of the case company’s business idea
and Sisustus CASA offers, apart from the items in the store, furnishing and
interior planning for both business-to-business customers and private persons.
During the years of operation, the company have established many long-term
customer relationships. (CASA 2009)
A Norwegian study by Solvang (2007) found out that customer service within the
furniture retail business is of great importance. Compared to other retail
industries, e.g. the grocery industry, the aspect of service is much more crucial for
business success within this sector. In furniture stores, customers depend much
more on the service and advices given by staff than in normal grocery stores,
11
which are to a great extent self-service oriented. It is then not surprising that
customers’ perception of service and the image of furniture stores are closely
linked to customer loyalty and satisfaction. (Solvang 2007, 110) Customer service
and customers’ perceptions are always important but especially for small
businesses. By knowing the customers’ perception, how they perceive service,
selection/products, prices, location and cleanliness, customers’ satisfaction and
ultimately the success of the business can be affected.
1.1. Research problems and objectives
The purpose of this thesis is to find out how the case company’s existing
customers perceive them; both when it comes to the actual store itself but also,
more importantly, how the customers experiences the service they receive and the
products they are offered. What do their customers think of Sisustus CASA and
what do they relate to the company’s brand? How can they serve their customers
even better in the future?
The objectives of this thesis are two folded. Firstly, the aim is to analyse the
existing customers’ perception of the store, its products and service. Secondly, the
aim is to investigate how the company can use this knowledge and develop their
business and customer service even further.
Quite a substantial amount of research have been done already about customer
perceptions within several different context, mainly within the grocery industry
and department stores. However, customer perception studies from an interior
store perspective are hard to find, moreover customer perception studies done
within other industries, segments and from other countries does not necessary be
applicable within this context. The theoretical part in the thesis refers to several
international articles about customer perceptions, hence, in addition to the stated
objectives mentioned above the analysis in the end of the paper will examine if
these international studies were valid within this framework.
12
1.2. Research methods and limitations
The purpose of this study is descriptive and the research will be done by
conducting a quantitative questionnaire among the case company’s existing
customers. The results from the questionnaires will be analyzed and discussed, at
the end, possible improvements will be suggested.
Due to the limited amount of resources and time, this study will contain some
restrictions. This study is restricted to only the company’s business to consumer
market and the focus will be on their already existing customers. Over the years,
the case company has developed many long-term customer relationships; hence,
the focus will be on the business to consumer market. A customer perception
study will benefit the case company in the sense that they will find out how they
better can serve their customers in the future. The customers’ perceptions will
further be restricted to only the customers’ perceptions of store service, products
and store attributes.
1.3. General company introduction
As already mentioned this thesis will focus on one case company. In order to
understand the business ideas and concepts behind this company, a brief
introduction of the company will follow.
1.3.1. Ab Sisustus CASA Oy
An architect originally founded Sisustus CASA in the beginning of the 70’s. At
that time, the store was rather unique in Vaasa and it acted more as a complement
to the architect’s own office. The company served its customers by planning and
creating stylish design for all kind of homes and offices. The current owner,
Katarina Kivistö, bought the store two years ago and today the company employs
two full time workers and some extra part time workers when needed. (Kivistö,
2009)
Nowadays the company offers its customers design furniture and lightning, as
well as carpets, fabrics and gift articles. In addition, as a complement to the store,
13
the company offers interior planning, home visits and interior textile advises
(CASA 2009).
CASA’s customers can be described as both business and private customers; they
are customers who value timeless design products and they appreciate customer
service and quality. CASA aims at always finding the best solution for their
customers when it comes to interior planning and design products and they want
their customers to trust on their creativity and eye for beauty (Kivistö, 2009).
Choosing quality products and right materials are one way for them to make sure
that the customers will be satisfied with the outcome. (CASA 2009)
The total net sale for CASA was 139.000€ in 2008, CASA is a private limited
company, this can be seen from the company name, Ab (Aktiebolag) in Swedish
and Oy (Osakeyhtiö) in Finnish. (ProFinder B2B 2009)
1.4. Importance of customer perception
The theoretical outline of this thesis will be divided into three main parts, the
theories behind customer perceptions of service, store image and products. Before
introducing and analyzing the importance of customer perception within these
different categories, a short definition of perception and its elements will follow.
The definition of perception can be said as the process in which a person select,
arrange and interpret stimuli, these stimuli are filtered and adjusted to become
ones own view of the world. Even though exposed to the same thing, in the same
environment, two persons will never experience the same. (See e.g. Schiffman and
Kanuk). We live in a world today where we daily are exposed to millions of
different stimuli; different smells, sounds, tastes, sights and textures. Our brain
takes in and processes only a small number of all these stimuli. (Solomon,
Bamossy, Askegaard and Hogg, 2006, 36)
The whole perception process is made up by three stages, the exposure stage, the
attention stage and the interpretation stage. The brain takes in the stimuli in the
attention stage and interprets the stimuli, according to our previous experiences
14
and desires, in the interpretation stage. Ultimately, these three stages form our
perceptions. (Solomon, Bamossy, Askegaard and Hogg, 2006, 36)
It is only when the customers’ perceptions of the business, the products and the
services are known, that you truly know whether or not the business is going in
the right direction. All interactions that occur between the customers and the
business will ultimately affect the customers’ view and image of the business.
Excellent customer service is far from enough, for example, if the store is located
far from the customers and on a place where there are no parking places outside
these aspects will effect the perceptions. Selling top class products is a
prerequisite for many stores in order to keep customers, but if the staff is
unfriendly, the store will eventually start to lose its customers. All what customers
see, hear and experience is linked together and forms their overall perception of
the business, this is why it is essential for the case company, Sisustus CASA, as
well as for all businesses to know the customers perceptions.
The meaning of customer perception is most often used in the content of how
customers perceive the quality of the service they are offered. More widely
speaking customer perception is also the customers’ overall picture of the
company, including company image, expectations, external influences, service
quality etc.
15
2. CUSTOMER PERCEPTION OF SERVICE
In this part, customer’s perception of service will be discussed. Firstly, the
importance of high quality service will be considered and later on the elements of
service quality; the technical, functional and relational quality dimensions will be
argued. At the end, the advantages and disadvantages with the SERVQUAL
model will be explained.
Customer’s perception of service quality can generally be divided into the
perception of reliability, responsiveness, assurance, empathy and tangibles. These
aspects will be discussed more profound later on, as the SERVQUAL model is
explained. Together with the product price and quality, service quality forms the
broader concept of customer satisfaction. Ultimately, if customer’s experiences
exceed their expectations, customer satisfaction together with situational and
personal factors will result in customer loyalty (Wilson, Zeithaml, Bitner and
Gremler 2008, 79). It is of great importance, to win customer loyalty especially
for smaller businesses. Small businesses do not have the same budget as larger
companies, and keeping existing customer is by far much cheaper than finding
new ones. Offering excellent customer service will not only lead to customer
loyalty, it will also give smaller firms a competitive advantage against larger
companies (Longenecker, Moore, Petty, Palich 2005, 290). However, customers’
service expectations varies according to store type, customers expect a much more
wide-ranging service in specialty stores compared to discount stores. Sisustus
CASA can be described as a specialty store in this perspective, why customer
service can be seen as essential (Paulins et. al 2003, 371).
2.1. Quality elements
Another way of explaining the concept of perceived quality is by looking at the
quality dimensions. What customers obtain and how they obtain it, or in other
words the technical and functional quality. Every time an interaction between a
customer and a seller occurs, the outcome of the interaction will affect the
customer’s perceptions. If a customer selects a design chair from an interior store
it can be explained as the technical quality of the outcome. The customer can
16
evaluate this buyer-seller interaction rather objectively; it is what the consumer is
left with: the product (Grönroos 2000, 63-65). The technical quality is also
associated with the merchandise selection and the width and depth of the product
range, hence this will be discussed in more detail under the product range section
(Odekerken-Schroder, Wulf, Kasper, Kleijnen, Hockstra, Commandeur 2001).
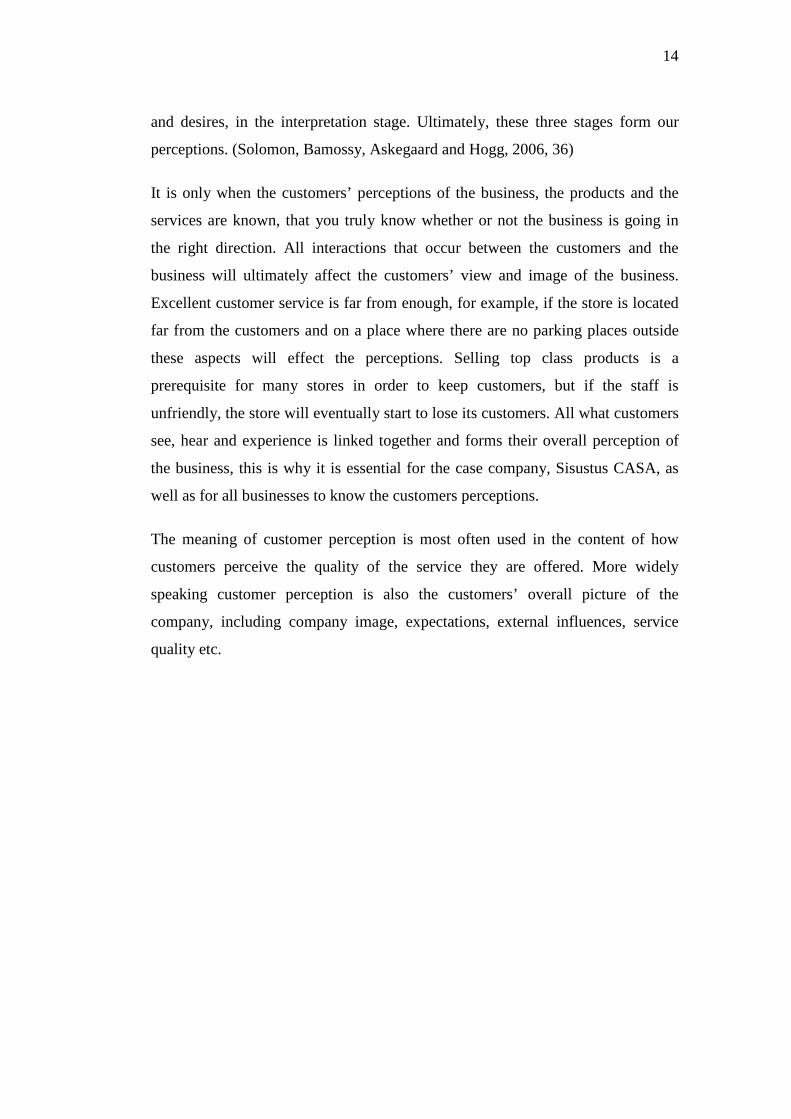
The second dimension, the functional quality dimension, is on the other hand
more complex for the buyer to measure. This is how the customer receive the
service of picking out a design chair and to what extent the sales person is
professional. Can s/he give good advises or are there other disturbing elements
e.g. other customers or poor lightning. All these factors will have an impact on the
customer’s perception of the whole service process. These dimensions will,
together with the company image form the total quality perception (Figure 1).
Even though an interior store is selling top design products and is offering well-
known brands, it does not mean that the customer’s total quality perception is
excellent. If the staffs are lacking interior skills, if the services they are offering
are unfriendly or if the atmosphere in the store is appalling it does not matter how
good products they are selling, the image of the company will not be good. If
mistakes occur, which they do sometimes, it is easier for a company with an
already well-known image to repair them without it necessarily having to affect
the company image, as customers often then are more tolerant. However, mistakes
made by a company with an already damaged image will be seen by customers as
larger failures than they actually might be. A good company image can in many
cases act as a protecting filter for a bad quality perception. (Grönroos 2000, 63-
65)
17
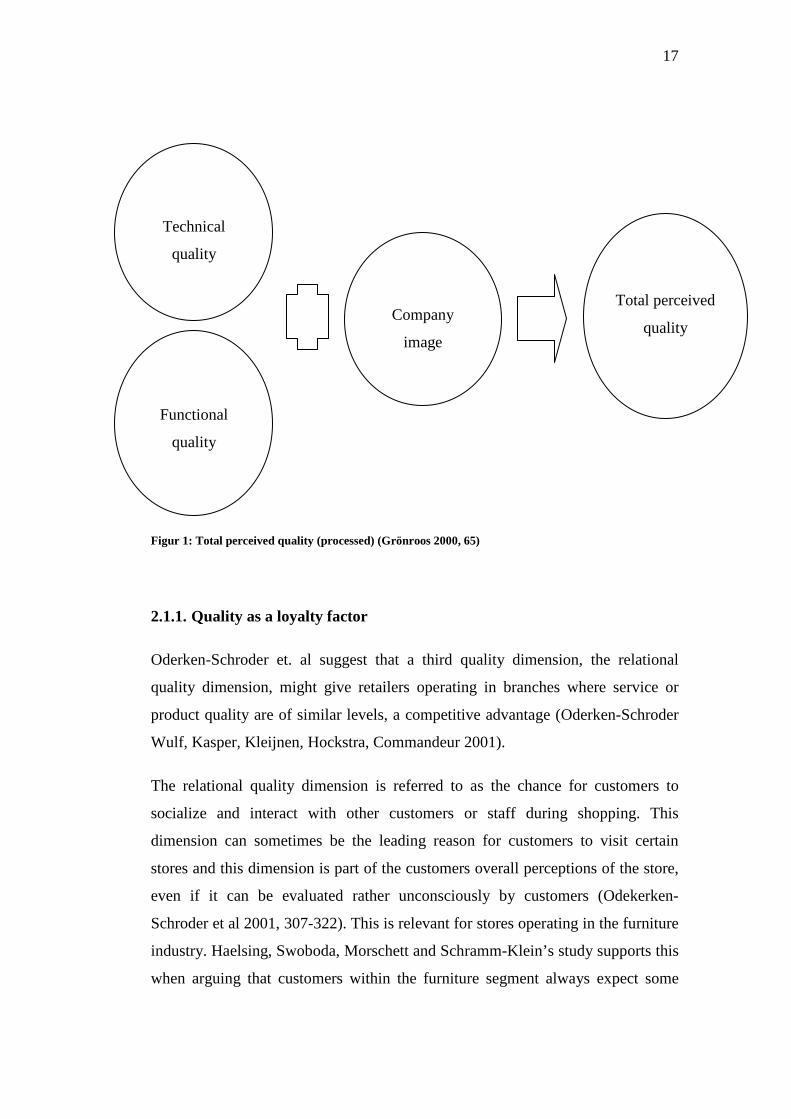
Figur 1: Total perceived quality (processed) (Grönroos 2000, 65)
2.1.1. Quality as a loyalty factor
Oderken-Schroder et. al suggest that a third quality dimension, the relational
quality dimension, might give retailers operating in branches where service or
product quality are of similar levels, a competitive advantage (Oderken-Schroder
Wulf, Kasper, Kleijnen, Hockstra, Commandeur 2001).
The relational quality dimension is referred to as the chance for customers to
socialize and interact with other customers or staff during shopping. This
dimension can sometimes be the leading reason for customers to visit certain
stores and this dimension is part of the customers overall perceptions of the store,
even if it can be evaluated rather unconsciously by customers (Odekerken-
Schroder et al 2001, 307-322). This is relevant for stores operating in the furniture
industry. Haelsing, Swoboda, Morschett and Schramm-Klein’s study supports this
when arguing that customers within the furniture segment always expect some
Company
image
Total perceived
quality
Functional
quality
Technical
quality
18
service and therefore it is difficult to use service quality as a competitive
advantage (Haelsing, Swoboda, Morschett, Schramm-Klein 2007, 428).
The findings of Oderken-Schroder et al’s study show that higher levels of
relational quality lead to store loyalty, especially among women, while in contrast
higher levels of functional or technical quality does not or not at least to the same
extent. Moreover, the findings are equally among small and large stores as well as
among grocery and non-grocery stores, making the current study also valid for
Sisustus CASA. Relational quality can be encouraged for example, by, arranging
sitting areas in the store, by offering refreshments or by organizing customer
events (Odekerken-Schroder et al 2001, 307-322).
However, the relational quality dimension can also be referred to as the
relationship to the service provider, perceived by the customer. The two most
central aspects are then that the customer is familiar with the business and the
service provider and that the customer has confidence in the company. The better
the customer and the service provider know each other the more valuable the
interaction between them will be. (Bruhn, Georgi 2006, 136-137). Since the case
company is a small store with many long term, well known customers the
relational quality dimension can be argued to play a significant role when it comes
to the customers perceptions of the total service quality.
2.2. SERVQUAL
Service quality was clarified in the previous parts with the help of the quality
dimensions. The most widely used method to measure customer perceived service
quality is with the SERVQUAL model by Zeithaml, Parasurman and Berry
(1988). This instrument was originally based on 10 different determinants and on
the aspects of customer’s service expectations and service experiences delivered.
In a later study, these determinants were reduced to the five determinants
mentioned previously in the text: reliability, assurance, tangibles, empathy and
responsiveness.
19
Reliability: The firm provides its customers with the right service, at the right time
and without mistakes from the beginning.
Assurance: The customers believe in the firm and feel safe with the service
provided. The employees are service minded and professional with sufficient
knowledge.
Tangibles: The firm’s facilities and equipments are appealing as well as the
service personnel’s appearance.
Empathy: The firm tries to solve its customer’s troubles in the best way and
always acts in the interest of its customers.
Responsiveness: The firm gives its customers proper service and is always service
minded.
The total perceived quality is calculated by using several attributes describing the
determinants. The respondents are asked to measure how well their expectations
meet their experiences. The general score is based on the gap between their
expectations and experiences. Except for the overall score determined, the scores
for the individual determinants are vital for finding out specific service quality
perceptions. (Grönroos 2000, 73-78)
Even though the SERVQUAL model has been widely used it has also been
exposed to a substantial amount of discussions and criticism (see e.g. Gilmore
2003, Szwarc 2005). The most common criticism given is regarding
expectations/experiences. Depending on what you want to find out different kinds
of expectations can be measured, and the time when you measure the expectations
are crucial for the validity of the research. If measuring expectations at the same
time, or after, measuring experiences it might not be the right expectations
measured. On the other hand, measuring expectations on before hand can also
give misleading results. The respondent’s later experiences can change his/hers
expectations and then the quality perception will be misleading, since wrong
expectations are compared with the respondents experiences. (Grönroos 2000, 73-
78)
20
Measuring perceived service quality according to the gap between expectations
and performance often leads to the apprehension that lowering customer
expectations and over deliver is the best way of ensuring that customer
expectations will be met and surpassed. A study made by Hamer 2006 argues that
this might not be the best way of increasing customer perceived quality. Under
promising will give the customers an image of the firm as a “low quality service
provider” and even though the customer’s expectations are exceeded, the image of
a company with low service quality will somewhat remain. The same is true also
the other way around, expecting great service will give the company a image of
great service providers, if they meet these expectations, even though the gap
between high expectations and high experiences are non-existing or small. Under
promising but over delivering can still give the customers the perception of good
service quality but it will not lift the business to its most advantageous level.
Reasonably promising and to deliver what has been promised would increase
customers perceived service quality the most. (Hamer 2006, 219)
As opposite to the SERVQUAL model, Hamer’s study proposes that perceived
service quality should not be measured comparing expectations against
experiences. Instead, expectations and perceived performances should be
measured independently and then averaged. (Hamer 2006, 219)
The SERVQUAL model was explained in this context because it is the most
widely used model to measure service quality, however, it has never completely
been proved that the SERVQUAL model is the most suitable instrument to use
from an retailer perspective. The instrument was originally created to measure
only customer perceived service quality but in order for the instrument to be valid
from a retailer perspective additional dimensions needs to be included. The reason
behind this is that there are many other things that affect customers perceived
service quality when shopping for products in a store than when only receiving
pure service. Everything that happens from the minute the customer enter the store
until the customer leaves with the product will affect the perceived service quality.
(Dabholker, Thorpe, Rentz 1996, 3-16)
21
Within this context the additional dimensions of customer perceptions of store
attributes and product range is added in order to fully understand customers
perceptions of the case company. Hence, this study will not only measure
customer perceived service quality.
22
3. CUSTOMER PERCEPTION OF STORE IMAGE
Last chapter discussed the importance of service quality and the elements of
service quality and how it can be measured. In this part, the focus moves from
customer perception of service to the importance of customer perception
regarding store image and store atmosphere. The concepts of store image and
store atmosphere are in many cases very blurred and the concepts are often used
concurrent. Therefore, a short definition of the concepts used will be given in the
beginning of both parts. This chapter will also reflect on the role our senses play
when forming perceptions and how our own self-image affect store perceptions.
Retailers store image differs a little bit from the store image of for example
manufactures. It is not only the image of the products the retailer is selling that
affects them; the store also has an image of its own (Schiffman, Kanuk 2000, 150-
151). At the end of this chapter, the Mehrabian-Russell model will be explained
and the usefulness of the model within this context will be discussed.
3.1. Store image
Store image = store image can basically be defined as customers perception of a
store, or in other words what customers think of a store based on the stimuli they
receive with their senses. (Peter, Olson 2005, 484-485)
Dimensions frequently included in the store image concept, except for store
atmosphere, are for example customer’s image of facilities, clientele, convenience
and products. These dimensions are explained by several attributes, for example, a
product can be explained by the attributes of price, quality, design and range.
Creating an appealing store image that speaks to ones customer segment is
important for retailers in order to attract customers (Peter, Olson 2005, 484-485).
Attracting customers and differentiating one from competitors have become
increasingly important. The store image is also something that continually needs
changes as shopping behavior and competition changes. (Peter, Olson 2005, 484-
485) This can be illustrated with the Whoolrich example. Whoolrich is one of
America’s oldest outdoor clothing companies. When they updated their store
image in a more fashionable way, their home product sales increased with a
23
significant 50% the first year. (Horstdesign 2009) This shows the importance of
knowing how the customers experience the store and knowing the customers
needs and wants. The key for a successful store image is to create an image that
matches with the targeted consumer’s expectations and with the overall
objectives. A well-managed store image is crucial because it affects:
• The store position in the mind of the consumer
• Customers store preference
• How often and from how far customers visit the store
• Customer loyalty
The better the image of the store is the more the customers will be attracted to it
(Newman, Cullen 2002, 243-244).
When elucidating the concept of store image in more detail it can be split into two
different elements. The physical characteristics of the products sold in the store,
e.g. quality, availability and price, as well as the psychological effects these
characters have. The second element includes the store exterior and the interior
design e.g. store layout, atmosphere, and displays. (Newman, Cullen 2002, 243-
244)
The customer’s image of himself or herself also plays a major role in the store
image concept. The store image needs to send signals of belongingness to the
customers. Social factors are very important here, as customers tend to choose
stores that fit their self-image or their desired self-image (Newman, Cullen 2002,
243-244). A common method when observing the most important store
dimensions for a particular store is to look for congruency elements connecting
the targeted customer’s self-image to the store image. If there are strong
connections between the self-image and the store image the level of store loyalty
will be higher. For example, people who emphasize individuality look for stores
who share the same dimension. The store choice will be made based on
connections between important elements in their self-concept and stores with an
24
image that share these personal values. Another example illustrating the same
could be: “I am a trendy person with high class therefore, I also shop at a store
with a high class image”. If the persons perception of a store is high class, but also
that the store is not trendy, shopping at that particular store will create a conflict
among that customer since she also see herself as trendy, this will probably lead to
that the customer is not fully loyal to the store. If storeowners know what is
important to their targeted customers they can use this knowledge and create a
store image based on the same values (Davies, Ward 2002, 184-187) (Omar 1999,
108-109).
A favorable store image does not only affect purchase behavior in a positive way,
it can also provide the customers with “added value”. Benefits in the sense that
customer’s feel that a particular product is worth more when it is bought from a
certain store. For example, some people might feel restrained telling friends that
they bought a chair from a low-fashion furniture store located in a suburban area
outside town. As it feels much better telling them that, the chair is bought from a
fancy furniture store in the city centre, even though the chair is cheaper in the
non-fancy store. Buying from the fancy furniture store gives the customer a
feeling of “added value” because the image of that particular store is high and it
matches with the preferred self-image of the customer. A favorable store image
does not only act as a competitive advantage, customers are also prepared to pay
more for the products and it gives the retailer an advantage when discussing with
suppliers (Davies et. al 2002, 187-189).
A positive correlation between store image, customer satisfaction and ultimately
store loyalty has been found in several researches (see e.g. Bloemer and de Ruyter
1998). However, one has to be careful with the concept of store loyalty since there
can be several reasons behind it. Shopping at one store all the time does not
necessary mean that the customer is loyal to that store, it can simply mean that the
store is close by the workplace and that there is good parking places outside. As
soon as there is another store closer by, the risk is that the customer change store.
As already mentioned a flattering store image can be seen as a competitive
advantage and it is an advantage complicated for competitors to copy. However, if
25
damage occur to this image it can be even harder to restore it than to build it in the
first place. (Davies et. al 2002, 189-190)
3.2. Store atmosphere
Store atmosphere = Store atmosphere is the more unconscious concept involving
customers emotions in the store. These emotions are, to a certain extent, complex
for customers to explain fully. Store atmosphere is usually included in the broader
concept of store image (Peter, Olson 2005, 484-486).
Among others, Donovan and Rossiter (1982), found in their research that creating
a pleasant and stimulating store environment has an impact on the time and money
spent in the store, on top of that it also affects shopping enjoyment, enthusiasm to
speak to employees, spending additional money and on the possibility of returning
to the store (Peter, Olson 2005, 485-486). However, a poor environment compared
to competitors located close by, have a larger effect on purchase decisions than a
pleasant environment. A poor environment can affect customers to that extent that
they actually choose another store for their purchases. (Davies, Ward 2002, 163)
The store environment or layout, as explained above, plays a major role in
customer’s perception of stores and depending on store type, the layout can be
planned in different ways in order to draw the customer’s attention to different
things. A grid layout is the typical layout often used in supermarkets and grocery
stores. The main idea with this layout is to force the customers to see or have
contact with as many products as possible while in store, this will increase the
likelihood for additional purchases. Often the most purchased products are placed
at the back end of the store or in the end of an aisle so that customers have to pass
by as many other types of merchandises as possible on the way. Another common
feature of this layout is to place more costly products along the main routes; this
increases the possibility of more expensive purchases. (Peter, Olsen 2005, 490-
492)
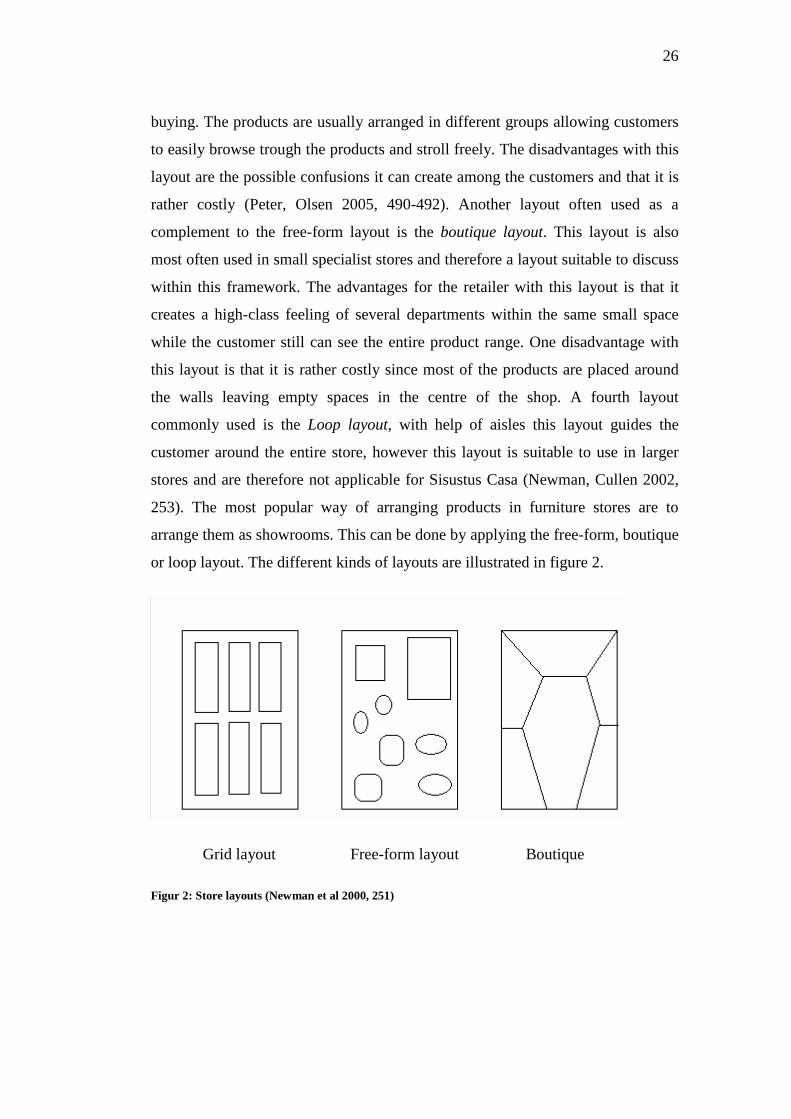
The most common used layout in boutiques and specialty stores are the free-form
layout. This layout aims at creating a relaxed atmosphere that encourages impulse
26
buying. The products are usually arranged in different groups allowing customers
to easily browse trough the products and stroll freely. The disadvantages with this
layout are the possible confusions it can create among the customers and that it is
rather costly (Peter, Olsen 2005, 490-492). Another layout often used as a
complement to the free-form layout is the boutique layout. This layout is also
most often used in small specialist stores and therefore a layout suitable to discuss
within this framework. The advantages for the retailer with this layout is that it
creates a high-class feeling of several departments within the same small space
while the customer still can see the entire product range. One disadvantage with
this layout is that it is rather costly since most of the products are placed around
the walls leaving empty spaces in the centre of the shop. A fourth layout
commonly used is the Loop layout, with help of aisles this layout guides the
customer around the entire store, however this layout is suitable to use in larger
stores and are therefore not applicable for Sisustus Casa (Newman, Cullen 2002,
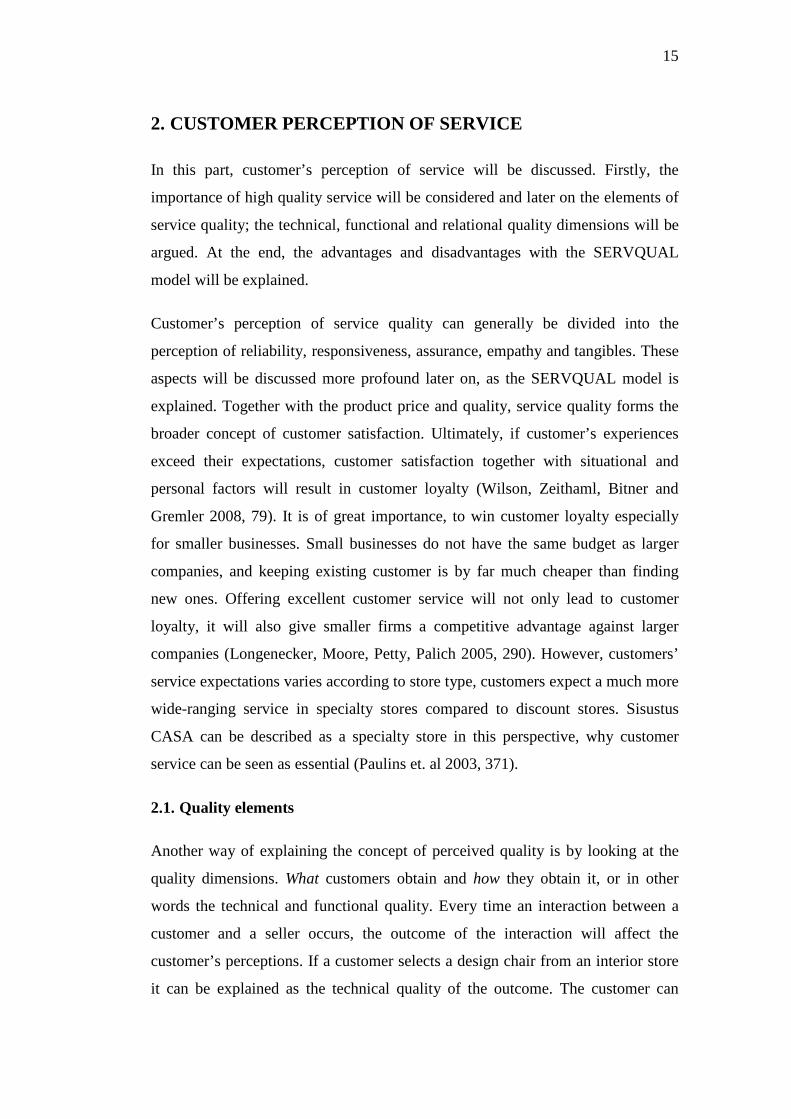
253). The most popular way of arranging products in furniture stores are to
arrange them as showrooms. This can be done by applying the free-form, boutique
or loop layout. The different kinds of layouts are illustrated in figure 2.
Grid layout Free-form layout Boutique
Figur 2: Store layouts (Newman et al 2000, 251)
27
A store does not necessarily have to follow one model completely; they can also
use a mix of different models. However, the main ideas with these layouts are to
manage space, the flow of customers, to keep costs down and to support the store
attributes and eventually the store image. (Newman et al 2002, 255-256)
As already discussed, all individuals are exposed to millions of different stimuli
every day. Retailers have numbers of different stimuli to use in order to attract
customers and to create a favorable in-store image and atmosphere. Products,
colors, lightning, employee appearance, music, indoor temperature, smells,
decoration, shelves and signs are only a number of different attributes that can be
changed and arranged in diverse ways in order to affect customer’s perceptions.
For example, studies have shown that it is clever to display the products you want
to sell the most on an encounter to the right of the entrance, since 80 % of the
customers turn right when entering a store. If the intention is to create a store
image of high quality, it is advisable to use a certain light on the products, since it
gives the customers a feeling of higher value. There have been a lot of different
research made in this area but the results vary. Some find these attributes to be
very important and others find them to have little or no effect. However, the
findings are often very store/industry specific, what works in one store and in one
environment does not necessary have to work in another one. Therefore, when
studying similar attributes it is useful to compare them to close competitors or
stores operating in the same branch, this will give a picture of the strengths and
weaknesses among the stores. This can later be used in order to create a more
suitable store image. (Peter, Olson 2005, 491-493)
We obtain stimuli through our five senses and for that reason, a brief discussion
on how they influence our perception when we enter a store will follow. What is
important to keep in mind though is that it is difficult to predict the outcome when
the senses are used together; most studies are done concentrating on one single
element. Another important aspect is the congruity, all the elements used should
fit in the environment and when considering larger stores neutral elements are
preferable in order to avoid that customers perceptions will be negative. On the
other hand, smaller stores, as for instance the case company, can use the
28
advantages senses can give the store environment largely because they have fewer
customers and less different perceptions to take into consideration. (Sullivan,
Adcock 2002, 158)
3.2.1. Sight
It is through our eyes we can see different colors and light. The importance of
right kind of lightning in a store has already briefly been mentioned, it can among
other things affect how we view quality. Color has also proven to have both
physical and psychological influences on humans. Colors are of course important
especially in the home-furnishing business since it is a business that is easily
affected by trends. Consumers shopping at specialty stores and boutiques are very
trend conscious. Except for the importance of having the right colored store due to
trends, colors also affects customer perception and buying behavior. Studies have
shown that customers are easily drawn to yellow and red (warm colors) while cool
colors like blue and green often are perceived pleasant. It is therefore advisable to
use warm colors in store windows and at places where impulse buying occurs.
Blue, green and other cool colors can be used in stores were customers are
spending more time thinking over the purchase decision (Peter, Olson 2005, 494;
Solomon et. al 2006, 40-42).
3.2.2. Hearing
Music in stores is nowadays a common character; this is not surprising since it has
been shown in research that music have an impact on people’s behaviors and
emotions. Playing slow music in a store will most likely have the effect on
consumers that they spend more time in the store, are more relaxed and then most
likely spend more money than if the music playing was up-tempo. This is of
course a good reason for playing slow music but depending on the intentions of
the store, up-tempo music can also be favorable. In a fast food restaurant the
owner’s intentions are that as many persons as possible will decide to stop for
lunch. If playing slow music, their customers would stay longer, take up
expensive sitting space and prevent other customers from coming in. In order for
music to be favorable for the storeowners, it has to be matched with their
29
objectives. Relaxed customers’ perception would certainly be better than non-
relaxed customers would, but the objectives of a store do not always go with the
customers (Peter, Olson 2005, 495; Solomon et. al 2006, 43-44).
3.2.3. Touch
This sense might not be regarded as important when shopping but it still might
have an impact. The amount of touching in interpersonal connections differs very
much depending on different cultures. Hand shaking is much more commonly
used in customer/seller interactions in French than in for example Britain. A more
vital aspect of touch when considering store layout is the associations different
textiles have. Silk is among females usually linked to a luxury feeling while
cotton is considered to have less quality. This is something to consider not only
when offering clothing or bedding products but also when choosing textiles to the
store. If the objectives are to create a customer perception of high quality, the
advices are to choose fabrics as silk or wool while, for example denim, especially
among males creates a feeling of roughness. (Solomon et. al 2006, 44)
3.2.4. Smell
Smell, as all the other senses, can influence buying behavior. Customers can
associate scents rather strongly with different products and feelings and it can
provoke memories and emotions from the past. No matter if, the scent is related to
a specific product, like leather or coffee, or if it is associated with the whole store,
it can affect customer’s perception. It is relatively hard for customers to express a
certain perception with a certain scent. Nevertheless, without the scent customers
might communicate a different perception. For example, Spangenberg (1996)
argues that scents of orange, ginger, lavender or spearmint in stores influenced
customer assessments of the products, the store and their buying behavior more
than stores without these scents. Scents can be one way for stores to differentiate
themselves from their competitors, but it is important to remember that it is very
individual how different scents are experienced and what memories they awake. A
scent experienced very light by one consumer can be very heavy to another, and
30
there are individuals who are very sensitive, even allergic to certain smells. (Peter,
Olson 2005, 496)
3.2.5. Taste
Taste is maybe one of the less active senses when customers form perceptions
about stores but it is still an important sense used when forming perceptions about
other things, especially when for example evaluating grocery products. Knowing
consumers taste preferences are very central for the food industry when
segmenting and positioning a new product (See e.g. Solomon et. al 2006, 45-46).
3.2.6. The Mehrabian-Russell model
The Mehrabian-Russell model was developed in 1974 and gives a deeper insight
into behavioral theories and how these can be influenced. The basic idea behind
the model is that the store environment affects customer’s perceptions and
behaviors within a store. The model is built up by the elements of environmental
stimuli, emotional states and behavior. The environmental stimuli are the stimuli
we receive with our senses, as explained above in the previous part (sight,
hearing, smell etc.). After interpreting these stimuli received when entering a
store, an emotional state expands, either one of pleasure or of arousal. The next
step that follows is a response to the emotional state through a behavior. The
behavior that will follow is most likely either approach or avoidance related. An
approach, or positive, related behavior is of course the more desired one, this
means that the customers gets a good feeling in the store and therefore wants to
spend additional time and thus the likelihood of a purchase is increased. (Sullivan,
Adcock 2002, 138-139)
This model can be used for creating an appealing store environment if the owner
understands customer’s reactions to different types of store design elements like
atmospheres or displays. When understanding these reactions correctly exact
environmental stimuli can be created, this is a prerequisite for building the desired
emotional state that will affect the customer’s in-store behavior positively.
However, it is important to remember that it is difficult or even impossible to
31
influence thoroughly customer’s perceptions and behaviors. Everyone already
carries an existing emotional state when entering a store and those emotions may
influence the emotions received in-store (Sullivan, Adcock 2002, 138-139). This
model is useful when looking at the emotional responses unaccompanied, but
perceptions can arise from other sources than only the emotional, since customers
can respond to store environments cognitively or physiologically as well
(Sweeney, Wyber 2002, 51).
32
4. CUSTOMER PERCEPTION OF PRODUCT RANGE
How do customers choose their products and what kind of products should be
offered to them? This part will deal with these issues as well as consider the
importance of developing an appropriate merchandise strategy. In addition, this
chapter will concentrate on the impacts width and depth assortments may have,
and how it influences customers’ perceptions. However, these issues are as well
closely connected to the theory about customer perception of store image
presented in the previous chapter. The portfolio Matrix will be presented in this
chapter as one way of maintaining control over product performances and the
improvement of these performances. At the end of the chapter the importance of
arranging and displaying products in-store, will be discussed. Examples will be
given on how this affect customer perceptions on both the product range and store
image.
When deciding what products to offer the consumers it is essential to remember
that humans in general have very few basic needs, a roof over the head and food
in the stomach is enough for survival. However, when the basic needs are fulfilled
infinite amounts of other needs and wants are created. All humans strive to
accomplish some of these needs and wants, taking into consideration the limited
amount of resources. Ultimately, customers will choose the products or services
that provide most satisfaction for money. A lamp bought from the grocery store
can very well meet the basic lightning needs and be a good budget buy, but for
others a designer lamp by Arne Jacobsen will create a much higher demand, even
considering the price difference. At the end, the consumer will choose the lamp
that gives most value for the money spent. (see e.g. Kotler, Armstrong, Wong,
Saunders 2008, 9)
A retailer should never forget that the products they are offering are not only plain
products; it is products providing the customers with a solution to their problems.
Offering a customer a normal lamp might solve his/her need for lightning but it
might not solve his/her underlying desires for a designer lamp, a lamp that is not
only practical but also nice to look at. The case company can be described as a
33
specialty store for furniture, lightning and decoration and therefore, they should
not only offer their customers plain products, they should instead focus on
offering products that give brand significance and brand experience to their
customers. (see e.g. Kotler, Armstrong, Wong, Saunders 2008, 9)
4.1. Product strategy
When developing a merchandise strategy the focus should be on choosing the
right mix of products and services that gives the store the right personality and
that complements the desired store image. The merchandise assortment should
give a clear reflection of the stores positioning plan. A right chosen merchandise
strategy should offer the customers a positive shopping experience, meet their
expectations, solve their problems and affect the perception of the store image in a
positive way. The merchandise strategy is ultimately up to the storeowner and
his/her vision of the store (Davies, Ward 2002, 153-155).
All merchandise planning usually goes through the stages of planning, sourcing,
purchasing, placing, presenting and space management (Newman et al. 2002,
143). Selecting the right merchandise strategy is a balance between customer
demand, cost of inventory and competitors offers. By offering different products
than competitors and market leaders, small retailers can differentiate themselves
and get a competitive advantage. However, when selling similar products the only
way for a small retailer to stand out among competitors is by offering outstanding
service, having an appealing store environment or by offering convenience
(Davies, Ward 2002, 153-155).
Competing with low prices is in many cases impossible for small stores. Haelsing
et al found out that customers within the furniture branch always anticipate some
service when entering a furniture store. This means that it is more difficult to use
service quality as a way of differentiating oneself from competitors within this
segment compared to other branches. In addition, the researchers discovered that
out of five different sectors, furniture retailing is the only sector where customers
consider price as the main retailer aspect (Haelsing, Swoboda, Morschett,
Schramm-Klein 2007, 428). One way for a small retailer to create a competitive
34
advantage is to offer something different. This can be done by ensuring that the
supplier does not offer the products to any other retailer or by offering something
unique.
4.1.1. A width vs. a depth assortment
Width assortments: the amount of different product lines that are found in one
store.
Depth assortments: the number of different colors, sizes, prices etc. within a
specific merchandise line (Gilbert 2003, 146-147).
When planning the product range the question will always be how many different
products to offer and in how many different types the products will be offered.
Grocery stores usually carry a width assortment; the product range can then be up
to several thousands of products while specialty stores carry a narrower
assortment but with additional depth (Gilbert 2003, 147). Besides the question of
how width versus depth the assortment should be, the breadth, consistency and
flexibility of the assortment must be considered. A breadth assortment carries
several different products within each product class, while the assortment is
considered consistent if the products sold are related to each other concerning
value, use or image.
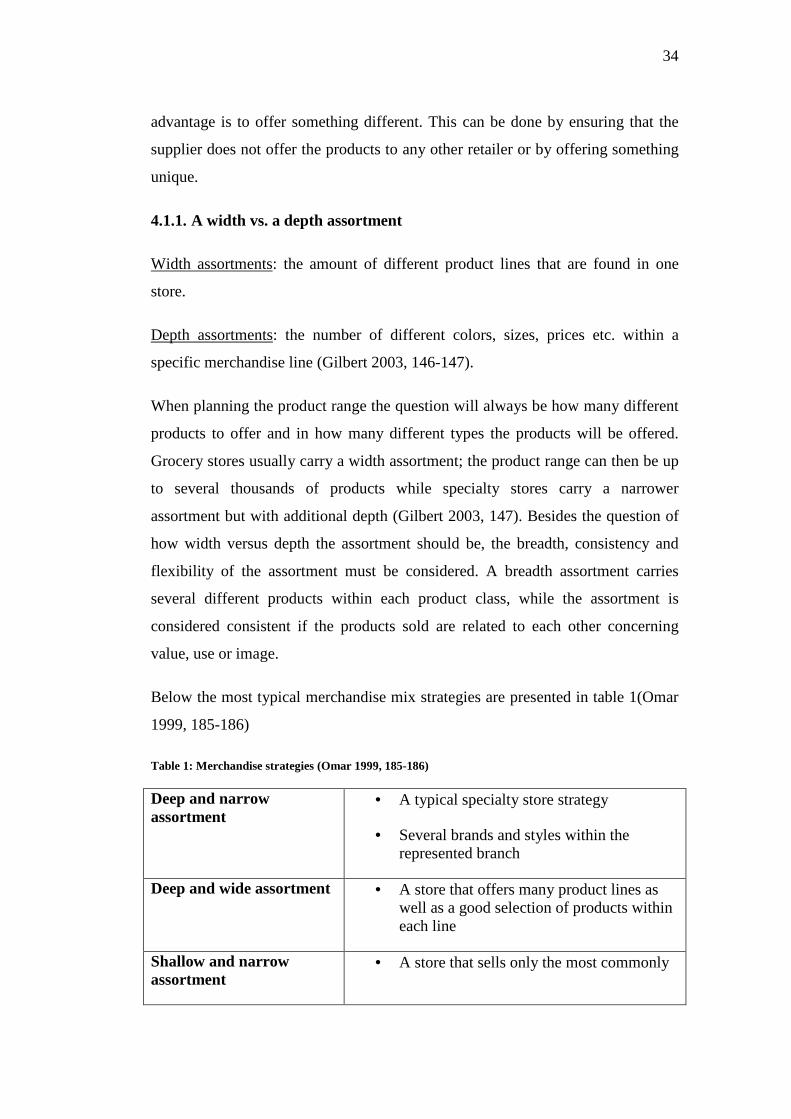
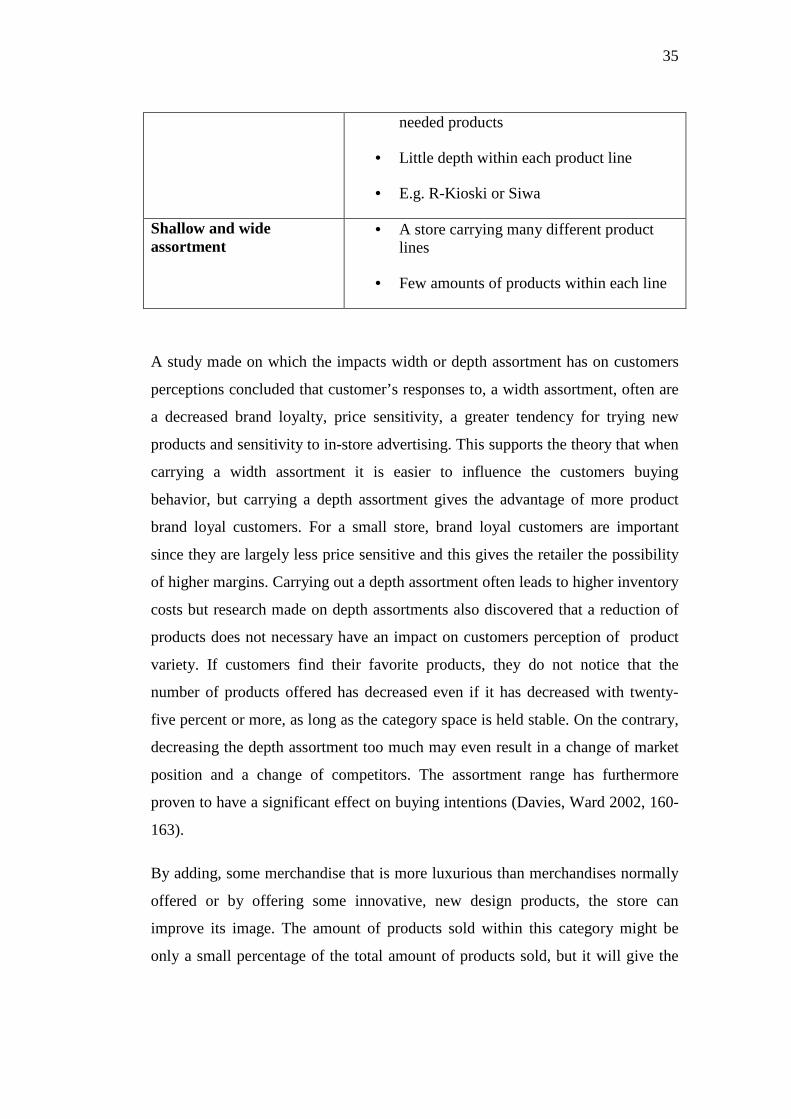
Below the most typical merchandise mix strategies are presented in table 1(Omar
1999, 185-186)
Table 1: Merchandise strategies (Omar 1999, 185-186)
Deep and narrow assortment
• A typical specialty store strategy
• Several brands and styles within the represented branch
Deep and wide assortment • A store that offers many product lines as well as a good selection of products within each line
Shallow and narrow assortment
• A store that sells only the most commonly
35
needed products
• Little depth within each product line
• E.g. R-Kioski or Siwa
Shallow and wide assortment
• A store carrying many different product lines
• Few amounts of products within each line
A study made on which the impacts width or depth assortment has on customers
perceptions concluded that customer’s responses to, a width assortment, often are
a decreased brand loyalty, price sensitivity, a greater tendency for trying new
products and sensitivity to in-store advertising. This supports the theory that when
carrying a width assortment it is easier to influence the customers buying
behavior, but carrying a depth assortment gives the advantage of more product
brand loyal customers. For a small store, brand loyal customers are important
since they are largely less price sensitive and this gives the retailer the possibility
of higher margins. Carrying out a depth assortment often leads to higher inventory
costs but research made on depth assortments also discovered that a reduction of
products does not necessary have an impact on customers perception of product
variety. If customers find their favorite products, they do not notice that the
number of products offered has decreased even if it has decreased with twenty-
five percent or more, as long as the category space is held stable. On the contrary,
decreasing the depth assortment too much may even result in a change of market
position and a change of competitors. The assortment range has furthermore
proven to have a significant effect on buying intentions (Davies, Ward 2002, 160-
163).
By adding, some merchandise that is more luxurious than merchandises normally
offered or by offering some innovative, new design products, the store can
improve its image. The amount of products sold within this category might be
only a small percentage of the total amount of products sold, but it will give the
36
customers an impression of a store that offers the newest products and this will
attract customers into the store (Omar 1999, 179).
4.2. The portfolio matrix
The portfolio matrix is one simplified way for storeowners to keep track on their
products performances. The portfolio matrix originates from the portfolio-
planning tool first developed in the early 70’s by the Boston Consulting Group.
This tool was initially designed for multi industry businesses but it is applicable
for single business owners as well. The main difference is that, the matrix consists
of products or product lines. The advantage with this tool is that it can give
indications on how different products or product lines are performing and how
their performances can be improved. However, the tool should not be seen as the
ultimate solution but rather as an approach, that visualizes the current situation.
(Omar 1999, 364-368)
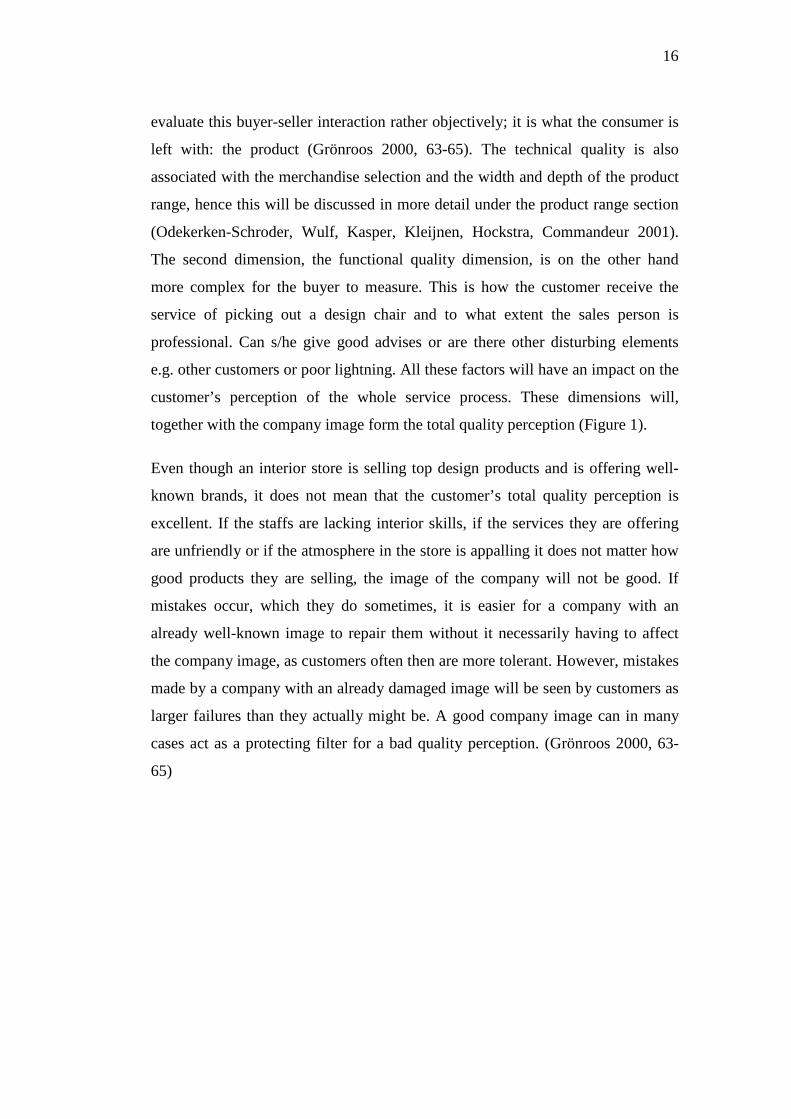
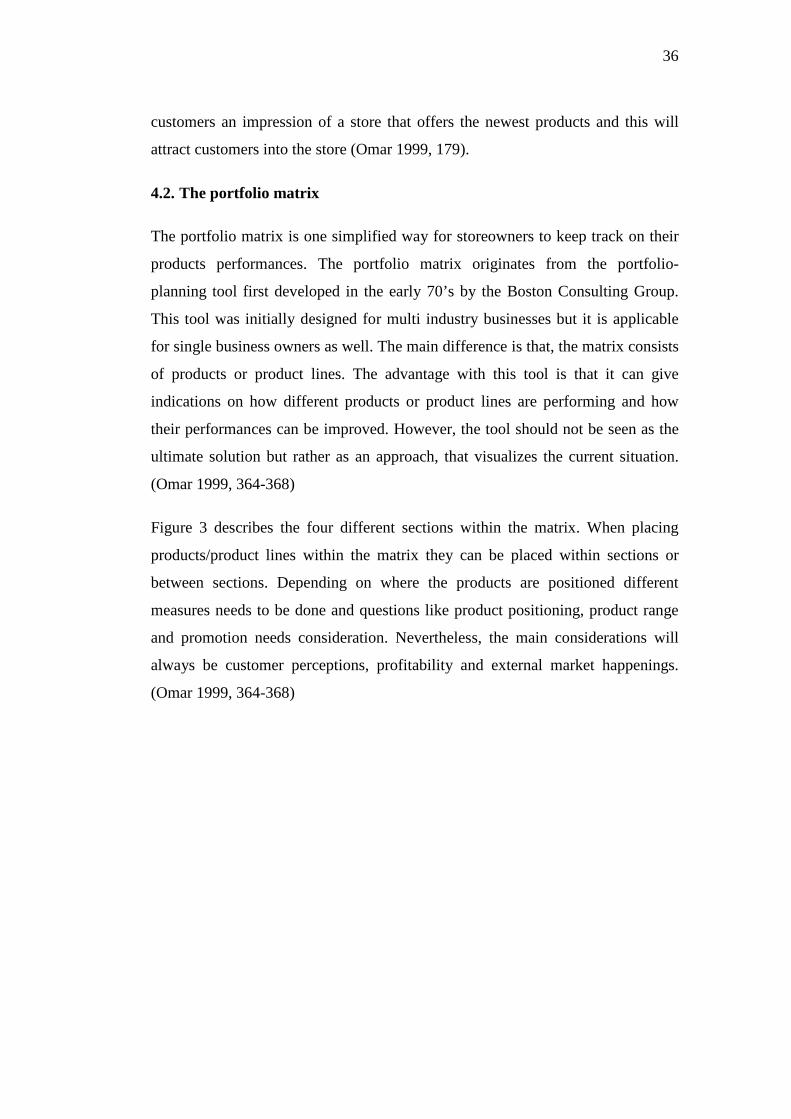
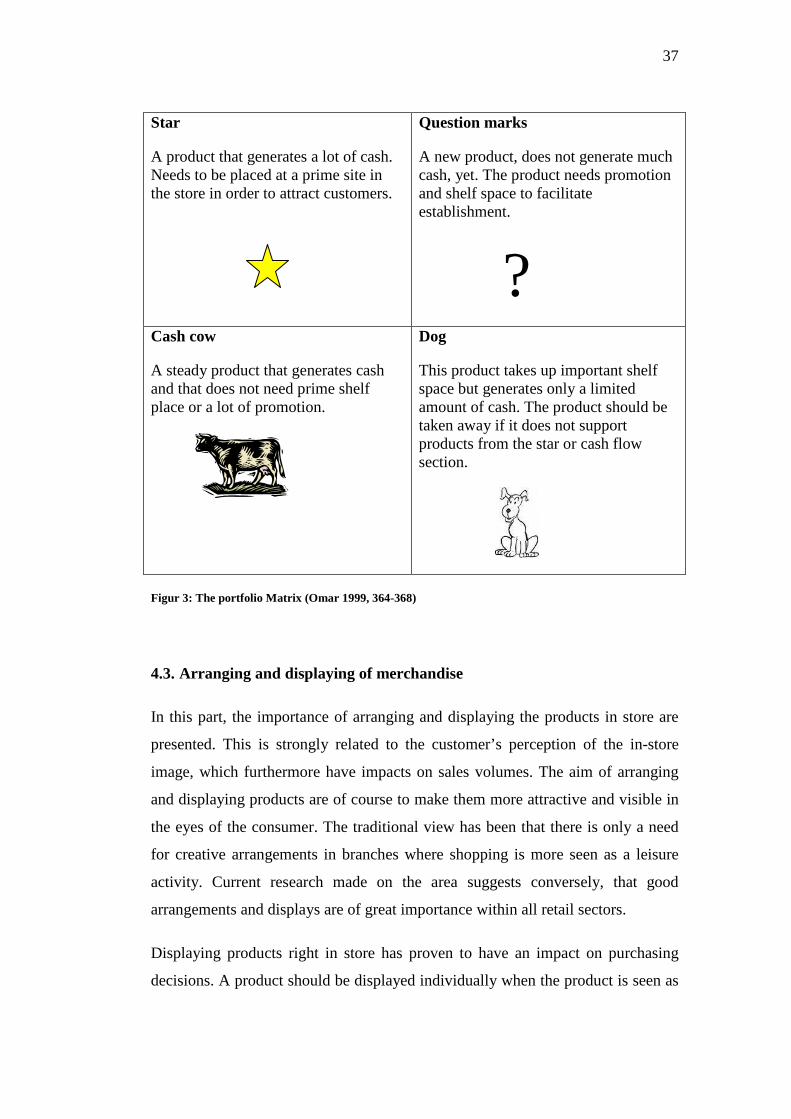
Figure 3 describes the four different sections within the matrix. When placing
products/product lines within the matrix they can be placed within sections or
between sections. Depending on where the products are positioned different
measures needs to be done and questions like product positioning, product range
and promotion needs consideration. Nevertheless, the main considerations will
always be customer perceptions, profitability and external market happenings.
(Omar 1999, 364-368)
37
Star
A product that generates a lot of cash. Needs to be placed at a prime site in the store in order to attract customers.
Question marks
A new product, does not generate much cash, yet. The product needs promotion and shelf space to facilitate establishment.
?
Cash cow
A steady product that generates cash and that does not need prime shelf place or a lot of promotion.
Dog
This product takes up important shelf space but generates only a limited amount of cash. The product should be taken away if it does not support products from the star or cash flow section.
Figur 3: The portfolio Matrix (Omar 1999, 364-368)
4.3. Arranging and displaying of merchandise
In this part, the importance of arranging and displaying the products in store are
presented. This is strongly related to the customer’s perception of the in-store
image, which furthermore have impacts on sales volumes. The aim of arranging
and displaying products are of course to make them more attractive and visible in
the eyes of the consumer. The traditional view has been that there is only a need
for creative arrangements in branches where shopping is more seen as a leisure
activity. Current research made on the area suggests conversely, that good
arrangements and displays are of great importance within all retail sectors.
Displaying products right in store has proven to have an impact on purchasing
decisions. A product should be displayed individually when the product is seen as
38
an attractive product or more attractive than other products within the same line.
Conversely, merchandise seen as less attractive is more likely to be purchased
when displayed together. When displayed together consumers compare the
products grouped together and will make a purchase decision based on that
comparison (Davies et. al 2002, 156-159). Sisustus CASA can affect their
customers purchasing decisions largely by arranging the products in an attractive
way. People visiting design furniture stores are often very aware of what they
want and of what their taste preferences are, but they are looking also for
inspiration and by arranging and displaying the products right the store can meet
their customer’s expectations and create needs and wants.
The merchandise strategy and the management of it need to be paid a substantial
amount of attention. From the storeowner perspective, merchandises offered are
what ultimately generate profit and sales. From the customer perspective,
merchandise is one part of the shopping experience. However, theories behind
merchandise strategy vary and are found in several different frameworks and it is
difficult to find valid and suitable approaches for specific retail environments. The
reasons behind this steam from the fact that merchandise strategies for one branch
does not necessary have to be valid for another one. Merchandise strategy is so
close connected to other aspects such as service and store environment that if only
looked at on an individual level the results or models are hard to apply
consistently (Davies et. al 2002, 171). Hence, customer perceptions of service and
store attributes is a good complement to studies concerning product range.
4.4. Summery of theory
In the last three chapters the theory behind customer perceptions of service, store
attributes and product range have been discussed. The presented theory has been
chosen in order to give the reader a clear picture of the theory framework, as well
as, lay a good foundation for the coming research.
The theory review examined the importance of customer perception studies. From
a retailer point of view it is important with high service quality, if the service
exceeds customer expectations it most of leads to customer satisfaction which in
39
the long run can lead to customer loyalty. For a small specialty store within the
furniture business, as the case company, it is important with high service quality
because of two reasons. One, customers expect service from specialty stores and
two, it is important for smaller companies with lower budgets to create customer
loyalty, because it much more cheaper to keep existing customer than to find new
ones. Service quality was explained with the help of the quality dimensions and
the relational quality dimension was suggested as one way for the case company
to create a competitive advantage against competitors. The SERVQUAL model
was also explained as it is the most widely used model to measure service quality,
However, findings from other studies revealed that this might not be the best way
to measure service quality from a retail perspective.
The theory review continued with the concepts of store image and store
atmosphere. It is important for retailers to create an appealing store image in order
to attract customers and differentiating the store from competitors. The key factor
is to create an image that matches with the targeted customers’ expectations. A
favorable store image affect purchase behavior, loyalty and provides the customer
with “added value”. A store can, for example, affect customers perceptions by
using different layouts. In addition, customer perceptions was explained on the
basis of our five senses in order to deeper understand the reasons behind customer
perceptions and how the perceptions are formed.
The theory behind product range, examined the importance of an appropriate
product assortment and the effects it has on the store image. When customers
chose products they do it according to their needs and wants and ultimately they
will chose the product that offers most satisfaction for money. From a retailer
perspective the products should always be chosen keeping in mind the desired
store image. A right chosen product strategy do not only affect customers
shopping experiences in a positive way it also affects the store image in a positive
way. However, for a small store it is almost impossible to keep a wide product
range and at the same time compete with low prices, therefore, a small store
should offer something unique in order to stand out. The most commonly used

40
merchandise strategies was presented and the portfolio matrix was introduced as
one way for storeowners to keep track on their products performances.
In conclusion the three theory parts affects one another and in many cases they
also walk hand in hand; for example, the perceived service quality is affected by
the store image and without looking at the product range and assortment measured
store image will probably not be reliable.
41
5. RESEARCH METHODOLOGY
The theories behind customer perceptions of service, products and store attributes
have been discussed in the previous parts. In the following chapter, the most
appropriate methods for measuring customer perceptions within a small business
are presented. However, when selecting the most suitable method the limited
amount of resources a small business or store has are considered, in addition, the
restrictions this thesis contain are taken into account. The research method and the
design of the questionnaire are presented in the middle of the chapter and at the
end, the outcome of the study is presented followed by analyses.
5.1. Research methods
In order to answer the research questions stated in the beginning of this thesis in
the best possible way a literature review on the current topic was conducted. The
literature review laid the foundation for the descriptive research.
In a descriptive research, the intention is to describe and understand different
phenomena, for example, what do customers think of CASA? Descriptive
research can be structured and inflexible in its forms and therefore, exploratory
research is often used prior to the descriptive in order to gain more insights, in
form of, for example a literature review. Using descriptive research is an efficient
way of collecting quantifiable information and together with accurate theory it
gives explanations to, as well as a good understanding of, the research questions
(Wrenn, Stevens, Louden 2002, 37-39).
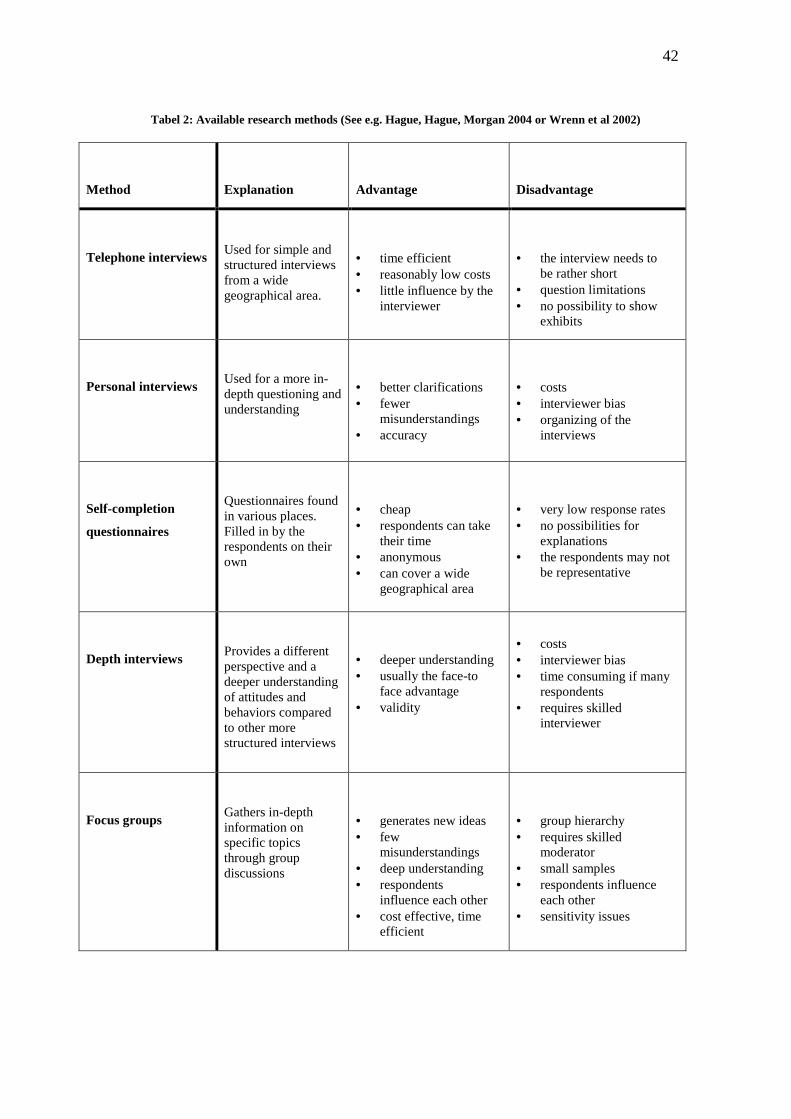
The table below (table 2) will explain the different research methods available and
clarify the advantages and disadvantages with each method, taking into
consideration this specific research.
42
Tabel 2: Available research methods (See e.g. Hague, Hague, Morgan 2004 or Wrenn et al 2002)
Method
Explanation
Advantage
Disadvantage
Telephone interviews
Used for simple and structured interviews from a wide geographical area.
• time efficient • reasonably low costs • little influence by the
interviewer
• the interview needs to be rather short
• question limitations • no possibility to show
exhibits
Personal interviews
Used for a more in-depth questioning and understanding
• better clarifications • fewer
misunderstandings • accuracy
• costs • interviewer bias • organizing of the
interviews
Self-completion
questionnaires
Questionnaires found in various places. Filled in by the respondents on their own
• cheap • respondents can take
their time • anonymous • can cover a wide
geographical area
• very low response rates • no possibilities for
explanations • the respondents may not
be representative
Depth interviews
Provides a different perspective and a deeper understanding of attitudes and behaviors compared to other more structured interviews
• deeper understanding • usually the face-to
face advantage • validity
• costs • interviewer bias • time consuming if many
respondents • requires skilled
interviewer
Focus groups
Gathers in-depth information on specific topics through group discussions
• generates new ideas • few
misunderstandings • deep understanding • respondents
influence each other • cost effective, time
efficient
• group hierarchy • requires skilled
moderator • small samples • respondents influence
each other • sensitivity issues
43
All the above-mentioned methods have different pros and cons. In order to find
the most valid answers for the research questions, the methods can be used on
their own or as a combination between two or more methods.
After weighting the different methods against each other and considering the
limitations of this study the best way of gathering answers to the stated research
questions would be through a self-completion questionnaire. A telephone
interview could be one way of ensuring that the response rate would not be too
low but the costs associated with interviewing respondents on the telephone could
become excessively high. Moreover, conducting personal interviews and focus
groups would also be connected with the same problems, the additional costs.
Depth interviews could be another alternative, since they do not necessary have to
be conducted face-to-face, but the responses collected through depth interviews
could be difficult to analyze and time consuming. Furthermore, the costs of
conducting depth interviews are comparatively higher than self-completion
questionnaires.
There are different types of self-completion questionnaires, the most common
ones are questionnaires sent out to the respondents through email or
questionnaires that the respondents fill in on the internet. This particular research
will be done through both mail questionnaires and questionnaires handed out in
store. The reason behind this is to increase the response rate. The company has
only a limited database with their customer’s contact information and no
information at all about their customers email addresses; this means that self-
completion questionnaires on the internet are not possible. However, since this is
not the type of store you visit every week even though you are a regular customer
the questionnaires were also sent out to the customers. The customers were asked
in the letter that followed with the research to hand in the questionnaires to the
store. The letter included two motivators to overcome the problem with low
response rates. The first one stated why it was important for the company and the
researcher that they responded. The second motivator told the participants that
everyone who hands in the questionnaire would receive a gift. By both sending
out some of the questionnaires to the company’s existing customers and by
44
leaving the rest of the questionnaires to be filled in on site the number of
respondents were increased. Altogether 100 questionnaires were sent out. Most of
Sisustus CASAs customers are Swedish or Finnish speaking, therefore in order to
avoid as many misunderstandings as possible the questionnaires were also in
Finnish and Swedish.
With this method, it was possible to capture both the regular customers’ opinions
as well as the opinions from customers just passing by. All customers’ opinions
are important in order to fully understand the customers’ perceptions about the
store. Another advantage for the company with this method was that it gave them
the possibility to update their customer database.
The benefits from conducting these types of self-completion questionnaires are
that the respondents can be confident about their anonymity. This is important
especially since the case company is a small business with many long-term
customers. Without being sure of their anonymity, it might prevent the
respondents from revealing negative feedback if they know the owner and the
store well. A questionnaire filled in or handed in on site, contrary to other
questionnaires, has also the advantage for the researcher that he/she can be rather
confident that the actual respondent has filled it in and not someone else. The
main advantage with this method is however that the respondents can be reached
easily with a minimum of costs. This is also, together with the literature review, a
proper method to use in a study like this. In order to minimize the negative
impacts the disadvantages might have to the research it is vital that both the
questionnaire itself and the introduction letter is written in the best possible way
(see e.g. Hague et al 2004).
In the next paragraph the most essential aspects concerning the design and the
questions of this specific questionnaire is discussed.
5.1.1. Questionnaire design
There are several ways of measuring customer perceptions of store image, product
range and service. By tradition, image has been measured with bi-polar scales;
45
however, there have been a considerable amount of discussions if perceptions
should be measured with structured or non-structured scales.
Chowhury, Reardon and Srivastava (1998) argues in their study that even though
both a structured and a non-structured scale has its pros and cons when measuring
store image and the elements of store image, the use of non-structured scales
should, in most cases, be avoided. The advantages using structured scales are that
the problems associated with coding are avoided, it is less time consuming to
analyze structured scales and since the response rate for questionnaires already are
low, a non-structured scale could decrease it even more because unmotivated
respondents will probably not fill in a non-structured questionnaire. Unmotivated
respondents are more likely to fill in structured questionnaires due to the reason
that it is easier and take less time (Chowhury, Reardon, Srivastava 1998, 72).
Nevertheless, the advantages from using a non-structured scale are that the
researcher does not limit the respondents in any way and that the character of the
store image is more fully captured. Previous studies on the subject have shown
that the results obtained from non-structured scales are harder to apply for
retailers than results obtained from structured questionnaires (Reardon, Miller,
Coe 1995, 85). Structured questions are also the best method for self-completion
questionnaires (Hague et. al 2004, 99). Therefore, when considering the
advantages and disadvantages, this questionnaire mostly consisted of structured
questions.
5.2. Validity and Reliability
Validity refers to that a research measures what it in fact is intended to measure,
while reliability, on the other hand, refers to that the results obtained from a
research will be reliable also after repeated measures or after measures made by
someone else then the original researcher. There are several ways to assure and
improve validity and reliability of a study and it is vital that this is done since it is
important that all studies made fulfill the criteria of a valid and reliable research
(Wrenn et. al 2002, 122-126).
46
In this particular research, validity was improved by conducting a pre test of the
questionnaire, making sure that the questionnaire actually measured what it was
intended to measure and that the respondents understood the questions. The pre
test included filling in the questionnaire and a discussion about whether the
questions were clear or not. After the pre test, some of the questions were
removed or changed. In addition, before the actual questionnaire was handed out
the supervisor assessed the questionnaire and gave comments in order to reduce
mistakes and improve the structure of the questionnaire. The reliability of this
research was assured since the respondents did not encounter with the researcher
or was affected by the researcher in any other way. Since this was a self-
completion questionnaire through mail and in store, the respondents could also be
sure of keeping their anonymity.
5.3. The structure of the questionnaire
The questionnaire consisted all together of 12 questions divided into four different
parts. The first and the second question were general questions, age and gender.
The rest of the questionnaire consisted of specific questions and statements about
Sisustus CASA divided into three sections; store attributes or image, service and
products. After each section room were left for additional comments. In the three
last sections the respondents also had the opportunity to pick the “don’t know”
answer. This opportunity was added in case there where respondents who hand
not experienced all of the statements.
5.4. Data analysis
The questionnaires were analyzed with help of SPSS and Excel. At first, some
general aspects of the questionnaire will be discussed and later on analyzes and
findings from the sections will be presented accordingly.
As already mentioned 100 questionnaires were sent out and out of these 100, 25
respondents handed in the questionnaire. This makes the total response rate
among the questionnaires that was sent out 25%, in addition to this one has to
remember that no reminders were sent out. Concerning the chosen survey method
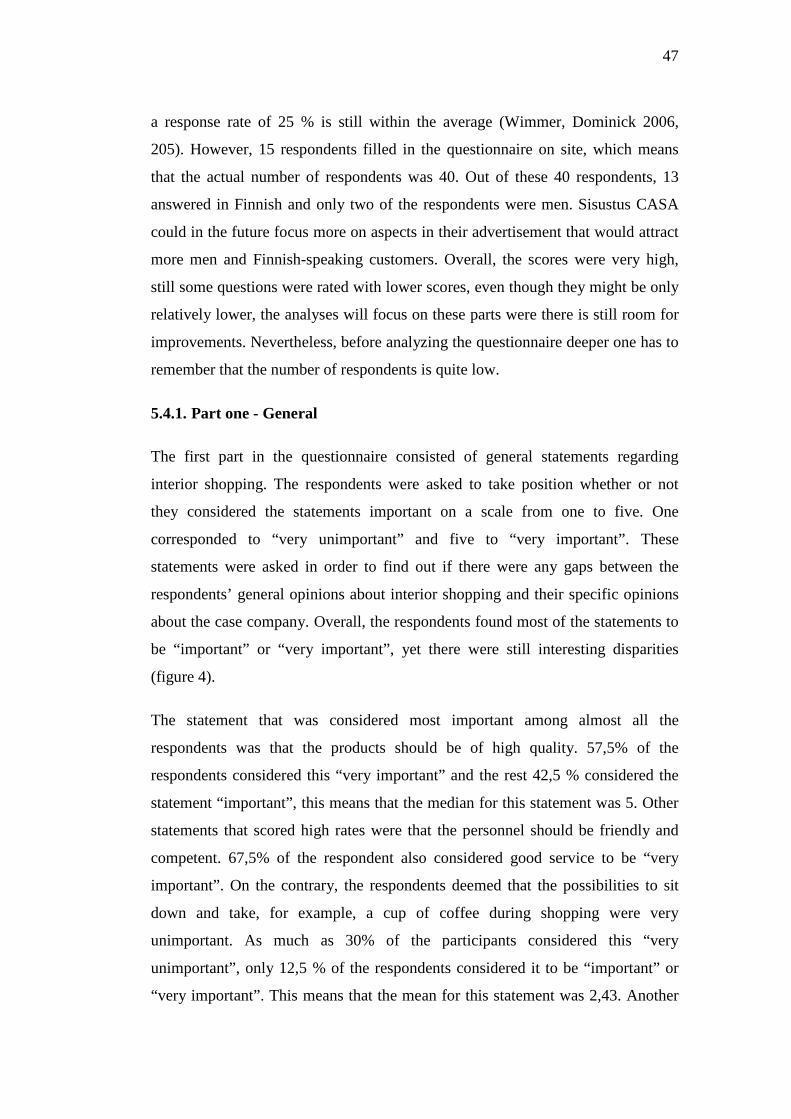
47
a response rate of 25 % is still within the average (Wimmer, Dominick 2006,
205). However, 15 respondents filled in the questionnaire on site, which means
that the actual number of respondents was 40. Out of these 40 respondents, 13
answered in Finnish and only two of the respondents were men. Sisustus CASA
could in the future focus more on aspects in their advertisement that would attract
more men and Finnish-speaking customers. Overall, the scores were very high,
still some questions were rated with lower scores, even though they might be only
relatively lower, the analyses will focus on these parts were there is still room for
improvements. Nevertheless, before analyzing the questionnaire deeper one has to
remember that the number of respondents is quite low.
5.4.1. Part one - General
The first part in the questionnaire consisted of general statements regarding
interior shopping. The respondents were asked to take position whether or not
they considered the statements important on a scale from one to five. One
corresponded to “very unimportant” and five to “very important”. These
statements were asked in order to find out if there were any gaps between the
respondents’ general opinions about interior shopping and their specific opinions
about the case company. Overall, the respondents found most of the statements to
be “important” or “very important”, yet there were still interesting disparities
(figure 4).
The statement that was considered most important among almost all the
respondents was that the products should be of high quality. 57,5% of the
respondents considered this “very important” and the rest 42,5 % considered the
statement “important”, this means that the median for this statement was 5. Other
statements that scored high rates were that the personnel should be friendly and
competent. 67,5% of the respondent also considered good service to be “very
important”. On the contrary, the respondents deemed that the possibilities to sit
down and take, for example, a cup of coffee during shopping were very
unimportant. As much as 30% of the participants considered this “very
unimportant”, only 12,5 % of the respondents considered it to be “important” or
“very important”. This means that the mean for this statement was 2,43. Another
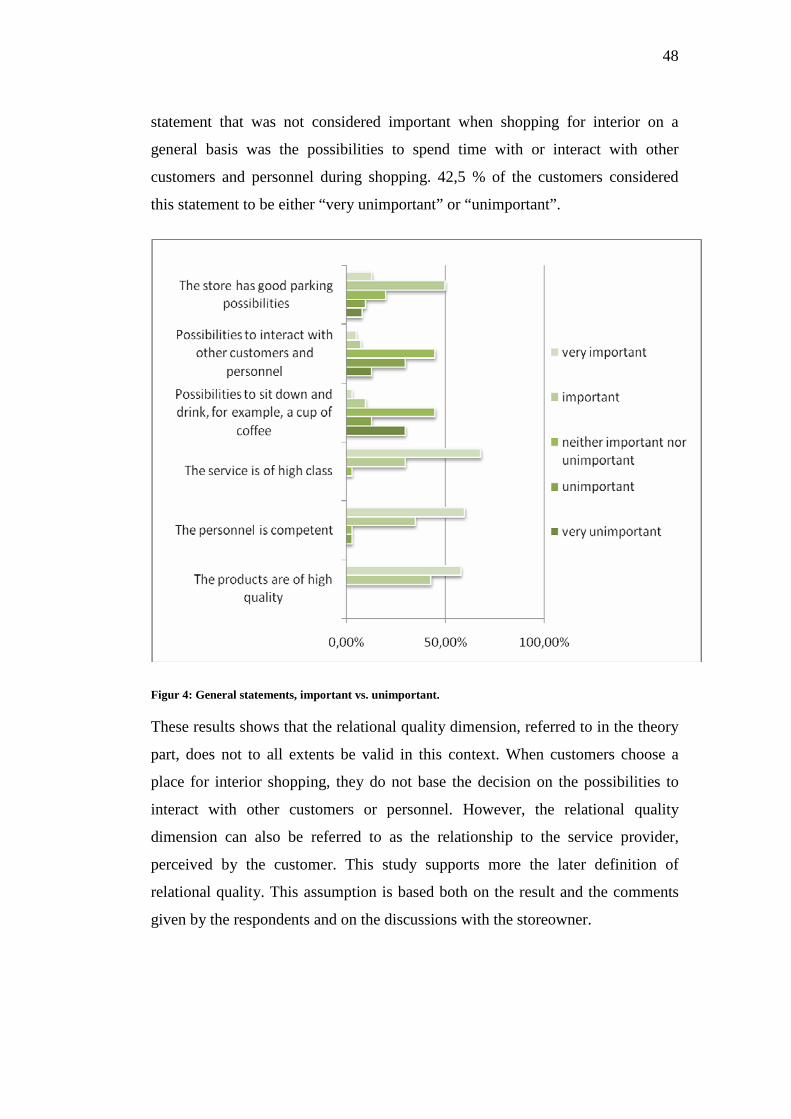
48
statement that was not considered important when shopping for interior on a
general basis was the possibilities to spend time with or interact with other
customers and personnel during shopping. 42,5 % of the customers considered
this statement to be either “very unimportant” or “unimportant”.
Figur 4: General statements, important vs. unimportant.
These results shows that the relational quality dimension, referred to in the theory
part, does not to all extents be valid in this context. When customers choose a
place for interior shopping, they do not base the decision on the possibilities to
interact with other customers or personnel. However, the relational quality
dimension can also be referred to as the relationship to the service provider,
perceived by the customer. This study supports more the later definition of
relational quality. This assumption is based both on the result and the comments
given by the respondents and on the discussions with the storeowner.
49
5.4.2. Part two – Image
This section consisted of specific statements regarding the image of the case
company, the respondents were asked to take position whether or not they agreed
with the statements on a scale from one to five. One corresponded to “disagree”
and five to “agree”. The “I don’t know” option was added in case there were
respondents who had not experienced all of the statements. The statements
consisted of factors that affect customers’ perception of store image and store
atmosphere. A question about how often the respondent visit the store, as well as,
room left for additional comments was added in the end of this section.
In general, customers were very satisfied with the atmosphere and the image of
the store. The only statements that distinguished from the others were the
statements regarding “the store has good parking possibilities” and “the store has
a good location” (figure 5). The responses were very scattered. Concerning the
parking possibilities 12,5% of the respondents partly disagreed or disagreed, 40%
did neither agree or disagree while the rest 45% partly agreed or agreed, only one
of the respondents choose the I don’t know option. Even more respondents
disagreed or partly disagreed with the statement regarding the location. However,
50% did also agree or partly agree that the store had a good location. The mean
value for these statements was 3,5 and 3,58 and the mode value 3 and 4.
50
Figur 5: Statements regarding parking possibilities and location
On the contrary, almost the entire sample experienced the store to be both fresh
looking and clean and on the specific questions regarding a good image and a
good atmosphere none of the respondents answered that they partly disagree or
disagree. The results shows that company has a good image and a good
atmosphere and this is very important since it affects customers store preferences,
how often and from how far the customers visit the store and most importantly
customer loyalty.
As established earlier, Sisutus CASA is not the type of store you visit every week,
the question regarding how often the respondents visit the store also confirmed
this. 65% of the respondents deemed that they visit the store few times a year
while 22% claimed that they visited the store once a month. On the other hand,
when analyzing the additional comments, comments were made indicating that it
is popular to stroll by the store every now and then for inspiration. The study also
verified these indications because, many of the respondents deemed that the shop
windows are appealing.
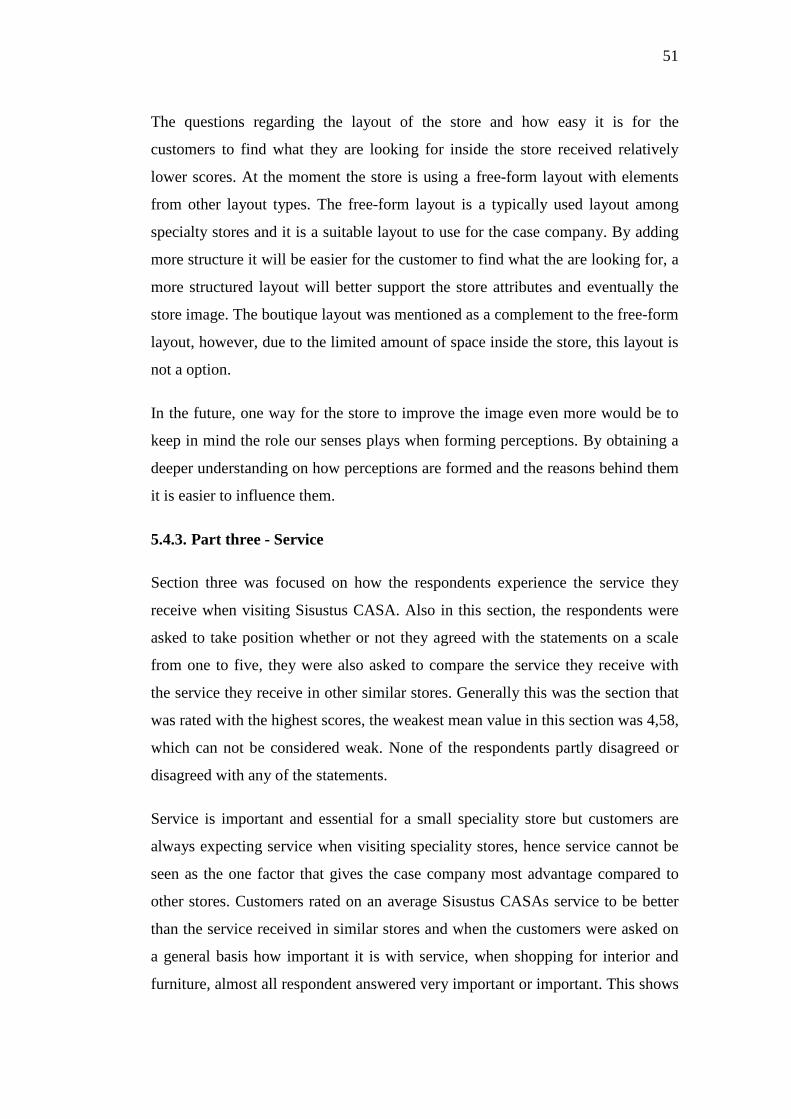
51
The questions regarding the layout of the store and how easy it is for the
customers to find what they are looking for inside the store received relatively
lower scores. At the moment the store is using a free-form layout with elements
from other layout types. The free-form layout is a typically used layout among
specialty stores and it is a suitable layout to use for the case company. By adding
more structure it will be easier for the customer to find what the are looking for, a
more structured layout will better support the store attributes and eventually the
store image. The boutique layout was mentioned as a complement to the free-form
layout, however, due to the limited amount of space inside the store, this layout is
not a option.
In the future, one way for the store to improve the image even more would be to
keep in mind the role our senses plays when forming perceptions. By obtaining a
deeper understanding on how perceptions are formed and the reasons behind them
it is easier to influence them.
5.4.3. Part three - Service
Section three was focused on how the respondents experience the service they
receive when visiting Sisustus CASA. Also in this section, the respondents were
asked to take position whether or not they agreed with the statements on a scale
from one to five, they were also asked to compare the service they receive with
the service they receive in other similar stores. Generally this was the section that
was rated with the highest scores, the weakest mean value in this section was 4,58,
which can not be considered weak. None of the respondents partly disagreed or
disagreed with any of the statements.
Service is important and essential for a small speciality store but customers are
always expecting service when visiting speciality stores, hence service cannot be
seen as the one factor that gives the case company most advantage compared to
other stores. Customers rated on an average Sisustus CASAs service to be better
than the service received in similar stores and when the customers were asked on
a general basis how important it is with service, when shopping for interior and
furniture, almost all respondent answered very important or important. This shows
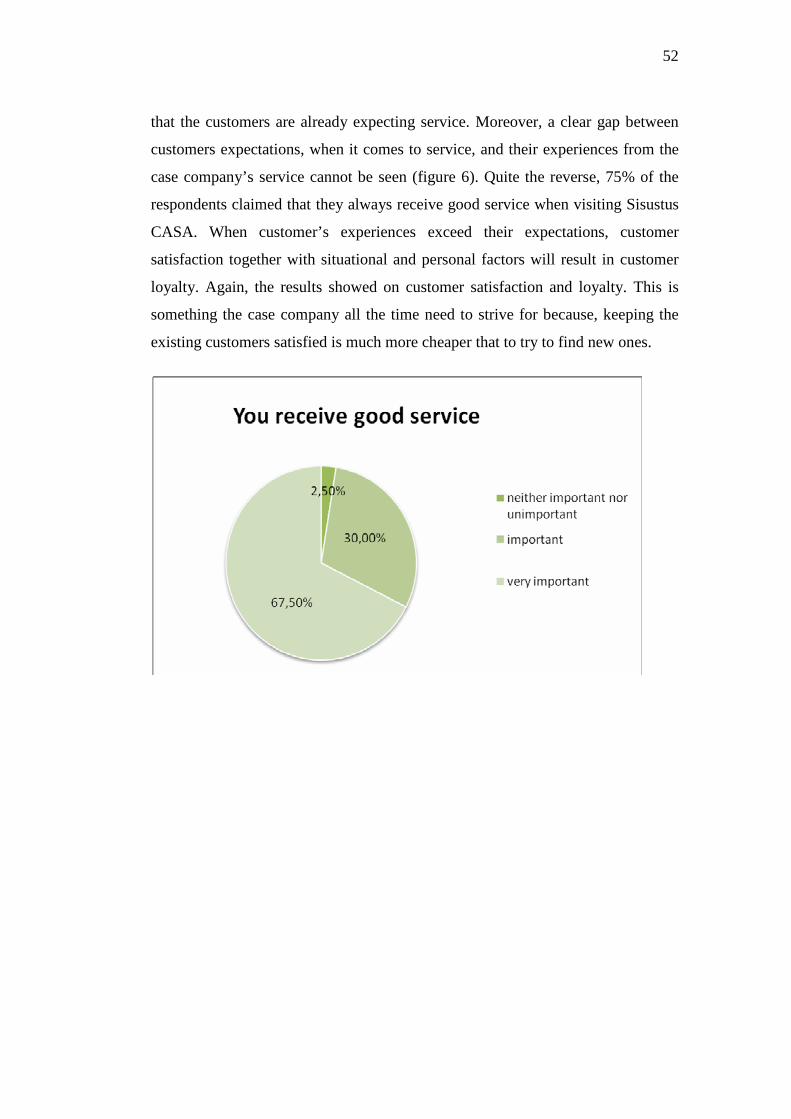
52
that the customers are already expecting service. Moreover, a clear gap between
customers expectations, when it comes to service, and their experiences from the
case company’s service cannot be seen (figure 6). Quite the reverse, 75% of the
respondents claimed that they always receive good service when visiting Sisustus
CASA. When customer’s experiences exceed their expectations, customer
satisfaction together with situational and personal factors will result in customer
loyalty. Again, the results showed on customer satisfaction and loyalty. This is
something the case company all the time need to strive for because, keeping the
existing customers satisfied is much more cheaper that to try to find new ones.
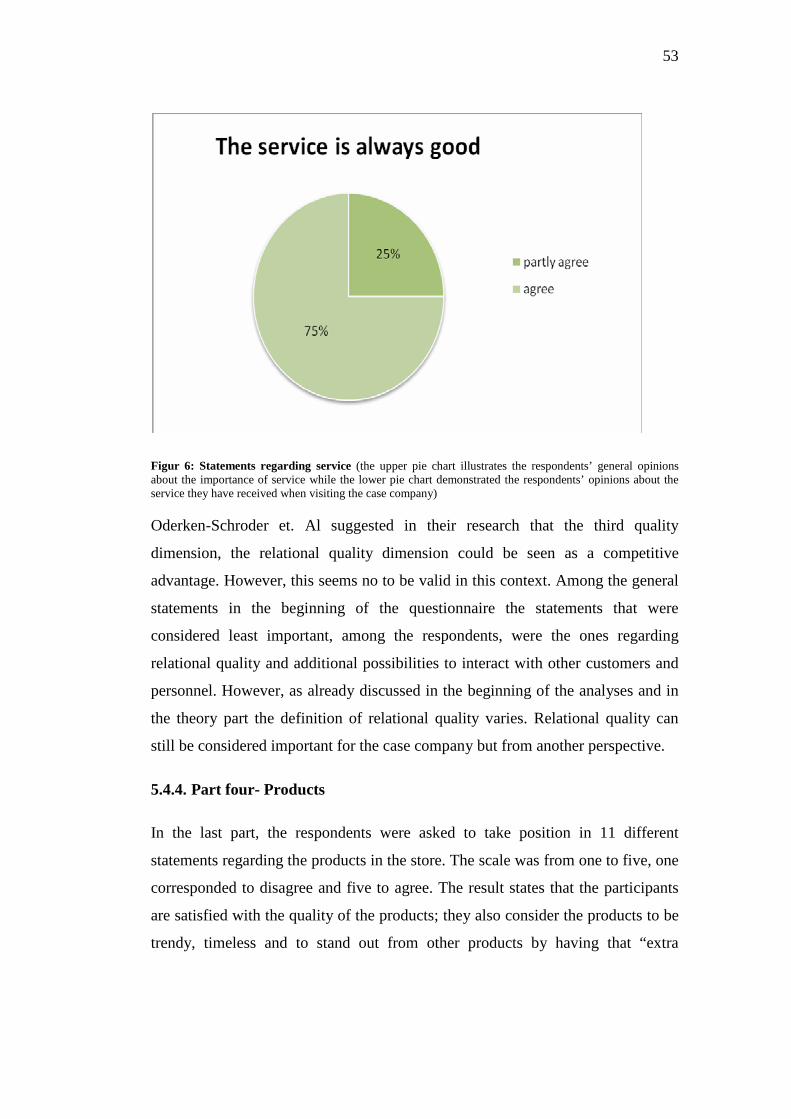
53
Figur 6: Statements regarding service (the upper pie chart illustrates the respondents’ general opinions about the importance of service while the lower pie chart demonstrated the respondents’ opinions about the service they have received when visiting the case company)
Oderken-Schroder et. Al suggested in their research that the third quality
dimension, the relational quality dimension could be seen as a competitive
advantage. However, this seems no to be valid in this context. Among the general
statements in the beginning of the questionnaire the statements that were
considered least important, among the respondents, were the ones regarding
relational quality and additional possibilities to interact with other customers and
personnel. However, as already discussed in the beginning of the analyses and in
the theory part the definition of relational quality varies. Relational quality can
still be considered important for the case company but from another perspective.
5.4.4. Part four- Products
In the last part, the respondents were asked to take position in 11 different
statements regarding the products in the store. The scale was from one to five, one
corresponded to disagree and five to agree. The result states that the participants
are satisfied with the quality of the products; they also consider the products to be
trendy, timeless and to stand out from other products by having that “extra
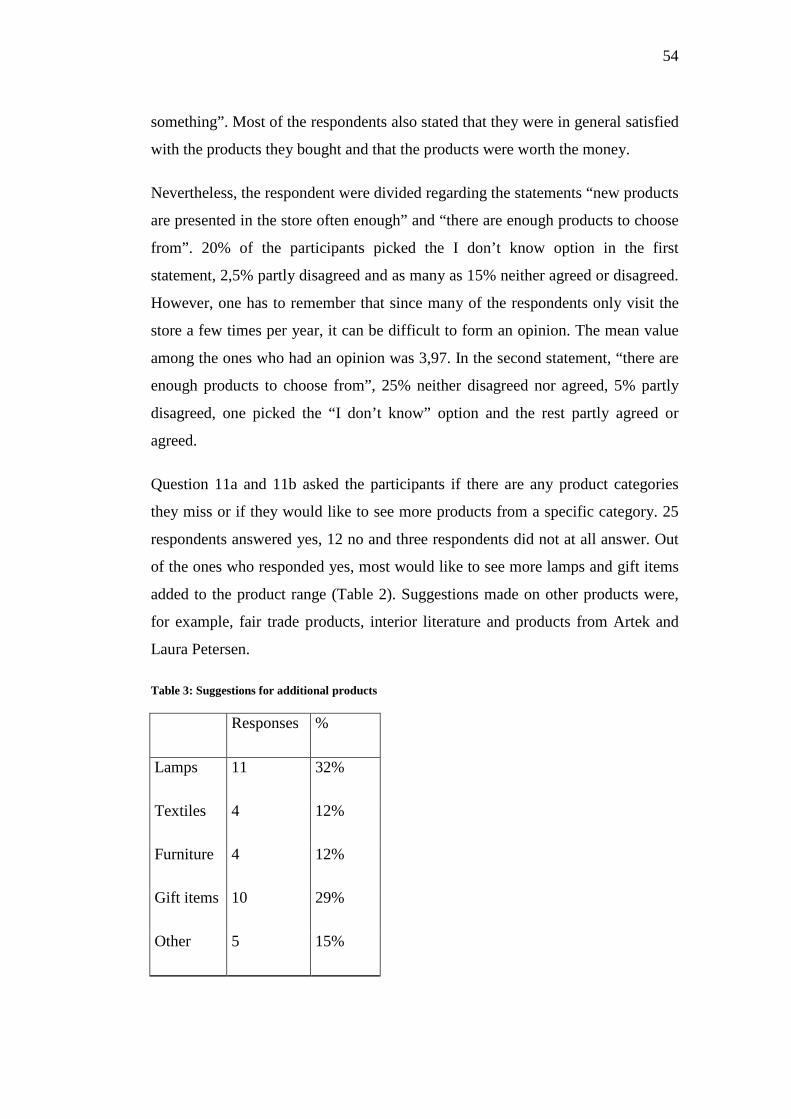
54
something”. Most of the respondents also stated that they were in general satisfied
with the products they bought and that the products were worth the money.
Nevertheless, the respondent were divided regarding the statements “new products
are presented in the store often enough” and “there are enough products to choose
from”. 20% of the participants picked the I don’t know option in the first
statement, 2,5% partly disagreed and as many as 15% neither agreed or disagreed.
However, one has to remember that since many of the respondents only visit the
store a few times per year, it can be difficult to form an opinion. The mean value
among the ones who had an opinion was 3,97. In the second statement, “there are
enough products to choose from”, 25% neither disagreed nor agreed, 5% partly
disagreed, one picked the “I don’t know” option and the rest partly agreed or
agreed.
Question 11a and 11b asked the participants if there are any product categories
they miss or if they would like to see more products from a specific category. 25
respondents answered yes, 12 no and three respondents did not at all answer. Out
of the ones who responded yes, most would like to see more lamps and gift items
added to the product range (Table 2). Suggestions made on other products were,
for example, fair trade products, interior literature and products from Artek and
Laura Petersen.
Table 3: Suggestions for additional products
Responses %
Lamps 11 32%
Textiles 4 12%
Furniture 4 12%
Gift items 10 29%
Other 5 15%
55
100%
One of Sisustus CASAs most competitive advantages are that they sell products of
high quality and many products that can not be found elsewhere in the region. The
study supported these facts; All the respondents claimed that it was either very
important or important with high quality and when asked specific about the case
company’s product quality 77,5% of the respondents agreed that the products was
of high quality, the rest 22,5% partly agreed. When analysing the additional
comments made by the respondents many gave positive feedback about the
uniqueness of the products and the fact that, they cannot be found in other stores
in the area.
Previous studies have shown that price is a key aspect within the furniture sector,
however those findings do only partly agree with this study. When asked about
how important advantageous prices are only 15% claimed it vas very important,
47,5 % important, the rest, 30% claimed that it was neither important nor
unimportant and 7,5% stated that it was unimportant. When comparing these facts
against the statement “the products are worth the money” the findings shows
clearly that, the respondents are willing to pay a relatively higher price for
products with high quality and with a good image.
When analysing the statements regarding product range and product assortment
deeper the study shows that, the product range partly meet the respondent’s
expectations; a part of the respondents would like to see a wider and a deeper
assortment. Since it is a speciality store, there are limitations to the possibility of a
wider and deeper assortment. The case company could in the future focus more on
how they display the products in store as well as the layout of the store. This will
effect the perception of the product range as well.
56
6. CONCLUSION AND DISCUSSION
The previous chapter focused on the research methods, the structure of the
questionnaire and the outcome and analysis of the questionnaire. In this part the
outcome from the discussions with the case company will be given, suggestions
for improvements as well as general conclusions.
The purpose of this paper was to find out how the case company’s existing
customers perceive the store, how they experience the service they receive and the
products they are offered. The research revealed a very positive result, the
customers service expectations are met and surpassed and the existing customers’
have in general a very positive attitude towards the atmosphere and image of the
store. Nevertheless, the results also showed on aspects the case company can work
on in the future in order to improve the customers’ perceptions even more. This
study helped the case company to discover and learn more about their customers’
opinions and perceptions. By doing so, they learn how to serve their customers
even better in the future.
In addition to the objectives of the thesis this study also examined if the
international articles used in the research methodology were valid within this
specific framework. The reason behind this originates from the fact that it is
difficult to find studies on customer perceptions from an interior store perspective.
The results proved that this is not always the case. Customer perception studies
done within other industries or segments does not always be valid because
customers choose and value different things when shopping for, for example,
food. Hence, the study showed the importance of doing customer perception
studies and not entirely depend on previous studies, moreover, if the results are
compared to other studies they should be compared to studies within the same
segment.
6.1. Discussions with Sisustus CASA
Analyses and results can be understood in a numerous of ways. In order to fully
understand them and be able to interpret them it is essential to also obtain the case
57
company’s viewpoint. Therefore, the results was presented and discussed with the
case company. When exchanging ideas and discussing with each other new
perspectives arise and ideas are formed.
The analysis was presented to the owner of the store and she gave her viewpoints
and comments on the results. On a general basis the responses was very positive
and the results showed on the strengths the company possesses when it comes to
excellent customer service and uniqueness.
When analyzing the results the first obvious weakness was the lack of male
respondents, only 5% of the respondents were men. However, the case company
experience that many of their regular customers are men, but unlike women, they
have not earlier been interested in newsletters or other forms of advertisements.
This factor can partly explain the low response rate among men. The case
company believed that a typical customer is a rather fastidious customer that
knows what s/he wants. The results support this statement; many of the
respondents claimed for example that they did not perceive interactions with other
personnel or customers to be important nor possibilities to sit down during
shopping. In other words, they know what they are in the hunt for and they
appreciate quality products and good service, they do not visit the store only to
look around and to spend time.
The statements regarding location and parking possibilities was among the
statements that received lowest scores. The case company is aware of this but it is
a complex issue, closely connected to factors such as profitability, costs and
available store premises. In order to keep existing customers it is important to
choose a new location carefully, the location of the business is something that
affects the image of the company as well.
The store is constantly developing its product range and assortment by keeping in
mind that the customers are looking for unique products and design classics.
Many respondents requested more lamps and gift items in the future. The
storeowner also confirmed this, a higher demand for lamps have been seen and the
58
reasons behind this might be that there are fewer stores in the city nowadays that
offer lamps.
6.2. Suggestions for improvements
The questionnaire revealed the customers’ perception of the store, its service,
image and product assortment. In a future study the research methodology could
be improved by adding more focus on the reasons behind these perceptions.
Understanding the reasons behind customers’ perception could give the case
company valuable information and deeper insights. This would be important in
the future, for example, if considering changing location. A more profound
research methodology could be complemented with an extended research, for
example, a depth interview or personal interviews with the focus on more open-
ended questions. This can be done within any of the thesis three topics; service,
store image or product assortment.
Relatively much research and studies on customer perceptions has already been
conducted but the research is often related to department stores or grocery stores.
The findings are often very industry specific and therefore, they are hard to apply
on other retail sectors and it is difficult to know if they are applicable. Hence,
another suggestion for improvement is to do a similar study for a similar store in
another country.
Retailing is nowadays much more international than it used to be, therefore it
would be interesting to compare the results from this study against the results
from another store within the same industry and segment. When comparing the
results against each other both stores could benefit from the results. Knowing one
another’s strengths and weaknesses originates in new ideas and perspectives and it
is possible to learn from others mistakes.
Concerning the questionnaire itself, some changes could be made if conducting a
similar study again. The rating scales disagree, partly disagree, neither disagree
nor agree, partly agree and agree was mainly used. The positive answer option
was all the time on the right hand side; in the future, this could be changed on
59
some questions in order to verify that the respondents read the questions carefully
and not just tick any option.
The “I don’t know” option was added on some questions in case there were
respondents who had not experienced all of the statements. However, only few
respondents used this option and therefore, it could be considered to be left out in
the future. The “I don’t know” option makes the analyzing in SPSS more difficult
and this is another reason for leaving it out. Nevertheless, it always needs to be
considered. Without this option, respondents might tick anywhere even though
they are not familiar with the statement.
Another alternative that could be considered in the future is to ask the respondents
to rate the statements from most important until least important. This would give a
clearer picture about their opinions. When only asking how important a statement
is many respondents tend to consider most of the statements important. On the
contrary, one has to remember that it demands much more from the respondents to
rate the statements and this might lead to that, some of them do not fill in the
questionnaire at all.
60
7. SUMMARY
The purpose of this thesis was to examine customer perceptions from an interior
store perspective; this was done with the help of a case company, Sisustus CASA.
The objectives were two folded, with the aim to analyze the existing customers’
perception of the store, the service and the product assortment and to investigate
how the company can use this knowledge and develop their business and
customer service even further. The theoretical part of the thesis was divided into
three parts; customer perception of service, store image and product assortment.
Humans are daily exposed the millions of different stimuli and when exposed to
stimuli a process start that selects, arranges and interprets this stimuli around us
and adjusts it to become ones own view of the world. Two people will never
experience the same and for that reason, it is essential for every company to know
the customers perceptions of their business. All interactions that occur between
the company and its customers ultimately affect the customers’ perception of the
business.
Depending on store type, customers expect different service quality. The case
company can be described as a specialty store for design furniture, lightning,
carpets and fabrics and customers do expect a more wide-ranging service when it
comes to specialty stores. Therefore, high customer service can be seen as
essential. Service quality was explained with help of the SERVQUAL model and
the quality dimensions.
The concepts of store image and store atmosphere are very wide and they consist
of several different dimensions. Frequently included dimensions are customers’
image of facilities, clientele, convenience and products. A favorable store image
affects not only purchase behavior in a positive way, a positive correlation
between customer satisfaction and loyalty has been seen as well. Since it is with
our senses we obtain stimuli the theory part also discussed in what way it
influences our perceptions when entering a store.
61
The last theory part considered customer perceptions of the product range.
Naturally, customers will perceive stores differently depending on the products
they are offered. All products serve a purpose and when deciding what product to
offered to the consumers, it is important to keep in mind that the products
ultimately should offer a solution to the customers’ problem, either a practical
solution or an emotional. How the products are presented and displayed in store,
as well as how width or depth the assortment is, affects customers perceptions of
both the product range and the store image. The portfolio matrix was presented as
one way of maintaining control over how the products are performing. The matrix
offers, as well, an explanation to how the performances of the products can be
improved.
With the theory as a base a questionnaire was constructed that would examine
customer perceptions of the case company. There had been done a considerable
amount of studies already on customer perceptions but the findings from an
interior perspective where few. Findings from other studies does not necessary be
applicable and it was important to the case company to know the customers
perceptions of the store.
A self-completion questionnaire was considered the best way to obtain answers to
the stated research questions. Self-completion questionnaires are both cheap, easy
to fill in and analyze and, most importantly, suitable to use in this context. The
questionnaires was both left in the store to be filled by visiting customers and sent
home to their regular customers. With this method, it was possible to capture both
the regular customers’ opinions as well as the opinions from customers just
passing by. All customers’ opinions are important in order to understand the
customers’ perceptions about the store entirely.
Altogether 100 questionnaires were sent out and in total, 40 respondents filled in
the questionnaire. Since most of the case companies customers are Swedish or
Finnish speaking the questionnaire were translate into both languages. The
questionnaire consisted of 12 questions divided into four parts. The first part
asked the respondents to take position in several statements regarding interior
shopping on a general basis. The rest of the questionnaire consisted of specific
62
statements and questions about the case company regarding their image, service
and product range. The general questions about interior shopping where asked in
order to find out if there were any clear gaps between the customers’ opinions and
their experiences from Sisustus CASA.
The results where analyzed using SPSS and Excel. On a general basis, the
outcome was very positive. The respondents experienced the image of the store to
be good; moreover, they deemed that the store offers products of high quality and
products that are unique. However, even though the respondents considered the
case company’s customer service to be good, this cannot be seen as their most
competitive advantage. The reason behind this is that customers do expect
excellent customer service when visiting specialty stores. Even though the
responses were positive, there were still parts that received relatively lower scores
and these parts can be developed in the future. For example, the study showed that
the product range and assortment only partly met the respondents’ expectations.
The analyses were presented to the case company in order to get their viewpoint
and opinions on the result. This was done with the intention to get a deeper
understanding and a new perspective on the result.
Even though the study did not reveal any earthshaking results, it still showed that
the company is on the right track, it also gave the company a better foundation to
stand on before making decisions in the future. Moreover, the study showed the
importance of customer perceptions and that customer perception studies does not
always be applicable within all retail sectors, some previous studies proved not to
be valid within this specific framework.
63
LITERATURE
Andrew J Newman, Peter Cullen 2002. Retailing: Environment & Operations. 1 e.
London. Thomson Learning.
Barry Davies, Philippa Ward 2002. Managing retail consumption. Chichester.
John Wiley & Sons Ltd.
Bernt Krohn Solvang, 2007. Satisfaction, Loyalty and Repurchase: A study of
Norwegian Customers of furniture and Grocery Stores. Journal of Consumer
Satisfaction, Dissatisfaction and Coplaining Behavior. Vol. 20 pg. 110
Bloemer J de Ruyter 1998. On the relationship between store image, store
satisfaction and store loyalty. European Journal of Marketing. Iss 32, pg 499-513.
Bruce Wrenn, Robert Stevens, David Louden 2002. Marketing Research – Text
and Cases. New York. Best Business Books.
Bruhn Manfred, Georgi Dominick 2006. Service marketing: managing the service
value chain. Essex. Pearson Education Limited.
CASA, 2009. [Online]. [Referenced 22.09.2009] Available in www-format:
URL:http://www.sisustuscasa.fi/swe.html
Dabholker Pratibha, Thorpe Dayle, Rentz Joseph 1996. A Measure of Service
Quality for Retailer Stores: Scale Development and Validation. Journal of the
Academy of Marketing Science. Iss 24. pg. 3-16
David Gilbert 2003. Retail Marketing Management. 2 e. Essex. Pearson Education
Limited.
Frank Haelsing, Bernhard Swoboda, Dirk Morschett, Hanna Schramm-Klein
2007. An intersector analysis of the relevance of service in building a strong retail
brand. Managing Service Quality. Vol 17, Iss 4, pg. 428.
64
Gaby Oderken-Schroder, Kristof De Wulf, Hans Kasper, Mirella Kleijnen, Janny
Hoekstra, Harry Commandeur 2001. The impact of quality on store loyalty: A
contingency approach. Total Quality Management. Vol 12, Iss 3, pg 307-322.
Gilmore Andrey 2003. Services, Marketing and Management. California. SAGE
Publications Ltd
Grönroos Chistian 2000. Service Management and Marketing - A customer
relationship management approach. Second edition. Chichester. John Wiley.
Horstdesign International 2009 [online]. [Referenced 06.11.2009]. Available in
www-format: URL:http://www.horstdesign.com/portfolio.htm
J. Paul Peter, Jerry C. Olson 2005. Consumer Behavior & Marketing Strategy. 7 e.
New York. McGraw-Hill/Irwin.
James Reardon, Chip E Miller, Barbara Coe 1995. Applied scale development:
Measurement of store image. Journal of Applied Business Research. Vol. 11, Iss.
4, pg 85.
Jhinuk Chowdhury, James Reardon, Rajesh Srivastava 1998. Alternative modes of
measuring store image: An empirical assessment of structured versus unstructured
measures. Journal of Marketing Theory and Practice. Vol. 6, Iss. 2, pg 72.
Jilian C Sweeney, Fiona Wyber 2002. The role of cognitions and emotions in the
music-approach-avoidance behaviour relationship. The Journal of Services
Marketing. Vol. 16, Iss. 1, pg 51.
Kivistö, Katarina 2009, Sisustus CASA oy, Vaasa. Email 30.09.2009
Lawrence O. Hamer, 2006. A confirmation perspective on perceived service
quality. The Journal of Services Marketing. Vol. 20, Iss. 4 pg. 219.
Leon G. Schiffman, Leslie Lazar Kanuk 2000. Consumer Behavior. 7 e. New
Jersey. Prentice-Hall.
65
Longenecker, Moore, Petty, Palich 2005. Small Business Management: An
Entrepreneurial Emphasis, 13 e. Ohio. Thomson, South-Western
Malcom Sullivan, Dennis Adcock 2002. Retail Marketing. London. Thomson.
Michael Solomon, Gary Bamossy, Søren Askegaard, Margaret K. Hogg 2006.
Consumer Behaviour – A European Perspective. 3 e. Harlow. Prentice Hall/
Pearson Education Limited.
Ogenyi Omar 1999. Retail marketing. Essex. Pearson Education Limited.
Paul Hague, Nick Hague, Carol-Ann Morgan 2004. Market Research in Practice –
a guide to the basics. London. Kogan Page Limited.
Philip Kotler, Gary Armstrong, Veronica Wong, John Saunders 2008. Principles
of marketing. 5 European edition. Harlow. Pearson Education Limited.
Porter Stephen, Claycomb Cindy 1997. The influence of brand recognition on
retail store image. The Journal of Product and Brand Management. Vol 6, Iss 6,
pg. 373.
ProFinder B2B 2009 Ab Sisustus CASA Oy [online]. [Referenced 13.10.2009].
Available in www-form:
<URL:http://profinderb2b.fonecta.com/companysingle.aspx?cID=7236290>
Roger D. Wimmer, Joseph R. Dominick 2006. Mass Media Research: an
introduction. 8 e. Belmont. Thomson Wadsworth.
Szwarc Paul 2005. Researching Customer Satisfaction and Loyalty: how to find
out what people really think. London. Kogan Page Limited.
V Ann Paulins, Loren V Geistfeld 2003. The effect of consumer perceptions of
store attributes on apparel store preference. Journal of Fashion Marketing and
Management. Vol 7, Iss 4, pg 371.
Wilson, Zeithaml, Bitner, Gremler 2008. Service Marketing: Integrating Customer
Focus Across the Firm. Berkshire. McGraw-Hill Education

66
Zemke, Woods 1998. Best Practices for Customer Service. Amherst. HRD Press
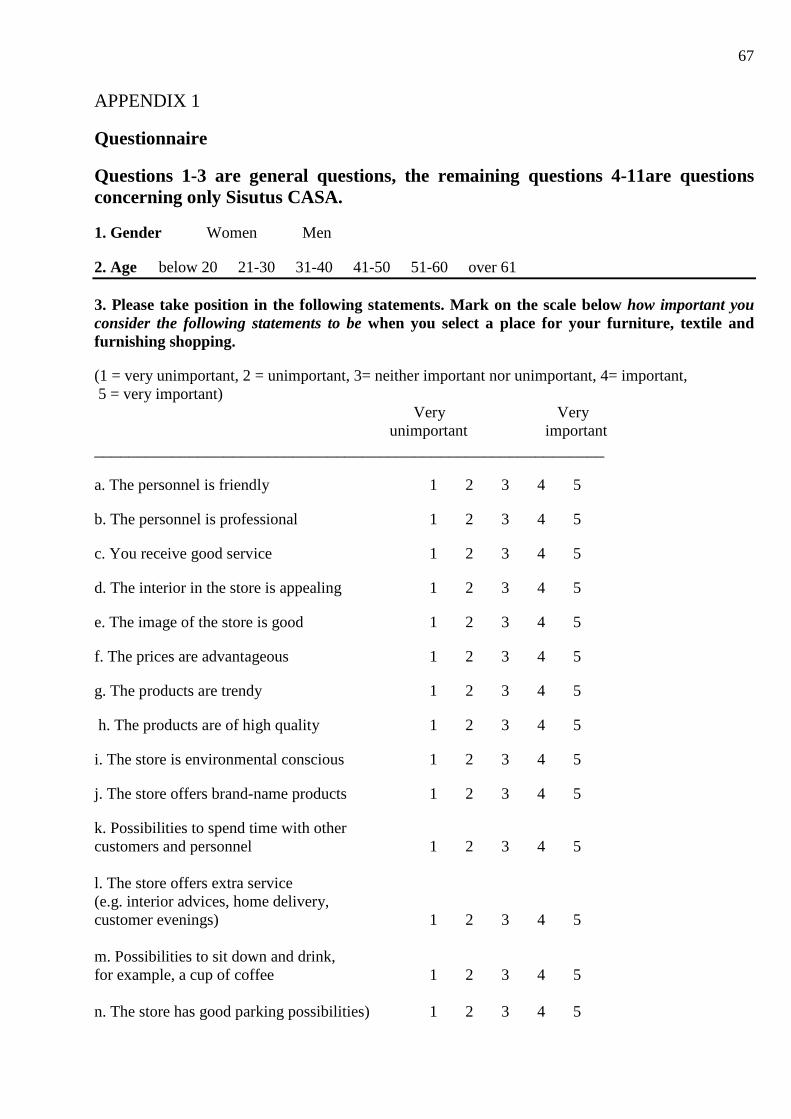
67
APPENDIX 1
Questionnaire
Questions 1-3 are general questions, the remaining questions 4-11are questions concerning only Sisutus CASA.
1. Gender � Women � Men
2. Age � below 20 � 21-30 � 31-40 � 41-50 � 51-60 � over 61
3. Please take position in the following statements. Mark on the scale below how important you consider the following statements to be when you select a place for your furniture, textile and furnishing shopping.
(1 = very unimportant, 2 = unimportant, 3= neither important nor unimportant, 4= important, 5 = very important)
Very Very unimportant important
___________________________________________________________
a. The personnel is friendly 1 2 3 4 5
b. The personnel is professional 1 2 3 4 5
c. You receive good service 1 2 3 4 5
d. The interior in the store is appealing 1 2 3 4 5
e. The image of the store is good 1 2 3 4 5
f. The prices are advantageous 1 2 3 4 5
g. The products are trendy 1 2 3 4 5
h. The products are of high quality 1 2 3 4 5
i. The store is environmental conscious 1 2 3 4 5
j. The store offers brand-name products 1 2 3 4 5
k. Possibilities to spend time with other customers and personnel 1 2 3 4 5 l. The store offers extra service (e.g. interior advices, home delivery, customer evenings) 1 2 3 4 5 m. Possibilities to sit down and drink, for example, a cup of coffee 1 2 3 4 5 n. The store has good parking possibilities) 1 2 3 4 5
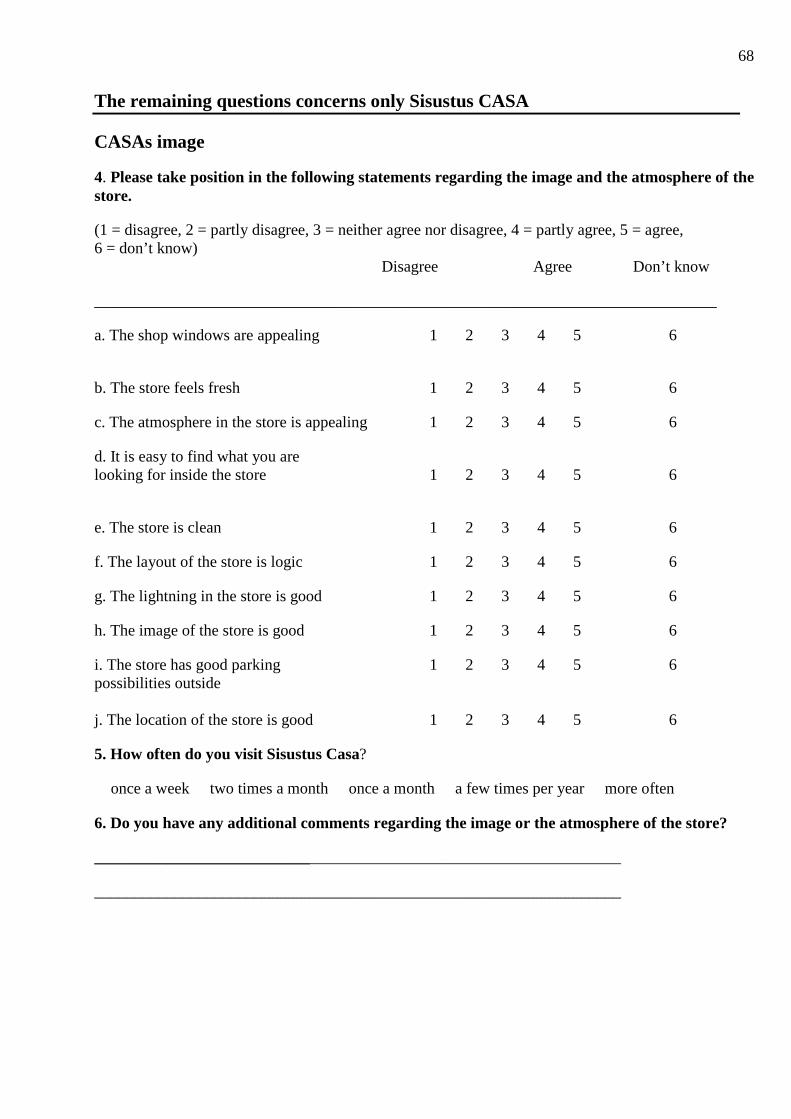
68
The remaining questions concerns only Sisustus CASA
CASAs image
4. Please take position in the following statements regarding the image and the atmosphere of the store.
(1 = disagree, 2 = partly disagree, 3 = neither agree nor disagree, 4 = partly agree, 5 = agree, 6 = don’t know) Disagree Agree Don’t know
______________________________________________________________________________
a. The shop windows are appealing 1 2 3 4 5 6
b. The store feels fresh 1 2 3 4 5 6
c. The atmosphere in the store is appealing 1 2 3 4 5 6
d. It is easy to find what you are looking for inside the store 1 2 3 4 5 6
e. The store is clean 1 2 3 4 5 6
f. The layout of the store is logic 1 2 3 4 5 6
g. The lightning in the store is good 1 2 3 4 5 6
h. The image of the store is good 1 2 3 4 5 6
i. The store has good parking 1 2 3 4 5 6 possibilities outside j. The location of the store is good 1 2 3 4 5 6
5. How often do you visit Sisustus Casa?
� once a week � two times a month � once a month � a few times per year � more often
6. Do you have any additional comments regarding the image or the atmosphere of the store?
__________________________________________________________________
__________________________________________________________________
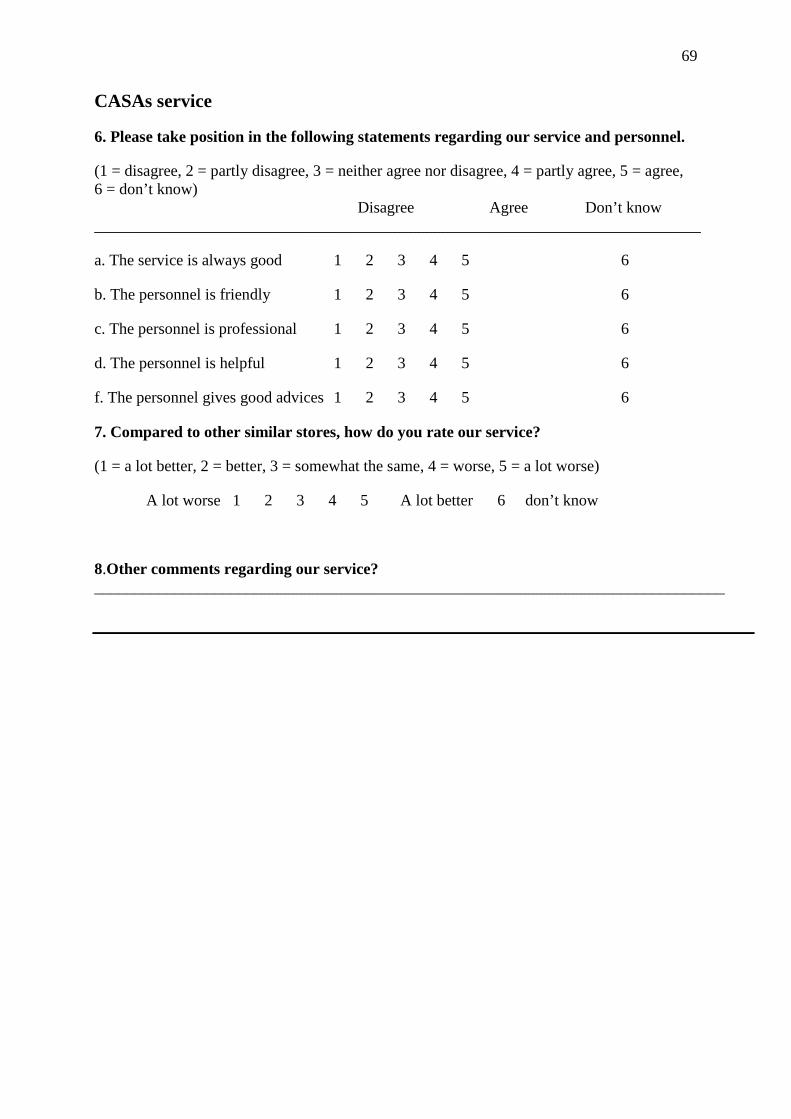
69
CASAs service
6. Please take position in the following statements regarding our service and personnel.
(1 = disagree, 2 = partly disagree, 3 = neither agree nor disagree, 4 = partly agree, 5 = agree, 6 = don’t know) Disagree Agree Don’t know ____________________________________________________________________________
a. The service is always good 1 2 3 4 5 6
b. The personnel is friendly 1 2 3 4 5 6
c. The personnel is professional 1 2 3 4 5 6
d. The personnel is helpful 1 2 3 4 5 6
f. The personnel gives good advices 1 2 3 4 5 6
7. Compared to other similar stores, how do you rate our service?
(1 = a lot better, 2 = better, 3 = somewhat the same, 4 = worse, 5 = a lot worse)
A lot worse 1 2 3 4 5 A lot better 6 don’t know
8.Other comments regarding our service? _______________________________________________________________________________
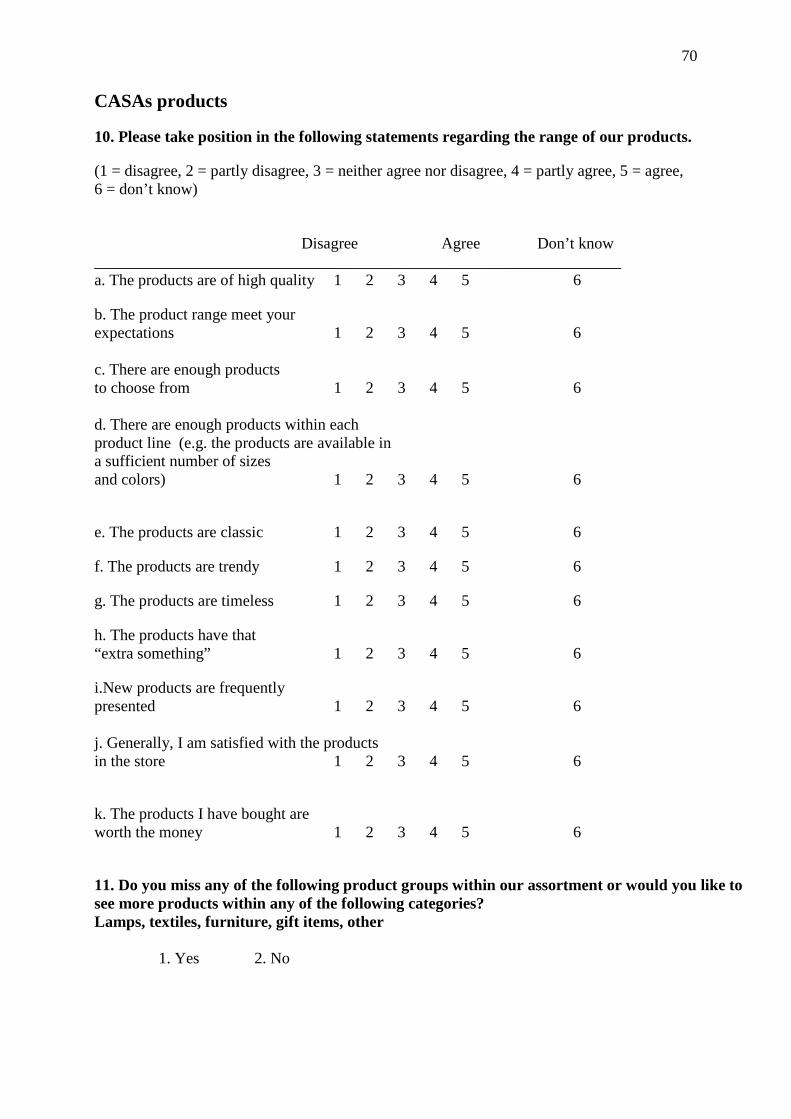
70
CASAs products
10. Please take position in the following statements regarding the range of our products.
(1 = disagree, 2 = partly disagree, 3 = neither agree nor disagree, 4 = partly agree, 5 = agree, 6 = don’t know)
Disagree Agree Don’t know __________________________________________________________________ a. The products are of high quality 1 2 3 4 5 6
b. The product range meet your expectations 1 2 3 4 5 6 c. There are enough products to choose from 1 2 3 4 5 6 d. There are enough products within each product line (e.g. the products are available in a sufficient number of sizes and colors) 1 2 3 4 5 6
e. The products are classic 1 2 3 4 5 6
f. The products are trendy 1 2 3 4 5 6
g. The products are timeless 1 2 3 4 5 6
h. The products have that “extra something” 1 2 3 4 5 6
i.New products are frequently presented 1 2 3 4 5 6 j. Generally, I am satisfied with the products in the store 1 2 3 4 5 6
k. The products I have bought are worth the money 1 2 3 4 5 6
11. Do you miss any of the following product groups within our assortment or would you like to see more products within any of the following categories? Lamps, textiles, furniture, gift items, other
� 1. Yes � 2. No
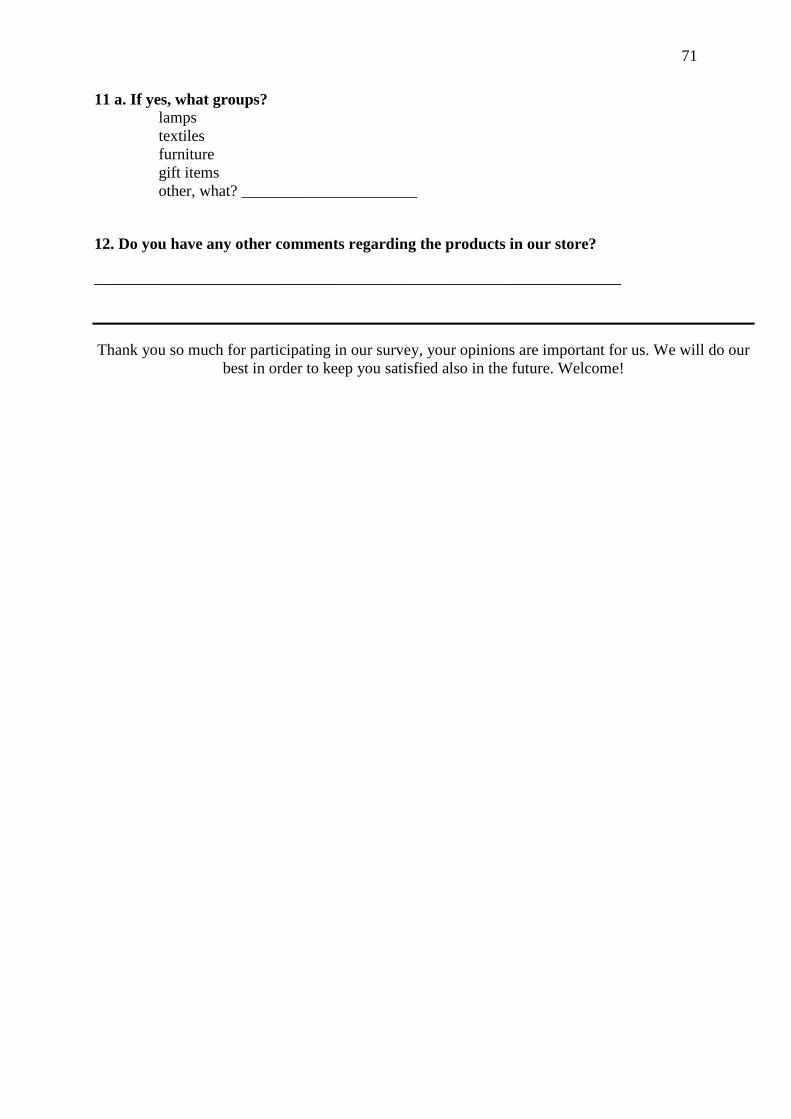
71
11 a. If yes, what groups? � lamps
� textiles � furniture � gift items � other, what? ______________________
12. Do you have any other comments regarding the products in our store?
__________________________________________________________________
Thank you so much for participating in our survey, your opinions are important for us. We will do our best in order to keep you satisfied also in the future. Welcome!