curriculum-instructional issue.doc
TRANSCRIPT

7/27/2019 CURRICULUM-INSTRUCTIONAL ISSUE.doc
http://slidepdf.com/reader/full/curriculum-instructional-issuedoc 1/41
ESEM5133 CURRICULUM AND INSTRUCTION
CHAPTER 1
RESEARCH PROBLEM
1.1 Introduction
This research investigated the effectiveness of using concept mapping in the teaching and
learning of Science. According to Fernandez and Placing (2000) meaningful learning results
when a person consciously and explicitly ties new knowledge to relevant concepts they already
process. They added that Ausubel’s learning theory suggests that when meaningful learning
occurs, it produces a series of changes within our entire cognitive structure, modifying exiting
concepts and forming new linkages between concepts.
Teaching has been considered the act of transferring information from the teacher to the learner
who was seen as empty vessel to be filled with knowledge. This view of learning was due to the
popularity of behaviourist learning theories which focused on how the presentation of the
information affected learning outcomes (Weinstein & Mayer, 1986). Therefore, it was not
surprising that the art of teaching became the art of presenting information.
Concept mapping can promote efficient and meaningful learning by connecting prior knowledge
to new ones (Novak & Gowin, 1984; White & Gunstone, 1992). Jegede, Alaiyemola, and
Okebukola (1990) have maintained that concept mapping serves as a tool to help learners
organize their cognitive frameworks into more powerful integrated patterns. Thus this paper
investigates the effectiveness of concept mapping in helping students to actively develop their
understandings that assist them to link the science content with appropriate learning practice.
1.2 Background of the Research
Concept maps have been used in education, policy studies and the philosophy of science to
provide a visual representation of knowledge structures and argument forms. Prof. Joseph D.
1
7/27/2019 CURRICULUM-INSTRUCTIONAL ISSUE.doc
http://slidepdf.com/reader/full/curriculum-instructional-issuedoc 2/41
ESEM5133 CURRICULUM AND INSTRUCTION
Novak at Cornell University in the 1960s, developed this concept mapping as an aid to learning,
assess understanding and to avoid misunderstanding.
Studies of memory indicate that the brain will forget 80 percent of detail within 24 hours of
having learned it, and 99 percent within two weeks. One of the greatest demotivators for a
student is to learn appropriate information, then to “lose” almost all of it within a fortnight. As a
result, many teachers with the honest intention of motivating and teaching their students were
actually demotivating them.
Bate and Sharpe (1990) reported that users of concept map comprehend knowledge structures in
semantic networks more readily than in textual form. It was less constrictive and was self-
perpetuating with feedback loops. It was hoped to function as a powerful tool when learning
Science.
1.3 Statement of the Problem
Teachers hardly used concept mapping when teaching Science to their students. According to
Lloyd (1996) concept mapping technique will let the students to learn visually and remember
facts better. Concept maps are two or three dimensional spatial or graphic displays that make use
of labeled nodes to represent concepts and lines or arcs to represent relationships between pairs
of concepts. It has been suggested that their structure parallels the human cognitive structure, as
they show how learners organize concepts (Novak & Gowin, 1984; Fisher et al, 1990; Tippings,
& Gallard, 1994). Thus, this research will prove the effectiveness of using concept mapping by
Science teachers to help their students in learning Science effectively.
1.4 Conceptual Framework
This research was an attempt to establish the effectiveness of using concept mapping in teaching
Science to Form One Students. The figure 1 below was the conceptual framework. The outcomes
of the treatment was the students’ performances, motivation and preferences towards the
teaching method.
2
7/27/2019 CURRICULUM-INSTRUCTIONAL ISSUE.doc
http://slidepdf.com/reader/full/curriculum-instructional-issuedoc 3/41
ESEM5133 CURRICULUM AND INSTRUCTION
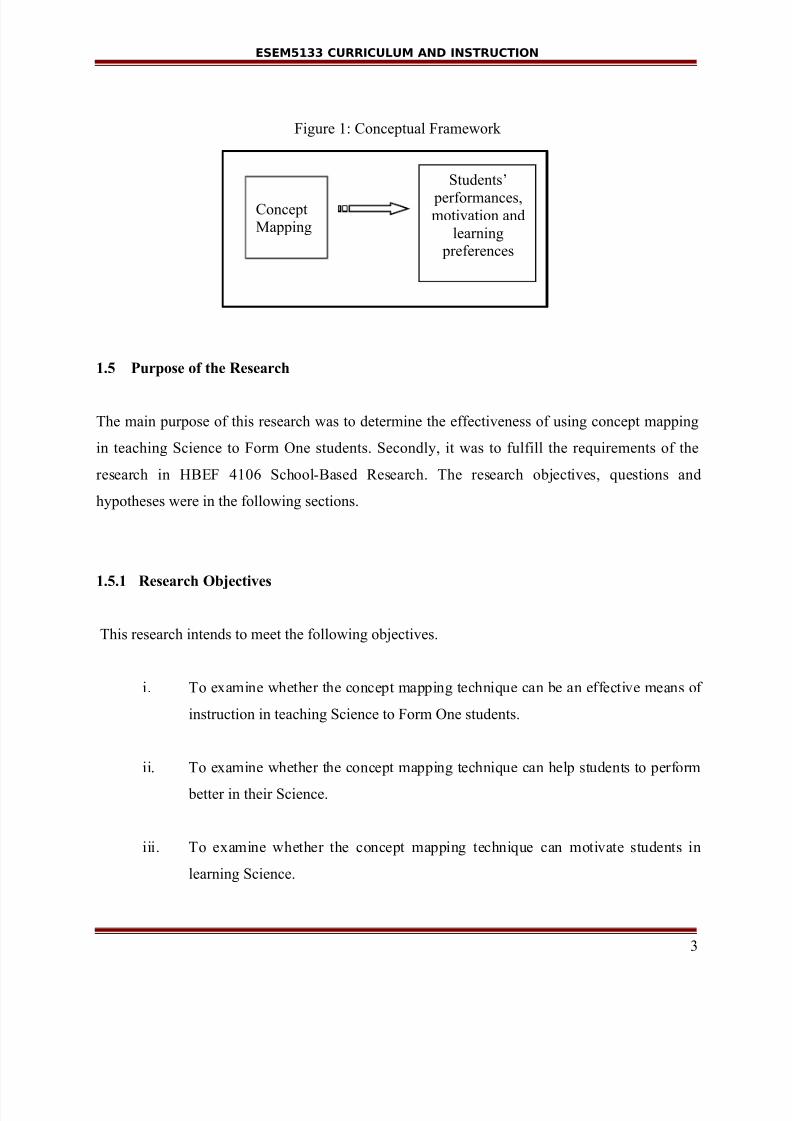
Figure 1: Conceptual Framework
1.5 Purpose of the Research
The main purpose of this research was to determine the effectiveness of using concept mapping
in teaching Science to Form One students. Secondly, it was to fulfill the requirements of the
research in HBEF 4106 School-Based Research. The research objectives, questions and
hypotheses were in the following sections.
1.5.1 Research Objectives
This research intends to meet the following objectives.
i. To examine whether the concept mapping technique can be an effective means of
instruction in teaching Science to Form One students.
ii. To examine whether the concept mapping technique can help students to perform
better in their Science.
iii. To examine whether the concept mapping technique can motivate students in
learning Science.
3
ConceptMapping
Students’
performances,motivation and
learning preferences

7/27/2019 CURRICULUM-INSTRUCTIONAL ISSUE.doc
http://slidepdf.com/reader/full/curriculum-instructional-issuedoc 4/41
ESEM5133 CURRICULUM AND INSTRUCTION
1.5.2 Research Questions
The following research questions are formulated in order to meet the research objectives.
i. Can using concept mapping be an effective means of instruction in teaching
Science to Form One students?
ii. How and to what extend are concept mapping significant in helping students to
perform better in their Science?
iii. Are students more motivated in learning Science after using concept mapping?
1.6 Significance of the Research
This research provides an alternative approach to help students that are weak in Science. It is
vital for teachers to have a wide variety of method to use in their classes (Sarasin, 1999). The
need for teachers to use diverse learning styles has also been recognized in general (Claxton and
Murrell, 1987) Therefore, using Concept Maps as an in class exercise is one tool that Science
teachers can add to their portfolio of active learning activities as they seek to move beyond chalk
and talk (Becker and Watts, 1996).
Concept Maps are an effective study technique when used to improve factual recall from written
material. Beside that, it is also to contribute to the lack of research in this area. This study hopes
to provide a significant insight in explaining the role of concept mapping which aided the
students in the teaching and learning of Science.
4
7/27/2019 CURRICULUM-INSTRUCTIONAL ISSUE.doc
http://slidepdf.com/reader/full/curriculum-instructional-issuedoc 5/41
ESEM5133 CURRICULUM AND INSTRUCTION
1.7 Limitations of the Research
There were some limitations to this research which the researcher feels can be overcome with a
more in-depth study carried out on the topic. Areas that hinder this research are,
i. Students might not know and not familiar with concept mapping and this might
affected the time taken to teach them to draw the Concept Maps.
ii. Some students are weak in their Science, thus making it difficult for
them to generate ideas to draw the Concept Maps.
iii. The time constrain of only 6 weeks or 10 sessions, might not show the
significant effect of the learning outcomes.
.
1.8 Definition of Terms
Concept Maps
John Langan (2000) defines concept mapping as helpful for people who like to do their thinking
in a visual way. It uses lines, boxes, arrows and circles to show relationships among the ideas
and details. It provides an early sense of how ideas and details relate to one another.
Concept mapping is a technique for representing knowledge in graphs. These graphs consist of
nodes and links. Nodes represent concepts and links represent relationship between the concepts
(Novak and Govin, 1984). Nodes (often circles) represent various concepts and ideas; and links
(lines/arrows) represent the relationships between concepts (Lanzing, 1997).
5

7/27/2019 CURRICULUM-INSTRUCTIONAL ISSUE.doc
http://slidepdf.com/reader/full/curriculum-instructional-issuedoc 6/41
ESEM5133 CURRICULUM AND INSTRUCTION
Branches
An idea may branch many times to include both closely and distantly related ideas.
Arrows
You may want to use arrows to join ideas from different branches.
Groupings
If a number of branches contain related ideas, you may want to draw a circle around the whole
area.
1.8 Summary
This research investigates the effectiveness of using concept mapping in teaching and learning
Science in Form One students. The objectives of this research are to determine whether concept
mapping can be an alternative effective means to help students to learn Science.
6
7/27/2019 CURRICULUM-INSTRUCTIONAL ISSUE.doc
http://slidepdf.com/reader/full/curriculum-instructional-issuedoc 7/41
ESEM5133 CURRICULUM AND INSTRUCTION
CHAPTER 2
LITERATURE REVIEW
2.1 Introduction
This chapter presents an overview of using Concept Maps in teaching and learning Science to
Primary Six students in Sekolah Kebangsaan Penampang. The literature review examined related
studies which were carried out by other researchers. All discussion in this chapter was centered
around the key factors of concept mapping in teaching Science which is the main interest of this
study.
2.2 What is a Concept Map?
Concept Maps were introduced by Novak (1993) is a process of representing the knowledge
structures used in learning in a two dimensional graphic arrangements including the labeling and
linking of concepts to form associates, hierarchies or propositions. There are four major
categories of concept maps. These are distinguished by their different format for representing
information. Examples of the various types of concept maps are presented below.
2.2.1 Four Major Categories of Concept Maps: (Adapted from: Graphic Organizers concept
mapping mind mapping inspiration)
a. Spider Concept Map
The Spider Concept Map was organized by placing the central theme or unifying
factor in the center of the map. Outwardly radiating sub-themes surround the
center of the map.
7

7/27/2019 CURRICULUM-INSTRUCTIONAL ISSUE.doc
http://slidepdf.com/reader/full/curriculum-instructional-issuedoc 8/41
ESEM5133 CURRICULUM AND INSTRUCTION
b. Hierarchy Concept Map
The hierarchy concept map presents information in a descending order of
importance. The most important information is placed on the top. Distinguishing
factors determine the placement of the information.
c. Flowchart Concept Map
The flowchart concept map organizes information in a linear format.
8
7/27/2019 CURRICULUM-INSTRUCTIONAL ISSUE.doc
http://slidepdf.com/reader/full/curriculum-instructional-issuedoc 9/41
ESEM5133 CURRICULUM AND INSTRUCTION
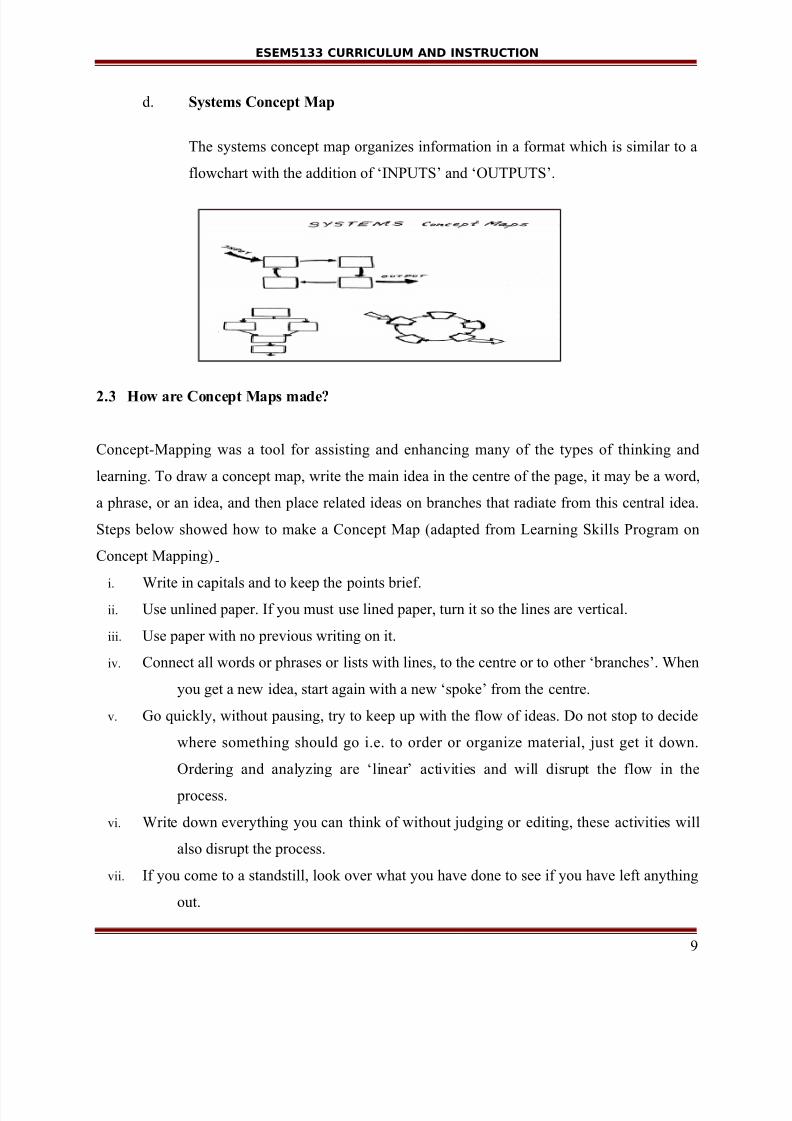
d. Systems Concept Map
The systems concept map organizes information in a format which is similar to a
flowchart with the addition of ‘INPUTS’ and ‘OUTPUTS’.
2.3 How are Concept Maps made?
Concept-Mapping was a tool for assisting and enhancing many of the types of thinking and
learning. To draw a concept map, write the main idea in the centre of the page, it may be a word,
a phrase, or an idea, and then place related ideas on branches that radiate from this central idea.
Steps below showed how to make a Concept Map (adapted from Learning Skills Program on
Concept Mapping)
i. Write in capitals and to keep the points brief.ii. Use unlined paper. If you must use lined paper, turn it so the lines are vertical.
iii. Use paper with no previous writing on it.
iv. Connect all words or phrases or lists with lines, to the centre or to other ‘branches’. When
you get a new idea, start again with a new ‘spoke’ from the centre.
v. Go quickly, without pausing, try to keep up with the flow of ideas. Do not stop to decide
where something should go i.e. to order or organize material, just get it down.
Ordering and analyzing are ‘linear’ activities and will disrupt the flow in the
process.
vi. Write down everything you can think of without judging or editing, these activities will
also disrupt the process.
vii. If you come to a standstill, look over what you have done to see if you have left anything
out.
9
7/27/2019 CURRICULUM-INSTRUCTIONAL ISSUE.doc
http://slidepdf.com/reader/full/curriculum-instructional-issuedoc 10/41
ESEM5133 CURRICULUM AND INSTRUCTION
viii. You may want to use color-coding, to group sections of the Concept Map.
2.4 Concept Maps in the Teaching and Learning of Science
Science teachers using lecture and rote learning has been greatly reduced. The teacher’s role is
seen more as a coach and a facilitator of learning rather than a supplier of knowledge. They gave
students more control over the process of learning by emphasizing the need to learn how to learn.
The process of concept mapping can reduce the need for rote memory and make learning more
meaningful (Novak, 1998). For one thing, the actual physical production, drawing, connecting,
writing, and the visual aspects, in conjunction with the thought process involved in organizing
the map reinforce and deepen comprehension (Wilkes, Cooper & Lewin, 1999).
Students who were used to being given information by their teachers can be slow to warm up to
concept mapping. They will find it much more challenging to construct a meaningful relationship
on their own rather than having it fed to them by the instructor (Novak, 1998). Therefore it may
be assumed that if students are going to acquire the use of concept mapping and incorporate it
into their way of successful study habits, they must accept its benefits. It may also be said that
for teachers to use concept maps effectively and consistently, they must also be able to see
evidence of their benefits. This study is designed to test the effectiveness of concept mapping in
improving reading comprehension of a science related text when compared to reading a similar
text without using any graphic organizers.
In recent years cognitive scientists emphasized the study of how information is stored and
processed in memory. They view learners as processors of information who use a variety of
strategies to store and retrieve knowledge (Weinstein & McDonald, 1986). Thus the learner is a
person who can engage in activities that will aid in the processing of information. Such mental
activities help people to acquire, organize, and remember incoming knowledge more efficiently
(Park, 1995).
2.5 Related Literature
10
7/27/2019 CURRICULUM-INSTRUCTIONAL ISSUE.doc
http://slidepdf.com/reader/full/curriculum-instructional-issuedoc 11/41
ESEM5133 CURRICULUM AND INSTRUCTION
Visual learning techniques such as graphical ways of working with ideas and presenting
information helps to teach students to clarify their thinking, and to process, organize and
prioritize new information. Visual diagrams reveal patterns, interrelationships and inter
dependencies. They also stimulate creative thinking. (Drapeau, 1998)
Visual learning techniques help students to clarify their thinking (Anders and Beech, 1990).
Students see how ideas are connected and realize how information can be grouped or organized.
With visual learning, new concepts are easily understood. It can reinforce understanding.
Students recreate, in their own words, what they’ve learned. This helps them absorb and
internalize new information, giving them ownership of their ideas. Integrate new knowledge
with diagrams updated throughout a lesson can prompt students to build upon prior knowledge
and internalize new information (Buzan, 1983). By reviewing diagrams created previously,students see how facts and ideas fit together. Thus, students can identify misconceptions. Just as
a concept map or web shows what students know, misdirected links or wrong connections reveal
what they don't understand. (Bellanca, 1990; Drapeau, 1998).
Six uses of concept maps were identified by White and Gunstone (1992) and these were: to
explore understanding of a limited aspect of the topic; to check whether learners understand the
purpose of instruction; to see whether learners can make links between concepts; to identify
changes that learners make in relationships between concepts; to find out which concepts are
regarded as key ones; and to promote learner discussion. When students construct concept maps
they identify and define important concepts or ideas and graphically represent interrelationships
among concepts (White & Gunstone, 1992). The resulting Concept Map represents a spatial
organisation of their knowledge. As the links in this structure are labelled, and the concepts fully
described, the map becomes of greater value to the students. While this part of the process is
crucial, it is not an easy task and White and Gunstone (1992) report that students find this part to
be a most tedious and they would skip it if they could.
Even though the physical part of the Concept Maps process is not easy, students still have to
apply their current knowledge when they construct their map (Wheatley, 1991). Drapeau (1998)
states that in general if students persist at creating Concept Maps, they report that their revision
process has become easier and they gained better understanding of the Science lessons. Students
11

7/27/2019 CURRICULUM-INSTRUCTIONAL ISSUE.doc
http://slidepdf.com/reader/full/curriculum-instructional-issuedoc 12/41
ESEM5133 CURRICULUM AND INSTRUCTION
can then use this map as a framework to which they can attach additional information such as,
they can turn the Concept Map into a lecturer-guided formative organizer. This strategy allows
students to compare knowledge structures and to identify any misconceptions they have about
the Science material presented.
Concept Maps can be a productive way to study for an exam, particularly if the emphasis of the
subject is on understanding and applying abstract, theoretical material, rather than on simply
reproducing memorized information (Drapeau, 1998). Doing a concept Map of the subject
content can point out the most important concepts and principles, and allow students to see the
ways in which they fit together. This may also help students to see their weak areas, and help
them to focus on their studying.
2.6 Summary
In conclusion most of the past researches revealed that concept mapping developed by Novak
influences the learning skills among students especially in Science. It identifies the way students
think and see relationships between knowledge. The main contribution of this technique is the
impact towards the students’ motivation and performances in their Science.
CHAPTER 3
RESEARCH METHODOLOGY
12

7/27/2019 CURRICULUM-INSTRUCTIONAL ISSUE.doc
http://slidepdf.com/reader/full/curriculum-instructional-issuedoc 13/41
ESEM5133 CURRICULUM AND INSTRUCTION
3.1 Introduction
This research investigated the effectiveness of using concept mapping as a means to help
students in their Science lesson. This chapter contained the complete research design, population
and sample, research instruments, procedure for data collection and the procedures for data
analyses.
3.2 Research Design
The sample taken into consideration was a class of average performance of Primary Six students
from Sekolah Kebangsaan Penampang.
Method of data analysis was data preparation, counting, regrouping, relating, predicting and
statistical testing from the responses of questionnaires and tests.
3.3 Population and Sample
The population and sample for this research is a class of Primary Six students in a Sekolah
Kebangsaan Penampang. The participants for this research are 50 from Perdana and Waja
students in an average class.
3.4 Research Instruments
The research instruments employed for this research was a set of questionnaire, survey,
interview and tests (pre-test and post-test). Questionnaires used in this researched was modified
and adapted from Clanchy, B & Ballard, B. ( 1997 ) solely for the purpose of this research.
Minimal changes was done but without losing the direction of the contents that were tested.
The questionnaire is to seek the students’ background and prior knowledge of concept mapping.
13
7/27/2019 CURRICULUM-INSTRUCTIONAL ISSUE.doc
http://slidepdf.com/reader/full/curriculum-instructional-issuedoc 14/41
ESEM5133 CURRICULUM AND INSTRUCTION
(Appendix 1) It was also to get the students’ feedback on the effectiveness of using concept
mapping in learning Science.
The pre-test and post-test was to see the differences in the students’ performances. It was to
determine the effectiveness of using concept mapping in the teaching and learning Science.
3.5 Procedure for Data Collection
The data for this research was collected through questionnaires,survey,interview and tests taken
by the students. The details of the procedures was as the following.
Step One The researcher observed an on-going Science lesson in the classroom.
This will take 1 hour.
Step Two The researcher gave the students a test (pre-test) without teaching them
concept mapping.
Step Three The students were taught the Science lesson using the features of the
concept map.
Step Four The students were asked to take another test (post-test).
Step Five A set of questionnaire to obtain the students’ background information,
their prior knowledge on concept mapping and their view on the
effectiveness of using concept mapping in learning Science.
3.6 Procedure for Data Analyses
14
7/27/2019 CURRICULUM-INSTRUCTIONAL ISSUE.doc
http://slidepdf.com/reader/full/curriculum-instructional-issuedoc 15/41
ESEM5133 CURRICULUM AND INSTRUCTION
Procedure for data analyses in this research was mainly through questionnaires and tests. The
data collected from the students was analyzed using the statistical method. The procedure on
how the data analyses are employed was explained in the following:
Step 1. Frequencies and percentages was used to describe the profile of the respondents.
Step 2. Frequencies and percentages was used to determine the respondents’ preference
and motivation after learning through concept mapping.
Step 3. Means was used to describe the performance of the respondents. (Results from
pre-test and post-test)
3.7 Summary
This methodology of this research is based on a simple research design limited by a number of
factors. The effectiveness of using concept mappings technique to enhance writing ideas is
determine through a quasi-experiment method in learning science.
The research design was simple but quite effective in collecting adequate and appropriate data
for the purpose of identifying the effectiveness of concept mappings method for idea generation
and organization in writing stage.
CHAPTER 4
RESEARCH RESULT
15

7/27/2019 CURRICULUM-INSTRUCTIONAL ISSUE.doc
http://slidepdf.com/reader/full/curriculum-instructional-issuedoc 16/41
ESEM5133 CURRICULUM AND INSTRUCTION
4.1 Introduction
The main discussions in this chapter focuses on the research conducted to examining the
effectiveness of using concept mappings technique in teaching science in Primary Six student’s
in motivating student’s to write and answer the questions.
4.2 Profile of respondents
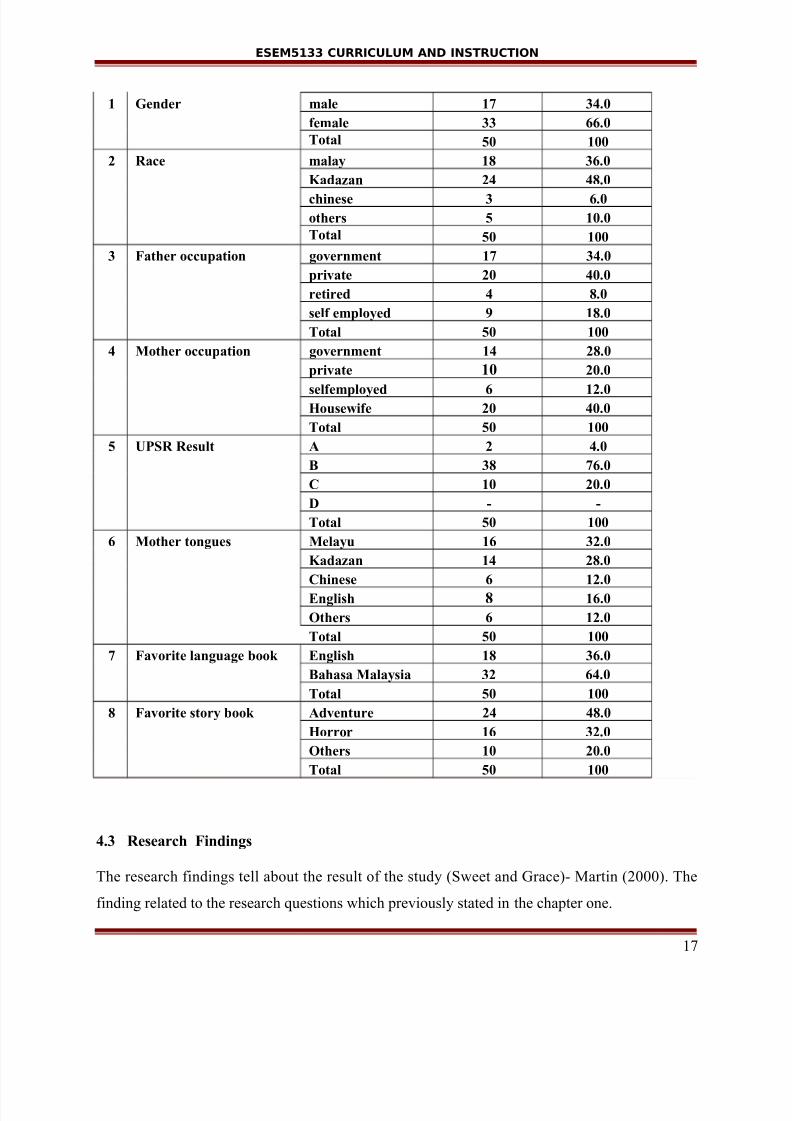
The respondents’ profile is shown in the table 4.1. Majority of the respondents involved in this
research are males (60.6 percent) and only 39.4 percent of them are females.
Most of the respondents are Kadazan (39 percent) followed by Malay (36.4 percent), Chinese
(9.1 percent) and others (15.2 percent). The respondents’ father occupation mostly working in
private sector (38.7 percent), followed by government (29 percent), self employed (29 percent)
and retired (3.2 percent).
During the UPSR examination, majority of the respondents involved in this research scored
grade D (56.3 percent), followed by grade C (31.3 percent), grade B (9.4 percent) and grade A
(3.1 percent).
The mother tongues of the respondents mostly are Kadazan (42.4 percent), Malay (27.3 percent),
English (9.1 percent) and others (18.2 percent).
Table 4.1: Respondent’s Profile for Primary Six Perdana and Waja
No Profile Description Frequency Percentage
16
7/27/2019 CURRICULUM-INSTRUCTIONAL ISSUE.doc
http://slidepdf.com/reader/full/curriculum-instructional-issuedoc 17/41
ESEM5133 CURRICULUM AND INSTRUCTION
1 Gender male 17 34.0
female 33 66.0
Total 50 100
2 Race malay 18 36.0
Kadazan 24 48.0
chinese 3 6.0
others 5 10.0
Total 50 100
3 Father occupation government 17 34.0
private 20 40.0
retired 4 8.0
self employed 9 18.0
Total 50 100
4 Mother occupation government 14 28.0
private 10 20.0
selfemployed 6 12.0Housewife 20 40.0
Total 50 100
5 UPSR Result A 2 4.0
B 38 76.0
C 10 20.0
D - -
Total 50 100
6 Mother tongues Melayu 16 32.0
Kadazan 14 28.0
Chinese 6 12.0
English 8 16.0
Others 6 12.0
Total 50 100
7 Favorite language book English 18 36.0
Bahasa Malaysia 32 64.0
Total 50 100
8 Favorite story book Adventure 24 48.0
Horror 16 32.0
Others 10 20.0
Total 50 100
4.3 Research Findings
The research findings tell about the result of the study (Sweet and Grace)- Martin (2000). The
finding related to the research questions which previously stated in the chapter one.
17
7/27/2019 CURRICULUM-INSTRUCTIONAL ISSUE.doc
http://slidepdf.com/reader/full/curriculum-instructional-issuedoc 18/41
ESEM5133 CURRICULUM AND INSTRUCTION
4.3.1 Questionnaire Set 1
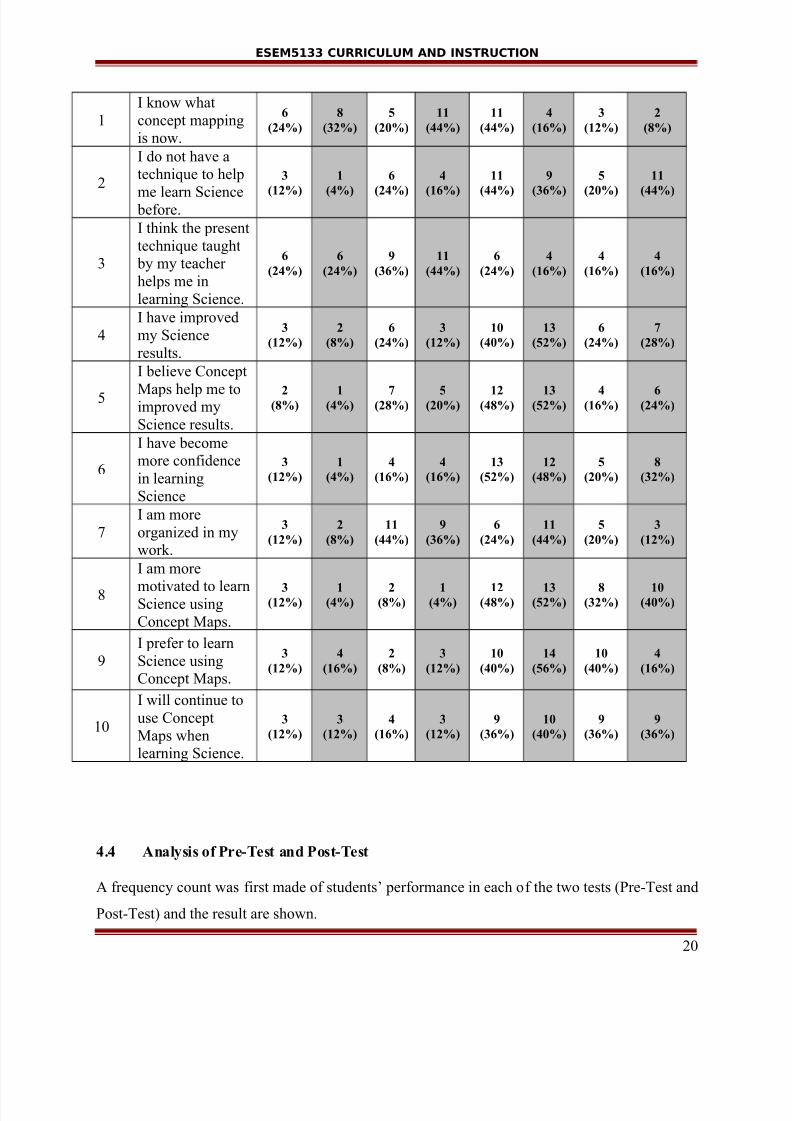
Table 4.2 shows the summary of all the respondents’ responds towards the using of concept
mappings technique . The table which shown in Table 4.2 indicates that the responds from the
respondents.
For item 1, 75 percent of the respondents showed their interest in using concept mapping with 75
percent chose the option Strongly Agree and Agree while for the option Strongly Disagree and
Disagree (15 percent) and 10 percent chose the option Neither, which means that the
respondents are still confusing of using mind mapping in their study.
For item 2, 15 percent of the respondents chose Strongly Disagree and Disagree, 10 percent
choose Neither and 75 percent of them choose Strongly Agree and Agree. This result showed
that the respondents do not have any technique to learn science before the introducing of concept
mapping.
For item 3, after the concept mapping was introduced to the respondents, 60 percent of them
chose Strongly Agree and Agree, 30 percent chose Strongly Disagree and Disagree and only 10
percent that is one respondent still did not know how to use concept mapping in the study.
For item 4,5,6 and 8, most of the respondents indicated that by using concept mapping in their
study, they gained lots of benefits and improved their result in science subject. They became
more motivated in learning science subject and their interest towards the subject was increased.
For item 9, 80 percent prefer to learn science subject using concept mappings, 14 percent did not
like to use the concept and 6 percent was still confused.
The overall results gave the impression that the respondents did have a positive attitude towards
the using of concept mappings technique. This is showed in item 10, which 70 percent of the
respondents had indicated agreement (Strongly Agree and Agree) to most of the items.
18
7/27/2019 CURRICULUM-INSTRUCTIONAL ISSUE.doc
http://slidepdf.com/reader/full/curriculum-instructional-issuedoc 19/41
ESEM5133 CURRICULUM AND INSTRUCTION
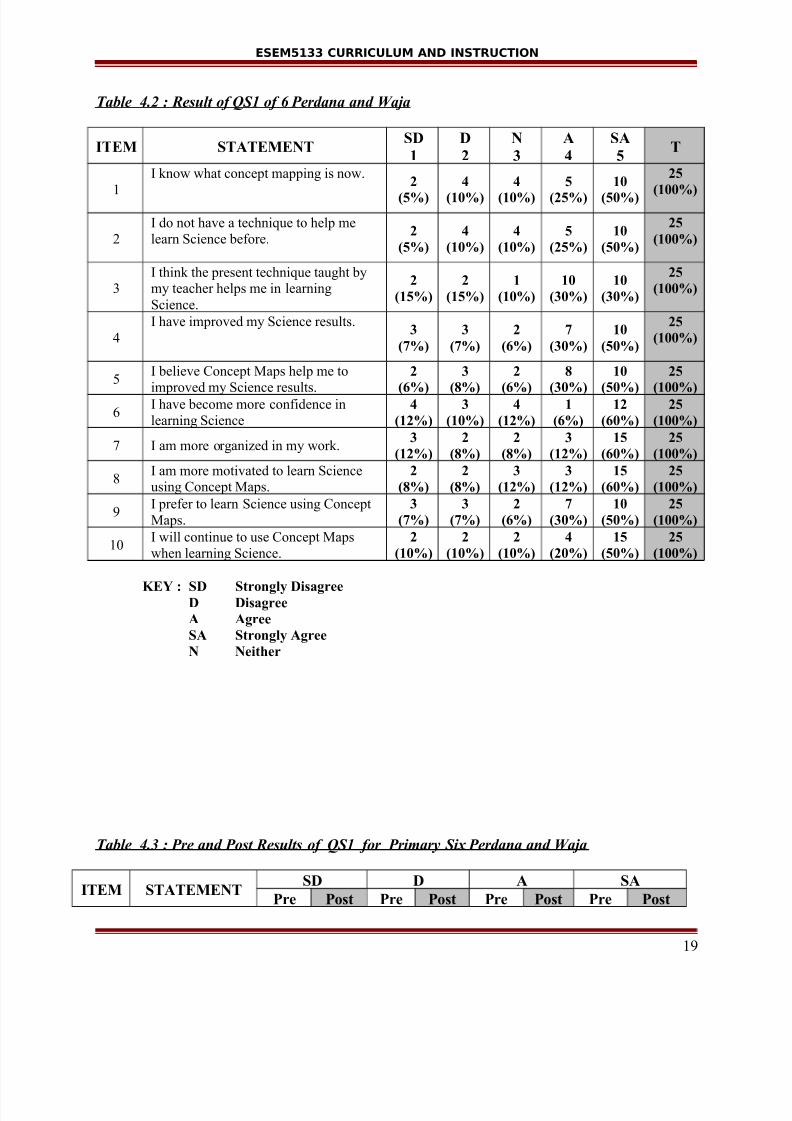
Table 4.2 : Result of QS1 of 6 Perdana and Waja
ITEM STATEMENTSD
1
D
2
N
3
A
4
SA
5T
1
I know what concept mapping is now.2
(5%)
4
(10%)
4
(10%)
5
(25%)
10
(50%)
25
(100%)
2
I do not have a technique to help me
learn Science before.2
(5%)
4
(10%)
4
(10%)
5
(25%)
10
(50%)
25
(100%)
3I think the present technique taught bymy teacher helps me in learning
Science.
2
(15%)
2
(15%)
1
(10%)
10
(30%)
10
(30%)
25
(100%)
4
I have improved my Science results.3
(7%)
3
(7%)
2
(6%)
7
(30%)
10
(50%)
25
(100%)
5I believe Concept Maps help me to
improved my Science results.
2
(6%)
3
(8%)
2
(6%)
8
(30%)
10
(50%)
25
(100%)6
I have become more confidence in
learning Science4
(12%)
3
(10%)
4
(12%)
1
(6%)
12
(60%)
25
(100%)
7 I am more organized in my work.3
(12%)
2
(8%)
2
(8%)
3
(12%)
15
(60%)
25
(100%)
8I am more motivated to learn Scienceusing Concept Maps.
2
(8%)
2
(8%)
3
(12%)
3
(12%)
15
(60%)
25
(100%)
9I prefer to learn Science using Concept
Maps.
3
(7%)
3
(7%)
2
(6%)
7
(30%)
10
(50%)
25
(100%)
10I will continue to use Concept Maps
when learning Science.
2
(10%)
2
(10%)
2
(10%)
4
(20%)
15
(50%)
25
(100%)
KEY : SD Strongly DisagreeD Disagree
A Agree
SA Strongly Agree
N Neither
Table 4.3 : Pre and Post Results of QS1 for Primary Six Perdana and Waja
ITEM STATEMENTSD D A SA
Pre Post Pre Post Pre Post Pre Post
19
7/27/2019 CURRICULUM-INSTRUCTIONAL ISSUE.doc
http://slidepdf.com/reader/full/curriculum-instructional-issuedoc 20/41
ESEM5133 CURRICULUM AND INSTRUCTION
1
I know what
concept mappingis now.
6
(24%)
8
(32%)
5
(20%)
11
(44%)
11
(44%)
4
(16%)
3
(12%)
2
(8%)
2
I do not have atechnique to help
me learn Science before.
3
(12%)
1
(4%)
6
(24%)
4
(16%)
11
(44%)
9
(36%)
5
(20%)
11
(44%)
3
I think the present
technique taught by my teacher
helps me in
learning Science.
6
(24%)
6
(24%)
9
(36%)
11
(44%)
6
(24%)
4
(16%)
4
(16%)
4
(16%)
4
I have improved
my Science
results.
3
(12%)
2
(8%)
6
(24%)
3
(12%)
10
(40%)
13
(52%)
6
(24%)
7
(28%)
5
I believe Concept
Maps help me toimproved my
Science results.
2(8%)
1(4%)
7(28%)
5(20%)
12(48%)
13(52%)
4(16%)
6(24%)
6
I have becomemore confidence
in learning
Science
3
(12%)
1
(4%)
4
(16%)
4
(16%)
13
(52%)
12
(48%)
5
(20%)
8
(32%)
7
I am more
organized in mywork.
3
(12%)
2
(8%)
11
(44%)
9
(36%)
6
(24%)
11
(44%)
5
(20%)
3
(12%)
8
I am more
motivated to learnScience using
Concept Maps.
3(12%)
1(4%)
2(8%)
1(4%)
12(48%)
13(52%)
8(32%)
10(40%)
9
I prefer to learn
Science usingConcept Maps.
3
(12%)
4
(16%)
2
(8%)
3
(12%)
10
(40%)
14
(56%)
10
(40%)
4
(16%)
10
I will continue to
use Concept
Maps whenlearning Science.
3
(12%)
3
(12%)
4
(16%)
3
(12%)
9
(36%)
10
(40%)
9
(36%)
9
(36%)
4.4 Analysis of Pre-Test and Post-Test
A frequency count was first made of students’ performance in each of the two tests (Pre-Test and
Post-Test) and the result are shown.
20

7/27/2019 CURRICULUM-INSTRUCTIONAL ISSUE.doc
http://slidepdf.com/reader/full/curriculum-instructional-issuedoc 21/41
ESEM5133 CURRICULUM AND INSTRUCTION
Table 4.4 : Students’ performance for pre -test
ScorePerdana Waja
Frequency Percentage Frequency Percentage
2019
18 2 8
17 2 8
16 2 8
15 1 4
14 1 4
13 2 8 2 8
12 2 8 3 12
11 2 8 2 8
10 2 8 2 8
9 3 12 2 8
8 2 8 4 16
7 2 8 2 8
6 2 8 2 8
5 2 8
4 2 8
3 2 8
2
1
Table 4.5 : Sstudents’ performance for post -test
Score Perdana Waja
21

7/27/2019 CURRICULUM-INSTRUCTIONAL ISSUE.doc
http://slidepdf.com/reader/full/curriculum-instructional-issuedoc 22/41
ESEM5133 CURRICULUM AND INSTRUCTION
Frequency Percentage Frequency Percentage
20 3 12 1 4
19 2 8
18 3 12 3 12
17 2 8 1 4
16 2 8 8 3215 2 8 2 8
14 3 12 2 8
13 5 20 2 8
12 1 4
11 3 12
10 2 8
9
8 1 4
7 1 4
6 1 4
54
3
2
1
From Table 4.5, we see that the students performed marginally better than in the initial results.
Looking at the overall scores in the post-test, it was observed that they were now equally spread
out and the students outperformed.
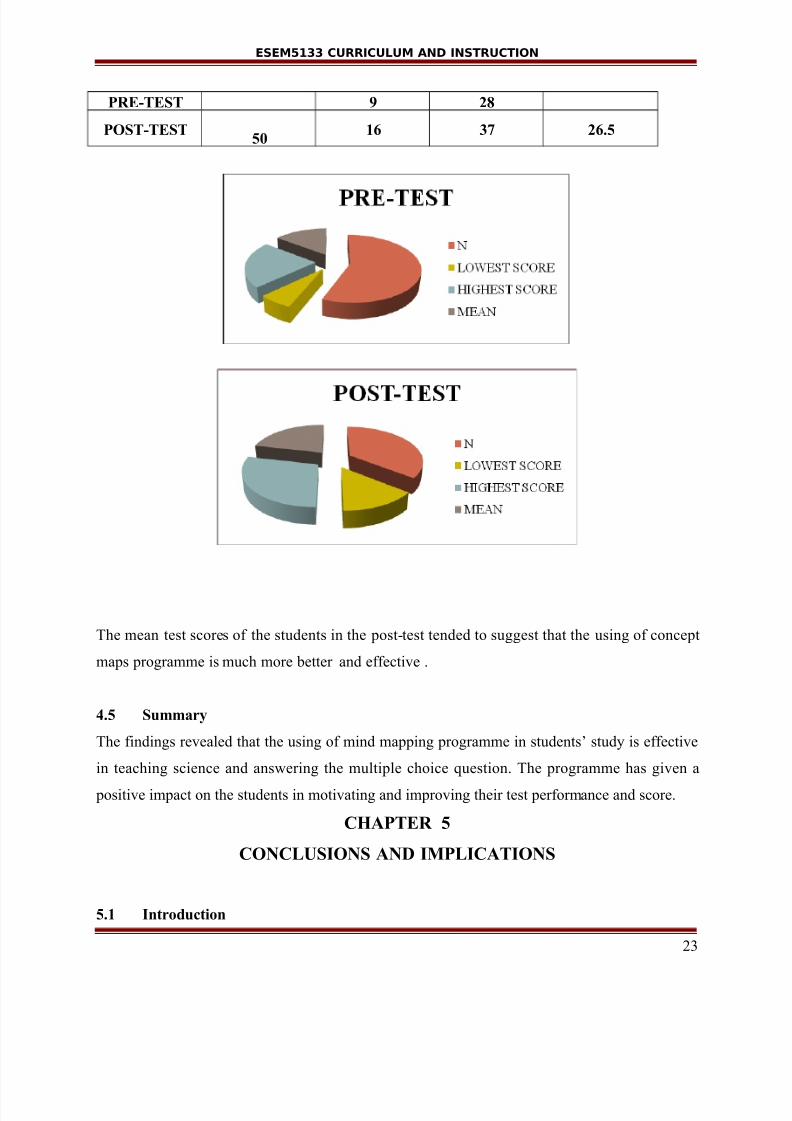
Table 4.6 : Mean Score for the students
N
50
LOWEST
SCORE
HIGHEST
SCORE
MEAN
18.5
22
7/27/2019 CURRICULUM-INSTRUCTIONAL ISSUE.doc
http://slidepdf.com/reader/full/curriculum-instructional-issuedoc 23/41
ESEM5133 CURRICULUM AND INSTRUCTION
PRE-TEST 9 28
POST-TEST50
16 37 26.5
The mean test scores of the students in the post-test tended to suggest that the using of concept
maps programme is much more better and effective .
4.5 Summary
The findings revealed that the using of mind mapping programme in students’ study is effective
in teaching science and answering the multiple choice question. The programme has given a
positive impact on the students in motivating and improving their test performance and score.
CHAPTER 5
CONCLUSIONS AND IMPLICATIONS
5.1 Introduction
23

7/27/2019 CURRICULUM-INSTRUCTIONAL ISSUE.doc
http://slidepdf.com/reader/full/curriculum-instructional-issuedoc 24/41
ESEM5133 CURRICULUM AND INSTRUCTION
This chapter discusses the research result by relating the findings to answer the research
questions. The discussion touched on the research objectives, its implication, the
limitation encountered during the course of this study.
5.2 Research summary
This research verified the effectiveness of using concept mapping in teaching science to
Primary Six students’. The sample for this research was a class of 50 Primary Six
students’ at Sekolah Kebangsaan Penampang.
The research instruments employed for this is a sets of questionnaire, pre-test and post-
test. The questionnaire used in this research was modified and adapted from Robb and
Sausser ( 1989 : 7 ).
It consisted of administering a questionnaire to obtain the students’ background
information and their prior knowledge on concept mapping. There was a pre-test and
post-test to see and to determine the effectiveness of the concept mapping technique in
motivating the students’ to improve the students’ score in their test.
The procedure for data collection employed in this research was mainly through the
questionnaire, pre-test and post-test. The data collected from students was analyzed using
Tables. The analysis determined the reliability of the entire data used through testing for
consistency. It is also used descriptive analysis to determine the frequency distribution of
all the variables deployed in testing of the data.
5.3 Discussion of Research Findings
24

7/27/2019 CURRICULUM-INSTRUCTIONAL ISSUE.doc
http://slidepdf.com/reader/full/curriculum-instructional-issuedoc 25/41
ESEM5133 CURRICULUM AND INSTRUCTION
This research examines the effectiveness of using concept mapping in the teaching of
science subject. In particular, this study has a structure that focuses on the following :
1. To understand the relationship between concept mapping technique applied and
the increase of students’ in generating ideas as an effective means in a pre-test and
post-test to write better subjective answer.
2. To examine whether teaching concept mapping by the teacher enables the
students’ to write better subjective questions.
3. To identify the link between concept mapping that can increase the students’
score in answering subjective questions.
Therefore, this chapter will cover the findings of the research result and the
relationship of concept mapping.
5.3.1 Discussion of the relationship between concept mapping technique applied
and the increase of students’ in generating ideas as an effective means in a
pre-test and post-test to write better subjective answer.
Concept mapping is a powerful tool for linking knowledge and could be a key to
developing strong performance assessments that ought to be designed to generate
both an assessment of how students are applying concepts and to assess the deep
understanding that students are gaining.
According to Plotnick (1997), researchers began to study the concept-mapping
technique in the 1960s based on the theories of Ausubel (1968), concepts. Since
then, concept mapping has been gaining inroads as a tool who stressed the
important role of prior knowledge in learning about new to enhance problem
solving in education.
25

7/27/2019 CURRICULUM-INSTRUCTIONAL ISSUE.doc
http://slidepdf.com/reader/full/curriculum-instructional-issuedoc 26/41
ESEM5133 CURRICULUM AND INSTRUCTION
It is clear from this research that the students’ had an advantage as they had
improved more in their test score through the concept mapping technique.
The students’ perform better in the pre-test where 18 (64 percent) of them scored
10 points and above 7 (out of maximum 20 points) in the test. After conducting
the concept mapping technique, there was a significant contrast whereas the
students’ reaped a better result in the post-test with a stark increase of 100 percent
from the pre-test result. One possible reason for the increased performance was
because the used in this technique by the students’ both in and out of class had
managed to improved students’ score in their test.
5.3.2 Discussion of the relationship whether the using of concept mapping
technique by the teacher enables the students to write and increase the
students’ score in answering subjective questions.
According to Landsberger (2000), many teachers who use concept mapping
technique in the early stages of the writing process found that it can help students
to draw their ideas together in their writing.
This is proven with reference to the difference in the mean score after the test was
conducted. With reference to the difference in means for the pre-test and post-test
on the students essays, it also showed an improvement in their essays. During the
pre-test, the students’ mean score is 18.5 percent which was the lowest score
were 3 points while the highest score were 10 points. After introducing the
concept mapping technique, the mean score in the post-test increased to 26.5
percent which was the lowest score were 10 points and the highest score were 20
points. It was increased 100 percent of the students’ performance.
5.4 Conclusion of the research findings
26
7/27/2019 CURRICULUM-INSTRUCTIONAL ISSUE.doc
http://slidepdf.com/reader/full/curriculum-instructional-issuedoc 27/41
ESEM5133 CURRICULUM AND INSTRUCTION
This research verified the effectiveness of using concept mapping technique by ESL teachers to
help their students in answering subjective question. This is because teachers hardly use concept
mapping to teach essay writing to their students’.
The common problems faced by students when they writing essay are the inability to elaborate
the main idea. Therefore, concept mapping is hoped to be a way to fix it. Concept mapping
technique helps the students’ in their writing by putting ideas to paper and to get their ideas
flowing.
The lists of the research findings are as below ;
1. To understand the relationship between concept mapping technique applied and the
increase of students’ in generating ideas as an effective means in a pre-test and post-test
to write better subjective answer.
This is proven with reference to the students, performance after the introducing of the
concept mapping for item 1, 75 percent of the respondents showed their interest in using
concept mapping.
For item 4,5,6 and 8, most of the respondents indicated that by using concept mapping in
their study, they gained lots of benefits and improved their result in science subject. They
became more motivated in learning science subject and their interest towards the subject
was increased.
For item 9, 80 percent prefer to learn science subject using concept mappings. The
overall results gave the impression that the respondents did have a positive attitude
towards the using of concept mappings technique. This is showed in item 10, which 70
percent of the respondents had indicated agreement (Strongly Agree and Agree) to most
of the items.
27
7/27/2019 CURRICULUM-INSTRUCTIONAL ISSUE.doc
http://slidepdf.com/reader/full/curriculum-instructional-issuedoc 28/41
ESEM5133 CURRICULUM AND INSTRUCTION
2. To examine whether teaching concept mapping by the teacher enables the students’ to
write better and increase the students’ score in answering subjective questions.
This is proven with reference to the students, performance after the introducing of the
concept mapping. The score of the students’ performance was increased especially for the
experimental group of students’ reaped a better result in the post-test with a stark increase
of 100 percent from the pre- test result that is from 4 to 25 students’.
5.5 Implication of research findings
This research has identified that using concept mapping in writing has proven. That
means the effectiveness of using mind mapping to motivate Primary Six students to
perform better in writing was successful.
The findings of the research has proved that the using of concept mapping to students
help them a lot to strengthen their ability to extract the main ideas faster.
Eventhough this research has made the contribution to the knowledge that concept
mapping is useful in writing but it still has its limitations. Firstly, the students with low
proficiency of level should be guided by the teachers. Then, in order to make the students
more independently in concept mapping, they should exposed to variety alternative of
using concept mapping.
5.6 Recommendation of research findings
The field of educational research is expanding and a single researcher is not going to
cover all educational research subject. According to Wiersma (2000), education research
28

7/27/2019 CURRICULUM-INSTRUCTIONAL ISSUE.doc
http://slidepdf.com/reader/full/curriculum-instructional-issuedoc 29/41
ESEM5133 CURRICULUM AND INSTRUCTION
should be viewed as a continuing activity in which each specific project adds to the store
of knowledge or provide solutions to educational problems.
This is certainly a topic that deserves further study. Even given its limitations, this study
has provided many ideas for ways to modify the researcher practices. It seems that
concept mapping can help to stimulate and challenge students to look deeper into their
writing. As a result of this study, a researcher had begun to analyze these concept
mapping to look for misconceptions the students might have had about essay writing.
The researcher also used concept mapping as pre-writing tools to help students plan their
answer in subjective questions. The researcher firmly believes that concept mapping and
other graphic organizers can be used in many ways in the classroom to encourage higher
order thinking and writing.
Further research should consider the need for long term research such as using concept
mapping to produce essays in the form of a guided writing or answering subjective
questions.
5.7 Summary
The research presented provides an investigation into the effectiveness of using
mapping in the teaching and learning of essay writing. According to
29
7/27/2019 CURRICULUM-INSTRUCTIONAL ISSUE.doc
http://slidepdf.com/reader/full/curriculum-instructional-issuedoc 30/41
ESEM5133 CURRICULUM AND INSTRUCTION
Anderson-Inman, Ditson, and Ditson (1999) cite considerable evidence that concept
mapping promotes meaningful learning in science. In science education, concept
mapping has been widely recommended and used in a variety of ways to observe change
in students' understanding of concepts over time, to assess what the learner knows, and to
reveal their unique thought processes. It has been used in evaluation of science
curriculum and instructional activities for promoting conceptual understanding and
positive learner attitudes toward science. When Anderson-Inman, Ditson, and Ditson
(1999) investigated the use of concept mapping as an accommodation strategy for
students with learning difficulties, they found that computer-based concept mapping
assists students who are oriented toward visual learning (or who have difficulty reading
and writing text) to graphically represent what they are learning. Students' graphic
representation of science concepts can be tracked over time, which provides teachers with
a method for monitoring conceptual growth as a function of instruction.
The findings of this research have answered all the hypothesis in this research. Concept
mapping can be conducted to help teachers in teaching the essay writing process in
school to their students.
Concept mapping is flexible, usefull as well as able to help students to be creative and to
think freely during the process of essay writing. By using concept mapping as a pre-
writing activity students are able to produce better essay.
References
Anders, G. & Beech, L.W. (1990). Reading: Mapping for meaning: 70 graphic organizers
for comprehension. Kent, CT: Sniffen Court Books.
30

7/27/2019 CURRICULUM-INSTRUCTIONAL ISSUE.doc
http://slidepdf.com/reader/full/curriculum-instructional-issuedoc 31/41
ESEM5133 CURRICULUM AND INSTRUCTION
Ausubel, D. P. (1968). Educational Psychology: A Cognitive View. New York: Holt, Rinehart
and Winston.
Becker, W. E., and M. Watts. (1995). Teaching tools: Teaching methods in undergraduate social
science. Science Inquiry 33 (October): 692-700.
Bellanca, J. (1990). The cooperative think tank: Graphic organizers to teach thinking in the
cooperative classroom. Arlington Heights, IL: IRI/SkyLight Training and
Publishing, Inc.
Buzan, T. (1983). Use both sides of your brain: New techniques to help you read efficiently,
study effectively, solve problems, remember more, think clearly. New York: E.P.
Claxton, C. S., and P. H. Murrell. (1987). Learning styles: Implications for improving
educational practices (ASHE-ERIC Higher Education Report No. 4). Washington,
D.C.: Association for the Study of Higher Education.
Drapeau, P. (1998). Great teaching with graphic organizers: Lessons and fun-shaped templates
that motivate kids of all learning styles. New York: Scholastic Professional Books.
Fernandez A., Placing, K. (2000) Stage 6:web-based references and resources. Science
Teacher’s Workshop 2000. UniServe Science. [Available]
http://www.science.uniserve.edu.au/.
Fisher, K. M., Faletti, J., Patterson, H., Thornton, R., Lipson, J., & Spring, C. (1990). Computer-
based concept mapping-SemNet software: a tool for describing knowledge networks.
Journal of College Science and Technology, 19, 347-352.
Graphic Organizers concept mapping mind mapping inspiration [Available]
http://www.graphic.org/concept .html
31

7/27/2019 CURRICULUM-INSTRUCTIONAL ISSUE.doc
http://slidepdf.com/reader/full/curriculum-instructional-issuedoc 32/41
ESEM5133 CURRICULUM AND INSTRUCTION
Jegede, O. J., Alaiyemola, F. F., & Okebukola, P. A. O. (1990 ). The effect of concept mapping
on students' anxiety and achievement in biology. Journal of Research in Science
Teaching, 27(10), 950-960.
Lanzing, J.W.A. (1997) The Concept Mapping. [Available]
http://users.edte.utwente.nl/lanzing/cm_home.htm
Lederman, N. G. & Latz, M. S. (1995). Knowledge structures in the preservice teacher: Sources,
development, interactions, and relationships to teaching. Journal of Science Teacher
Education, 6(1), 1-19.
Novak, J. D. (1993). How do we learn our lesson?: Taking students through the process. The
Science Teacher, 60(3), 50-55.
Novak, J.D. (1998). Learning, creating and using knowledge: Concept maps as facilitative tools
in schools and corporations. New Jersey, Lawrence Erlbaum & Associates,
Publishers.
Novak, J. D., & Gowin, D. B. (1984). Learning how to learn. New York: Cambridge University
Press.
Park, S. (1995). Implications of learning strategy research for designing computer-assisted
instruction. Journal of Research on Computing in Education, 25(4), 435-456.
Sarasin, L. C. (1999). Learning styles: Impact in the classroom. Madison, Wise.: Atwood
Tippins, D. J., & Gallard, A. J. (1994). Research on instructional strategies for teaching science.
In D. Gabel (Ed.), Handbook of research on science teaching and learning. NY:
Macmillan.
32

7/27/2019 CURRICULUM-INSTRUCTIONAL ISSUE.doc
http://slidepdf.com/reader/full/curriculum-instructional-issuedoc 33/41
ESEM5133 CURRICULUM AND INSTRUCTION
Weinstein, C. E. & MacDonald, J. D. (1986) Why does a school psychologist need to know about
learning strategies? Journal of School Psychology, 24, 257-265.
Weinstein, C. E. & Mayer, R. E. (1986) The teaching of learning strategies. In M. C. Wittrock
Ed.), Handbook on research in teaching (3rd Edition. pp. 315-327). New York:
Macmillan.
Wheatley, G. H. (1991). Constructivist perspectives on science and mathematics learning.
Science Education. 75 (1), 9-21.
White, R., & Gunstone, R. (1992). Probing understanding. London: The Falmer Press.
Wilkes, L. Cooper, K., & Lewin, J. (1999). Concept mapping: promoting science learning in BN
learners in Australia. The Journal of Continuing Education in Nursing, 30, 37-44.
Anderson-Inman, L., Ditson, L. A., & Ditson, M. T. (1998, June). Computer-based concept
mapping: Promoting meaningful learning in science for students with disabilities.
Information Technology and Disabilities, 5(1–2). Retrieved September 6, 2005, from
http://www.rit.edu/~easi/itd/itdv5n12/article2.htm
Ausubel, D. (1968). Educational psychology: A cognitive view. New York : Holt, Rinehart, and
Winston.
Herl, H. E., Baker, E. L., & Niemi, D. (1996). Construct validation of an approach to modeling
cognitive science structure of U.S. history knowledge. Journal of Educational
Research, 89, 206–218.
Kight, K. S. (1998). Using Inspiration to organize reading and writing . Retrieved September 6,
2005, from http://www.strategictransitions.com/ldarticle.htm
Mintzes, J., Wandersee, J., & Novak, J. (Eds.). (1999). Assessing science understanding . San
Diego: Academic Press.
33

7/27/2019 CURRICULUM-INSTRUCTIONAL ISSUE.doc
http://slidepdf.com/reader/full/curriculum-instructional-issuedoc 34/41
ESEM5133 CURRICULUM AND INSTRUCTION
Novak, J. D. (n.d.). The theory underlying concept maps and how to construct them. Retrieved
September 6, 2005, from http://cmap.coginst.uwf.edu/info/printer.html
Appendix 1
QUESTIONNAIRE 1
Dear students,
34
7/27/2019 CURRICULUM-INSTRUCTIONAL ISSUE.doc
http://slidepdf.com/reader/full/curriculum-instructional-issuedoc 35/41
ESEM5133 CURRICULUM AND INSTRUCTION
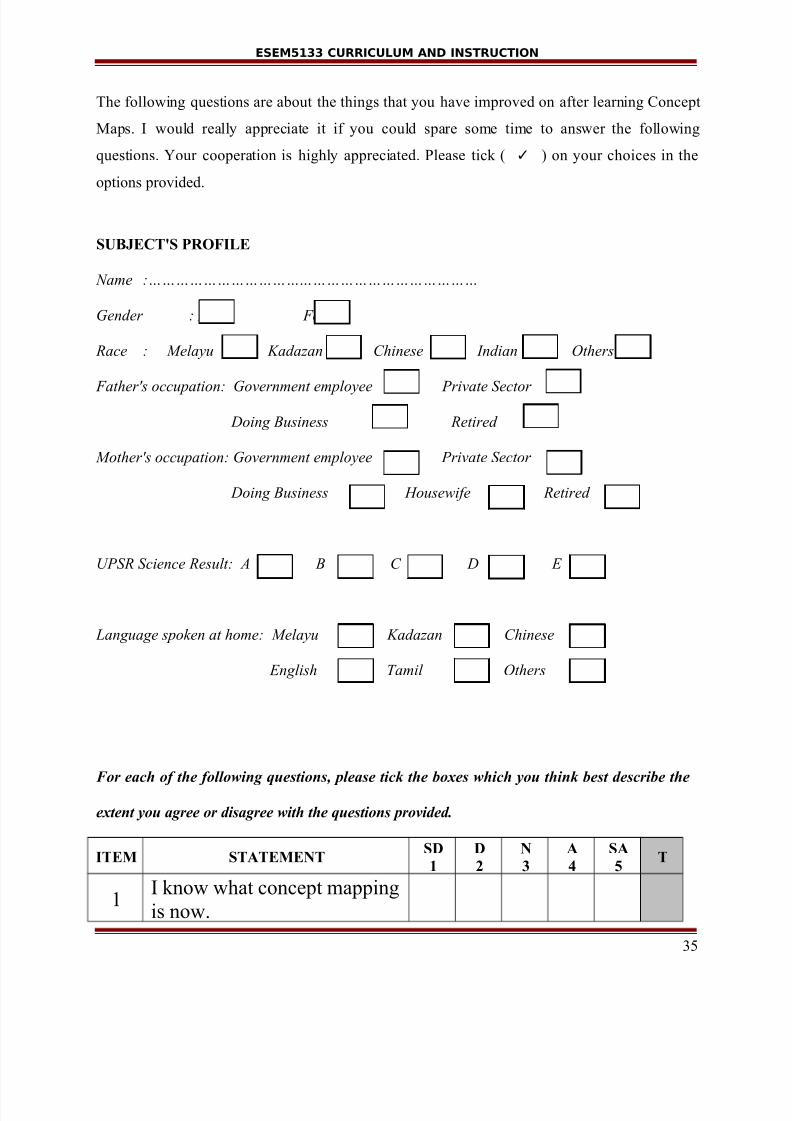
The following questions are about the things that you have improved on after learning Concept
Maps. I would really appreciate it if you could spare some time to answer the following
questions. Your cooperation is highly appreciated. Please tick ( ✓ ) on your choices in the
options provided.
SUBJECT'S PROFILE
Name :………………………………………………………………
Gender : Male Female
Race : Melayu Kadazan Chinese Indian Others
Father's occupation: Government employee Private Sector
Doing Business Retired
Mother's occupation: Government employee Private Sector
Doing Business Housewife Retired
UPSR Science Result: A B C D E
Language spoken at home: Melayu Kadazan Chinese
English Tamil Others
For each of the following questions, please tick the boxes which you think best describe the
extent you agree or disagree with the questions provided.
ITEM STATEMENTSD
1
D
2
N
3
A
4
SA
5T
1I know what concept mapping
is now.
35

7/27/2019 CURRICULUM-INSTRUCTIONAL ISSUE.doc
http://slidepdf.com/reader/full/curriculum-instructional-issuedoc 36/41
ESEM5133 CURRICULUM AND INSTRUCTION
2I do not have a technique to
help me learn Science before.
3
I think the present technique
taught by my teacher helps me
in learning Science.
4I have improved my Science
results.
5
I believe Concept Maps help
me to improved my Science
results.
6
I have become more
confidence in learning
Science
7I am more organized in my
work.
8I am more motivated to learn
Science using Concept Maps.
9I prefer to learn Science using
Concept Maps.
10I will continue to use Concept
Maps when learning Science.KEY : SD Strongly Disagree
D Disagree
A Agree
SA Strongly Agree
N Neither
Appendix 2
PRE-TEST / POST-TEST
Name :……………………………….
36

7/27/2019 CURRICULUM-INSTRUCTIONAL ISSUE.doc
http://slidepdf.com/reader/full/curriculum-instructional-issuedoc 37/41
ESEM5133 CURRICULUM AND INSTRUCTION
Class :………………………………..
Date :………………………………...
Section B
[ 20 Marks ]
Answer all questions.
1. Diagram 1 shows an investigation. Two young rabbits of the same weight are kept in
two cages labelled X and Y.
Diagram 1a) What is the purpose of the investigation?
(1 mark )
b) In this investigation :
i) What to change : ____________________________________ ii) What to keep the same : ____________________________________
( 2 marks )
c) Write one observation from the investigation.
________________________________________________________________
37

7/27/2019 CURRICULUM-INSTRUCTIONAL ISSUE.doc
http://slidepdf.com/reader/full/curriculum-instructional-issuedoc 38/41
ESEM5133 CURRICULUM AND INSTRUCTION
________________________________________________________________
( 1 mark )
d) State one inference based on the observation stated in 1 ( c ).
________________________________________________________________
________________________________________________________________
( 1 mark )
2. Syariman sets up a simple pendulum to find out how the number of swings of the
pendulum in one minute change when the length of the pendulum changes.
The results of investigation are shown in the following table.
Length of thread ( cm ) Number of swings
5 55
10 45
15 35
20 25
Table 1
a) What is the aim of the investigation?
________________________________________________________________ ________________________________________________________________
( 1 mark )
b) Based on the investigation, state the following :
i) What to change : ____________________________________
ii) What to measure : ____________________________________
( 2 marks )
c) State the pattern number of swings.
___________________________________________________________
( 1 mark )
d) Predict the number of swings when the length of thread is 25 cm.
38

7/27/2019 CURRICULUM-INSTRUCTIONAL ISSUE.doc
http://slidepdf.com/reader/full/curriculum-instructional-issuedoc 39/41
ESEM5133 CURRICULUM AND INSTRUCTION
___________________________________________________________
( 1 mark )
3. The diagram below shows the set up of an experiment carried out by a group of
pupils to study the factors that caused the rusting of an iron nail.
Diagram 2a) What is the purpose of the investigation?
________________________________________________________________
________________________________________________________________
( 2 marks )
b) State your observation based on the experiment.
________________________________________________________________
________________________________________________________________
( 1 mark )
c) State one inference based on the observation stated in 3 ( b ).
39
7/27/2019 CURRICULUM-INSTRUCTIONAL ISSUE.doc
http://slidepdf.com/reader/full/curriculum-instructional-issuedoc 40/41
ESEM5133 CURRICULUM AND INSTRUCTION
________________________________________________________________
________________________________________________________________
( 1 mark )
d) What is the conclusion of the investigation?
________________________________________________________________
________________________________________________________________
( 1 mark )
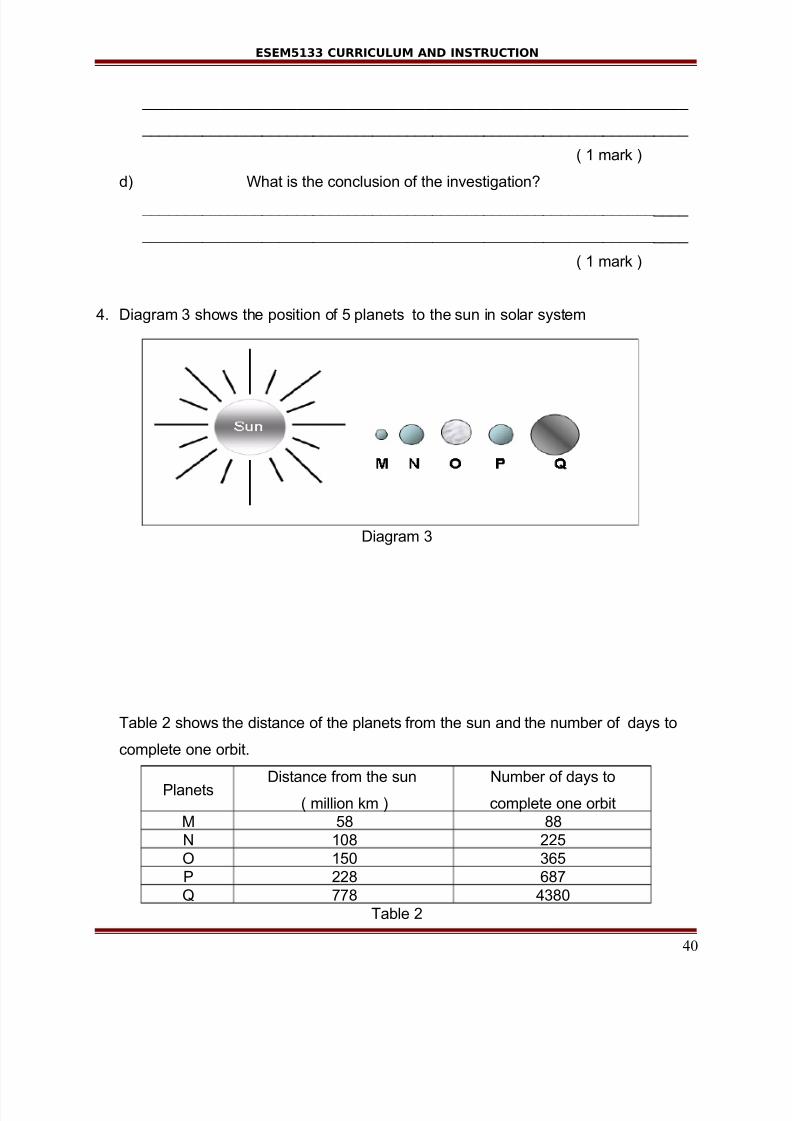
4. Diagram 3 shows the position of 5 planets to the sun in solar system
Diagram 3
Table 2 shows the distance of the planets from the sun and the number of days to
complete one orbit.
PlanetsDistance from the sun
( million km )
Number of days to
complete one orbit
M 58 88
N 108 225
O 150 365
P 228 687
Q 778 4380
Table 2
40

7/27/2019 CURRICULUM-INSTRUCTIONAL ISSUE.doc
http://slidepdf.com/reader/full/curriculum-instructional-issuedoc 41/41
ESEM5133 CURRICULUM AND INSTRUCTION
a) State two informations gathered in this investigation.
________________________________________________________________
________________________________________________________________
( 2 marks )
b) Predict the position of the planet R if the planet takes 500 days to complete one
orbit.
________________________________________________________________
( 1 mark )
c) Suggest one hypothesis from the investigation.
________________________________________________________________
________________________________________________________________
( 1 mark )
d) What conclusion can be made from the information in table 2?
________________________________________________________________
________________________________________________________________ ( 1 mark )
END OF PAPER