current state, opportunities, and economic impact assessment · current state, opportunities, and...
TRANSCRIPT

Market Analysis of Residential Solar in ChileCurrent State, Opportunities, and Economic Impact
Assessment
Nick Barrett, Andrew Dabrowski, Siddhartha Deo, Shoaib
Rahman, Chris Selle
1

Agenda
• Executive Summary
• Approach
• Current State and Opportunities
• Cost/Benefit Analysis
• Final Recommendations
2

Executive Summary
Access more affordable capital
Reduce system cost
No tax incentives
Under current market conditions, residential solar is not economically viable in Chile. Through financial modeling, we analyzed potential paths toward viability through four different drivers that would reduce payback period and increase IRR.
9 year payback
11.8% IRR
5 year payback
24.7% IRR
Methods for valuing the benefits of distributed generation (DG) were
evaluated to help assess a potential increase in the injection tariff
Increase injection tariff
Current StateShort Term
Outlook
3

Our Approach
Preliminary Research
Preliminary Research
Stakeholder Interviews
Stakeholder Interviews
Financial AnalysisFinancial Analysis
Cost/Benefit Analysis
Cost/Benefit Analysis
Findings & Next StepsFindings & Next Steps
• Conduct research
on the Chilean
renewable energy
industry
• Conduct research
on other countries
with well-
established
renewable energy
industries
• Conduct
interviews with
various Chilean
solar energy
stakeholders
• Collect data
documenting: the
costs and
benefits, the rate
of adoption, and
the challenges
and opportunities
of solar energy
• Develop a
financial model
representative of
a typical
residential solar
project
• Adjust model to
evaluate the
impact of various
assumptions
• Identify and
evaluate industry
accepted
methodologies for
quantifying the
costs and benefits
associated with
DG
• Provide sample
calculations for
select benefit and
cost categories
• Compile findings
into a final
presentation and
research paper
• Present to
ACESOL
stakeholders
4

Stakeholder Engagement
5

Current State & Opportunities
6

Current State of Residential Solar PV Market
Economics
Cash Flows
• Residential projects often do not demonstrate attractive returns• Average ~9 year payback is not attractive to Chilean consumers
Financing
• Lack of access to affordable capital limits growth• No solar-specific financing mechanisms have been created yet
7

Current State of Residential Solar PV Market, continued
Technology
& Grid
Consumer
Awareness
Public
Policy
• Current public policy is oriented towards utility scale projects• The “net billing” law was designed to enable grid connection
for DG systems and to foster autoconsumption• Most stakeholders disagree with subsidies, but believe that the
current tariff does not reflect positive externalities of DG
• Growing consumer awareness of solar PV and interest in sustainability
• Consumer expectations are misaligned with market realities
• Grid connection process is cumbersome, discourages growth• No simplified process for smaller systems (e.g. under 10 kW)
8

Financial Model: Drivers and Base Case
Through financial modeling, we analyzed the impact of four financial drivers on the viability of a typical residential solar installation.
Base Case
Equity IRRPayback (years)*
100% 11.8% 9.0
System Installation Costs
Interest Rates
Injected Energy Tariff
Government Subsidies
Base Case: • 3kW system in Santiago• 35% autoconsumption• $2.26 cost per watt
*Undiscounted 9

Sensitivity Analysis – Interest Rates and Installation Costs
Sensitivity of Installation Costs
$/Watt IRR Payback**
$2.26 11.8% 9.0
$2.00 13.4% 8.0
$1.80 14.9% 7.2
$1.60 16.8% 6.4
$1.25 21.3% 5.0
Sensitivity of Interest Rates
Interest Rate* IRR Payback**
20% -6.8% N/A
15% 4.6% 22.0
10% 16.0% 8.0
7% 23.7% 4.9
* Nominal interest rate
** Undiscounted payback
A 5-year payback can only be achieved by independently reducing the interest rate or installation costs to unrealistic levels.
Through financial modeling, we analyzed the impact of varying interest rates and installations costs on the viability of a typical solar installation.
10

Sensitivity of Injection Tariff
% of BT1 IRR Payback*
58.5% 11.8% 9.0
65% 12.5% 8.5
70% 13.0% 8.2
80% 14.1% 7.6
90% 15.2% 7.1
100% 16.3% 6.6
Sensitivity Analysis – Injection Tariff and Tax Credits
Sensitivity of Tax Credits
Tax Credit IRR Payback*
0% 11.8% 9.0
5% 12.4% 8.6
10% 13.0% 8.2
15% 13.8% 7.8
20% 14.6% 7.3
30% 16.5% 6.5
*Undiscounted
Neither increased injection tariff nor increased tax credits independently achieve a 5-year payback.
Chile should pursue a combination of all four drivers to make
residential solar projects viable (5-year payback)
11

International Market Government Incentives
http://www.seia.org/policy/finance-tax/solar-investment-tax-credit
http://www.greentechmedia.com/squared/read/gtm-research-roundtable-the-itc-awakens
https://forms.greentechmedia.com/Extranet/95679/forms.aspx?msgid=98d3410f-c728-
4457-97e9-37d90421067f&LinkID=CH00095679eR00000421AD&Source=sidebar
• Federal Tax Credits• Full Net Metering in most US states• Other incentives include federal grants and state/local tax
credits
United States
• FITs compensate distributed generators at a 20-year fixed rate for electricity injected into the grid
• Low cost per wattGermany
• Starting February 2016, Colombia provides significant tax incentives for renewable energy projects (i.e. 50% of the investment can be deducted from an individual’s tax burden over 5 years)
Colombia
12

Potential Impact of US Incentives in Chile
To model incentives similar to those in the US, we adjusted our baseline model to reflect a 30% tax deduction and full net metering.
$(10,000)
$(5,000)
$-
$5,000
$10,000
$15,000
$20,000
$25,000
$30,000
$35,000
$40,000
1 2 3 4 5 6 7 8 9 10 11 12 13 14 15 16 17 18 19 20 21 22 23 24 25 26 27 28 29 30 31
Cumulative Cash Flows
Financial Viability with US Incentives
IRR Payback (years)*
22.6% 4.7
*Undiscounted 13

Potential Near- to Mid- Term Outlook
*Undiscounted
Ideal Case
IRR Payback (years)*
24.7% 5.0
The following conditions are realistic possibilities in the next 2-3 years.
Reduce installation costs
to $1.83 per watt
Increase injection tariff to
include VAT (69.7%)
Financing option at 12%
interest rate
No government
tax incentives
14
Base Case: • 3kW system in Santiago• 35% autoconsumption• 80/20 Debt to Equity ratio

Reducing System Installation Costs
• Overall, stakeholders expressed that cost is a barrier to adoption• At the same time, Chile’s residential solar installation costs are lower
than other mature markets like the US
Sources: http://www.nrel.gov/docs/fy15osti/64746.pdf
http://www.greentechmedia.com/articles/read/solar-pv-module-price-reach-57-cents-per-watt-in-2015-
continue-to-fall-thro
http://www.sciencedirect.com/science/article/pii/S0960148115303384
*Chile and US costs are from 2015; Germany, Austria, and Switzerland are 2014.
$-
$0.50
$1.00
$1.50
$2.00
$2.50
$3.00
$3.50
$4.00
China Germany Chile US Switzerland Austria
Residential Solar: Cost/Watt (USD)
15

Reducing System Installation Costs, continued
• While soft costs in Chile are significantly less than in the US, opportunities still exist to reduce these costs through:
• Economies of learning• Fast-track connection
process to the grid• Global markets for modules are
also expected to continue to mature which will drive down hard costs
Sources: http://www.nrel.gov/docs/fy15osti/64746.pdf
http://www.greentechmedia.com/articles/read/solar-pv-module-price-reach-57-cents-per-watt-in-2015-
continue-to-fall-thro
Total System Costs ($/Watt)
Chile US
Hard Costs 1.58 1.40
Soft Costs 0.68 1.69
Total 2.26 3.09
16

Financing Mechanisms & Decreasing Borrowing Costs
Introducing new financing mechanisms will help reduce borrowing costs and incentivize growth.
Potential Timeline of Financing Mechanisms:
Consumer loans (r = 20-30%)
Energy efficiencymortgages(r = 6-8%)
Solar loans (r = 5-10%)
Solar leasing
Capital markets (i.e. ABS, Yieldco)Short
TermLong Term
17

Developing Financing Mechanisms
Affordable Capital
Capital Markets
• Asset-Backed Securities• Yieldcos
Financial Sector
• Educate banks• Develop partnerships
with banks
Government Support
• Solar loan guarantees• Soft credit loans• PACE
18
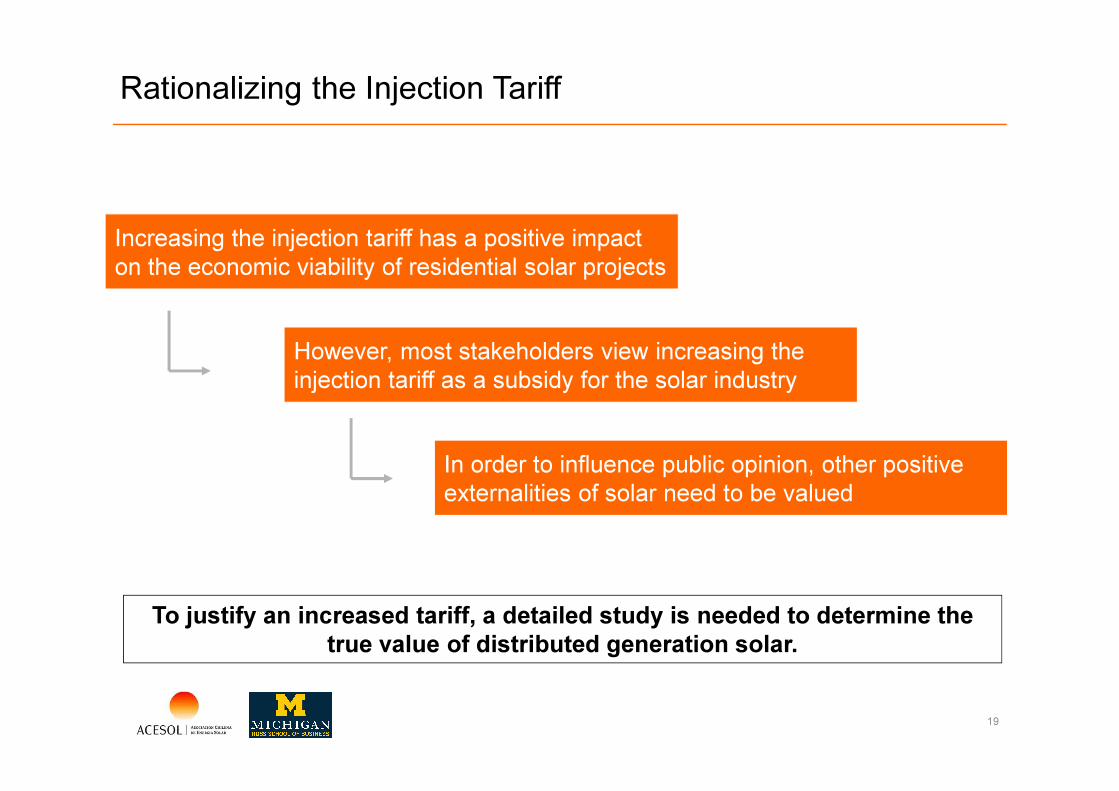
Rationalizing the Injection Tariff
To justify an increased tariff, a detailed study is needed to determine the true value of distributed generation solar.
In order to influence public opinion, other positive externalities of solar need to be valued
Increasing the injection tariff has a positive impact on the economic viability of residential solar projects
However, most stakeholders view increasing the injection tariff as a subsidy for the solar industry
19

Costs and Benefits of
Residential Solar
20

Assessing Costs & Benefits of Residential Solar
1. Identify methodologies for valuing distributed generation solar
1. Identify methodologies for valuing distributed generation solar
2. Evaluate applicability of methodologies to the Chilean solar industry
2. Evaluate applicability of methodologies to the Chilean solar industry
3. Provide sample calculations for select benefit and cost categories
3. Provide sample calculations for select benefit and cost categories
21

Benefits Categories
Energy
• Energy
• System Losses
Capacity
• Generation Capacity
• Transmission & Distribution Capacity
Grid Support Services
• Reactive Supply & Voltage Control
• Regulation & Frequency Response
• Energy & Generator Imbalance
• Synchronized & Supplemental Operating Reserves
• Scheduling, Forecasting, and System Control & Dispatch
Financial Risk
• Full Price Hedge
• Market Price Response
Security Risk
• Reliability & Resilience
Environmental
• Carbon Emissions
• Criteria Air Pollutants (SO2, NO2, PM)
• Water
• Land
Social
• Economic Development (Jobs and Tax Revenues)
Grid
Services
Financial
Security
Environmental
Social
Source: http://www.rmi.org/elab_empower22

International Studies of the Value of Distributed Generation
Source: http://www.rmi.org/elab_empower
13 out of 16 international studies value solar at a higher amount per kWH than the current Chilean injection tariff and 8 out of 16 studies value solar at a higher amount per kWH than the current BT1 rate.
23

Value of Distributed Generation by Component
Compared to calculated values from the US, Chilean benefits range from the low to the high end of the spectrum depending on market conditions.
Minimum Average Maximum
-$0.05 $- $0.05 $0.10 $0.15
(Costs of Solar Integration)
Social/Economic DevelopmentValue
Avoided EnvironmentalCompliance Costs
Grid Resiliency
Reduced Financial Risks andElectricity Prices
Benefits Not Yet Calculated
$- $0.05 $0.10 $0.15
Other
Avoided Emission Costs
Avoided Capacity Costs
Avoided Energy Costs
Calculated Benefits
~ $0.093
~ $0.048 - $0.069
~ $0.011
~ $0.018
24

Next Steps to Determine Value of Solar in Chile
Validate• Review and evaluate recommended methodology
Calculate
• Validate current assumptions for monetized values
• Collect Chile-specific data to calculate non-monetized costs/benefits
Implement• Use the results to inform policy debate regarding
support of solar PV DG
25

Final Recommendations
26

Final Recommendations
Create New
Financing
Mechanisms
Drive Consumer
Awareness
Evaluate the Value
of Solar on the Grid
Streamline
Enrollment Process
• Continue roadshows and
develop educational tools to
drive awareness
• Utilize the methodologies
outlined in the report to
determine the value of solar
• Simplify the process for
small installations (i.e. <10
kW)
• Educate the financial
services industry on solar
• Realign consumer
expectations to the
economic realities of solar
• Gain input from distribution
companies and the SEC to
validate key inputs
• Create an online process to
reduce issues related to
processing errors
• Encourage the creation of
new financing mechanisms
27

Q&A
28

Appendix
29

Economics
30

Financing – Current State
• No well-established financing products currently exist• No mechanism for rolling solar projects into other loan products
(i.e. mortgages)• In some cases, solar companies are using their own capital and
foreign investments to provide financing for residential consumers
FinancialProducts
• Banks are unfamiliar with the solar industry and view solar investments as risky
• Residential solar projects are often unable to demonstrate positive, guaranteed returns
Risk
• Personal loans are one of the only available financing options for residential solar, but these come with 20+% interest rates
• Businesses with revolving credit lines have interest rates of ~14%, and investing in solar takes capital away from core firm operations
High Cost of Capital
31
NB [8]1NB [2] [2]1NB [3] [2]1NB [4] [2]1

Slide 31
NB [8]1 How does this compare to other countries/states?Nick Barrett; 04/04/16
NB [2] [2]1 UF plus 4 or 5. That's the actual cost of capital for real estate projects.Nick Barrett; 04/04/16
NB [3] [2]1 There are no specific tools for this industry, but the cost of capital for mortgages or real estate projects is much larger.Nick Barrett; 04/04/16
NB [4] [2]1 But large PV installations plus 5.Nick Barrett; 04/04/16

Financing – Opportunities
• The industry should explore options to roll solar projects into existing loan products (e.g. mortgages)
• Other financing mechanisms like solar leasing should also be explored to reduce the initial investment/risk by consumers
FinancialProducts
• Residential solar developers need to focus on demonstrating consistent cash flows and attractive returns
• Banks should be educated on solar projects to better enable them to develop financing products tailored to the solar industry
Risk
• Solar developers should seek other sources of capital; external, international investors may be able to provide much more attractive costs of capital
• Chilean government could provide capital or guarantees that encourage the development of financial products
High Cost of Capital
32

International Financing Mechanisms
Consumer Loans
• Unsecured loan
• Accessible through standard bank
• Interest rates range from 20-30%
Energy Efficiency Mortgages
• Homeowners can borrow up to 5% of home value for energy efficient improvements
• Loan is rolled into mortgage at purchase of new home or requires refinancing of existing mortgage
• Insured by the US government
Solar Leasing & PPA
• Fixed monthly payment for leasing or fixed rate for PPA
• 20 year terms
• Annual rate increase of 1-3%
• No upfront costs for consumer
• Expect 20-30% savings compared to utility electric costs
• Examples: sunrun, SolarCity
Solar Loan
• Loans provided by both private financial institutions and the government
• Secured and unsecured
• Examples:
• Home Equity Loan – borrow against equity built in home (r = 3.5-5.5%)
• Renovate America - partners with municipalities to collect payment through property taxes
• FHA PowerSaver Loans
• Secured - $25,000 limit, r = 5-10%
• Unsecured - $7,500 limit, r = 5-7.5%
33

System Installation Costs – Current State
• At an average of $2.22/watt, residential solar installations in Chile are on par with other competitive international solar markets (e.g. the US)
• There exists no in-country manufacturer of modules, requiring imports; purchasing through wholesalers also drives up costs
Installation Costs
• Companies that can realize scale (e.g. purchase full containers of panels) are able to lower their costs
AchievingScale
• Soft costs (e.g. installation and labor) are 30% of total costs and are already significantly lower than other countries
• Sales/customer acquisition costs are high, but required for residential solar
Soft Costs
34

System Installation Costs – Opportunities
• Companies that can import supplies on their own and avoid using a wholesaler significantly lower costs
Installation Costs
• Developers should look to realize scale through partnerships (both in-country and with international partners)
AchievingScale
• Even though soft costs are lower in Chile than other developed markets, opportunities still exist for lowering soft costs as economies of learning are realized
Soft Costs
35

Net Metering Tariff – Current State
• The current BT1 tariff for excess energy does not sufficiently incentivize residential consumer to invest in solar projects
Tariff for Residential
Projects
• Payback period for average Chilean consumers is approximately 9 years.
• Most stakeholders agree that to make this investment palatable for Chilean consumer, this would need to be reduced to ~5 years.
RequiredPayback
• Most stakeholders disagree with subsidies, but believe that the current tariff does not reflect other positive externalities of DGSubsidies
36

Net Metering Tariff – Opportunities
• Chile could adjust the tariff to match that of other countries (e.g. full net metering).
Tariff for Residential
Projects
• Chile could adjust the tariff to incorporate other positive externalities associated with distributed generationSubsidies
37

International Market Government Incentives
http://www.seia.org/policy/finance-tax/solar-investment-tax-credit
http://www.greentechmedia.com/squared/read/gtm-research-roundtable-the-itc-awakens
https://forms.greentechmedia.com/Extranet/95679/forms.aspx?msgid=98d3410f-c728-
4457-97e9-37d90421067f&LinkID=CH00095679eR00000421AD&Source=sidebar
• Federal Tax Credits
• 30% of the amount invested in the solar project can be deducted directly from the owner/developer’s tax liability
• Any unused credit can be rolled over into the following year(s)
• This program was extended through 2019, then ramps down through 2022
• Full Net Metering in most US states
• Other incentives include federal grants and state/local tax credits
United States
• FITs compensate distributed generators at a 20-year fixed rate for electricity injected into the grid
• The distribution company buys excess energy at the established rate and sells this to the wholesale market
• Any difference between the FIT and the wholesale market rate is paid for by consumers in the form of a levy
• Exemptions of this levy are given to some commercial/industrial consumers in targeted trade areas
Germany
• Starting February 2016, Colombia provides significant tax incentives for renewable energy project:
• 50% of the investment can be deducted from an individual’s tax burden over 5 years
• Renewable energy assets can take advantage of accelerated depreciation
• Sales tax will not be levied on renewable energy project materials
• Materials will also be exempt from import tariffs
Colombia
38

Government Incentives – United States
The United States employs a variety of incentive programs focused on solar PV. The primary drivers are:
• Federal Tax Creditso 30% of the amount invested
in the solar project can be deducted directly from the owner/developer’s tax liability
o Any unused credit can be rolled over into the following year(s)
o This program was extended through 2019, then ramps down through 2022
• Full Net Metering in most US states
• Other incentives include federal grants and state/local tax credits
http://www.seia.org/policy/finance-tax/solar-investment-tax-credit
http://www.greentechmedia.com/squared/read/gtm-research-roundtable-the-itc-awakens
https://forms.greentechmedia.com/Extranet/95679/forms.aspx?msgid=98d3410f-c728-
4457-97e9-37d90421067f&LinkID=CH00095679eR00000421AD&Source=sidebar
Annual US Solar PV Installations, 2000-2015
39

Government Incentives – Germany
Germany’s incentive program is primarily based on feed-in-tariffs (FITs).
• FITs compensate distributed generators at a 20-year fixed rate for electricity injected into the grid
• The distribution company buys excess energy at the established rate and sells this to the wholesale market
• Any difference between the FIT and the wholesale market rate is paid for by consumers in the form of a levy
• Exemptions of this levy are given to some commercial/industrial consumers in targeted trade areas
http://www.seia.org/research-resources/solar-energy-support-germany-closer-look
https://www.ise.fraunhofer.de/en/publications/veroeffentlichungen-pdf-dateien-en/studien-und-
konzeptpapiere/recent-facts-about-photovoltaics-in-germany.pdf
40

Potential Impact of German Incentives in Chile
To model incentives similar to those in the Germany, we adjusted our baseline model to incorporate a feed-in tariff* for injected energy.
Financial Viability with German FIT
NPV IRR Payback
$12,652 27% 3.9
*As of October 2015, the German feed-in tariff was approximately 350% of
the German energy spot prices, thus the feed-in tariff used in the model is
350% of the Chilean spot price.
$(20,000)
$(10,000)
$-
$10,000
$20,000
$30,000
$40,000
$50,000
$60,000
$70,000
1 2 3 4 5 6 7 8 9 10 11 12 13 14 15 16 17 18 19 20 21 22 23 24 25 26 27 28 29 30 31
Cumulative Cash Flows
41

Government Incentives – Colombia
Starting February 2016, Colombia provides significant tax incentives for renewable energy project: • 50% of the investment can be deducted from an individual’s tax burden over 5 years• Renewable energy assets can take advantage of accelerated depreciation• Sales tax will not be levied on renewable energy project materials• Materials will also be exempt from import tariffs
http://www.seia.org/research-resources/solar-energy-support-germany-closer-look
http://www.enerdata.net/enerdatauk/press-and-publication/energy-news-001/colombia-introduces-
fiscal-incentives-renewables-2016_34900.html
42

Cost Breakdown for US Residential Solar
http://www.nrel.gov/docs/fy15osti/64746.pdf 43

Consumer Awareness
44

Consumer Awareness – Current State
• Due to construction of large solar plants in the north of Chile, the average consumer is generally aware of solar energy.
Overall Awareness
• Chileans are sustainably-minded and supportive of renewable energy.
Support for Solar
• The Ministry of Energy has done some preliminary consumer educations, but developers often take on the majority of consumer education.
Consumer Education
• Consumers that proactively express interest in solar often have unrealistic expectations of solar energy (e.g. solar will completely offset their energy consumption)
Misaligned Expectations
45

Consumer Awareness – Opportunities
• The Chilean government could conduct a marketing campaign focused on solar and sustainability in the home.
Overall Awareness
• CIFES tools for consumers need to be more robust, including how to choose and installer, what are the expected benefits, etc.
• ACESOL could also develop educational/marketing materials for developers
• ACESOL could conduct a marketing analysis to identify attractive consumers
• Education should focus on setting reasonable expectations for solar energy
Consumer Education
46

Public Policy
47

Government Assistance – Current State
• The Chilean “net billing” law was designed to enable grid connection for DG systems
• The goal of the bill was to foster auto-consumption. • The law was not designed to subsidize distributed generation
systems.
The “Net Billing” Law
• Chileans are sustainably-minded and supportive of renewable energy.
Tariff for Injection
• Overall, Chilean policy is against outright subsidies. Support for Subsidies
48

Government Assistance – Opportunities
Other countries have adopted policy that fosters development in DG:• The US uses federal tax credits and in some cases
state/local tax credits and incentives to offset the cost of DG systems
• Germany uses a feed-in tariff (a long-term PPA) to stabilize the forecasted revenue of the DG system
Incentive Programs
49

Net Billing Enrollment Process – Current State
• The Chilean “net billing” law lays out a detailed process for approving DG systems to inject into the grid.
• Many stakeholder agree that the process is clear and straightforward.
• However, completing each step in the process is cumbersome, often requiring detailed and expensive engineering diagrams.
• The process is very time consuming, taking between 3 and 6 months to complete.
• Moreover, there exists no simplified process for smaller systems (e.g. under 3 kW)
“Net Billing” Enrollment
Process
50

Net Billing Enrollment Process – Opportunities
• The enrollment/approval forms could be made available online.
• The process should be simplified for smaller projects, which do not heavily impact the grid and are generally low-risk.
• Distribution companies should be held to the timelines included in the law.
“Net Billing” Enrollment
Process
51

Grid/Technology
52

Consumer Consumption Data – Current State
• Consumption history is not available at a detailed enough level (“node” or transformer level instead of the individual household/interval level)
Consumer Consumption
History
• Forecasts of consumer savings must be driven off of generic consumer profiles
• Profitability and competitiveness of PPA agreements with consumers cannot be determined due to inaccurate financial modeling
Impact on Financial
Forecasting
53

Consumer Consumption Data – Opportunities
• Developers and financing company will require a greater level of transparency to accurately forecast consumer savings
Transparency in
Consumption
• As smart meter technology is implemented in Chile, consumers should be provided access to their detailed consumption history.
• Developers and financing companies can use this history to more accurately forecast consumer savings.
Smart Meters
54

Limits to Installed Capacity – Current State
• Approximately 8 MW in additional theoretical capacity left before major grid investments are required
• Using current rate of requests, major grid investments will be required in the short to mid-term
Capacity Limitations
• No plan set in place to make additional investments
Plan for Additional
Investments
55

Limits to Installed Capacity – Opportunities
• Evaluate the point at which capacity limitations will be met
and grid investments will need to occurCapacity
Limitations
• Determine who will own future grid investments and how such investments will be financed
Plan for Additional
Investments
56

Financial Impact of System Installation Costs
• According to interviewed stakeholders, the average Chilean consumer requires a payback period less than 5 years
• Total installation costs would have to drop below $1.25/Watt to meet this requirement
Impact of System Installation Costs on Project Financials
Cost per Watt(100% Equity, r =10%)
NPV IRRUndiscounted
Payback (years)Discounted
Payback (years)
$2.22 $1,550 12.3% 8.6 17.6
$2.00 $2,291 13.8% 7.8 14.3
$1.80 $2,965 15.3% 7.0 11.8
$1.60 $3,639 17.3% 6.2 9.8
$1.25 $4,818 21.9% 4.9 6.9
57

Financial Impact of High Borrowing Costs
Interest rates offered by banks must be lowered from current rates in order to become economically viable for consumers
Impact of Interest Rate on Project Financials
Discount Rate(100% Equity)
NPV IRRUndiscounted
Payback (years)Discounted
Payback (years)
10% $1,550 12.3% 8.6 17.6 Interest Rate
(80/20 Debt to Equity)NPV IRR
Undiscounted Payback (years)
Discounted Payback (years)
8% $2,417 23.4% 5.0 6.9
10% $1,550 18.1% 6.9 10.5
15% $3 10.0% 13.8 29.9
20% $-3,210 -4.1% N/A N/A
58
NB [7] [2] [2]1

Slide 58
NB [7] [2] [2]1 Undercounted Payback and IRRNick Barrett; 04/04/16

Financial Impact of Net Metering Tariff
Simply raising the BT1 Tariff is not enough to reach a 5 year payback period with a cost of $2.22/Watt
Impact of Net Metering Tariff on Project Financials
BT1(100% Equity, r = 10%)
NPV IRRUndiscounted
Payback (years)Discounted
Payback (years)
58.5% $1,550 12.3% 8.6 17.6
65% $2,015 13.0% 8.2 15.9
70% $2,376 13.5% 7.9 14.7
80% $3,097 14.6% 7.4 12.9
90% $3,818 15.6% 6.9 11.5
59

Financial Impact of Government Assistance: Tax Credits
With a 30% tax credit similar to the US, the undiscounted payback period drops by 2.4 years
Impact of Tax Credit on Project Financials
Tax Credit(100% Equity, r =10%)
NPV IRRUndiscounted
Payback (years)Discounted
Payback (years)
0% $1,550 12.3% 8.6 17.6
5% $1,883 13.0% 8.2 16.0
10% $2,216 13.7% 7.8 14.5
15% $2,549 14.4% 7.4 13.1
20% $2,882 15.3% 7.0 11.9
60

Cost/Benefit Analysis
61

Value of Distributed Generation: Energy
• Benefit from Solar PV DG:
• Solar PV DG is able to reduce the marginal cost of producing additional units of energy
• This metric includes all variable costs (fuel, operating expenses, etc) for producing equivalent units of energy
• Methodology:
• Calculated annual kWh production for the system and then multiplied this by the energy price derived from the tariff schedule for Santiago
• The price of energy was assumed to grow at the rate of inflation over the period of analysis
• These peso values were discounted back at the utility discount rate of 10.03%, summed, and then divided by total kW hours produced to arrive at the final figure
62

Value of Distributed Generation: Generation Capacity
• Benefit from Solar PV DG:
• Solar PV DG contributes to deferral or avoiding the need for additional generation capacity investment by utilities to meet additional demand
• The avoided cost of the marginal capacity resource (Combustion Turbines (CT)-least cost source of new utility-scale capacity) represents this value from Solar PV
• Value will change with increasing level of Solar PV penetration
• Methodology (Src: CrossBorderEnergy for Arizona Public Service):
• Looked at the Combustion Turbine Capital Cost ($/kW) and used utility discount rate to arrive at the levelized avoided generation capacity investment ($/kW/Year).
• This levelized avoided generation capacity investment is then multiplied by ELCC of the plant and divided by the annualized solar production (kWH/kW) to arrive at the Avoided Generation Capacity Investment ($/kWH)
63

Value of Distributed Generation: T&D Capacity
• Benefit from Solar PV DG:
• Solar PV is able to meet demand locally, thereby relieving grid of capacity constraints and in turn leads to deferral of need to invest in T&D infrastructure such as substations and lines
• Costs from Solar PV DG:
• At significantly high levels of Solar PV Penetration additional T&D investment could be required if amount of solar production exceeds the demand in the local area and hence needs additional line capacity
• Methodology (Src: CrossBorderEnergy for Arizona Public Service):
• Reviewed the T&D costs per kW increase in peak demand that can be avoided by using Solar PV DG and then used the utility discount rate to arrive at levelizedAvoided T&D Capacity Investment ($ per kW-Year).
• This levelized Avoided T&D Capacity Investment is then multiplied by the ELCC of the plant and divided by the annualized solar production (kWH/kW) to arrive at the Avoided T&D Capacity Investment ($/kWH).
64

Value of Distributed Generation: Grid Support Services
• Benefit from Solar PV DG:
• Grid support services include: reactive supply and voltage control, regulation and frequency response, energy and generator imbalance, synchronized and supplemental operating reserves, scheduling, forecasting, and system control/dispatch (RMI, 2013).
• Avoided supplemental and operating reserves represent the most notable and most easily quantified grid support benefit.
• Methodology (Src: NREL, 2008):
• The required percent supplemental operating reserve was determined (based on government regulations). This value is 7% in the United States, and was assumed to be the same in Chile.
• The avoided cost of energy (calculated elsewhere in our analysis) was multiplied by this percentage value to calculate the avoided supplemental and operating reserves cost.
• All other grid support services are left uncalculated.
65

Value of Distributed Generation: Financial Risk
• Benefit from Solar PV DG:
• To offset risk from fluctuating energy prices, utilities hedge their exposure through energy derivatives. This is most commonly accomplished through natural gas futures. The cost of this hedge can be calculated as a benefit of solar energy because solar reduces the amount of hedging required.
• Methodology (Src: Maine PUC, 2015):
• The average cost to hedge 1 kWh of natural gas over the next 25 years (monthly) was computed by comparing the future energy payment discounted by the utility’s cost of capital vs the risk free rate. The difference represents the sacrificed opportunity cost incurred by the utility because it made up-front payments for energy futures. This value was levelized using the risk free rate.
66

Value of Distributed Generation: Security Risk
• Benefits from Solar PV DG:
• Distributed Generation can help improve the overall security and reliability of Chile’s electricity grid through three primary factors:
• The benefit to provide electricity to residential customers during power outages due to technical failures or rolling blackouts
• Increased ability to provide electricity to customers during power outages caused by extreme weather events or natural disasters
• Reduction in congestion on transmission lines that may contribute to technical failures
• Although the Chilean electricity grid has proved resilient and adaptive, the country remains exposed to extreme weather events, ranking among the highest in the world based on the World Risk Index
• Methodology
• Quantifying this value is difficult and highly sensitive to assumptions – more work is needed to accurately monetize this benefit category
67

Value of Distributed Generation: Environment and Health
• Benefit from Solar PV DG:
• The Chilean grid relies heavily on fossil fuels. Burning such fuels releases CO2,
SO2, NO
x, ammonia, methane, and products of incomplete combustion (PICs),
which are harmful both to the environment and human health.
• Solar energy releases no emissions, and hence avoids negative environmental and health problems. This can be valued monetarily.
• Methodology (Src: Shindell, 2015):
• The “Social Cost of Atmospheric Release” (SCAR) model was consulted, which assigned dollar values to coal, natural gas, and diesel emissions.
• The Chilean energy mix (percent composition) was obtained (IAEA, 2013).
• Renewable energy was assumed to have zero emissions (in monetary terms).
• A weighted average cost of emissions was computed for the Chilean electricity grid using the dollar values from SCAR as well as $0 for renewables.
68

Value of Distributed Generation: Social
• Benefit from Solar PV DG:
• Social Value from Solar PV DG is associated with creation of additional jobs leading to reduced unemployment rate, higher tax revenue, and increased confidence for business development
• Tax revenue enhancement as a metric can be used to quantify Social Value
• Methodology (Src: CPR NJ and PA):
• Taking the capital costs of Solar PV and Combustion Turbines, calculate the net local-jobs traceable between PV and CCGT ($ per KWH in year 1)
• Using a levelizing factor, calculate the net local jobs-traceable amount per generated PV KWH over the lifetime of PV panel ($/KWH)
• Assuming an average salary to arrive at tax bracket, apply indirect job multiplier to calculate the tax collection increase ($ / KWH)
• As per this study, the value ranged from 4.2-4.5 cents per KWH (2012$) accounting for ~15.0% of total benefit from Solar PV
69

Sample Calculation – Avoided Energy Costs
• Quantifies the benefit of the energy produced by distributed solar
• Standard methodology is to estimate lifetime production of a distributed solar installation, then multiply annual production by the Local Marginal Price of electricity
• These values are then discounted to present value, summed, and divided by total lifetime production to arrive at a kW/Hour figure
∑���������� ���� � �������� ���������
�1 � ���
∑ ���������� ������
• Based on the method described above, our estimate for this value in Santiago is CLP $32.56 per kilowatt hour of installed capacity
Discount rate of 10% based on average WACC of Chilean utility industry.70