funding and investment opportunities in current …. a k kinra.pdf · funding and investment...
TRANSCRIPT
Funding and Investment Opportunities Funding and Investment Opportunities in in
Current Economic EnvironmentCurrent Economic Environment
February 11, 2011
Presented By
A.K. KINRA
Finance Director
JK Tyre & Industries Ltd.
� Indian Economy Overview
� Economic Growth
� Interest Rate & Inflation
� Financial Markets Overview
� Financing Options
Contents
� Financing Options
� Potential Investment Oppurtunities
� 2011: Challenges
2
Indian Economy Overview
3
Economic growth
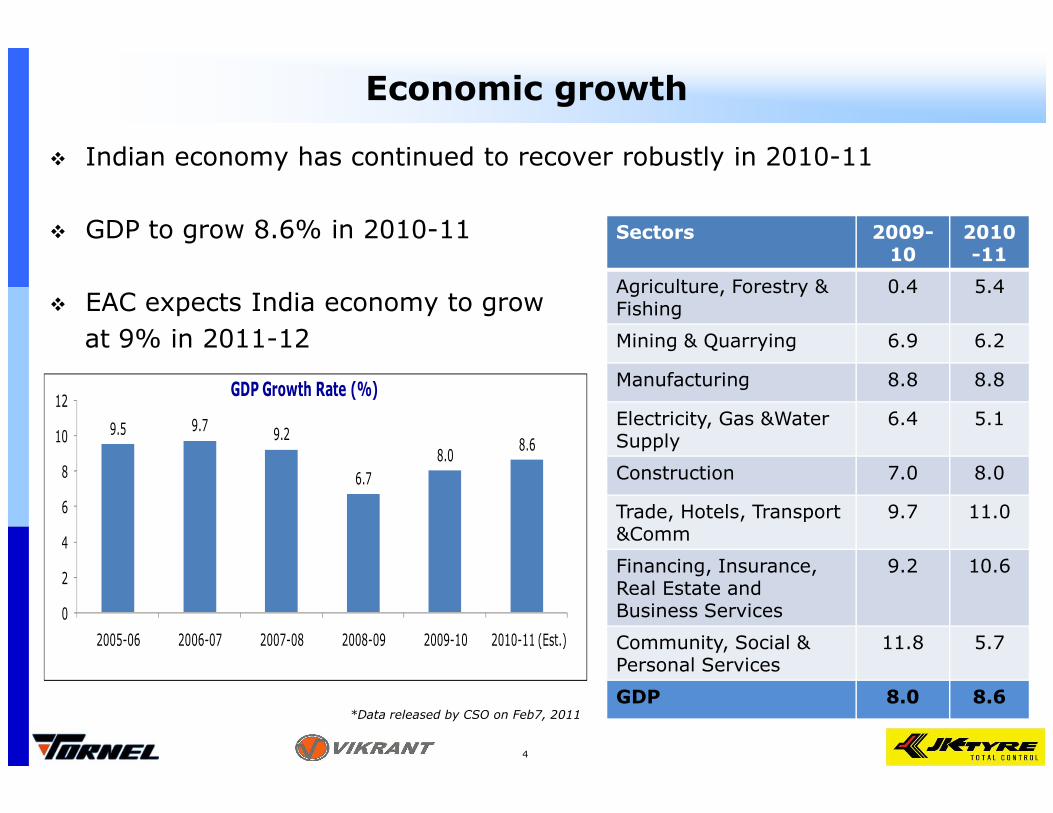
� Indian economy has continued to recover robustly in 2010-11
� GDP to grow 8.6% in 2010-11
� EAC expects India economy to grow
at 9% in 2011-12
12GDP Growth Rate (%)
Sectors 2009-10
2010-11
Agriculture, Forestry & Fishing
0.4 5.4
Mining & Quarrying 6.9 6.2
Manufacturing 8.8 8.8
Electricity, Gas &Water 6.4 5.19.5 9.7
9.2
6.7
8.08.6
0
2
4
6
8
10
12
2005-06 2006-07 2007-08 2008-09 2009-10 2010-11 (Est.)
4
Electricity, Gas &Water Supply
6.4 5.1
Construction 7.0 8.0
Trade, Hotels, Transport &Comm
9.7 11.0
Financing, Insurance, Real Estate and Business Services
9.2 10.6
Community, Social & Personal Services
11.8 5.7
GDP 8.0 8.6*Data released by CSO on Feb7, 2011
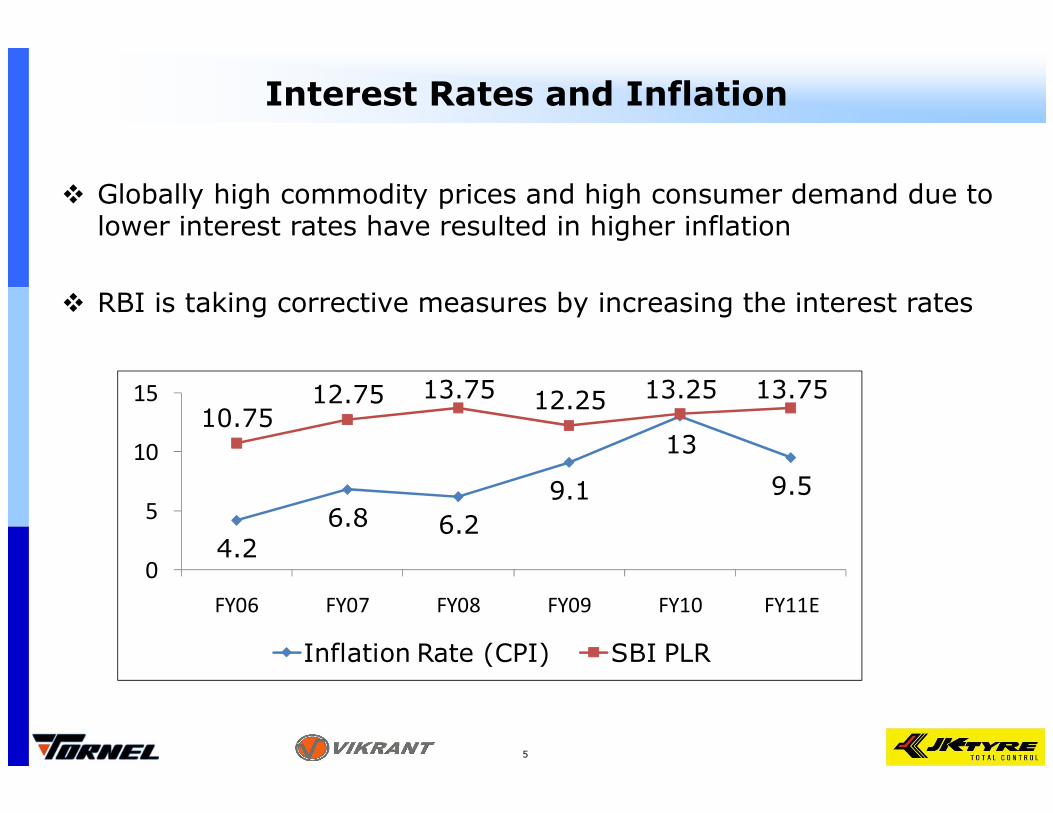
Interest Rates and Inflation
� Globally high commodity prices and high consumer demand due to lower interest rates have resulted in higher inflation
� RBI is taking corrective measures by increasing the interest rates
10.7512.75 13.75 12.25 13.25 13.7515
5
4.26.8 6.2
9.1
13
9.5
10.7512.75 12.25
0
5
10
FY06 FY07 FY08 FY09 FY10 FY11E
Inflation Rate (CPI) SBI PLR
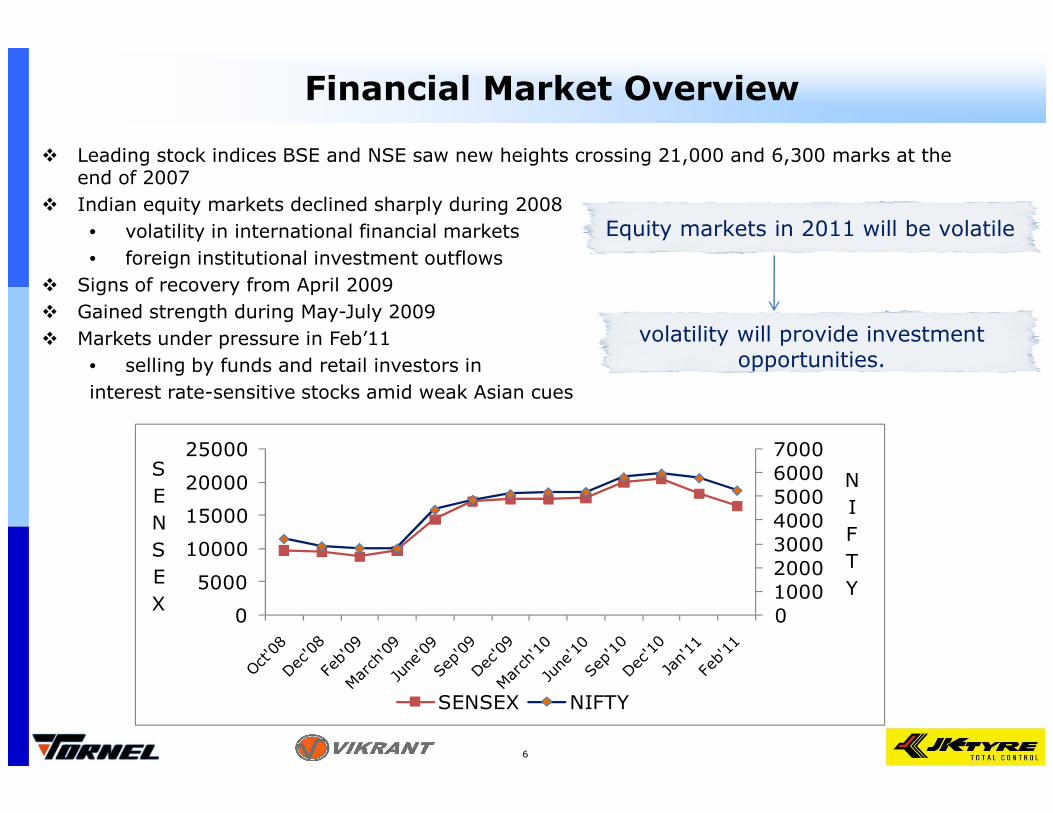
Financial Market Overview
� Leading stock indices BSE and NSE saw new heights crossing 21,000 and 6,300 marks at the end of 2007
� Indian equity markets declined sharply during 2008
• volatility in international financial markets
• foreign institutional investment outflows
� Signs of recovery from April 2009
� Gained strength during May-July 2009
� Markets under pressure in Feb’11
• selling by funds and retail investors in
interest rate-sensitive stocks amid weak Asian cues
Equity markets in 2011 will be volatile
volatility will provide investment opportunities.
6
0
1000
2000
3000
4000
5000
6000
7000
0
5000
10000
15000
20000
25000
N
I
F
T
Y
S
E
N
S
E
X
SENSEX NIFTY
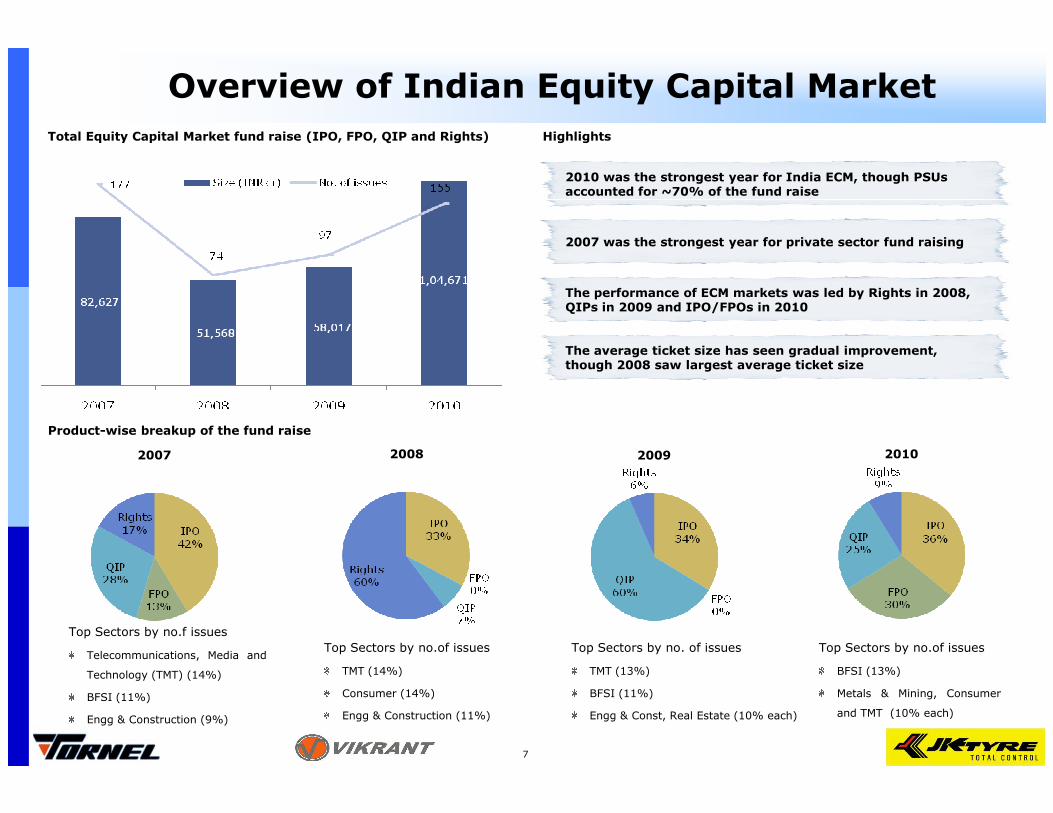
Overview of Indian Equity Capital Market
Total Equity Capital Market fund raise (IPO, FPO, QIP and Rights)
2010 was the strongest year for India ECM, though PSUs accounted for ~70% of the fund raise
2007 was the strongest year for private sector fund raising
The performance of ECM markets was led by Rights in 2008, QIPs in 2009 and IPO/FPOs in 2010
The average ticket size has seen gradual improvement, though 2008 saw largest average ticket size
Highlights
7
Product-wise breakup of the fund raise
2007 2008 2009 2010
Top Sectors by no.f issues
Telecommunications, Media and
Technology (TMT) (14%)
BFSI (11%)
Engg & Construction (9%)
Top Sectors by no.of issues
TMT (14%)
Consumer (14%)
Engg & Construction (11%)
Top Sectors by no. of issues
TMT (13%)
BFSI (11%)
Engg & Const, Real Estate (10% each)
Top Sectors by no.of issues
BFSI (13%)
Metals & Mining, Consumer
and TMT (10% each)
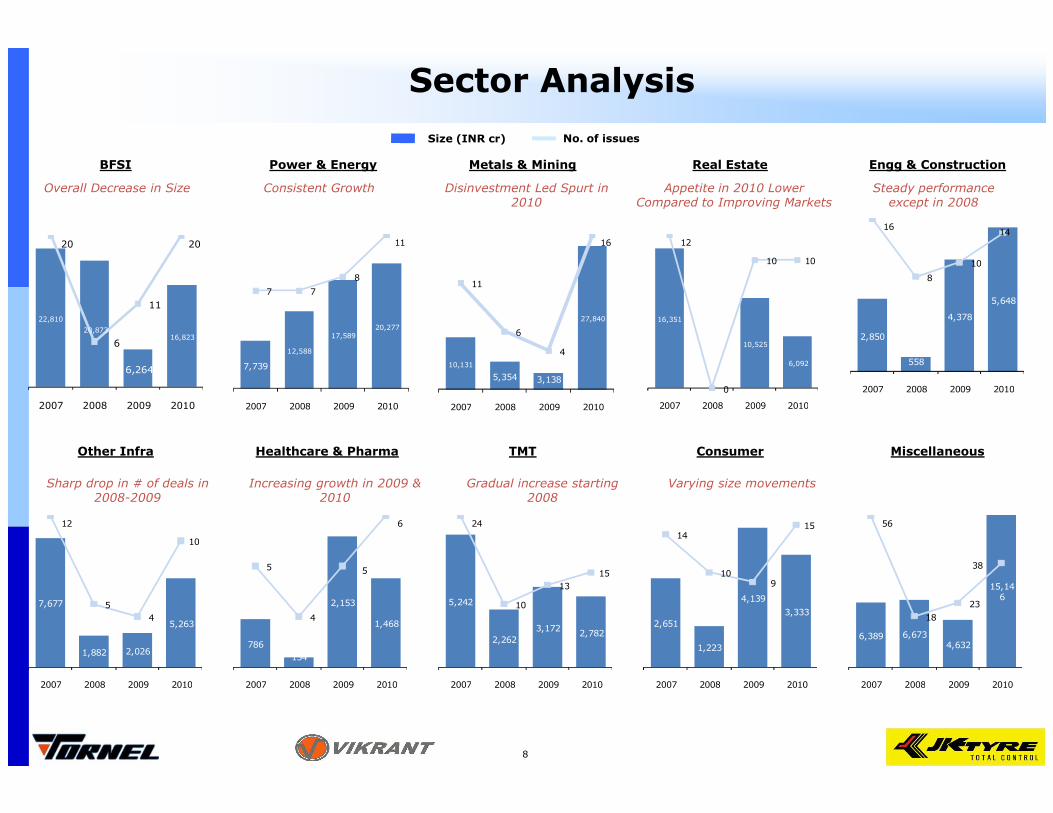
22,810
20,873
6,264
16,823
20
6
11
20
2007 2008 2009 2010
BFSI Power & Energy Metals & Mining Real Estate Engg & Construction
Size (INR cr) No. of issues
7,739
12,588
17,58920,277
7 7
8
11
2007 2008 2009 2010
10,131
5,354 3,138
27,840
11
6
4
16
2007 2008 2009 2010
16,351
10,525
6,092
12
0
10 10
2007 2008 2009 2010
2,850
558
4,378
5,648
16
8
10
14
2007 2008 2009 2010
Overall Decrease in Size Steady performance except in 2008
Appetite in 2010 Lower Compared to Improving Markets
Disinvestment Led Spurt in 2010
Consistent Growth
Sector Analysis
2007 2008 2009 2010
Other Infra Healthcare & Pharma TMT Consumer Miscellaneous
2007 2008 2009 2010 2007 2008 2009 2010 2007 2008 2009 2010
7,677
1,882 2,026
5,263
12
5
4
10
2007 2008 2009 2010
786
154
2,153
1,468
5
4
5
6
2007 2008 2009 2010
5,242
2,262
3,1722,782
24
10
13
15
2007 2008 2009 2010
2,651
1,223
4,139
3,333
14
109
15
2007 2008 2009 2010
6,389 6,6734,632
15,146
56
18
23
38
2007 2008 2009 2010
Sharp drop in # of deals in 2008-2009
Increasing growth in 2009 & 2010
Gradual increase starting 2008
Varying size movements
8
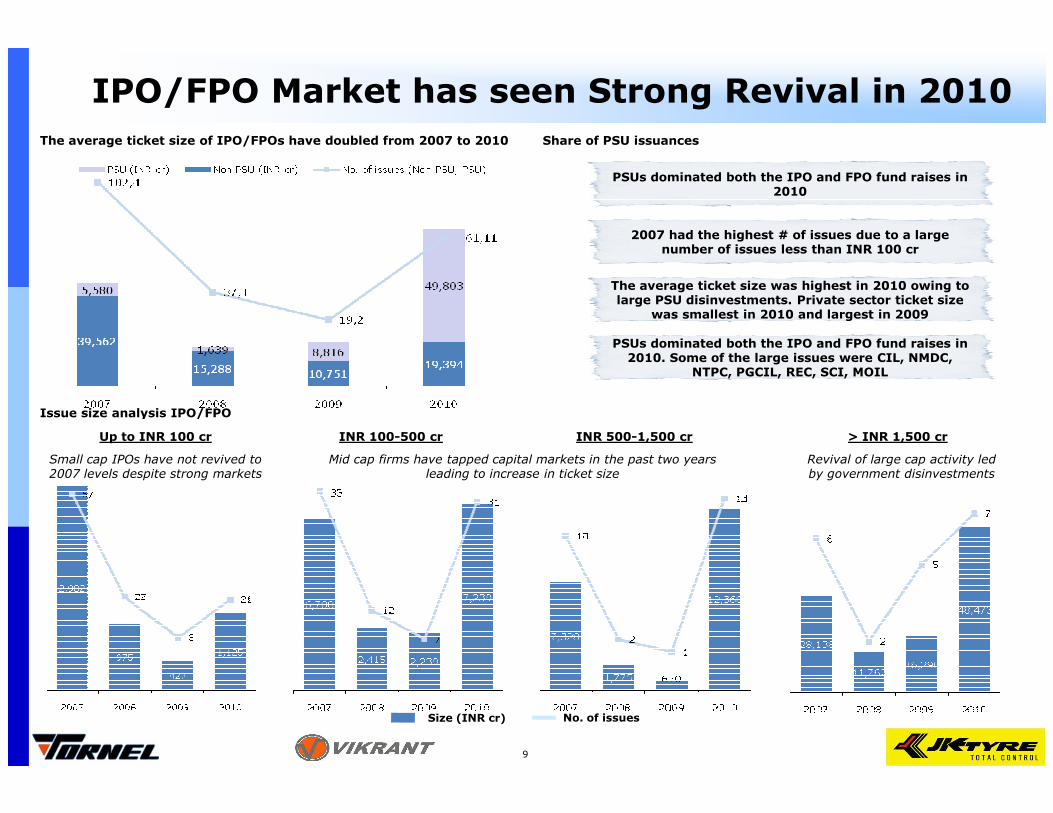
IPO/FPO Market has seen Strong Revival in 2010
The average ticket size of IPO/FPOs have doubled from 2007 to 2010
Issue size analysis IPO/FPO
Share of PSU issuances
PSUs dominated both the IPO and FPO fund raises in 2010
2007 had the highest # of issues due to a large number of issues less than INR 100 cr
The average ticket size was highest in 2010 owing to large PSU disinvestments. Private sector ticket size
was smallest in 2010 and largest in 2009
PSUs dominated both the IPO and FPO fund raises in 2010. Some of the large issues were CIL, NMDC,
NTPC, PGCIL, REC, SCI, MOIL
9
Issue size analysis IPO/FPO
Up to INR 100 cr INR 100-500 cr INR 500-1,500 cr > INR 1,500 cr
Size (INR cr) No. of issues
Revival of large cap activity led by government disinvestments
Mid cap firms have tapped capital markets in the past two years leading to increase in ticket size
Small cap IPOs have not revived to 2007 levels despite strong markets
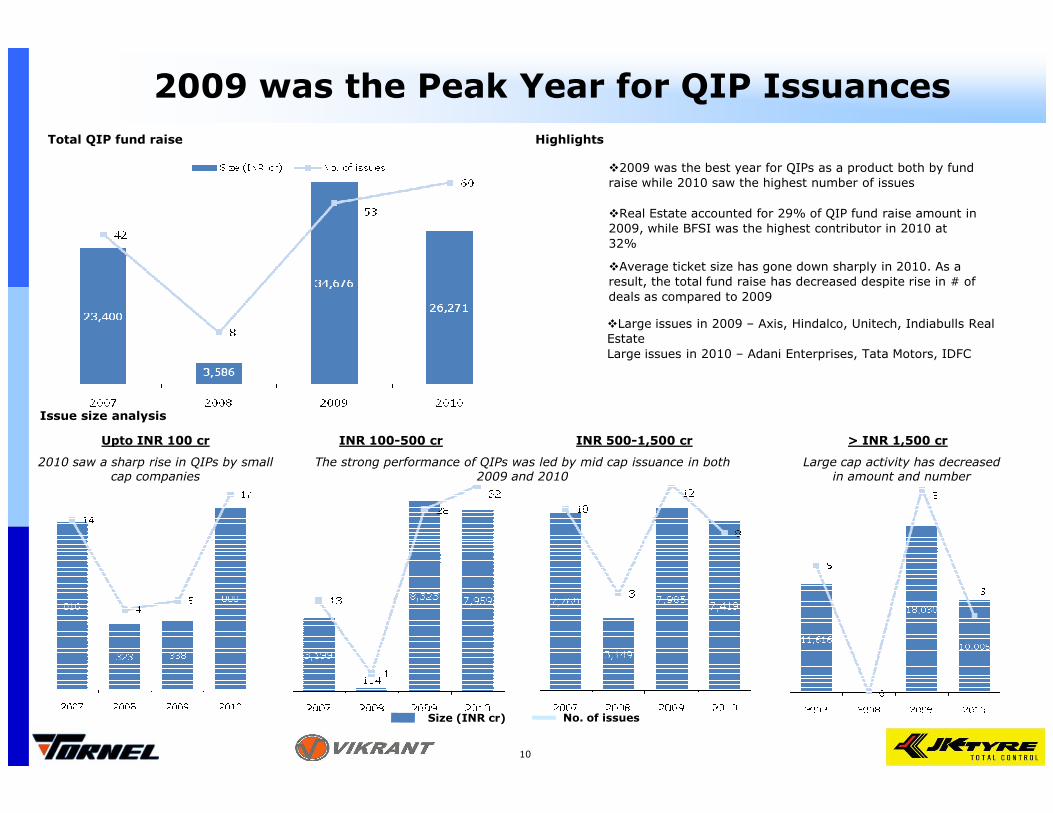
2009 was the Peak Year for QIP Issuances
Total QIP fund raise Highlights
�2009 was the best year for QIPs as a product both by fund
raise while 2010 saw the highest number of issues
�Real Estate accounted for 29% of QIP fund raise amount in
2009, while BFSI was the highest contributor in 2010 at
32%
�Average ticket size has gone down sharply in 2010. As a
result, the total fund raise has decreased despite rise in # of
deals as compared to 2009
�Large issues in 2009 – Axis, Hindalco, Unitech, Indiabulls Real
Estate
Large issues in 2010 – Adani Enterprises, Tata Motors, IDFC
10
Issue size analysis
Upto INR 100 cr INR 100-500 cr INR 500-1,500 cr > INR 1,500 cr
Size (INR cr) No. of issues
Large cap activity has decreased in amount and number
The strong performance of QIPs was led by mid cap issuance in both 2009 and 2010
2010 saw a sharp rise in QIPs by small cap companies
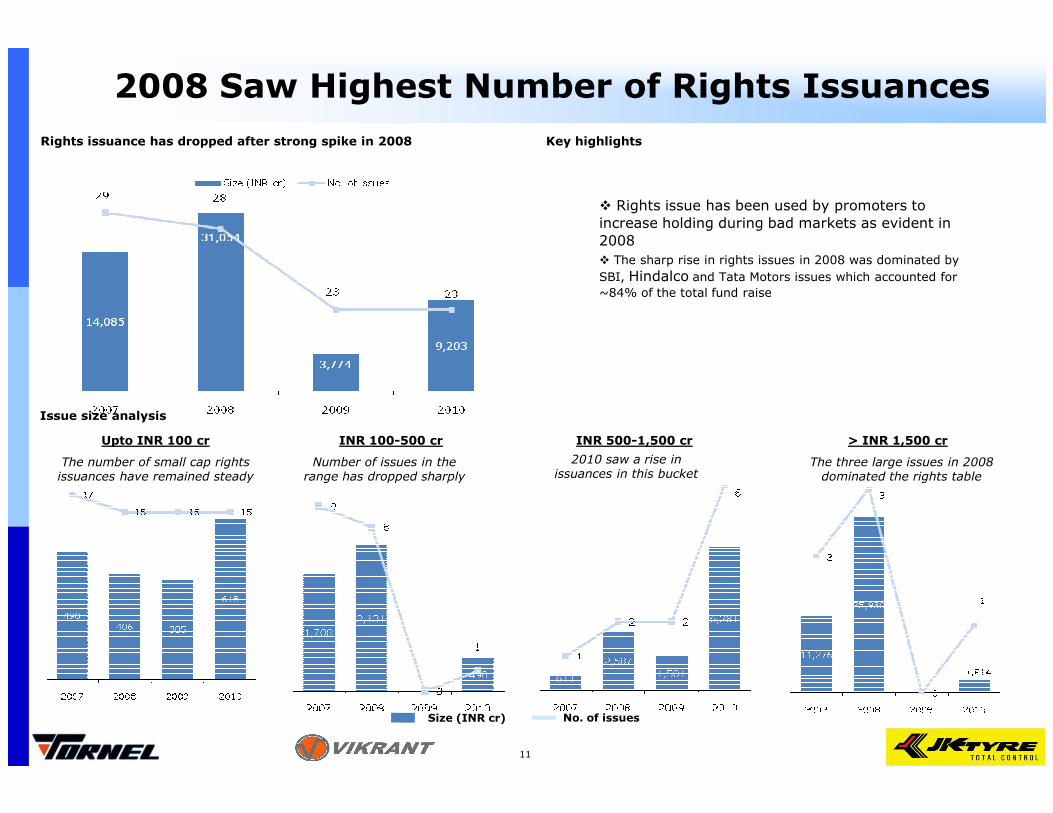
2008 Saw Highest Number of Rights Issuances
Rights issuance has dropped after strong spike in 2008
� Rights issue has been used by promoters to
increase holding during bad markets as evident in
2008
� The sharp rise in rights issues in 2008 was dominated by
SBI, Hindalco and Tata Motors issues which accounted for
~84% of the total fund raise
Key highlights
11
Issue size analysis
Upto INR 100 cr INR 100-500 cr INR 500-1,500 cr > INR 1,500 cr
Size (INR cr) No. of issues
The three large issues in 2008 dominated the rights table
Number of issues in the range has dropped sharply
The number of small cap rights issuances have remained steady
2010 saw a rise in issuances in this bucket
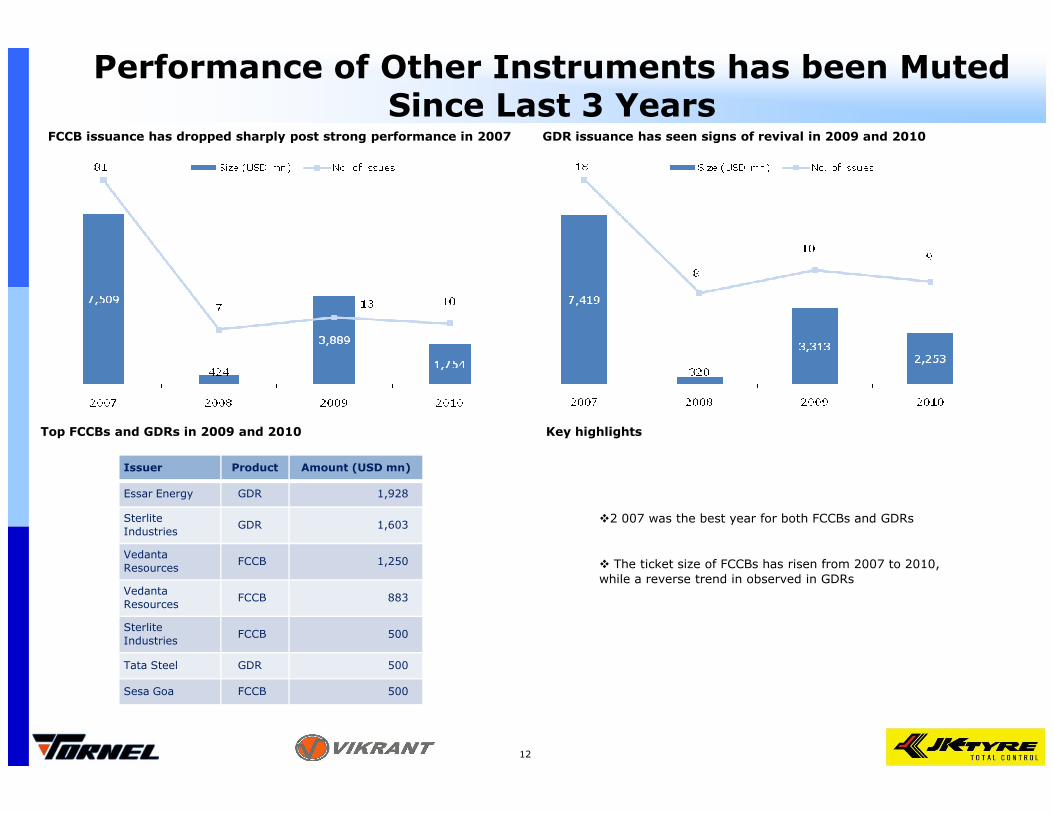
Performance of Other Instruments has been Muted Since Last 3 Years
GDR issuance has seen signs of revival in 2009 and 2010FCCB issuance has dropped sharply post strong performance in 2007
12
Top FCCBs and GDRs in 2009 and 2010
�2 007 was the best year for both FCCBs and GDRs
� The ticket size of FCCBs has risen from 2007 to 2010,
while a reverse trend in observed in GDRs
Key highlights
Issuer Product Amount (USD mn)
Essar Energy GDR 1,928
Sterlite
IndustriesGDR 1,603
Vedanta
ResourcesFCCB 1,250
Vedanta
ResourcesFCCB 883
Sterlite
IndustriesFCCB 500
Tata Steel GDR 500
Sesa Goa FCCB 500
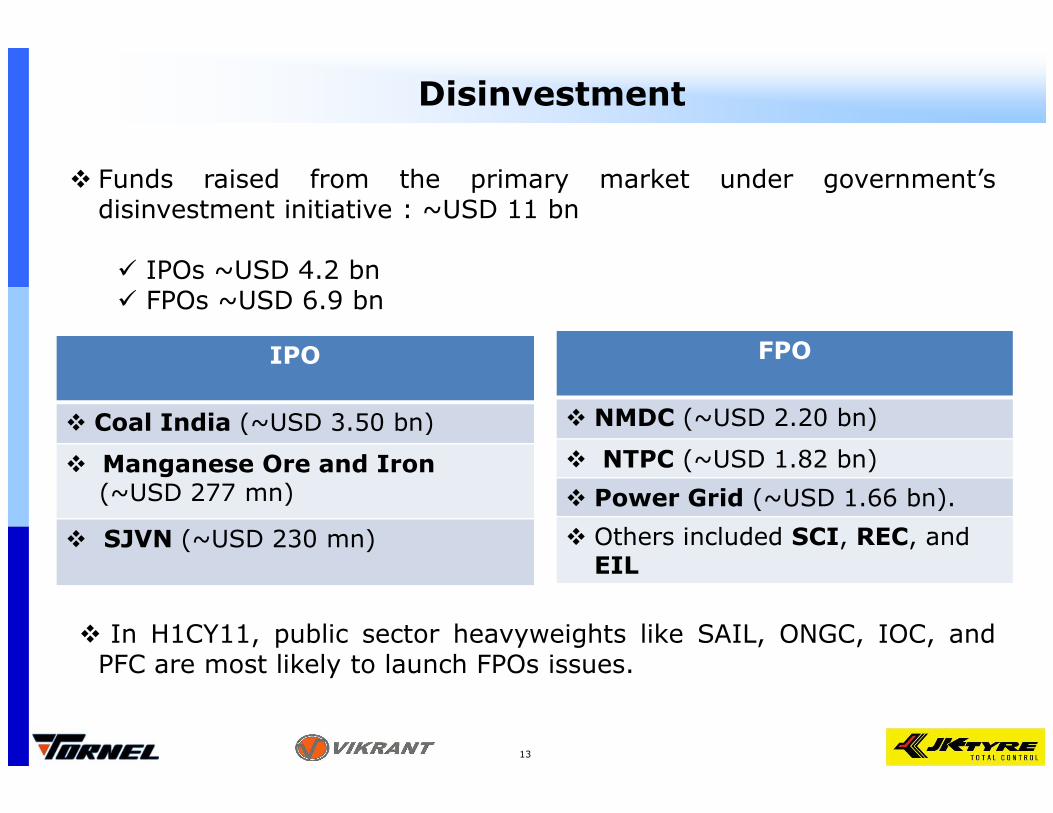
Disinvestment
� Funds raised from the primary market under government’sdisinvestment initiative : ~USD 11 bn
� IPOs ~USD 4.2 bn� FPOs ~USD 6.9 bn
FPO
� NMDC (~USD 2.20 bn)
IPO
Coal India (~USD 3.50 bn) � NMDC (~USD 2.20 bn)
� NTPC (~USD 1.82 bn)
� Power Grid (~USD 1.66 bn).
� Others included SCI, REC, and EIL
� Coal India (~USD 3.50 bn)
� Manganese Ore and Iron (~USD 277 mn)
� SJVN (~USD 230 mn)
� In H1CY11, public sector heavyweights like SAIL, ONGC, IOC, andPFC are most likely to launch FPOs issues.
13
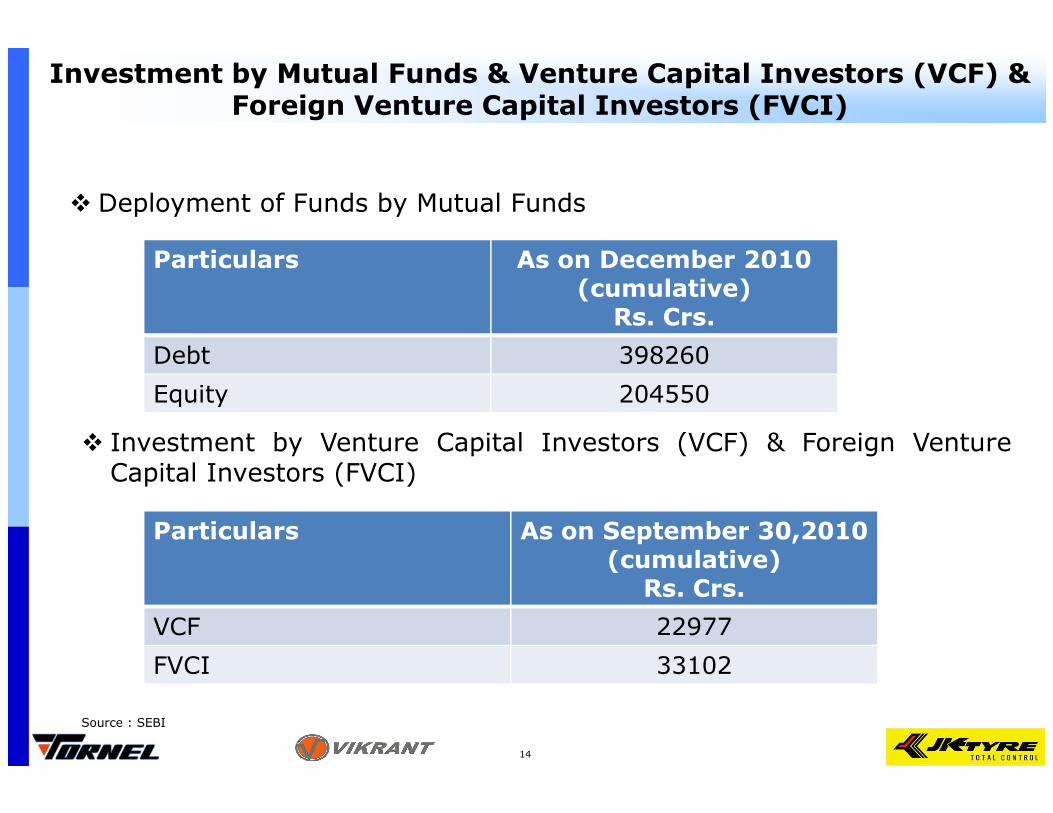
Investment by Mutual Funds & Venture Capital Investors (VCF) & Foreign Venture Capital Investors (FVCI)
� Deployment of Funds by Mutual Funds
Particulars As on December 2010 (cumulative)
Rs. Crs.
Debt 398260
Equity 204550
14
� Investment by Venture Capital Investors (VCF) & Foreign VentureCapital Investors (FVCI)
Equity 204550
Particulars As on September 30,2010 (cumulative)
Rs. Crs.
VCF 22977
FVCI 33102
Source : SEBI
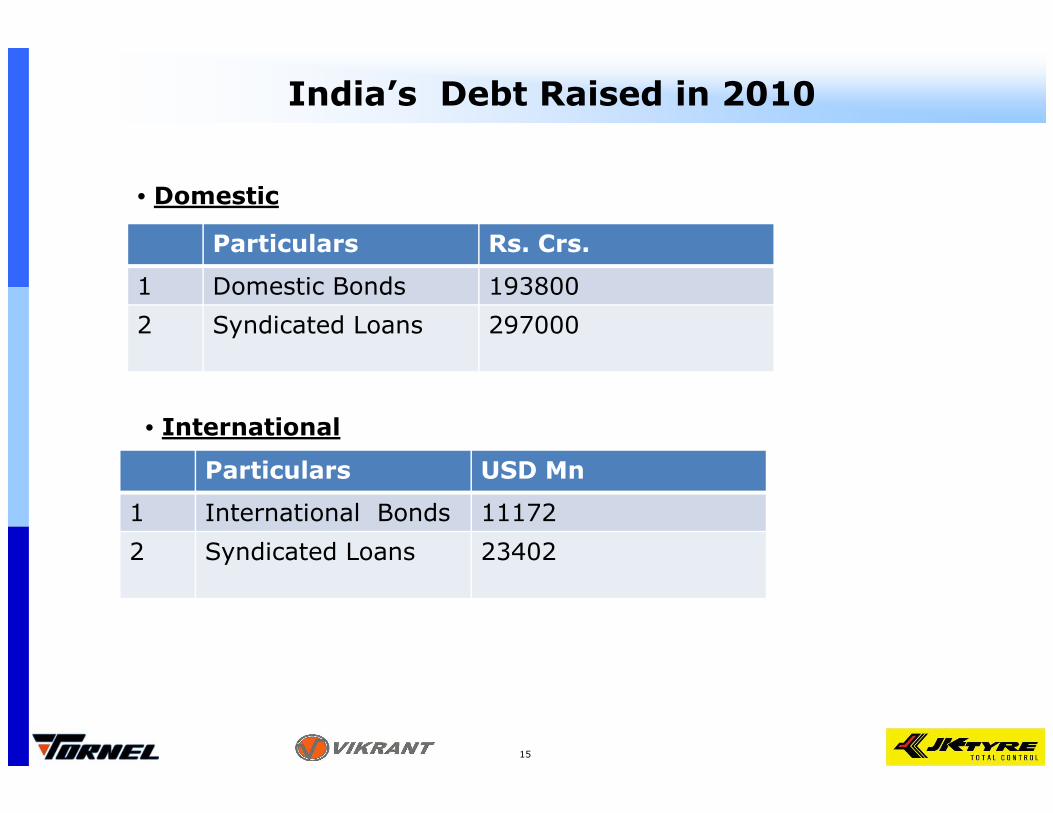
India’s Debt Raised in 2010
Particulars Rs. Crs.
1 Domestic Bonds 193800
2 Syndicated Loans 297000
• Domestic
15
Particulars USD Mn
1 International Bonds 11172
2 Syndicated Loans 23402
• International
Financing Options
16
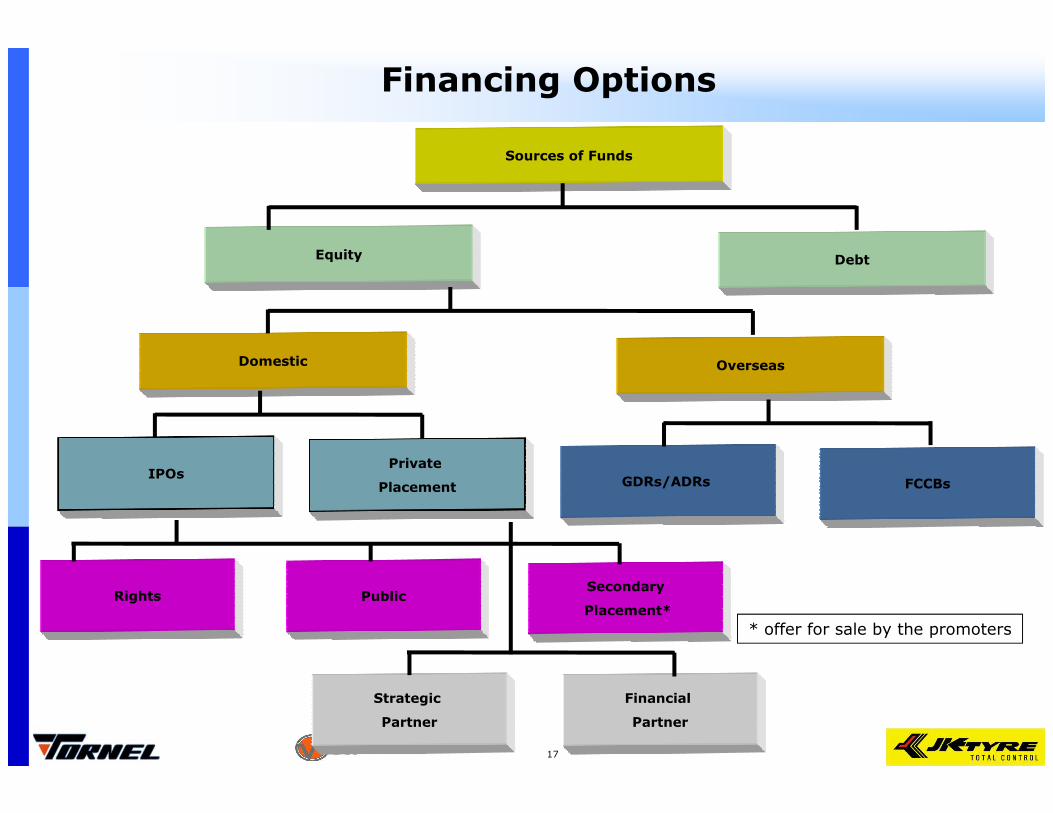
Equity
Sources of Funds
Financing Options
Domestic Overseas
Debt
Rights Public
Strategic
Partner
GDRs/ADRs
Private
PlacementIPOs
FCCBs
Financial
Partner
Secondary
Placement*
* offer for sale by the promoters
17
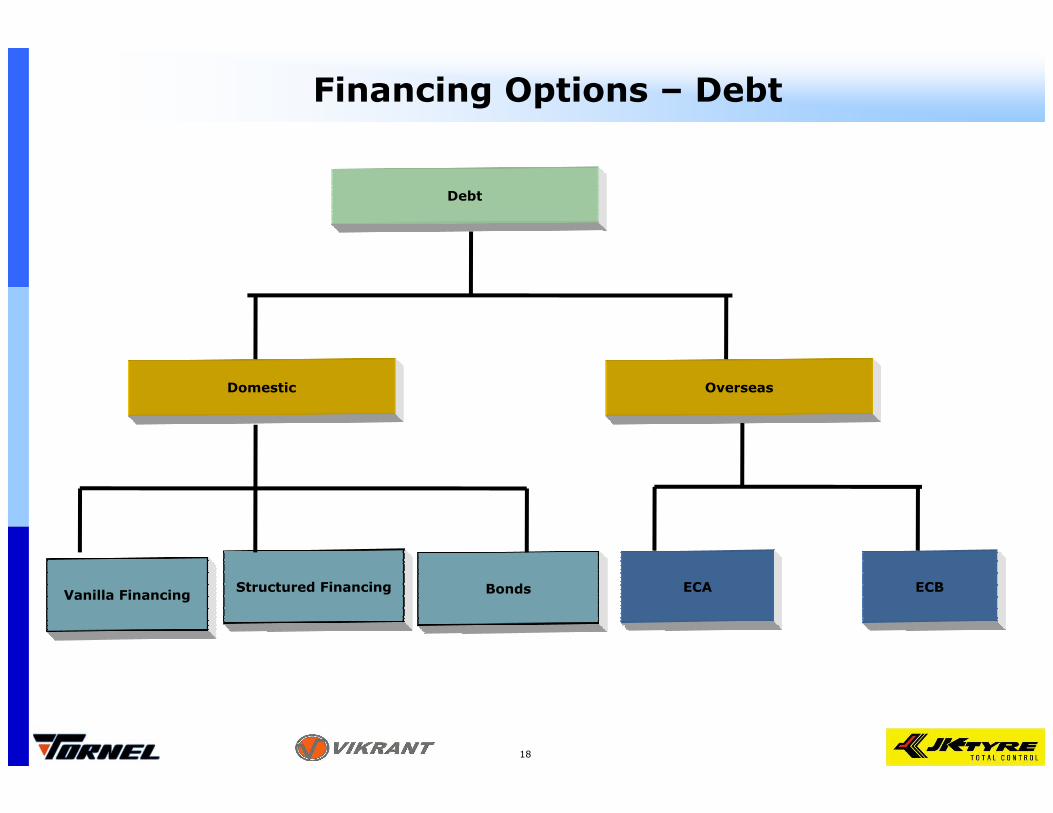
Financing Options – Debt
Domestic Overseas
Debt
ECAStructured FinancingVanilla Financing
18
ECBBonds
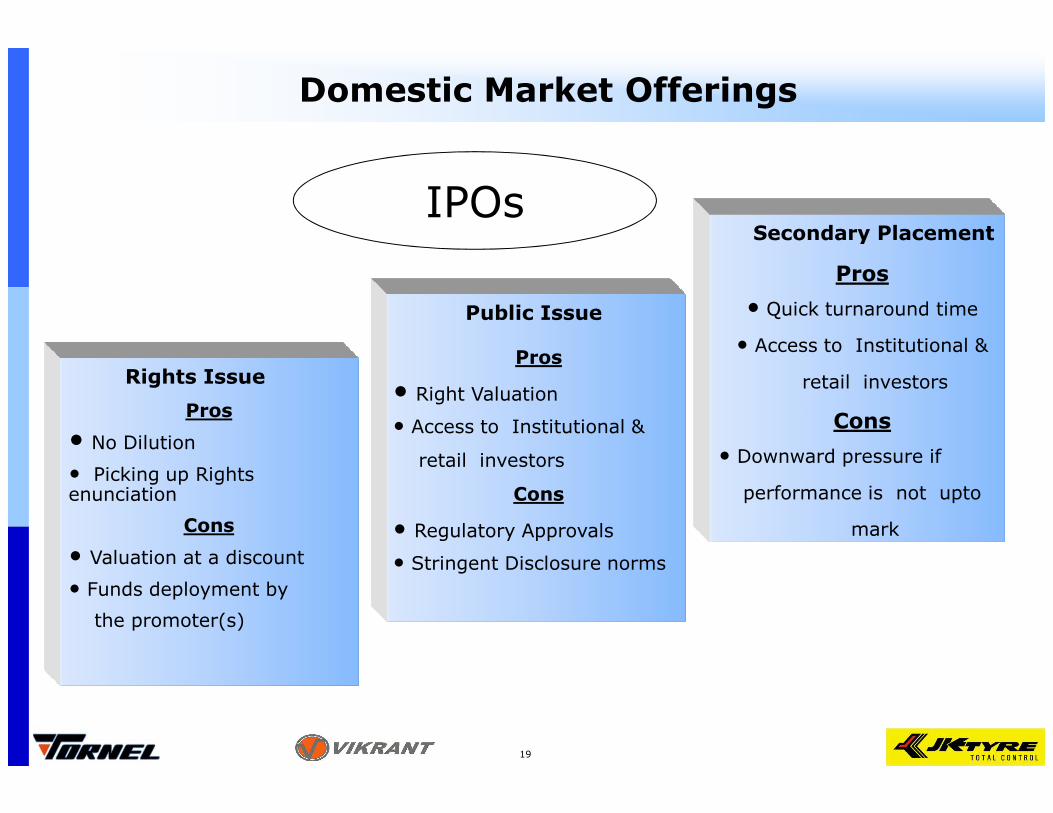
IPOs
Public Issue
Rights Issue
Pros
Pros
• Right Valuation
Pros
• Quick turnaround time
• Access to Institutional &
retail investors
Secondary Placement
Domestic Market Offerings
Pros
• No Dilution
• Picking up Rights enunciation
Cons
• Valuation at a discount
• Funds deployment by
the promoter(s)
• Access to Institutional &
retail investors
Cons
• Regulatory Approvals
• Stringent Disclosure norms
Cons
• Downward pressure if
performance is not upto
mark
19
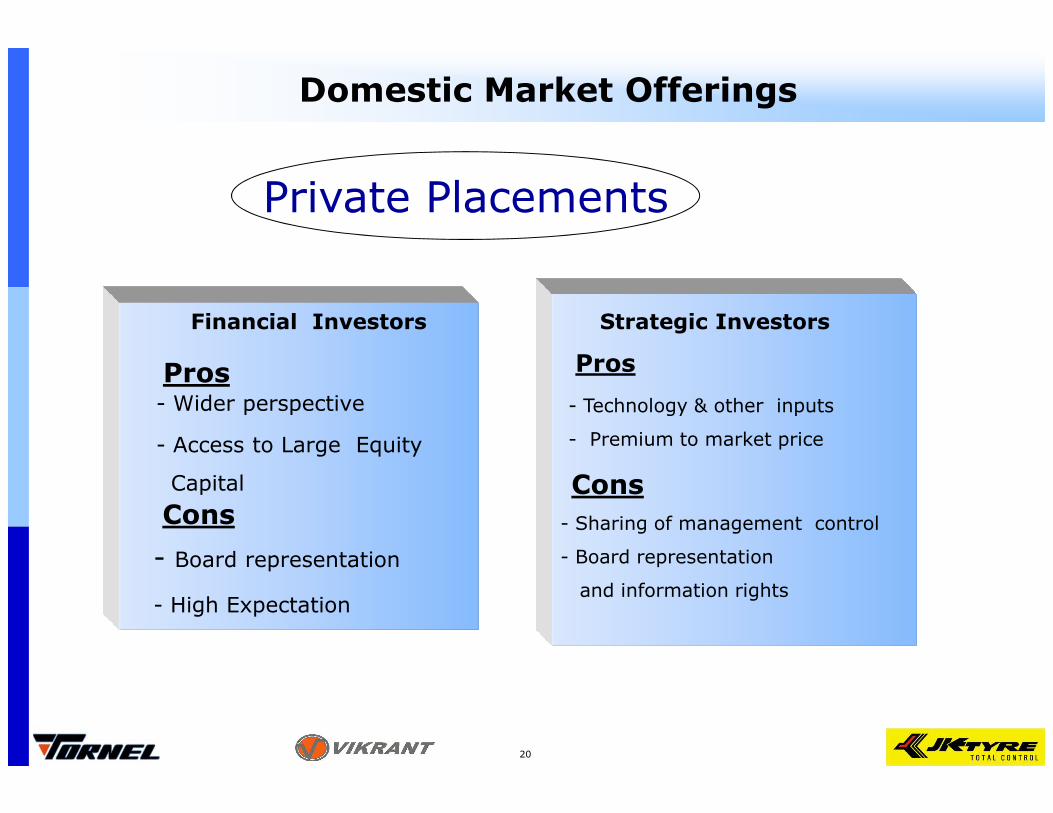
Private Placements
Financial Investors
Pros Pros
- Wider perspective - Technology & other inputs
Strategic Investors
Domestic Market Offerings
- Wider perspective
- Access to Large Equity
Capital
ConsCons
- Board representation
- High Expectation
- Technology & other inputs
- Premium to market price
- Sharing of management control
- Board representation
and information rights
20
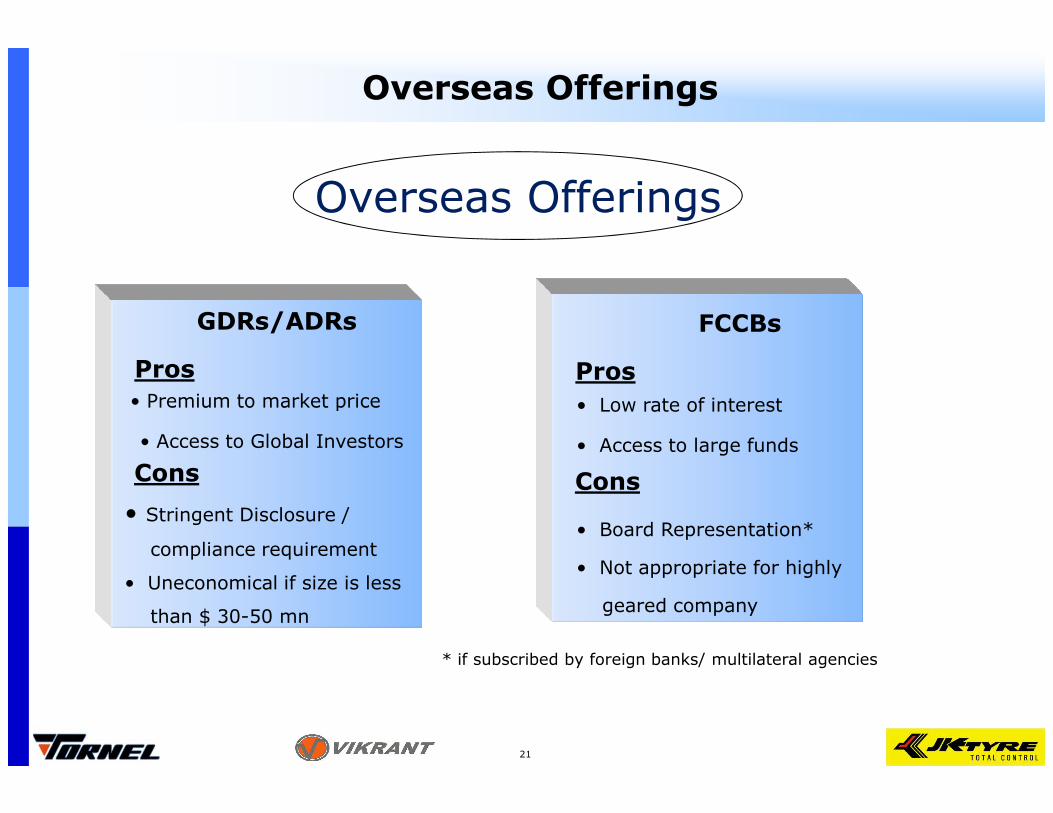
Overseas Offerings
Overseas Offerings
GDRs/ADRs
Pros Pros• Premium to market price • Low rate of interest
FCCBs
• Premium to market price
• Access to Global Investors
Cons Cons
• Stringent Disclosure /
compliance requirement
• Uneconomical if size is less
than $ 30-50 mn
• Low rate of interest
• Access to large funds
• Board Representation*
• Not appropriate for highly
geared company
* if subscribed by foreign banks/ multilateral agencies
21
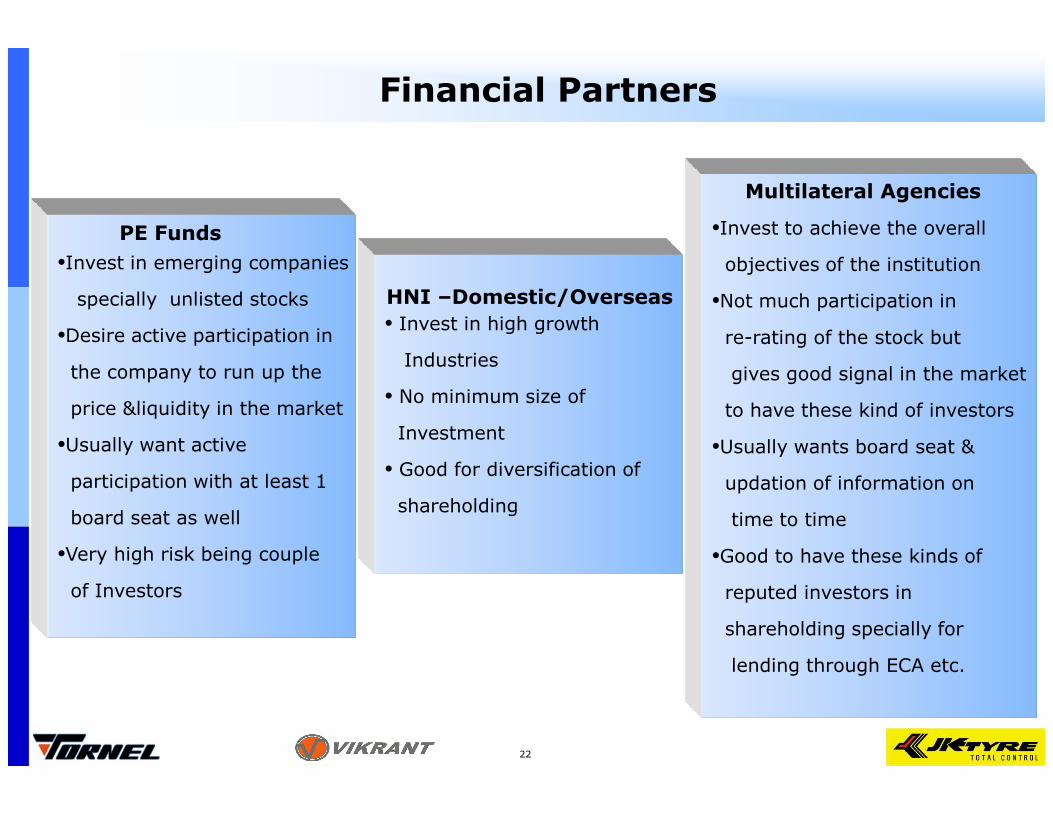
•Invest in emerging companies
specially unlisted stocks
•Desire active participation in
the company to run up the
price &liquidity in the market
PE Funds
Financial Partners
• Invest in high growth
Industries
• No minimum size of
HNI –Domestic/Overseas
•Invest to achieve the overall
objectives of the institution
•Not much participation in
re-rating of the stock but
gives good signal in the market
to have these kind of investors
Multilateral Agencies
price &liquidity in the market
•Usually want active
participation with at least 1
board seat as well
•Very high risk being couple
of Investors
22
•
Investment
• Good for diversification of
shareholding
to have these kind of investors
•Usually wants board seat &
updation of information on
time to time
•Good to have these kinds of
reputed investors in
shareholding specially for
lending through ECA etc.
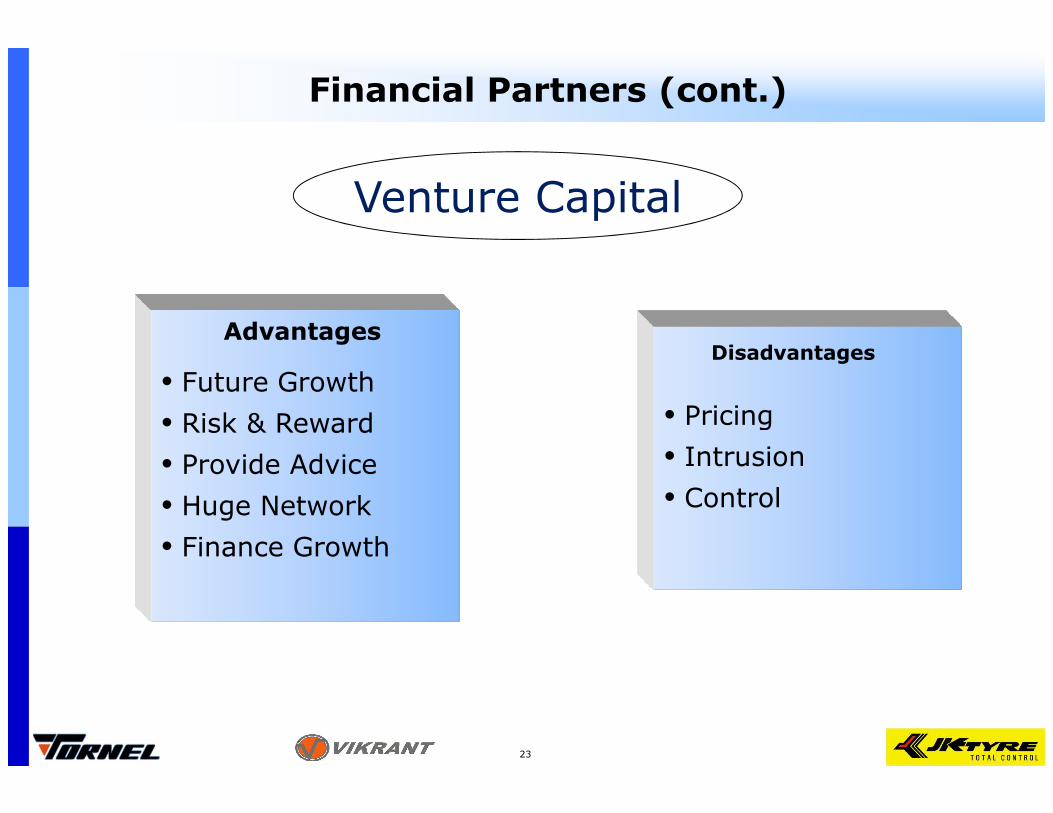
• Future Growth• Risk & Reward
Advantages
Financial Partners (cont.)
• Pricing
Disadvantages
Venture Capital
• Risk & Reward• Provide Advice• Huge Network• Finance Growth
23
• Pricing• Intrusion• Control
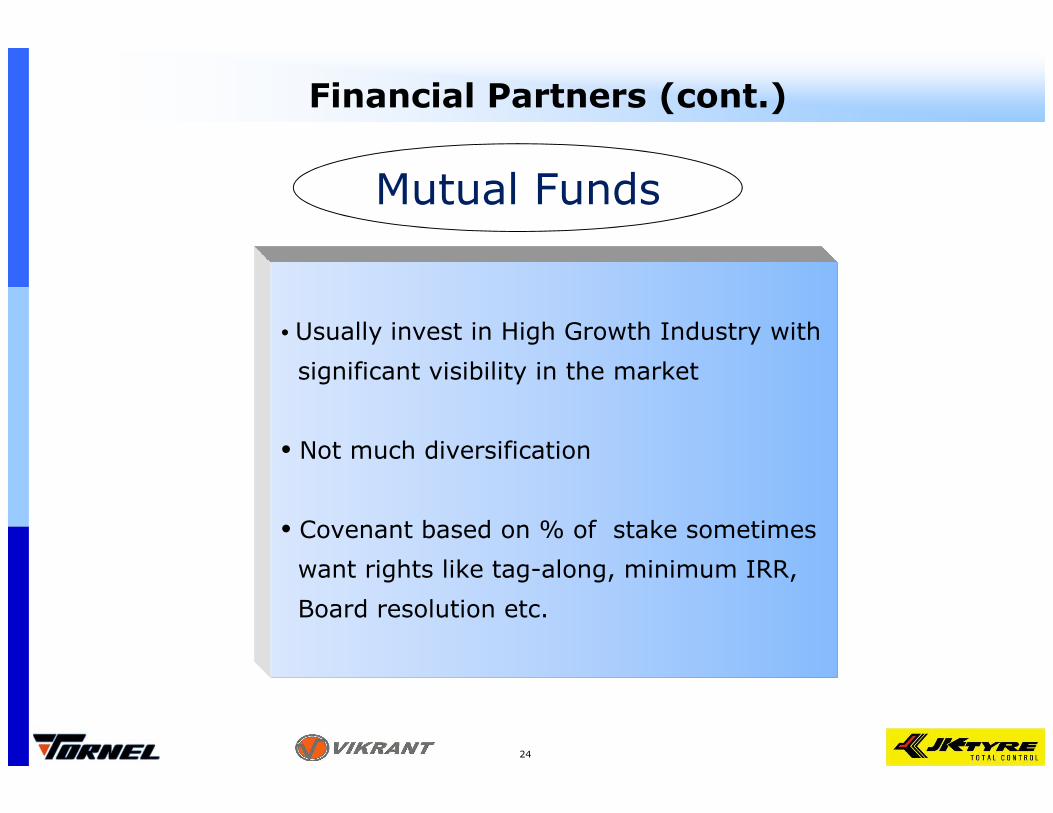
• Usually invest in High Growth Industry with
significant visibility in the market
Financial Partners (cont.)
Mutual Funds
• Not much diversification
• Covenant based on % of stake sometimes
want rights like tag-along, minimum IRR,
Board resolution etc.
24
Structured Finance
� Pooling of assets (either cash-based or synthetically created);
� De-linking of the credit risk of the collateral pool from the credit risk of the originator;
� Tranching of liabilities (this sets it apart from “pass-through”securitizations).
25
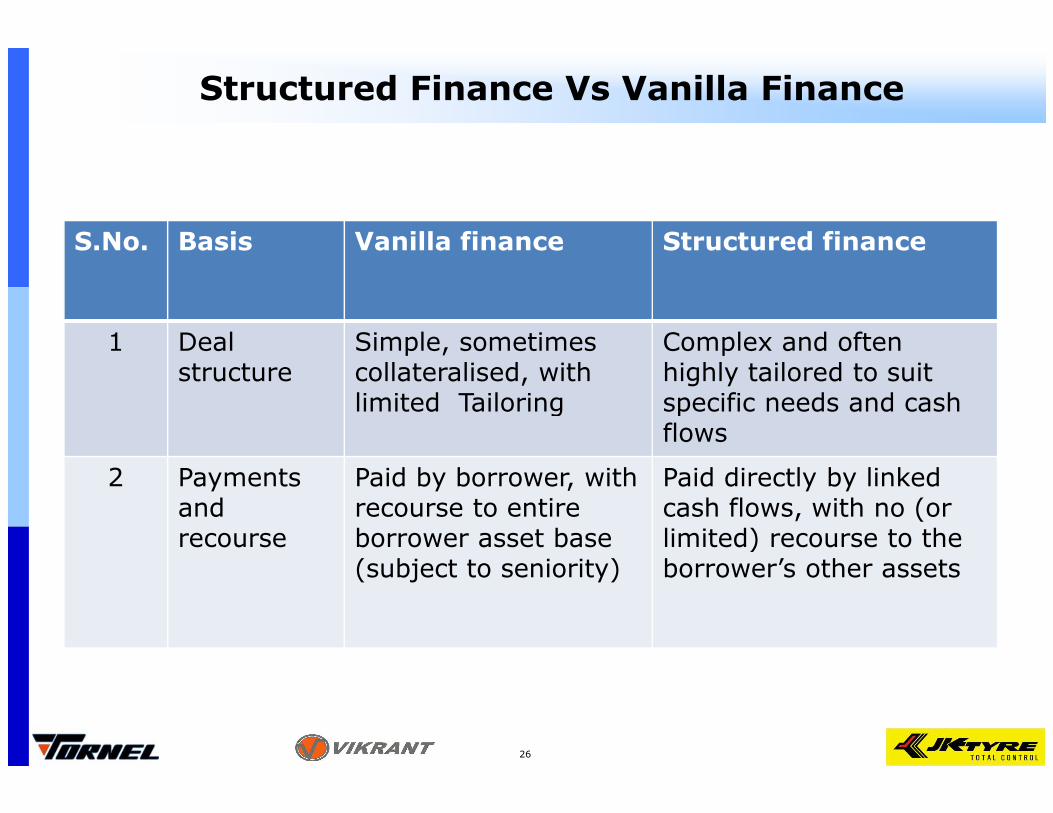
Structured Finance Vs Vanilla Finance
S.No. Basis Vanilla finance Structured finance
1 Deal structure
Simple, sometimes collateralised, with limited Tailoring
Complex and often highly tailored to suit specific needs and cash limited Tailoring specific needs and cash flows
2 Payments and recourse
Paid by borrower, with recourse to entire borrower asset base (subject to seniority)
Paid directly by linked cash flows, with no (or limited) recourse to the borrower’s other assets
26
Structured Finance -Risks and challenges
� Possible concentration of credit risks
� Opaque allocation of credit risks
� New legal risks and complex pricing risks
� Financial stability implications
� Regulatory challenges
� Fees and net interest margins are higher for structured finance than vanilla lending, due to its greater complexity
27
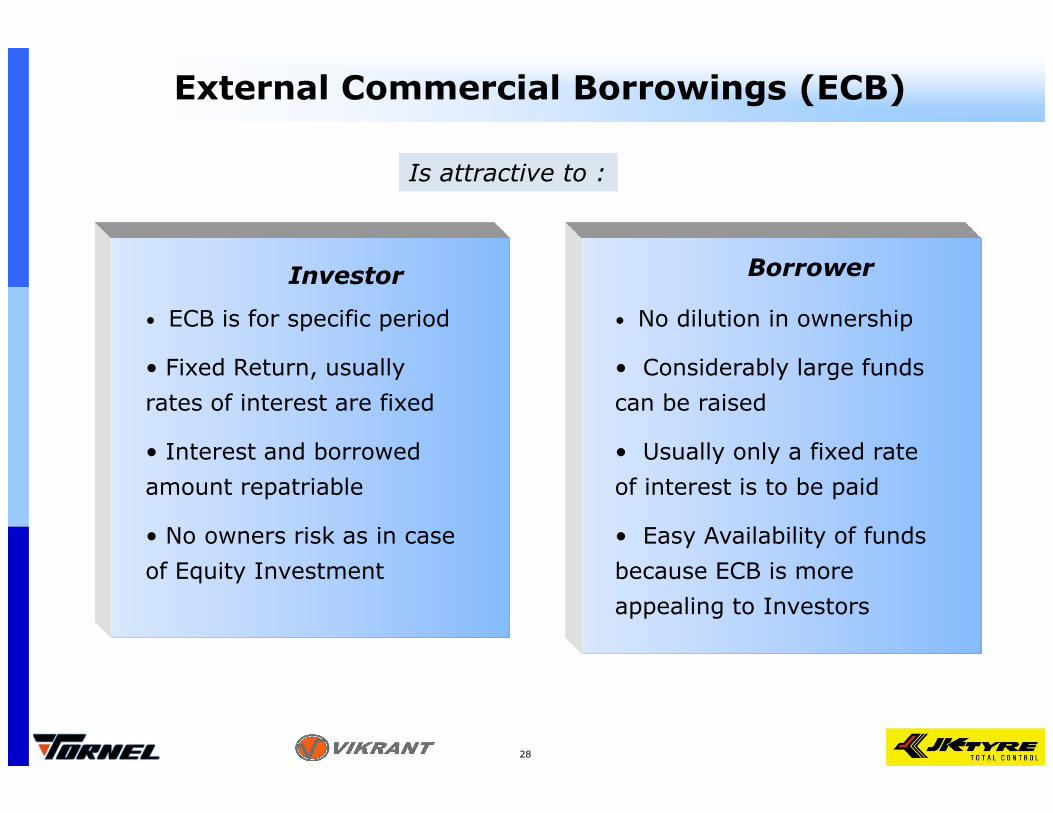
External Commercial Borrowings (ECB)
Investor
• ECB is for specific period
• Fixed Return, usually
rates of interest are fixed
Borrower
• No dilution in ownership
• Considerably large funds
can be raised
Is attractive to :
rates of interest are fixed
• Interest and borrowed
amount repatriable
• No owners risk as in case
of Equity Investment
can be raised
• Usually only a fixed rate
of interest is to be paid
• Easy Availability of funds
because ECB is more
appealing to Investors
28
Potential Investment Opportunities
29
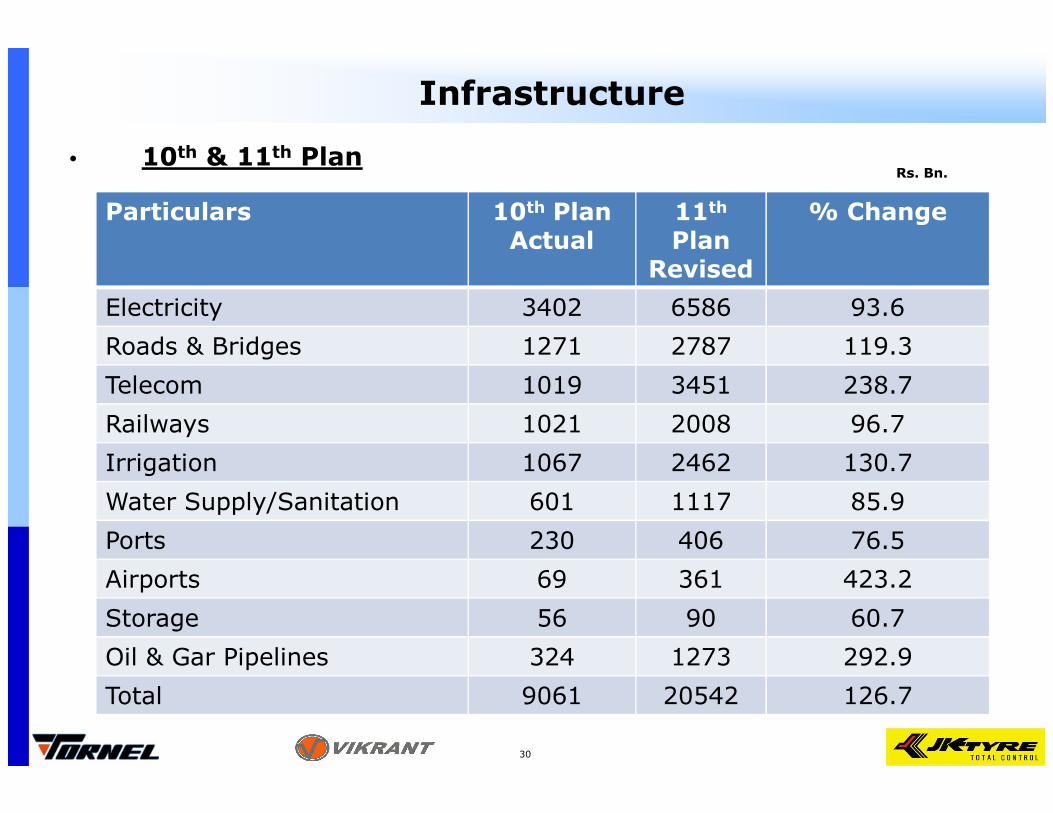
Infrastructure
• 10th & 11th Plan
Particulars 10th Plan Actual
11th
Plan Revised
% Change
Electricity 3402 6586 93.6
Roads & Bridges 1271 2787 119.3
Telecom 1019 3451 238.7
Rs. Bn.
30
Railways 1021 2008 96.7
Irrigation 1067 2462 130.7
Water Supply/Sanitation 601 1117 85.9
Ports 230 406 76.5
Airports 69 361 423.2
Storage 56 90 60.7
Oil & Gar Pipelines 324 1273 292.9
Total 9061 20542 126.7
Infrastrcture (Cont.)
• Issues in Financing
� Investment : US$500 Billion (Est.)
� 1/4th to be met through Public-Private Partnerships(PPP)
� Challenges in Funding India’s Infrastructure:� Challenges in Funding India’s Infrastructure:
� Asset liability mismatch and exposure limit for banks
� High pre-emtion of fundsfrom banking system
� Shallowness of the bond market
� Constrained supply of ECBs
� Global economic slowdown
� Rising interest rates
31
Automobiles
� Investment up to US$ 17.12 billion in fresh capacity in the next 4 years
• Components industry : US$ 12 billion up to the end of the Automotive Mission Plan.
� Car manufacturing capacity set to rise to 5.7 million units by � Car manufacturing capacity set to rise to 5.7 million units by 2015
� India aims to become the small car hub of the world by dethroning Japan
32
Auto Components
� Ministry of Heavy Industries and Public Enterprises hasenvisaged Automotive Mission Plan 2006-2016. It targets to:
– Increase turnover to US$ 122 billion–US$ 159 billion by 2016from US$ 34 billion in 2006
– Increase export revenue to US$ 35 billion by 2016
– Provide employment to additional 25 million people by 2016
33
• Challenges
� Revamp distribution strategies
� Change the product design and agent commission structure
� Strong bancassurance
Insurance
� Strong bancassurance
� Lower cost overruns
� Established distribution networks
6-8 established players are likely to be better positioned to manage these challenges
34
• Growth Drivers
� High rates of growth
� Increased market liberalization
• Challenges
� Access to technology
� Raw material availability
Indian Aerospace Industry
The Indian aerospace industry has historically been dominated by large Public Sector Units (PSUs).
liberalization
� High domestic demand
� Cost advantages
� Talent base
� Leveraging IT competitiveness
� Access to funding
� Certification processes
� Skill availability
� Quality issues
35
• Investment Oppurtunities
� Investment opportunities in new aircraft and anddevelopment of airport infrastructure.
� Associated areas, such as MRO (Maintenance, Repair & Overhaul), offer high investment potential.
Indian Aerospace Industry (Cont.)
Overhaul), offer high investment potential.
� Increased Air cargo traffic
36
• Critical Issues - very important for the qualitative growth of the Indian banking
� Know Your Customer (KYC)
� Treating customers fairly (TCF)
� Capital and Liquidity risk management
Banking and Financial Sector
� Capital and Liquidity risk management
� Asset Quality
� Inclusive Growth: Financial Inclusion Leveraging Technology
� mass availability of products
� wide range of services to satisfy the financial and nonfinancial
� needs of all types of customers
� key enabling factor has been the adoption of technology
37
• Proposed Guidelines
� At least Rs 1,000 crore as the entry level capital
� New banks should be substantially large & well-capitalised,
� Ability to expand their operations swiftly after getting licences
Banking and Financial Sector (Cont.)
� Ability to expand their operations swiftly after getting licences
� New banks have to foster financial inclusion
� Resources sufficient enough to enable them expand the banking reach faster
38
� Emerging hub for contract research, Biotechnology, Clinical trials and Clinical data management.
� Licensing deals with MNCs for New Chemical Entities and New Drug Delivery Systems.
� Marketing alliances for MNC products in domestic and international markets.
Pharmaceutical Industry
� Marketing alliances for MNC products in domestic and international markets.
� Contract manufacturing arrangements with MNCs.
� Enormous potential for developing India as a centre for international clinical trials.
� Possibilities for expansion of Bio-similars and Bio-pharmaceuticals.
39
� In the knowledge process outsourcing, India is climbing theglobal value chain and is expected to add value to global KPO-valuation research, investment research, patent filing, insuranceclaims processing, online teaching and legal process outsourcing.
� Increased M&A driven by need for global service delivery
Information Technology Sector
� Increased M&A driven by need for global service delivery capabilities
� IT sector emerged as the preferred space for venture capital investments in India
40
� IIP growth slowing near term: Industrial growth in 1QCY11 is likely to slow to the 5% levels, thereby raising some question marks on the sustainability of growth.
� Rising inflation is biggest worry: After a softer headline inflationover this quarter, inflation is likely to pick up and could be in the 7-8%range late this year. More importantly, this will be driven by coreinflation rather than the agflation of 2010.
� Monetary tightening, rising interest rates: It is expectes that RBI
2011: Challenges
� Monetary tightening, rising interest rates: It is expectes that RBIwill increase policy rates by 100bp, the cash reserve ratio by 25bpand the statutory liquidity ratio by 50bp to contain inflationexpectations. Also banks too will hike rates by 100 bps over next 12-15 months.
� Earnings downgrades: On a bottom up basis, it is forecasted thatearnings to grow 31% in FY11 and 24% in FY12. It is seen thatearnings downgrades as margins disappoint led by (a) rising
commodity prices (b) rising wage costs and (c) higher interest costs.
Uncertainity of Demand Uncertainity of Forecasting
41
2011 – Hope for the Best
� 2010 has turned out to be one of the most range bound years in India in the last 20 years. Expert see 2011 an even more difficult year with markets
� Global quantitative easing is positive
� Strong GDP Growth~ 8.5%
• Industrial Growth around 8% in FY12• Industrial Growth around 8% in FY12
� Strong earning growth
� FII flows in Indian Market at $29 Bn. in 2010
• The global backdrop is encouraging for FII flows to all emerging markets including India
� Rural demand key driver in 2011
42

Just a word aboutJust a word aboutJust a word aboutJust a word about
43
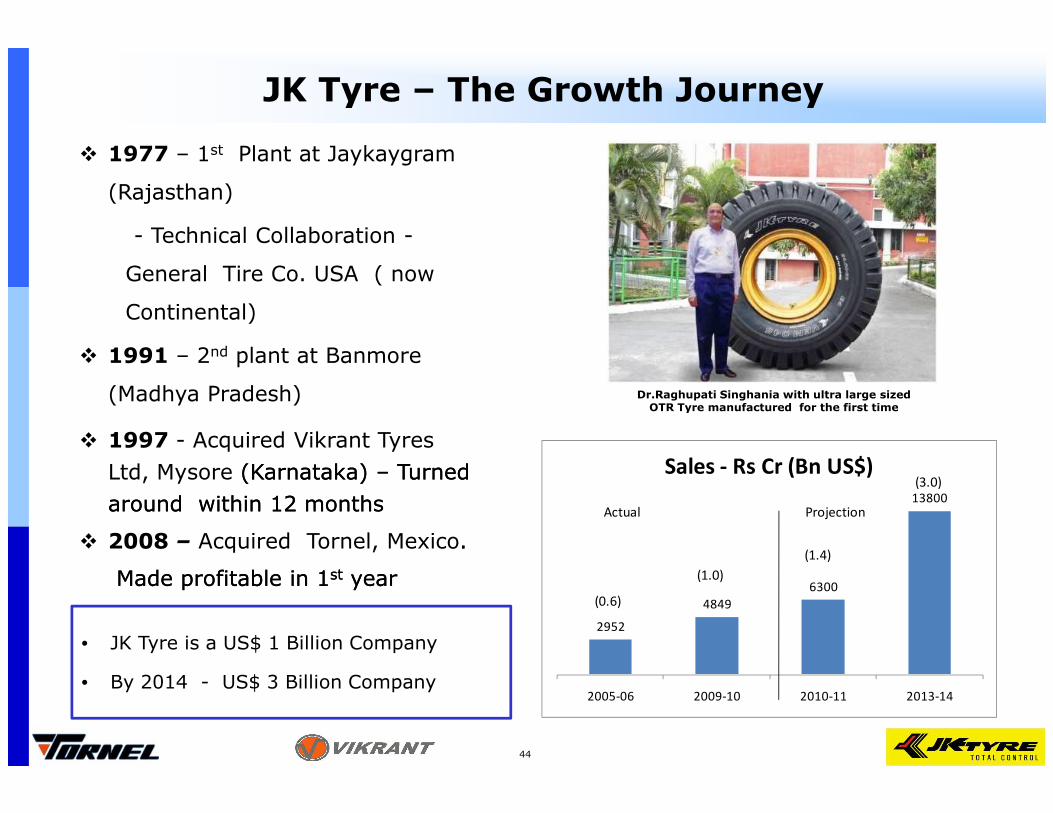
� 1977 – 1st Plant at Jaykaygram
(Rajasthan)
- Technical Collaboration -
General Tire Co. USA ( now
Continental)
� 1991 – 2nd plant at Banmore
(Madhya Pradesh)
JK Tyre – The Growth Journey
Dr.Raghupati Singhania with ultra large sized OTR Tyre manufactured for the first time
� 1997 - Acquired Vikrant Tyres
Ltd, Mysore (Karnataka) (Karnataka) –– Turned Turned
around within 12 monthsaround within 12 months
� 2008 – Acquired Tornel, Mexico..
Made profitable in 1Made profitable in 1stst yearyear
• JK Tyre is a US$ 1 Billion Company
• By 2014 - US$ 3 Billion Company 44
2952
4849
6300
13800
2005-06 2009-10 2010-11 2013-14
Sales - Rs Cr (Bn US$)
(0.6)
(1.0)
(1.4)
(3.0)
Actual Projection
OTR Tyre manufactured for the first time
44
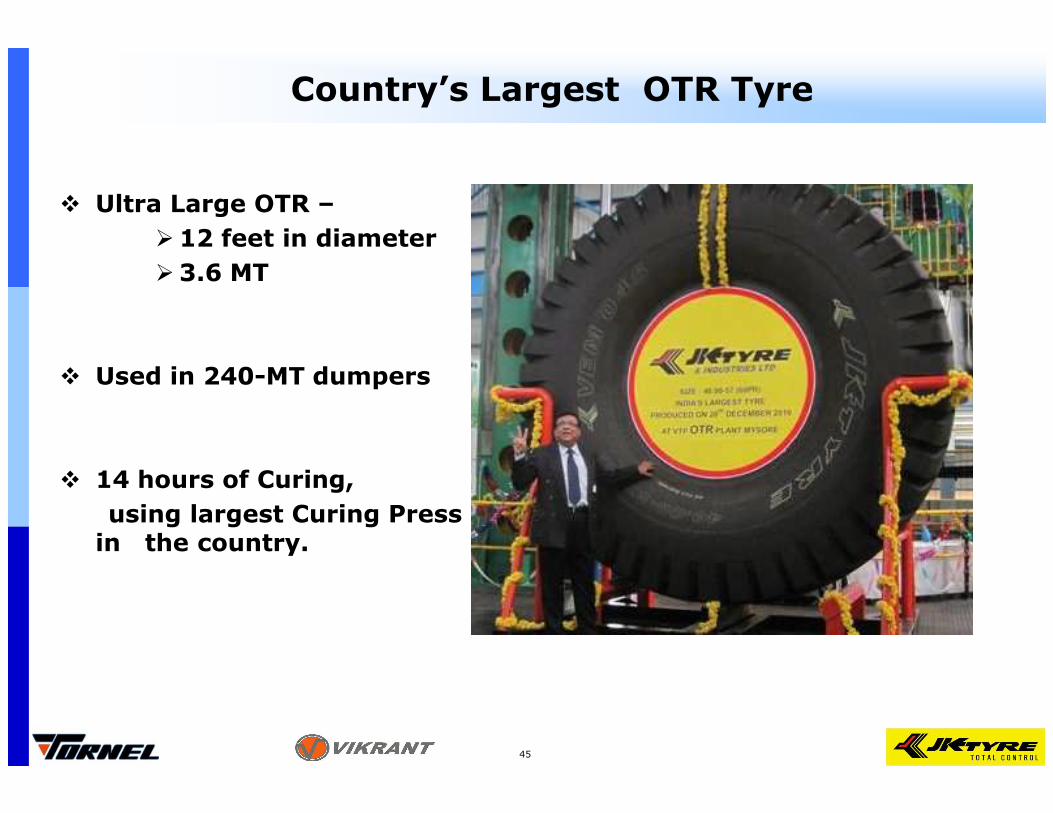
Country’s Largest OTR Tyre
� Ultra Large OTR –
�12 feet in diameter
�3.6 MT
� Used in 240-MT dumpers
� 14 hours of Curing,
using largest Curing Press in the country.
45
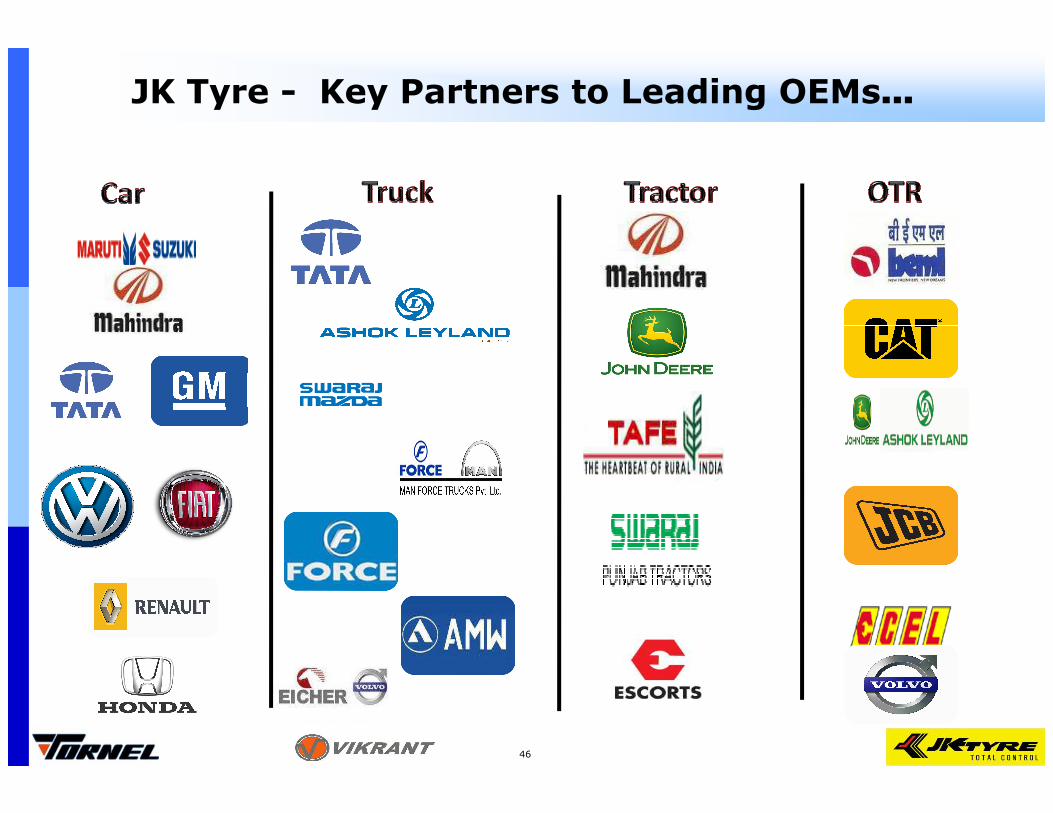
JK Tyre - Key Partners to Leading OEMs...
Maruti
Mahindra
x
x
X
X
x
x
x
46
Partnerships in Offing
47
JK Tyre – Leading Brand in India
Selected as a Super Brand -2009-10 & 2010-11 (Consumer Survey validated by the Super Brands Council)
� 75th amongst India’s 100 Most Valuable Brands 2010
48
� Export Excellence Award 2009, Federation of Karnataka Chambers of Commerce & Industry
Awards & Accolades – Recognition of efforts:
� Golden Peacock National Quality Award
� Golden Peacock Environment Award 2009
� Special Commendation for Golden Peacock Environment
Management Award – 2010 - Banmore Tyre Plant
�Annual Greentech Environment Excellence Award 2010�Annual Greentech Environment Excellence Award 2010
� National Energy Conservation Award – 2009 – KTP
� Rajasthan Energy Conservation Award – 2009 – KTP
� CII Energy Management Award – 2009 –KTP
� CII Water Management Award – 2009 –KTP
KTP – Kankroli Tyre Plant
49
Awards & Recognition (Cont.)
� India Manufacturing Excellence Gold Award 2010
� Talent Management Award from Employer Branding Institute, Mumbai
� 4th Employer Branding Award 2009 for Excellence in Training
� National CSR Award for Best Corporate Social Practices Instituted by Bombay Stock Exchange
50
50

THANKTHANKTHANKTHANK YOUYOUYOUYOUTHANKTHANKTHANKTHANK YOUYOUYOUYOU
51