eu economic challenges/opportunities - carleton
TRANSCRIPT

EU economic
challenges/opportunities

Economic Integration
• Definition (negative, positive)
• Why is economic integration important?
• Stages of integration
– Free trade agreement
– Custom union
– Common market
– Economic and monetary union
– Political union

Effects of integration are said to include:
• Static effects: – trade creation
– trade diversion
• Dynamic effects: – specialisation,
– increased competition,
– economies of scale,
– technological progress,
– increased bargaining power at an international level, and
– more rapid growth.

The First Pillar The European Community
The Single Market
The Common Agricultural Policy
Economic and Monetary Union
The Structural Funds
The Common Commercial Policy
Competition policy etc
The European Union – before the Lisbon Treaty
The Third
Pillar Justice and Home
Affairs, which
became Police and
Judicial Co-
operation in
Criminal Matters
The Second
Pillar The Common Foreign
and Security Policy

Exclusive competence
The Union has exclusive
competence to make directives and
conclude international agreements
when provided for in a Union
legislative act.
Shared competence
Member States cannot exercise
competence in areas where the
Union has done so.
Supporting competence
The Union can carry out actions to
support, coordinate or supplement
Member States' actions.
the customs union
the establishing of the competition
rules necessary for the functioning
of the internal market
monetary policy for the Member
States whose currency is the euro
the conservation of marine
biological resources under the
common fisheries policy
common commercial policy
the internal market
social policy, for the aspects defined
in this Treaty
economic, social and territorial
cohesion
agriculture and fisheries, excluding
the conservation of marine
biological resources
environment
consumer protection
transport
trans-European networks
energy
the area of freedom, security and
justice
common safety concerns in public
health matters, for the aspects
defined in this Treaty
the protection and improvement of
human health
industry
culture
tourism
education, youth, sport and
vocational training
civil protection (disaster prevention)
administrative cooperation

Eight enlargements
1952 1973 1981 1986
1990 1995 2004 2007
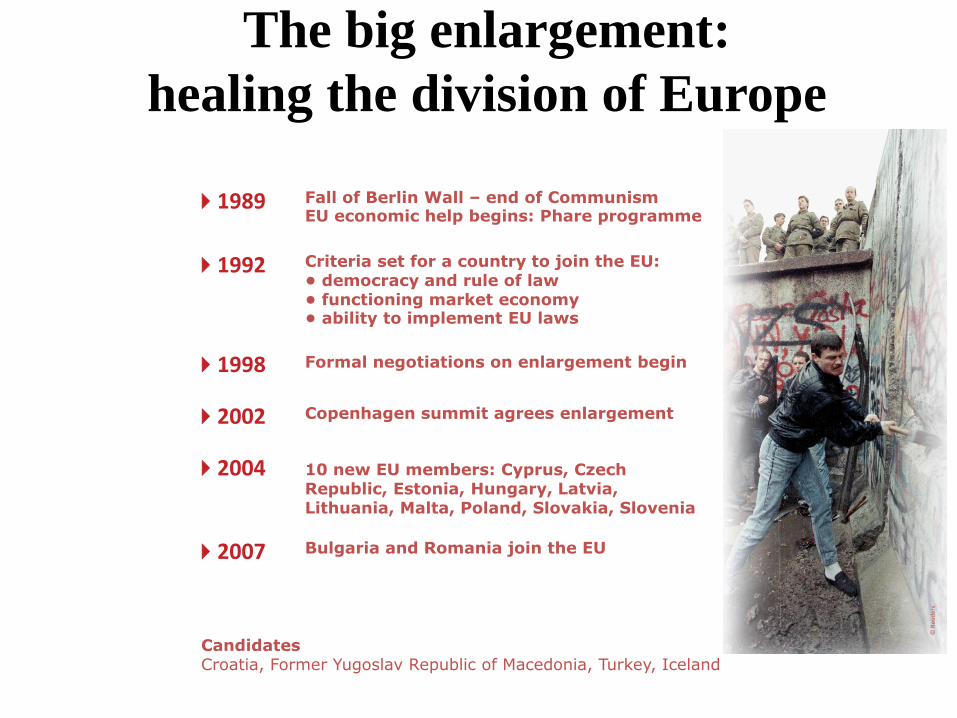
The big enlargement:
healing the division of Europe
Fall of Berlin Wall – end of Communism EU economic help begins: Phare programme
Criteria set for a country to join the EU: • democracy and rule of law • functioning market economy • ability to implement EU laws
Formal negotiations on enlargement begin
Copenhagen summit agrees enlargement
10 new EU members: Cyprus, Czech Republic, Estonia, Hungary, Latvia, Lithuania, Malta, Poland, Slovakia, Slovenia
41989
41992
41998
42002 42004
42007 Bulgaria and Romania join the EU
Candidates Croatia, Former Yugoslav Republic of Macedonia, Turkey, Iceland
© R
eud
ers

The acquis communautaire
The acquis communautaire is literally ‘what the Community has achieved’. It consists of the body (sometimes called ‘patrimony’) of EU legislation, practices, principles, and objectives accepted by the member states.
• The Treaties (the Treaties of Rome (1958), the Single European Act (1987), the Maastricht Treaty (1993), the Amsterdam Treaty (1999) and the Treaty of Nice (2003);
• Legislation enacted at the EU level and judgements of the European
Court of Justice;
• Foreign and Security Policy;
• Police and Justice Co-operation on Criminal Matters; and
• Treaties of the EU with third countries.
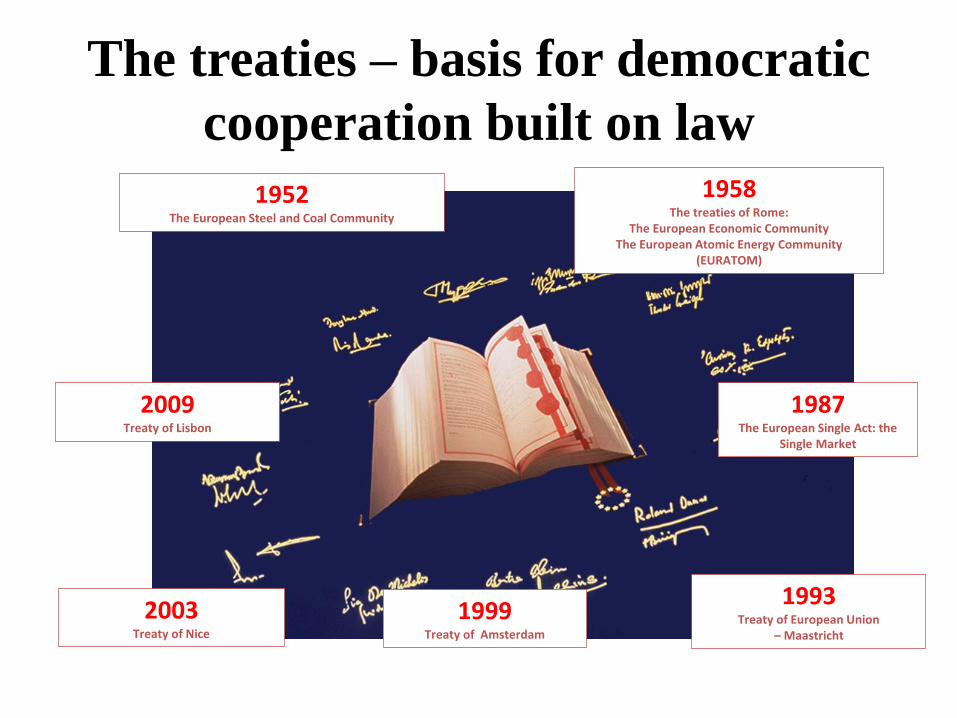
The treaties – basis for democratic
cooperation built on law
1952 The European Steel and Coal Community
1958 The treaties of Rome:
The European Economic Community The European Atomic Energy Community
(EURATOM)
1987 The European Single Act: the
Single Market
1993 Treaty of European Union
– Maastricht
1999 Treaty of Amsterdam
2003 Treaty of Nice
2009 Treaty of Lisbon

Chapters of the acquis
Criticisms?

The single market: freedom of choice
Since 1993:
4 2.5 million new jobs
4 prices of phone calls
and airfares halved Four freedoms of movement: 4 goods
4 services
4 people
4 capital
© G
etty
Imag
es

European Commission: the main non-tariff
barriers to be eliminated were:
– frontier controls;
– differences in technical specifications and standards;
– restrictions on competition for public purchases;
– restrictions on providing certain services (in particular financial and transport services) in other EC countries; and
– differences in national tax systems.

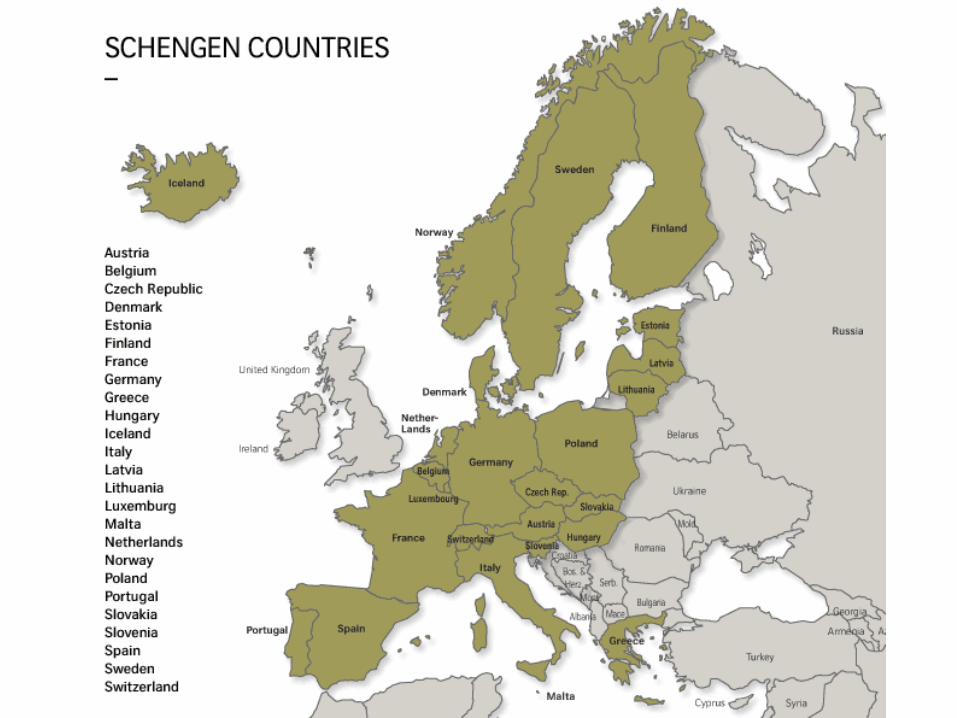
Free to move
“Schengen”:
No police or customs checks at borders
between most EU countries
Controls strengthened at EU external
borders
More cooperation between police from
different EU countries
You can buy and bring back any goods for
personal use when you travel between EU
countries
© C
orb
is

Labor mobility

Going abroad to learn
Over two million young people have studied or
pursued personal development in other European
countries with support from EU-programmes:
Comenius: school education
Erasmus: higher education
Leonardo da Vinci: vocational training
Grundtvig: adult education
Youth in Action: voluntary work and
non-formal education
© G
ett
y Im
ages

The EU programs for lifelong learning:
estimated figures for the period 2007–13.
Area concerned Name of EU
programme
Aims
School education Comenius 5 % of schoolchildren in the European
Union will participate in joint
educational activities.
Higher education Erasmus Three million students will be able to
study at universities abroad.
Vocational training Leonardo da
Vinci
Every year 80 000 people will be able
to do traineeships in companies and
training centres in another European
country.
Adult education Grundtvig 7 000 people every year will be able to
carry out educational activities abroad.
European integration
studies
Jean Monnet Support for academic research and
teaching in European integration.

Bologna Process
• European Higher Education Area:
– Named after Bologna Declaration signed in Bologna in
June 1999 by ministers of higher education from 29
European countries;
– Today: 46 countries, part of the European Cultural
Convention;
– It involves European Commission, Council of Europe
and UNESCO-CEPES, as well as representatives of
higher education institutions, students, staff, employers
and quality assurance agencies.
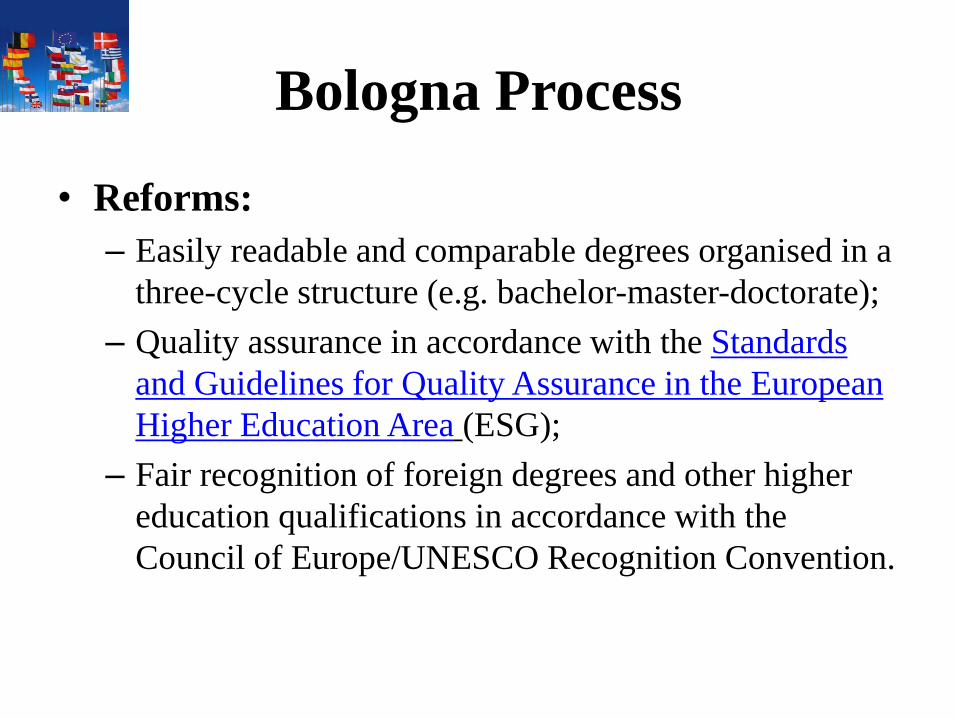
Bologna Process
• Reforms:
– Easily readable and comparable degrees organised in a
three-cycle structure (e.g. bachelor-master-doctorate);
– Quality assurance in accordance with the Standards
and Guidelines for Quality Assurance in the European
Higher Education Area (ESG);
– Fair recognition of foreign degrees and other higher
education qualifications in accordance with the
Council of Europe/UNESCO Recognition Convention.

How rich is the EU compared to the rest
of the world?
EU China Japan Russia United States EU China Japan Russia United States
12 508
1 326
3 329
468
9819
25 100
4 400
27 800
12 200
38 700
Size of economy: 2008 gross domestic product in billion of euros
Wealth per person: 2008 gross domestic product per person

GDP per inhabitant: the spread of
wealth
Lith
uan
ia
2008 GDP per inhabitant
Index where the average of the 27 EU-countries is 100
271
137
135 123 118
114
122 117
115 116 107
101 103
100 95 94
91 80 76 76
68 63 72 61
56 58
46 40
Luxe
mb
ou
rg
Ire
lan
d
Ne
the
rlan
ds
Au
stri
a
De
nm
ark
Be
lgiu
m
Swe
de
n
Fin
lan
d
Ge
rman
y
Fran
ce
Ital
y
Spai
n
EU-2
7
Cyp
rus
Gre
ece
Slo
ven
ia
Mal
ta
Po
rtu
gal
Esto
nia
Hu
nga
ry
Slo
vaki
a
Latv
ia
Po
lan
d
Ro
man
ia
Bu
lgar
ia
Un
ite
d K
ingd
om
Cze
ch R
ep
ub
lic

EU budget Budget resources
• The traditional own resources, which are tariffs on imports from third countries and agricultural levies on products such as sugar;*
• A percentage of VAT, fixed at 0.5 per cent from 2004
• The ‘fourth resource’. – The ‘fourth resource’ is based on the difference between VAT
levies and the Gross National Income (GNI) of a member state and can be levied up to a maximum percentage of the GNI of the Community (1.27 per cent in 2006) if the budget financing from the other three resources proves inadequate. The concept of GNI replaced the concept of GNP in 1995.
*minus a reimbursement to member states to cover the administrative costs of applying the levies.

Figure 11.5 Financing of the EU budget (2007)
traditional own resources 14,9%
VAT 15,4%
GNI-based pay ments 68,6%
Miscellaneous* 1%
Source: Nello (2009)
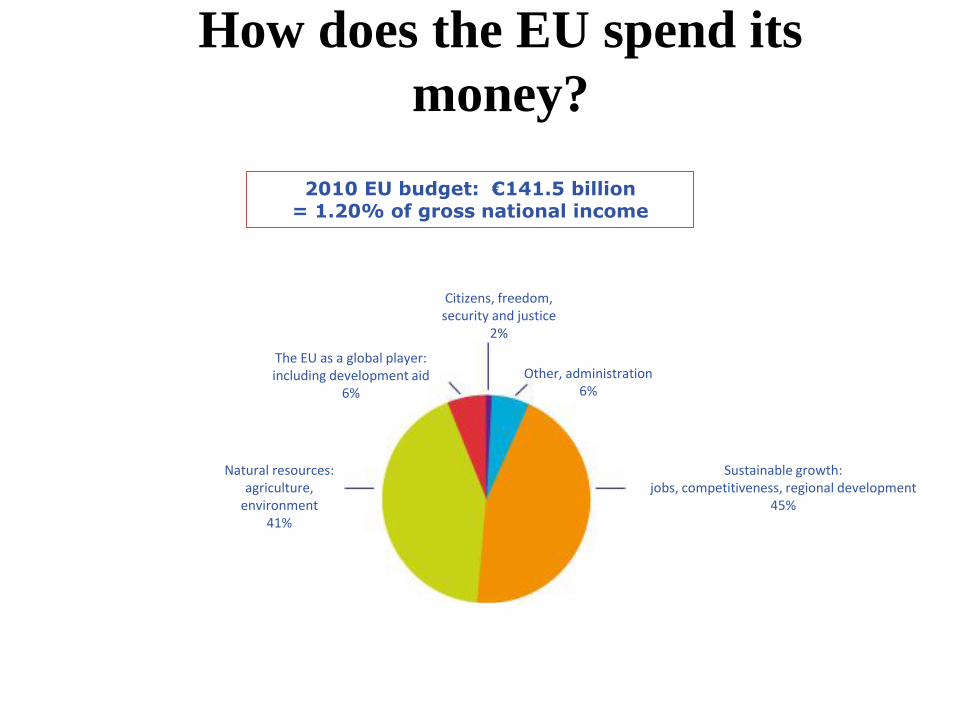
2010 EU budget: €141.5 billion = 1.20% of gross national income
Citizens, freedom, security and justice
2%
Other, administration 6%
Sustainable growth: jobs, competitiveness, regional development
45%
The EU as a global player: including development aid
6%
Natural resources: agriculture,
environment 41%
How does the EU spend its
money?


Factors influencing CAP reform
Four developments influenced (and continue to influence) the pace and shape of CAP reform:
• the weight of agricultural spending in the Community budget
• enlargement
• GATT/WTO commitments
• the concern of the public for safer food and more environmentally favourable agriculture
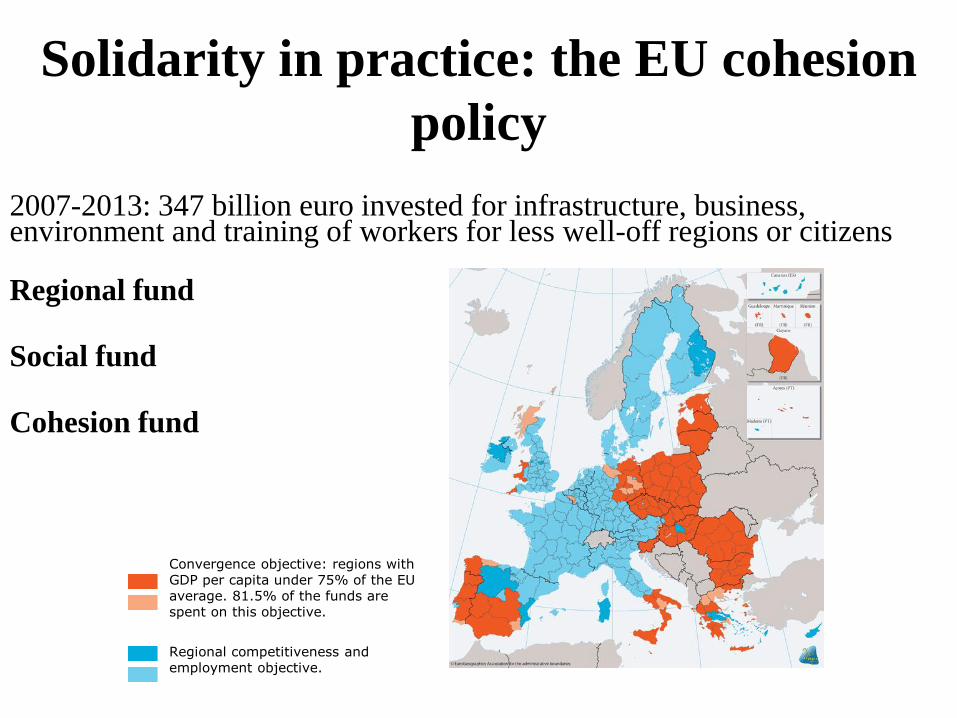
Solidarity in practice: the EU cohesion
policy
2007-2013: 347 billion euro invested for infrastructure, business, environment and training of workers for less well-off regions or citizens
Regional fund Social fund Cohesion fund
Convergence objective: regions with GDP per capita under 75% of the EU average. 81.5% of the funds are spent on this objective.
Regional competitiveness and employment objective.

© Baldwin&Wyplosz The Economics of European
Integration 28
Europe’s Economic Geography: Facts • Europe highly centralised
in terms of economic
activity.
– western Germany, Benelux
nations, N.E. France and
S.E. England have 1/7th
land, but 1/3rd of pop. & ½
GDP
• Periphery has lower
standard of living
– More unemployment
• Especially among youth
– More poverty
Periphery
Centrality of EU25
Regions
Intermediate
Core
Periphery
Centrality of EU25
Regions
Intermediate
Core

© Baldwin&Wyplosz The Economics of European
Integration 29
Geographic income inequality
• Very uneven income
distribution,
geographically
• 2002 income/pop by
nation
• Luxembourg is 207%
of EU average
• Bulgaria only 29% of
EU average
0 50 100 150 200 250
BulgariaRomaniaLithuania
LatviaEstoniaPoland
SlovakiaHungry
CzechiaGreece
SloveniaPortugalCyprus
SpainFrance
ItalyFinland
UKSwedenGermanBelgiumAustria
NLIreland
DKLux.
EU26=100

© Baldwin&Wyplosz The Economics of European
Integration 30
Geographic income inequality • Income distribution
even more uneven at
regional level.
• Within nation
economic activity is
very unevenly
distributed
• Income distribution
has become:
– More even in EU15
– Less even within
EU15 nations (by
region)
Guyane (F)
Guadeloupe
(F)
Martinique
(F)
RÈunion
(F)
Canarias (E)
AÁores (P)
Madeira
(P)
Kypros
Index, EUR-26 = 100
< 30
30 - 50
50 - 75
75 - 100
100 - 125
>= 125
no data
Source: Eurostat
0 km100 500
REGIO.A1- GIS/HP/(statmap) - m98001_uk_C_A4P - 09 Jan 01
SIG16SIG16
© MEGRIN for the administrative boundaries
GDP per head by region (PPS), 1998
< 30
30 - 50
50 - 75
75 - 100
100 - 125
>= 125
Index, EU-25 = 100
< 30
30 - 50
50 - 75
75 - 100
100 - 125
>= 125
Index, EU-25 = 100
< 30
30 - 50
50 - 75
75 - 100
100 - 125
>= 125
Index, EU-25 = 100

The euro – a single currency for
Europeans
EU countries using the euro
EU countries not using the euro
Can be used everywhere in the euro area
Coins: one side with national symbols,
one side common
Notes: no national side

Maastricht Treaty model of EMU
• Monetary arrangement = full centralization of
monetary policies represented by European Central
Bank (established 1998) and the System of
European Central Banks
• Fiscal arrangement = fiscal coordination,
regulated by Stability and Growth Pact (adopted
1997 in Amsterdam, reformed in 2005)

Benefits of EMU
• Better condition for single market, integration of markets for goods, services and factors
• More transparent prices, prices in different countries directly comparable
• In situation of stable prices, interest rates and exchange rates, decrease of volatility in trade and investments, no exchange rate risk and uncertainty
• Lower transaction costs for citizens and businesses
• Euro as a world currency, saving on national reserves of foreign currencies
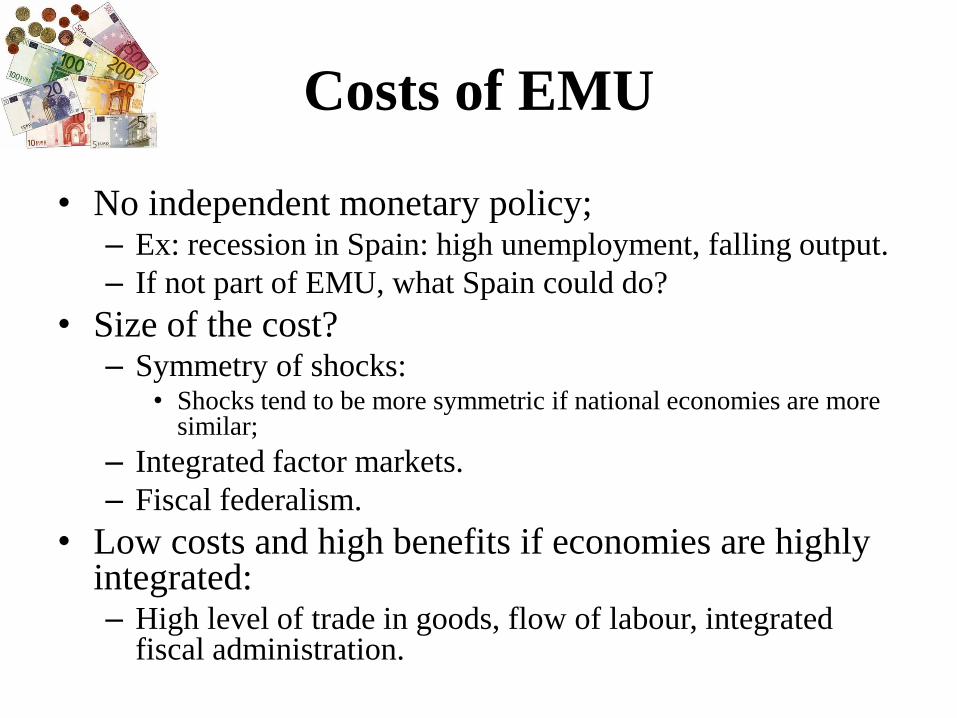
Costs of EMU
• No independent monetary policy; – Ex: recession in Spain: high unemployment, falling output.
– If not part of EMU, what Spain could do?
• Size of the cost? – Symmetry of shocks:
• Shocks tend to be more symmetric if national economies are more similar;
– Integrated factor markets.
– Fiscal federalism.
• Low costs and high benefits if economies are highly integrated: – High level of trade in goods, flow of labour, integrated
fiscal administration.

The EU – a major trading power
Share of world trade in goods (2007)
Share of world trade in services (2007)
Others 53.2%
EU 17%
United States 14.5%
Japan 5.8%
China 9.5%
Others 40.6%
EU 28.5%
United States 18.2%
Japan 6.8%
China 5.9%

The EU is the biggest provider of development aid
in the world
Official development assistance per citizen, 2007
93€
44€
53€
EU Japan United States
The EU provides 60% of all development aid