current condition of the yamuna river - an overview of flow
TRANSCRIPT
Current condition of the Yamuna River - an overview of flow, pollution load and human use
Deepshikha Sharma and Arun Kansal, TERI University
Introduction
Yamuna is the sub-basin of the Ganga river system. Out of the total catchment’s area of 861404 sq km of the Ganga basin, the Yamuna River and its catchment together contribute to a total of 345848 sq. km area which 40.14% of total Ganga River Basin (CPCB, 1980-81; CPCB, 1982-83). It is a large basin covering seven Indian states. The river water is used for both abstractive and in stream uses like irrigation, domestic water supply, industrial etc. It has been subjected to over exploitation, both in quantity and quality. Given that a large population is dependent on the river, it is of significance to preserve its water quality. The river is polluted by both point and non-point sources, where National Capital Territory (NCT) – Delhi is the major contributor, followed by Agra and Mathura. Approximately, 85% of the total pollution is from domestic source. The condition deteriorates further due to significant water abstraction which reduces the dilution capacity of the river. The stretch between Wazirabad barrage and Chambal river confluence is critically polluted and 22km of Delhi stretch is the maximum polluted amongst all. In order to restore the quality of river, the Government of India (GoI) initiated the Yamuna Action Plan (YAP) in the1993and later YAPII in the year 2004 (CPCB, 2006-07).
Yamuna river basin
River Yamuna (Figure 1) is the largest tributary of the River Ganga. The main stream of the river Yamuna originates from the Yamunotri glacier near Bandar Punch (38o 59' N 78o 27' E) in the Mussourie range of the lower Himalayas at an elevation of about 6320 meter above mean sea level in the district Uttarkashi (Uttranchal). The catchment (table 1&2) of the Yamuna river system covers parts of the states of Uttaranchal, Uttar Pradesh (U.P.), Himachal Pradesh, Haryana, Rajasthan, Madhya Pradesh and the entire state of Delhi. The river Yamuna traverses a distance of about 1370 km in the plain from Saharanpur district of Uttar Pradesh to the confluence with river Ganga at Allahabad. The major tributaries of the river are Tons, Betwa, Chambal, Ken and Sindh and these together contribute 70.9% of the catchment area and balance 29.1% is the direct drainage of main River and smaller tributaries. On the basis of area, the catchment basin of Yamuna amounts to 40.2% of the Ganga Basin and 10.7% of the country.
Table 1: The catchment of River Yamuna
Name of state Total catchment area in Yamuna (in Sq. Km.) %age contribution U.P. (including Uttranchal) 74208 21.5 Himachal Pradesh 5799 1.6 Haryana 21265 6.5 Rajasthan 102883 29.8 Madhya Pradesh 14028 40.6 Delhi 1485 0.4
Source: CPCB, 2006
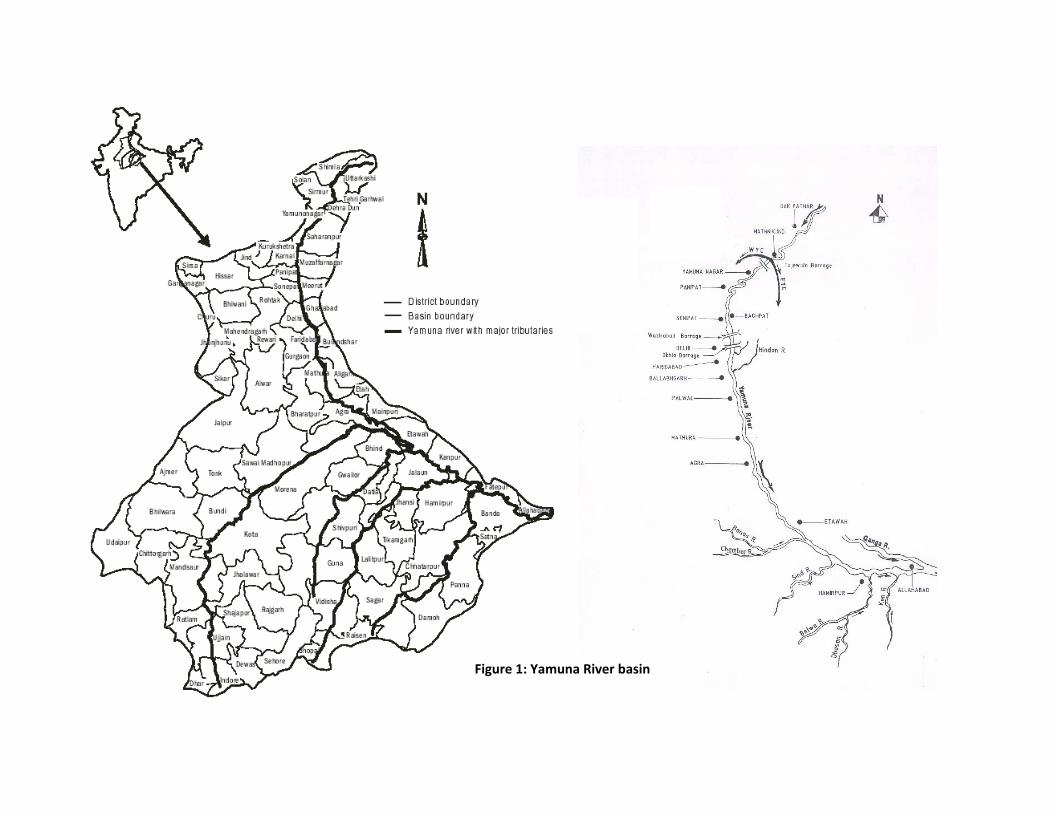
Figure 1: Yamuna River basin
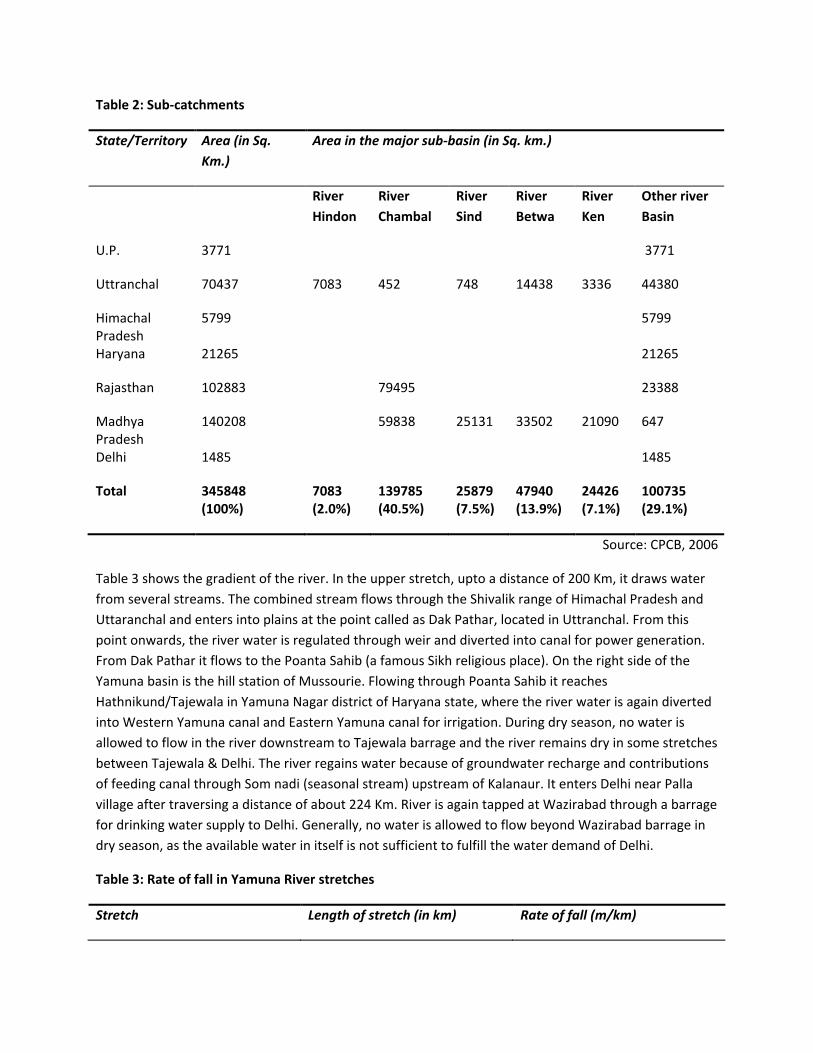
Table 2: Sub-catchments
State/Territory Area (in Sq. Km.)
Area in the major sub-basin (in Sq. km.)
River Hindon
River Chambal
River Sind
River Betwa
River Ken
Other river Basin
U.P. 3771 3771
Uttranchal 70437 7083 452 748 14438 3336 44380
Himachal Pradesh
5799 5799
Haryana 21265 21265
Rajasthan 102883 79495 23388
Madhya Pradesh
140208 59838 25131 33502 21090 647
Delhi 1485 1485
Total 345848 (100%)
7083 (2.0%)
139785 (40.5%)
25879 (7.5%)
47940 (13.9%)
24426 (7.1%)
100735 (29.1%)
Source: CPCB, 2006
Table 3 shows the gradient of the river. In the upper stretch, upto a distance of 200 Km, it draws water from several streams. The combined stream flows through the Shivalik range of Himachal Pradesh and Uttaranchal and enters into plains at the point called as Dak Pathar, located in Uttranchal. From this point onwards, the river water is regulated through weir and diverted into canal for power generation. From Dak Pathar it flows to the Poanta Sahib (a famous Sikh religious place). On the right side of the Yamuna basin is the hill station of Mussourie. Flowing through Poanta Sahib it reaches Hathnikund/Tajewala in Yamuna Nagar district of Haryana state, where the river water is again diverted into Western Yamuna canal and Eastern Yamuna canal for irrigation. During dry season, no water is allowed to flow in the river downstream to Tajewala barrage and the river remains dry in some stretches between Tajewala & Delhi. The river regains water because of groundwater recharge and contributions of feeding canal through Som nadi (seasonal stream) upstream of Kalanaur. It enters Delhi near Palla village after traversing a distance of about 224 Km. River is again tapped at Wazirabad through a barrage for drinking water supply to Delhi. Generally, no water is allowed to flow beyond Wazirabad barrage in dry season, as the available water in itself is not sufficient to fulfill the water demand of Delhi.
Table 3: Rate of fall in Yamuna River stretches
Stretch Length of stretch (in km) Rate of fall (m/km)
Upper Himalaya Stretch 25 59.0
Himalaya Stretch 152 19.1
Total Plain Stretch 1224 o.2
Lower Plain Stretch 768 o.o8
Source: CPCB, 2006
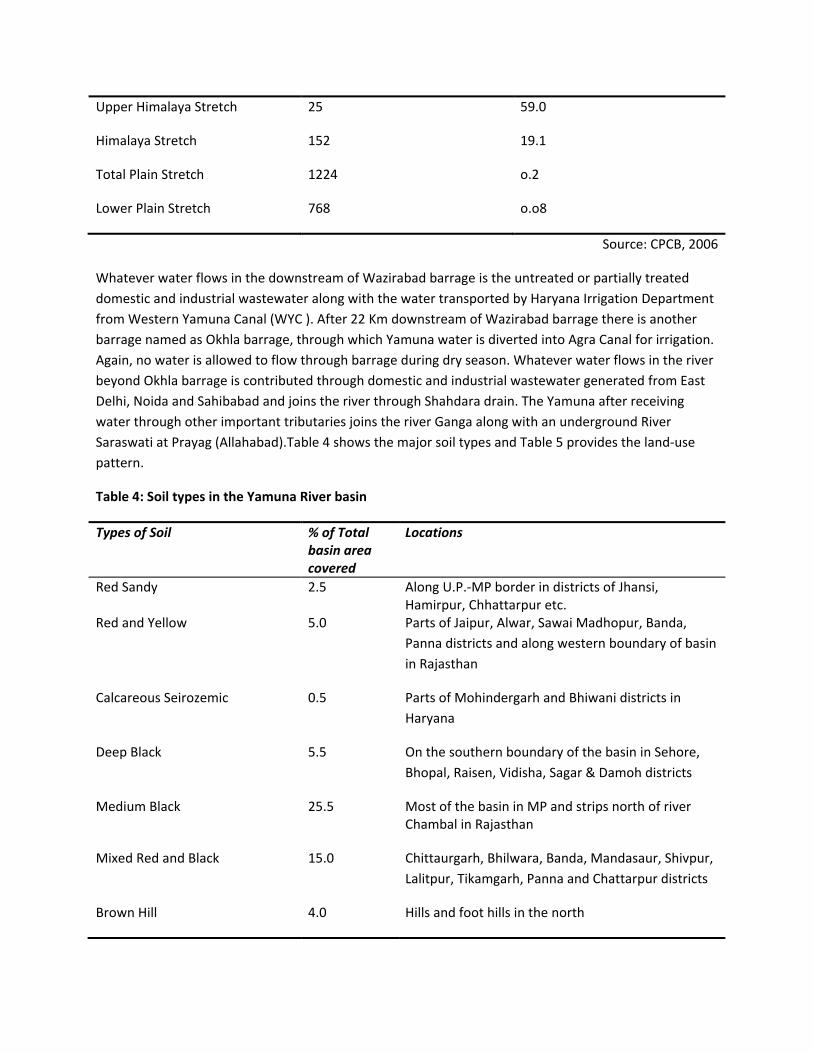
Whatever water flows in the downstream of Wazirabad barrage is the untreated or partially treated domestic and industrial wastewater along with the water transported by Haryana Irrigation Department from Western Yamuna Canal (WYC ). After 22 Km downstream of Wazirabad barrage there is another barrage named as Okhla barrage, through which Yamuna water is diverted into Agra Canal for irrigation. Again, no water is allowed to flow through barrage during dry season. Whatever water flows in the river beyond Okhla barrage is contributed through domestic and industrial wastewater generated from East Delhi, Noida and Sahibabad and joins the river through Shahdara drain. The Yamuna after receiving water through other important tributaries joins the river Ganga along with an underground River Saraswati at Prayag (Allahabad).Table 4 shows the major soil types and Table 5 provides the land-use pattern.
Table 4: Soil types in the Yamuna River basin
Types of Soil % of Total basin area covered
Locations
Red Sandy 2.5 Along U.P.-MP border in districts of Jhansi, Hamirpur, Chhattarpur etc.
Red and Yellow 5.0 Parts of Jaipur, Alwar, Sawai Madhopur, Banda, Panna districts and along western boundary of basin in Rajasthan
Calcareous Seirozemic 0.5 Parts of Mohindergarh and Bhiwani districts in Haryana
Deep Black 5.5 On the southern boundary of the basin in Sehore, Bhopal, Raisen, Vidisha, Sagar & Damoh districts
Medium Black 25.5 Most of the basin in MP and strips north of river Chambal in Rajasthan
Mixed Red and Black 15.0 Chittaurgarh, Bhilwara, Banda, Mandasaur, Shivpur, Lalitpur, Tikamgarh, Panna and Chattarpur districts
Brown Hill 4.0 Hills and foot hills in the north
Alluvial 42.0 Plains and valleys
Source: CPCB, 2006
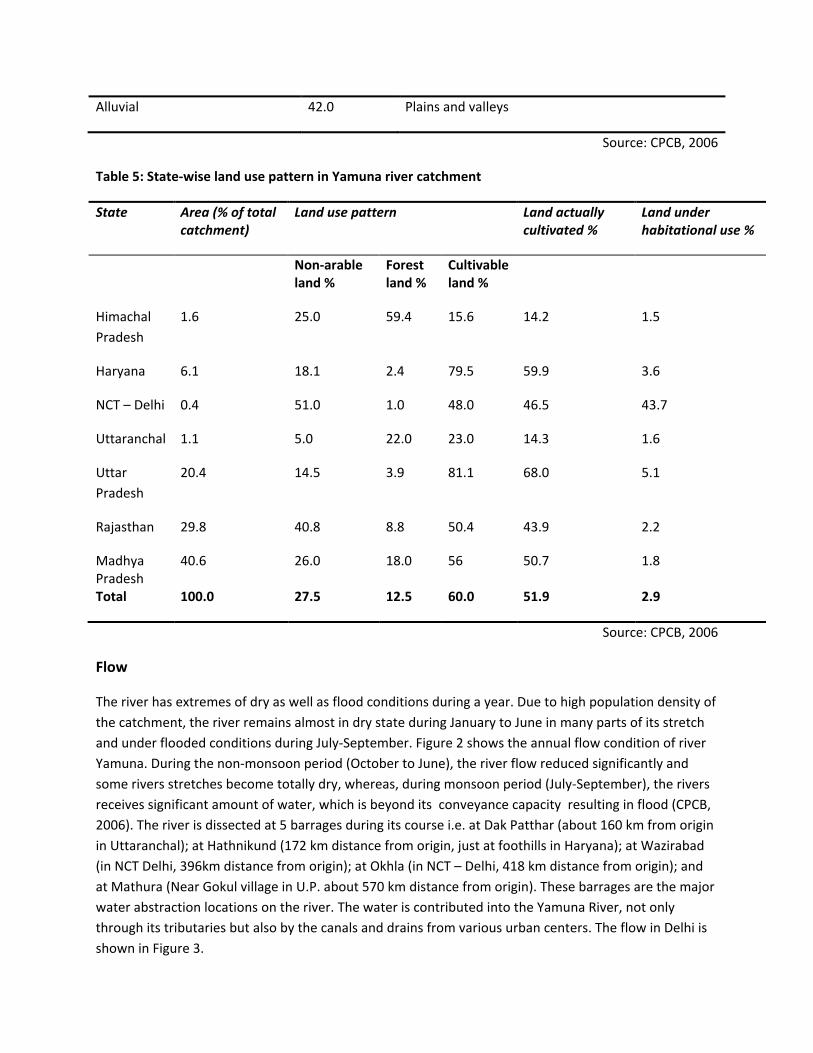
Table 5: State-wise land use pattern in Yamuna river catchment
State Area (% of total catchment)
Land use pattern Land actually cultivated %
Land under habitational use %
Non-arable land %
Forest land %
Cultivable land %
Himachal Pradesh
1.6 25.0 59.4 15.6 14.2 1.5
Haryana 6.1 18.1 2.4 79.5 59.9 3.6
NCT – Delhi 0.4 51.0 1.0 48.0 46.5 43.7
Uttaranchal 1.1 5.0 22.0 23.0 14.3 1.6
Uttar Pradesh
20.4 14.5 3.9 81.1 68.0 5.1
Rajasthan 29.8 40.8 8.8 50.4 43.9 2.2
Madhya Pradesh
40.6 26.0 18.0 56 50.7 1.8
Total 100.0 27.5 12.5 60.0 51.9 2.9
Source: CPCB, 2006
Flow
The river has extremes of dry as well as flood conditions during a year. Due to high population density of the catchment, the river remains almost in dry state during January to June in many parts of its stretch and under flooded conditions during July-September. Figure 2 shows the annual flow condition of river Yamuna. During the non-monsoon period (October to June), the river flow reduced significantly and some rivers stretches become totally dry, whereas, during monsoon period (July-September), the rivers receives significant amount of water, which is beyond its conveyance capacity resulting in flood (CPCB, 2006). The river is dissected at 5 barrages during its course i.e. at Dak Patthar (about 160 km from origin in Uttaranchal); at Hathnikund (172 km distance from origin, just at foothills in Haryana); at Wazirabad (in NCT Delhi, 396km distance from origin); at Okhla (in NCT – Delhi, 418 km distance from origin); and at Mathura (Near Gokul village in U.P. about 570 km distance from origin). These barrages are the major water abstraction locations on the river. The water is contributed into the Yamuna River, not only through its tributaries but also by the canals and drains from various urban centers. The flow in Delhi is shown in Figure 3.
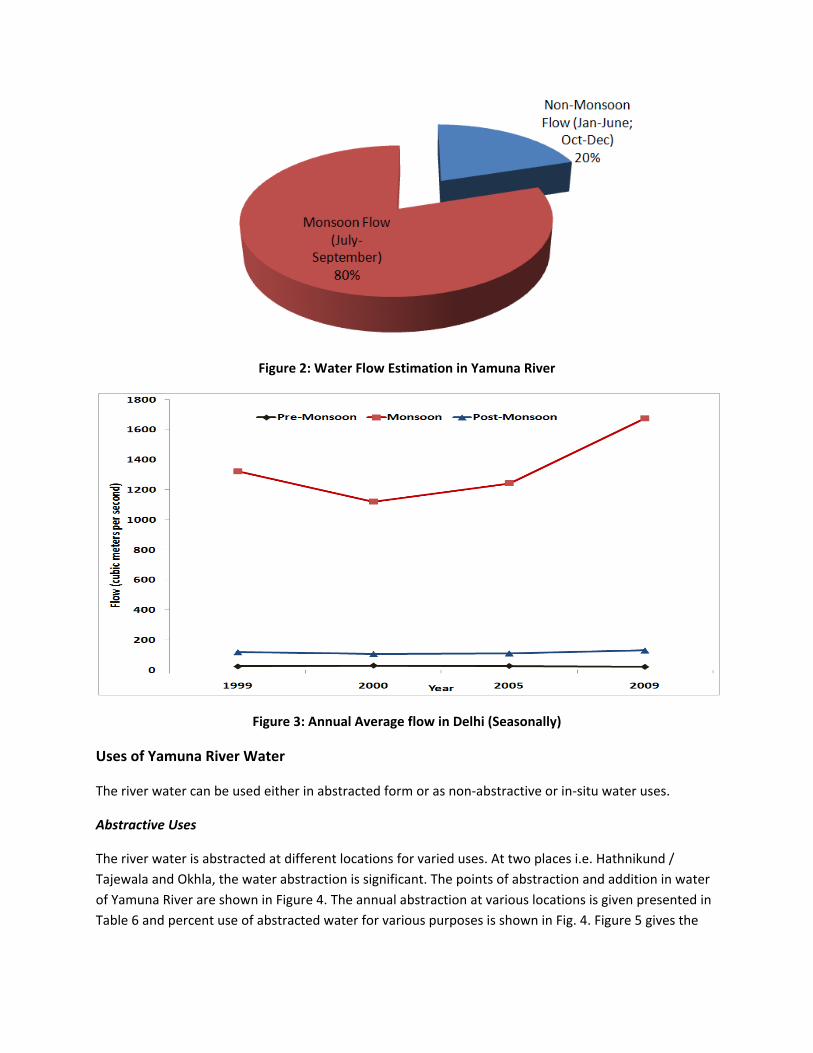
Figure 2: Water Flow Estimation in Yamuna River
Figure 3: Annual Average flow in Delhi (Seasonally)
Uses of Yamuna River Water
The river water can be used either in abstracted form or as non-abstractive or in-situ water uses.
Abstractive Uses
The river water is abstracted at different locations for varied uses. At two places i.e. Hathnikund / Tajewala and Okhla, the water abstraction is significant. The points of abstraction and addition in water of Yamuna River are shown in Figure 4. The annual abstraction at various locations is given presented in Table 6 and percent use of abstracted water for various purposes is shown in Fig. 4. Figure 5 gives the
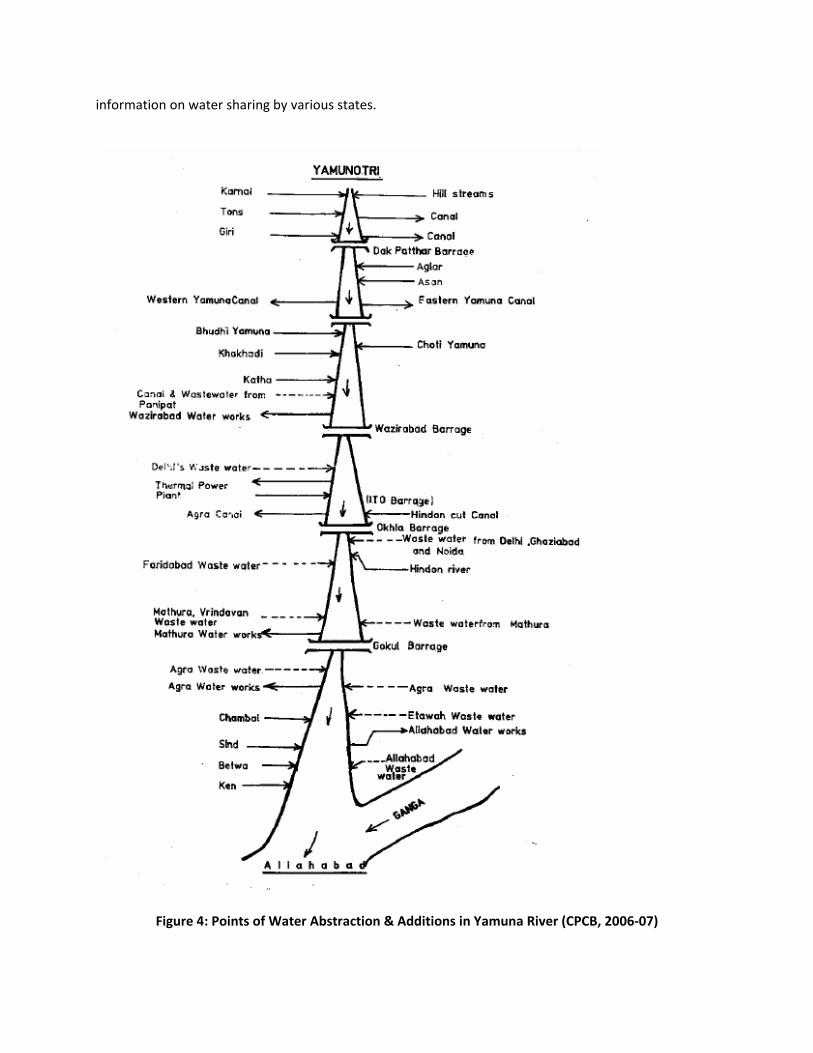
information on water sharing by various states.
Figure 4: Points of Water Abstraction & Additions in Yamuna River (CPCB, 2006-07)
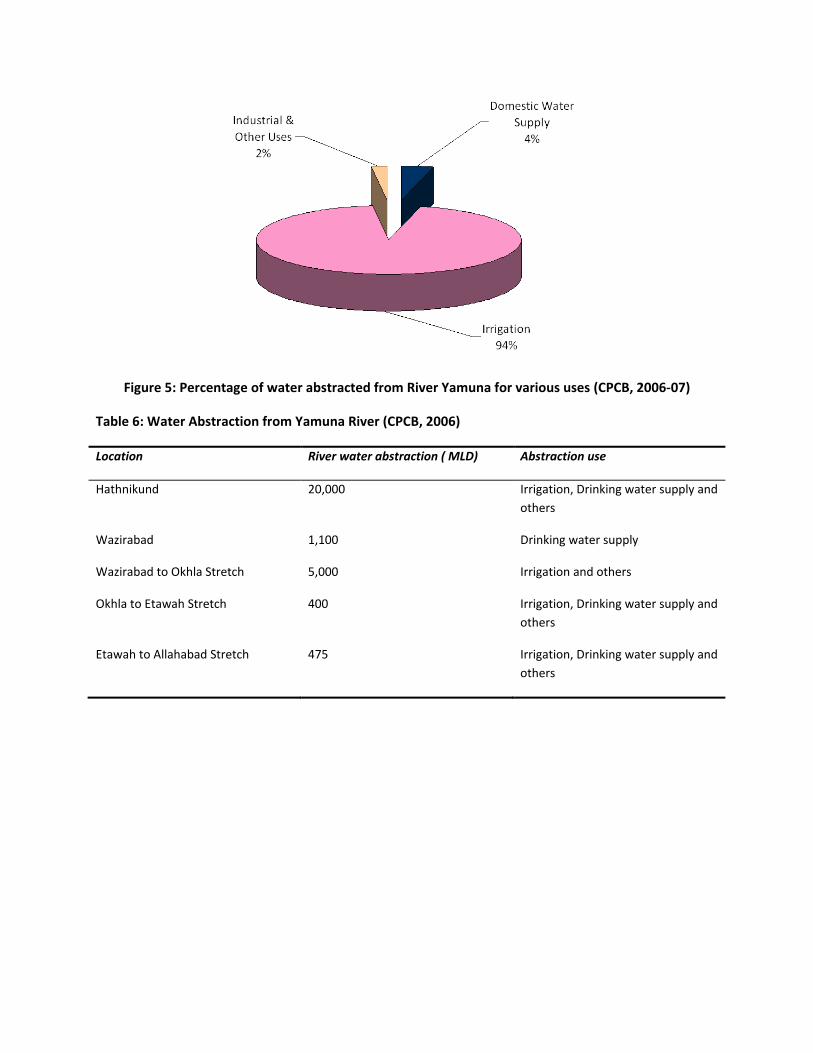
Figure 5: Percentage of water abstracted from River Yamuna for various uses (CPCB, 2006-07)
Table 6: Water Abstraction from Yamuna River (CPCB, 2006)
Location River water abstraction ( MLD) Abstraction use
Hathnikund 20,000 Irrigation, Drinking water supply and others
Wazirabad 1,100 Drinking water supply
Wazirabad to Okhla Stretch 5,000 Irrigation and others
Okhla to Etawah Stretch 400 Irrigation, Drinking water supply and others
Etawah to Allahabad Stretch 475 Irrigation, Drinking water supply and others
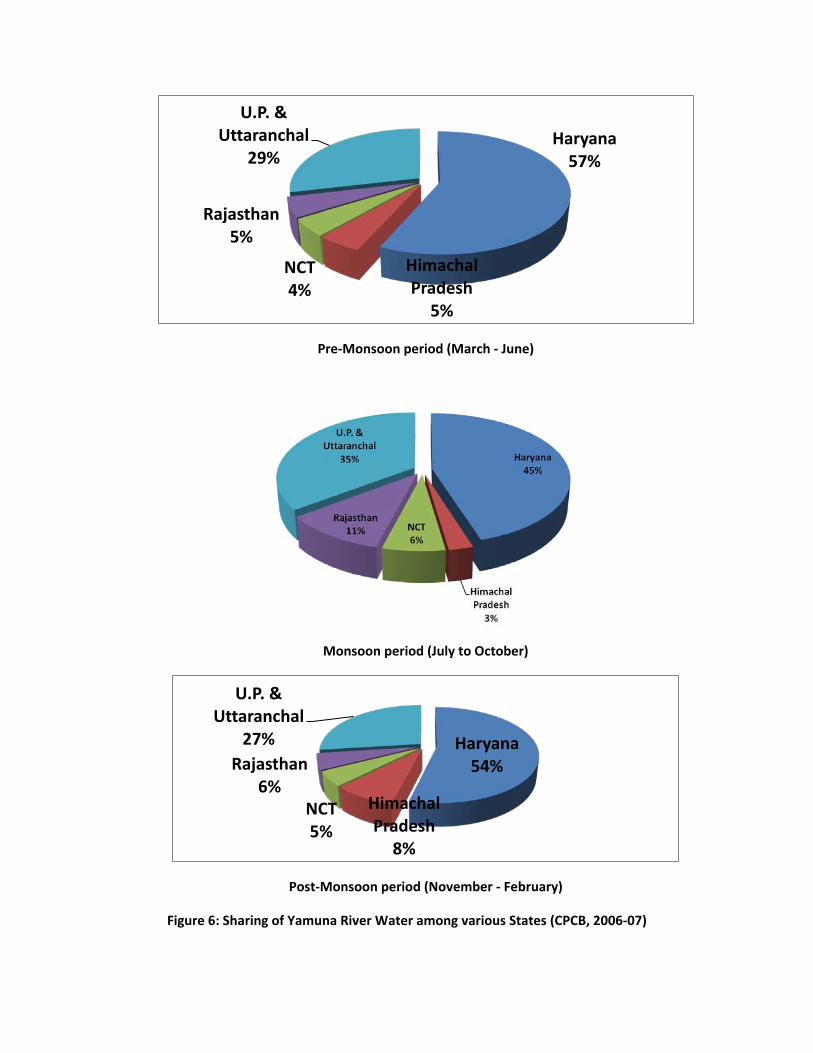
Pre-Monsoon period (March - June)
Monsoon period (July to October)
Post-Monsoon period (November - February)
Figure 6: Sharing of Yamuna River Water among various States (CPCB, 2006-07)
Haryana57%
Himachal Pradesh
5%
NCT4%
Rajasthan5%
U.P. & Uttaranchal
29%
Haryana54%
Himachal Pradesh
8%
NCT5%
Rajasthan6%
U.P. & Uttaranchal
27%
Domestic Water Supplies
Significant use of Yamuna water for domestic water supply is found in urban agglomerations like Delhi, Mathura, Agra and Allahabad.
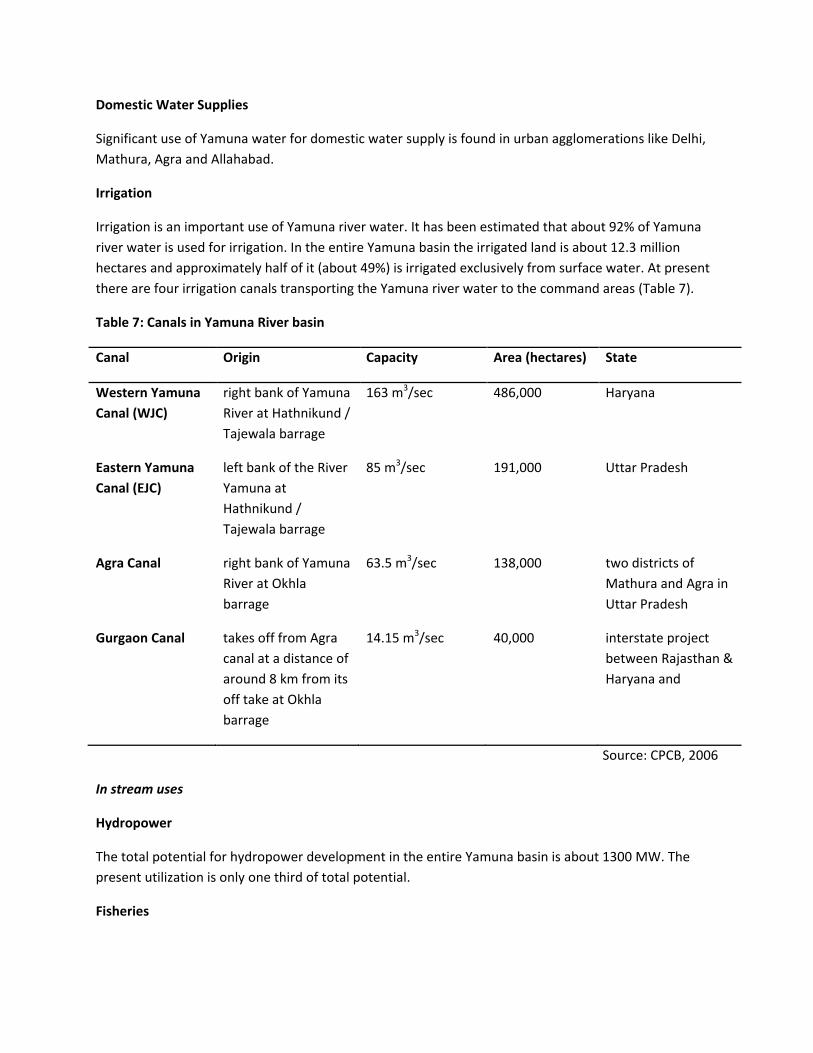
Irrigation
Irrigation is an important use of Yamuna river water. It has been estimated that about 92% of Yamuna river water is used for irrigation. In the entire Yamuna basin the irrigated land is about 12.3 million hectares and approximately half of it (about 49%) is irrigated exclusively from surface water. At present there are four irrigation canals transporting the Yamuna river water to the command areas (Table 7).
Table 7: Canals in Yamuna River basin
Canal Origin Capacity Area (hectares) State
Western Yamuna Canal (WJC)
right bank of Yamuna River at Hathnikund / Tajewala barrage
163 m3/sec 486,000 Haryana
Eastern Yamuna Canal (EJC)
left bank of the River Yamuna at Hathnikund / Tajewala barrage
85 m3/sec 191,000 Uttar Pradesh
Agra Canal right bank of Yamuna River at Okhla barrage
63.5 m3/sec 138,000 two districts of Mathura and Agra in Uttar Pradesh
Gurgaon Canal takes off from Agra canal at a distance of around 8 km from its off take at Okhla barrage
14.15 m3/sec 40,000 interstate project between Rajasthan & Haryana and
Source: CPCB, 2006
In stream uses
Hydropower
The total potential for hydropower development in the entire Yamuna basin is about 1300 MW. The present utilization is only one third of total potential.
Fisheries

The Pisciculture is neither practiced on large scale nor undertaken in organized manner in the area. However, the entire river stretch and tributaries is being utilized for fishing in unorganized manner.
Growing aquatic plants
The most prevalent aquatic plant in River Yamuna is the water hyacinth, mostly found near barrages.
Navigation
River Yamuna and its tributaries are not suitable for Navigation. Low flow of river further restricts this activity. However, some potential exists to use the stretch between Agra and Allahabad for navigation.
River bathing and washing
River bathing and washing is one of the most prevalent uses of river water in the country. Much of this is attributable due to religious rituals.
Recreational uses
The Yamuna River is used very rarely for recreational purpose due to unsuitable conditions like rocky river bed, low water depth etc. However, at urban centers and at various barrages it has the potential for water sports like boating.
Cattle bathing and washing
It is estimated that about 70% of the total cattle population in the Yamuna basin uses flowing water of river and canals for bathing and watering purposes directly which impacts water quality substantially (CPCB, 2006-07).
Pollution sources of River Yamuna
In India, Central Pollution Control Board (CPCB), Central Water Commission (CWC), Delhi Pollution Control Committee (DPCC), State Pollution Control Board (SPCB) regularly monitors River Yamuna at 19 locations along with its main tributary, the Chambal River at Udi. In addition, twenty eight major drain outfalls into Yamuna are also being monitored. The organic pollution level increase significantly at Delhi and the biochemical oxygen demand (BOD) level do not confirm to the stipulated standard for Class C category till the confluence of river Chambal. The same stretch of the river shows fluctuations in dissolved oxygen (DO) level from Nil to well above saturation level. This reflects the presence of organic pollution load and prevalence of eutrophic conditions. Bacteriological contamination is significantly high in the entire Yamuna River stretch. The annual average values for DO and BOD of March-June months are given in figure 7 and 8. Figure 9 and 10 shows the annual average of TKN and Total Coliform (TC) in the river Yamuna.
Amongst the heavy metals, Cadmium, Nickel and Lead are scantly present in the river, whereas, zinc and iron are generally present. Among pesticides, BHC is present in some stretch, whereas other monitored pesticides e.g. Aldrin, Dieldrin, endosulfan, and DDT are rare. The micro-pollutants are generally
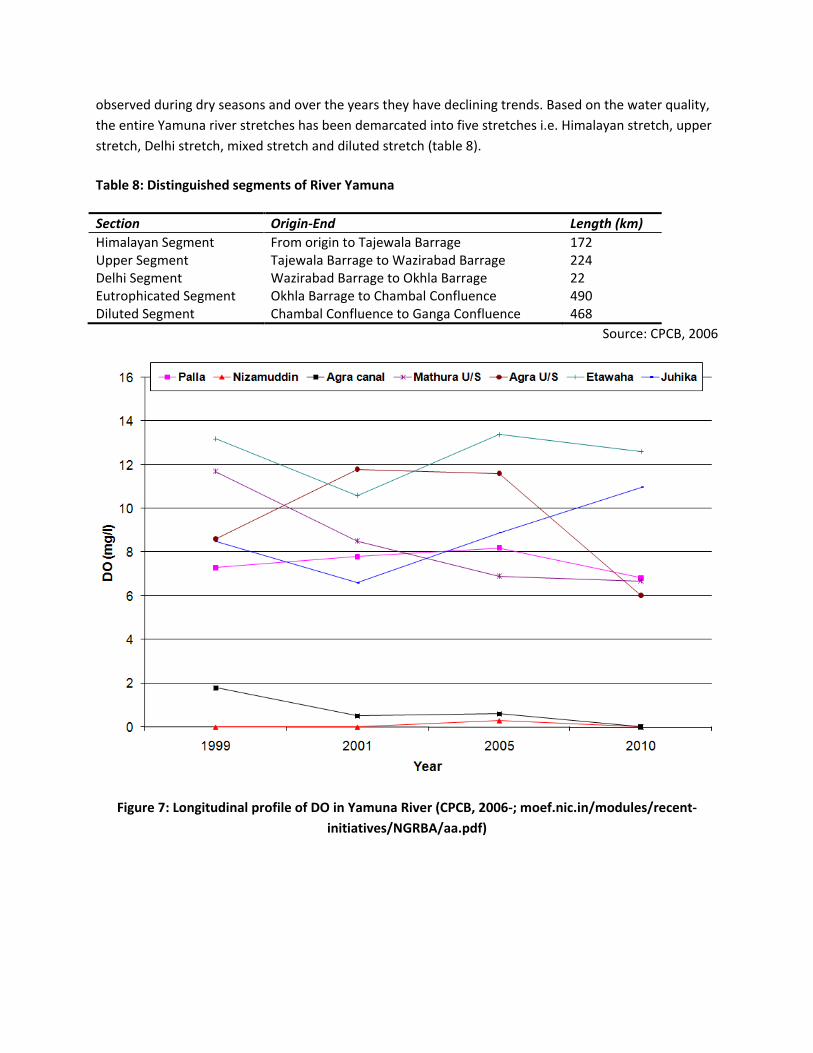
observed during dry seasons and over the years they have declining trends. Based on the water quality, the entire Yamuna river stretches has been demarcated into five stretches i.e. Himalayan stretch, upper stretch, Delhi stretch, mixed stretch and diluted stretch (table 8).
Table 8: Distinguished segments of River Yamuna
Section Origin-End Length (km) Himalayan Segment From origin to Tajewala Barrage 172 Upper Segment Tajewala Barrage to Wazirabad Barrage 224 Delhi Segment Wazirabad Barrage to Okhla Barrage 22 Eutrophicated Segment Okhla Barrage to Chambal Confluence 490 Diluted Segment Chambal Confluence to Ganga Confluence 468
Source: CPCB, 2006
Figure 7: Longitudinal profile of DO in Yamuna River (CPCB, 2006-; moef.nic.in/modules/recent-initiatives/NGRBA/aa.pdf)
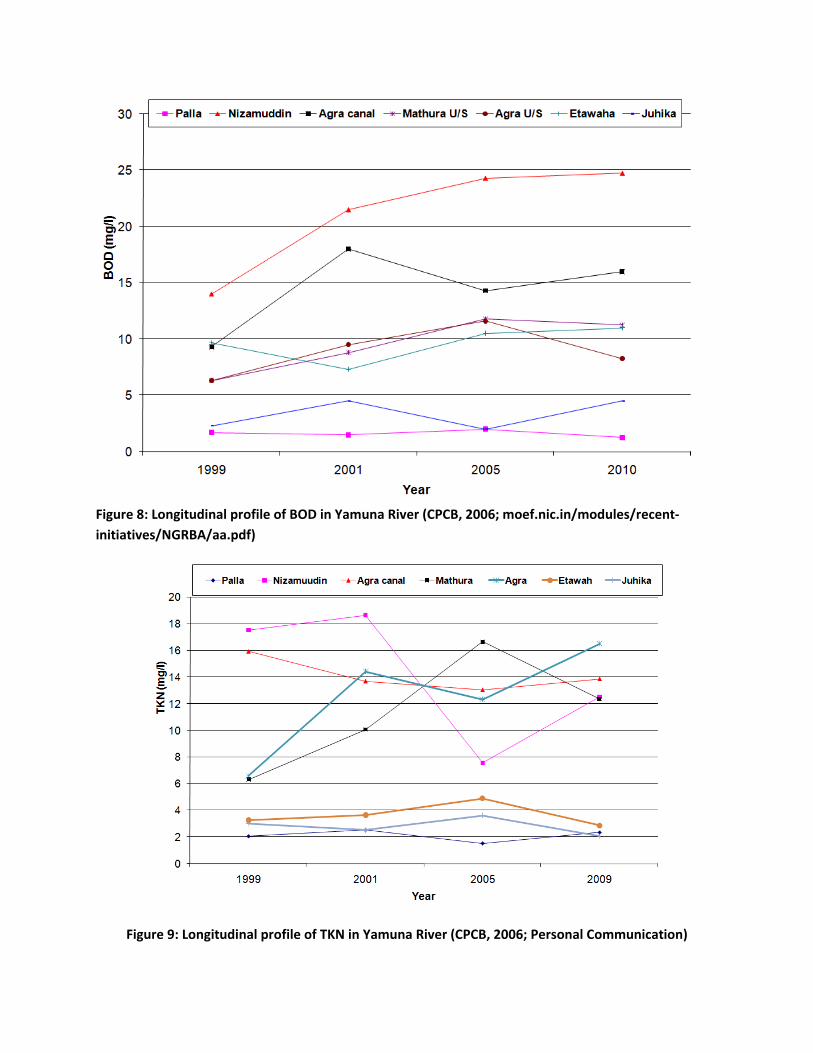
Figure 8: Longitudinal profile of BOD in Yamuna River (CPCB, 2006; moef.nic.in/modules/recent-initiatives/NGRBA/aa.pdf)
Figure 9: Longitudinal profile of TKN in Yamuna River (CPCB, 2006; Personal Communication)
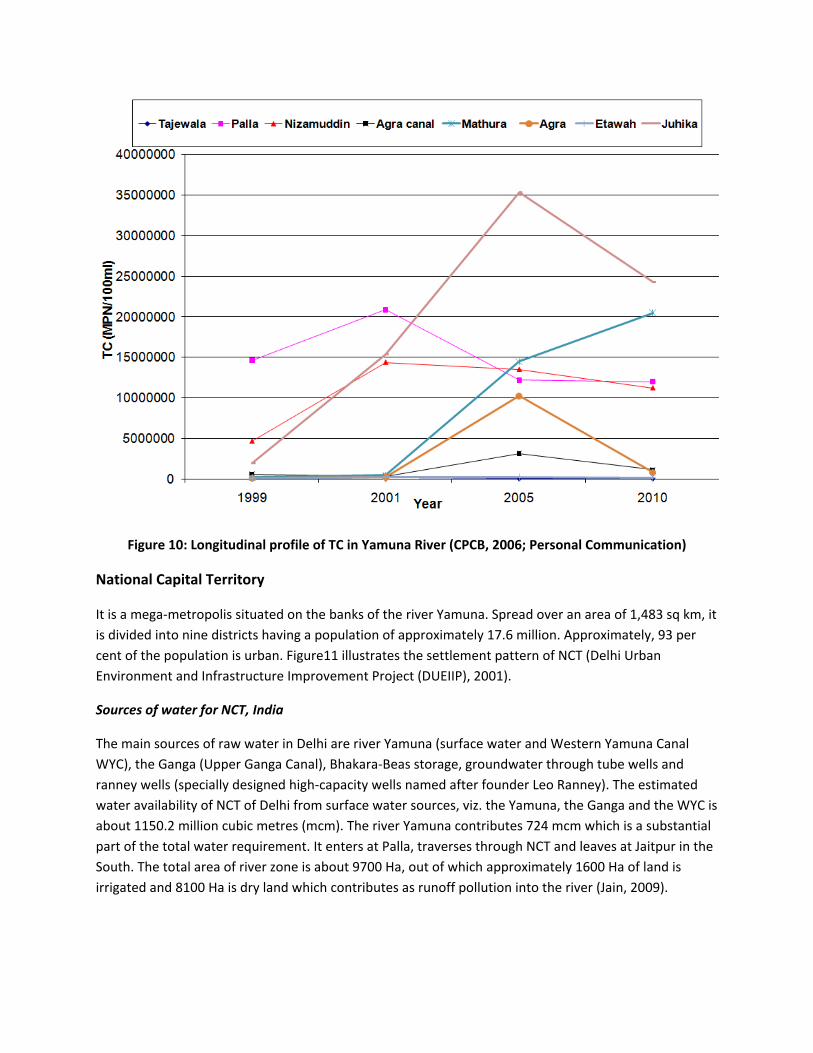
Figure 10: Longitudinal profile of TC in Yamuna River (CPCB, 2006; Personal Communication)
National Capital Territory
It is a mega-metropolis situated on the banks of the river Yamuna. Spread over an area of 1,483 sq km, it is divided into nine districts having a population of approximately 17.6 million. Approximately, 93 per cent of the population is urban. Figure11 illustrates the settlement pattern of NCT (Delhi Urban Environment and Infrastructure Improvement Project (DUEIIP), 2001).
Sources of water for NCT, India
The main sources of raw water in Delhi are river Yamuna (surface water and Western Yamuna Canal WYC), the Ganga (Upper Ganga Canal), Bhakara-Beas storage, groundwater through tube wells and ranney wells (specially designed high-capacity wells named after founder Leo Ranney). The estimated water availability of NCT of Delhi from surface water sources, viz. the Yamuna, the Ganga and the WYC is about 1150.2 million cubic metres (mcm). The river Yamuna contributes 724 mcm which is a substantial part of the total water requirement. It enters at Palla, traverses through NCT and leaves at Jaitpur in the South. The total area of river zone is about 9700 Ha, out of which approximately 1600 Ha of land is irrigated and 8100 Ha is dry land which contributes as runoff pollution into the river (Jain, 2009).
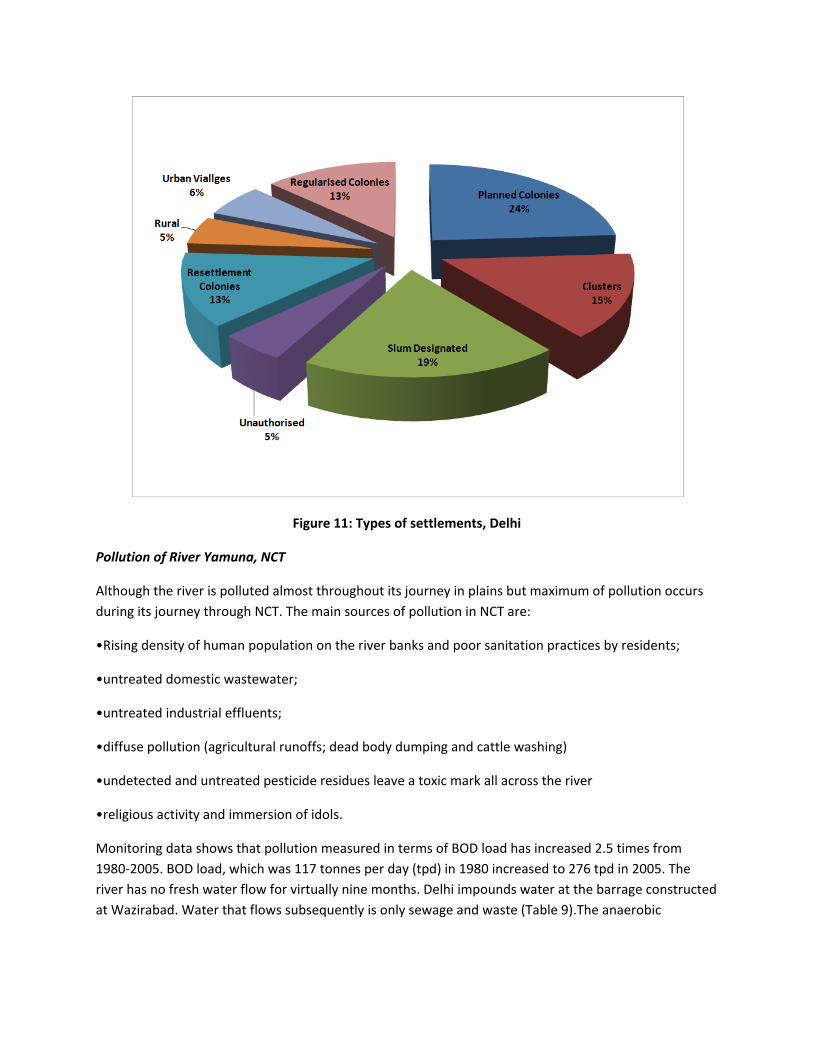
Figure 11: Types of settlements, Delhi
Pollution of River Yamuna, NCT
Although the river is polluted almost throughout its journey in plains but maximum of pollution occurs during its journey through NCT. The main sources of pollution in NCT are:
•Rising density of human population on the river banks and poor sanitation practices by residents;
•untreated domestic wastewater;
•untreated industrial effluents;
•diffuse pollution (agricultural runoffs; dead body dumping and cattle washing)
•undetected and untreated pesticide residues leave a toxic mark all across the river
•religious activity and immersion of idols.
Monitoring data shows that pollution measured in terms of BOD load has increased 2.5 times from 1980-2005. BOD load, which was 117 tonnes per day (tpd) in 1980 increased to 276 tpd in 2005. The river has no fresh water flow for virtually nine months. Delhi impounds water at the barrage constructed at Wazirabad. Water that flows subsequently is only sewage and waste (Table 9).The anaerobic
condition in the river is frequently observed and as evident from the presence of masses of rising sludge from the bottom, gas bubbles and floating solids on the surface (CPCB, 2000).
As on March 2007, the sewage treatment capacity of STPs in Delhi is 512.4 MGD (2321 MLD) with only 50% of treatment. Rest of the untreated sewage falls into the river Yamuna and is the major cause of river pollution (Delhi Economic Survey, 2008). Statements by Sarkar et al (2007) and MoS Jairam Ramesh’s in the Lok Sabha (as on 08.07.2009), confirmed that together in NCT 17 sewage treatment plants have a treatment capacity of around 2,330 MLD. However, due to silting and settlement of trunk sewers, treatment capacity of only 1,570 MLD is in use at present (Jain, 2009). The BOD and coliform profile for 2002-2008 in NCT has been shown in figure 12 and 13.
Table 9: Water quality of River Yamuna at Nizamuddin, Delhi, India
1988 1996 2009
DO BOD Total coliforms
DO BOD Total coliforms
DO BOD Total coliforms
1.9 18 1600000 0.30 25.00 147818 0.0 23.00 22516660
Source: CPCB (2006) and personal communication
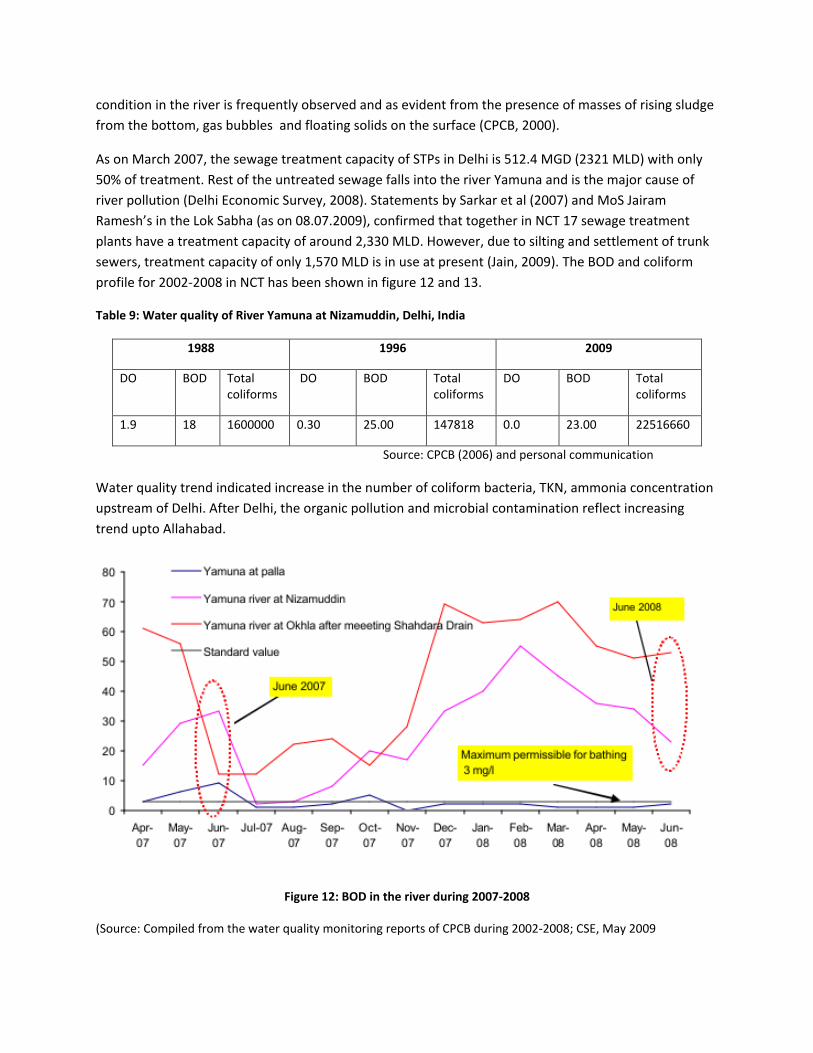
Water quality trend indicated increase in the number of coliform bacteria, TKN, ammonia concentration upstream of Delhi. After Delhi, the organic pollution and microbial contamination reflect increasing trend upto Allahabad.
Figure 12: BOD in the river during 2007-2008
(Source: Compiled from the water quality monitoring reports of CPCB during 2002-2008; CSE, May 2009
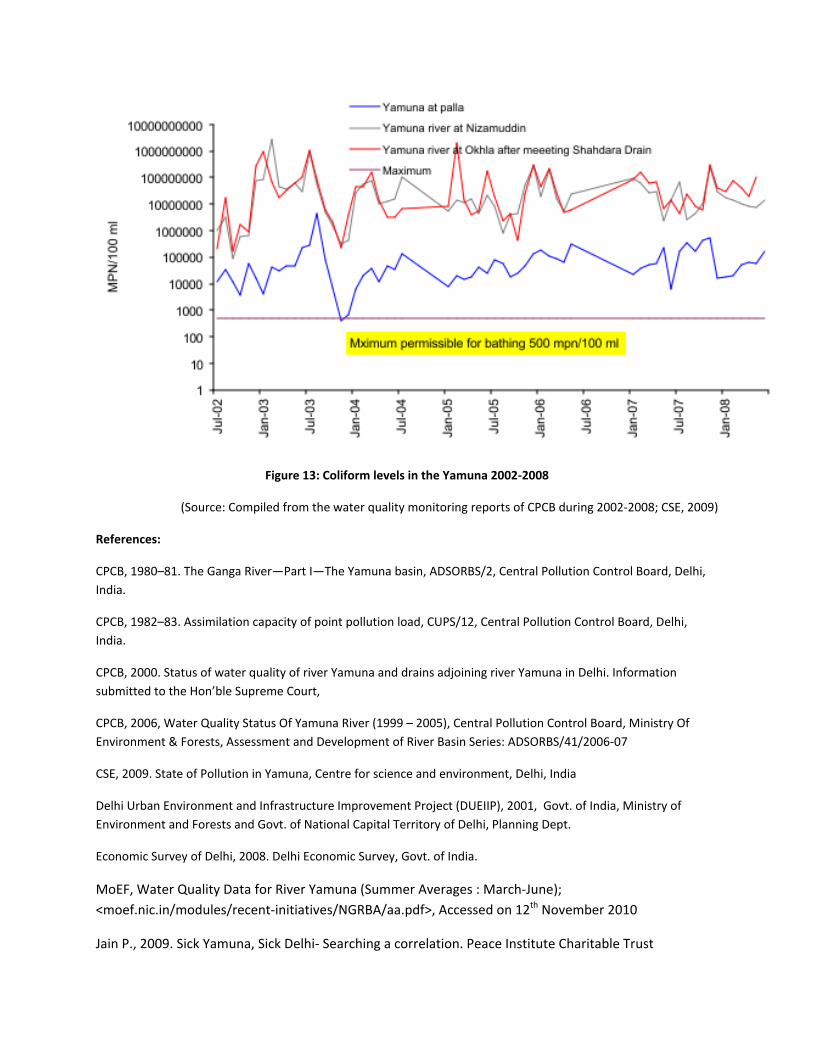
Figure 13: Coliform levels in the Yamuna 2002-2008
(Source: Compiled from the water quality monitoring reports of CPCB during 2002-2008; CSE, 2009)
References:
CPCB, 1980–81. The Ganga River—Part I—The Yamuna basin, ADSORBS/2, Central Pollution Control Board, Delhi, India.
CPCB, 1982–83. Assimilation capacity of point pollution load, CUPS/12, Central Pollution Control Board, Delhi, India.
CPCB, 2000. Status of water quality of river Yamuna and drains adjoining river Yamuna in Delhi. Information submitted to the Hon’ble Supreme Court,
CPCB, 2006, Water Quality Status Of Yamuna River (1999 – 2005), Central Pollution Control Board, Ministry Of Environment & Forests, Assessment and Development of River Basin Series: ADSORBS/41/2006-07
CSE, 2009. State of Pollution in Yamuna, Centre for science and environment, Delhi, India
Delhi Urban Environment and Infrastructure Improvement Project (DUEIIP), 2001, Govt. of India, Ministry of Environment and Forests and Govt. of National Capital Territory of Delhi, Planning Dept.
Economic Survey of Delhi, 2008. Delhi Economic Survey, Govt. of India.
MoEF, Water Quality Data for River Yamuna (Summer Averages : March-June); <moef.nic.in/modules/recent-initiatives/NGRBA/aa.pdf>, Accessed on 12th November 2010
Jain P., 2009. Sick Yamuna, Sick Delhi- Searching a correlation. Peace Institute Charitable Trust