curis.ku.dk · research article pleiotropy of genetic variants on obesity and smoking phenotypes:...
TRANSCRIPT

u n i ve r s i t y o f co pe n h ag e n
Pleiotropy of genetic variants on obesity and smoking phenotypes
Results from the Oncoarray Project of The International Lung Cancer Consortium
Wang, Tao; Moon, Jee-Young; Wu, Yiqun; Amos, Christopher I; Hung, Rayjean J; Tardon,Adonina; Andrew, Angeline; Chen, Chu; Christiani, David C; Albanes, Demetrios; Heijden,Erik H F M van der; Duell, Eric; Rennert, Gadi; Goodman, Gary; Liu, Geoffrey; Mckay, JamesD; Yuan, Jian-Min; Field, John K; Manjer, Jonas; Grankvist, Kjell; Kiemeney, Lambertus A;Marchand, Loic Le; Teare, M Dawn; Schabath, Matthew B; Johansson, Mattias; Aldrich,Melinda C; Davies, Michael; Johansson, Mikael; Tsao, Ming-Sound; Caporaso, Neil; Lazarus,Philip; Lam, Stephen; Bojesen, Stig E; Arnold, Susanne; Wu, Xifeng; Zong, Xuchen; Hong,Yun-Chul; Ho, Gloria Y FPublished in:PloS one
DOI:10.1371/journal.pone.0185660
Publication date:2017
Document versionPublisher's PDF, also known as Version of record
Document license:CC0
Citation for published version (APA):Wang, T., Moon, J-Y., Wu, Y., Amos, C. I., Hung, R. J., Tardon, A., ... Ho, G. Y. F. (2017). Pleiotropy of geneticvariants on obesity and smoking phenotypes: Results from the Oncoarray Project of The International LungCancer Consortium. PloS one, 12(9), [e0185660]. https://doi.org/10.1371/journal.pone.0185660
Download date: 26. Mar. 2020

RESEARCH ARTICLE
Pleiotropy of genetic variants on obesity and
smoking phenotypes: Results from the
Oncoarray Project of The International Lung
Cancer Consortium
Tao Wang1*, Jee-Young Moon1, Yiqun Wu1,2, Christopher I. Amos3, Rayjean J. Hung4,
Adonina Tardon5, Angeline Andrew6, Chu Chen7, David C. Christiani8,
Demetrios Albanes9, Erik H. F. M. van der Heijdendr.10, Eric Duell11, Gadi Rennert12,
Gary Goodman7, Geoffrey Liu4, James D. Mckay13, Jian-Min Yuan14, John K. Field15,
Jonas Manjer16, Kjell Grankvist17, Lambertus A. Kiemeney10, Loic Le Marchand18,
M. Dawn Teare19, Matthew B. Schabath20, Mattias Johansson13, Melinda C. Aldrich21,
Michael Davies15, Mikael Johansson17, Ming-Sound Tsao22, Neil Caporaso9,
Philip Lazarus23, Stephen Lam24, Stig E. Bojesen25,26,27, Susanne Arnold28, Xifeng Wu29,
Xuchen Zong4, Yun-Chul Hong30, Gloria Y. F. Ho31,32,33*
1 Department of Epidemiology & Population Health, Albert Einstein College of Medicine, Bronx, New York,
United States of America, 2 Department of Epidemiology & Biostatistics, School of public health, Peking
University Health Science Center, Beijing, China, 3 Community and Family Medicine, Geisel School of
Medicine, Dartmouth College, Hanover, New Hampshire, United States of America, 4 Lunenfeld-Tanenbaum
Research Institute, Sinai Health System; Division of Epidemiology, Dalla Lana School of Public Health,
University of Toronto, Toronto, Ontario, Canada, 5 IUOPA. University of Oviedo and CIBERESP. Oviedo,
Spain, 6 Norris Cotton Cancer Center, Hanover, New Hampshire, United States of America, 7 Fred
Hutchinson Cancer Research Center, Seattle, Washington, United States of America, 8 Harvard School of
Public Health, Boston, Massachusetts, United States of America, 9 National Cancer Institute, Bethesda,
United States of America, 10 Radboud university medical center, Nijmegen, Netherlands, 11 Catalan
Institute of Oncology (ICO), Barcelona, Spain, 12 Carmel Medical Center, Haifa, Israel, 13 International
Agency for Research on Cancer (IARC), Lyon, France, 14 University of Pittsburgh Cancer Institute,
Pittsburgh, Pennsylvania, United States of America, 15 Roy Castle Lung Cancer Research Programme,
Department of Molecular & Clinical Cancer Medicine, The University of Liverpool, Liverpool, UK,
16 Department of surgery, Unit for breast surgery, Lund University, Malmo, Skåne University Hospital Malmo,
Malmo, Sweden, 17 Department of Medical Biosciences, UmeåUniversity, Umeå, Sweden, 18 University of
Hawaii Cancer Center, Honolulu, Hawai’I, United States of America, 19 University Of Sheffield, Sheffield,
South Yorkshire, United Kingdom, 20 Department of Cancer Epidemiology, H. Lee Moffitt Cancer Center and
Research Institute, Tampa, Florida, United States of America, 21 Department of Thoracic Surgery, Division of
Epidemiology, Vanderbilt University Medical Center, Nashville, Tennessee, United States of America,
22 Princess Margaret Cancer Center, Toronto, Ontario, Canada, 23 Washington State University College of
Pharmacy, Washington, United States of America, 24 British Columbia Cancer Agency, Vancouver, British
Columbia, Canada, 25 Copenhagen General Population Study, Herlev and Gentofte Hospital, Copenhagen,
Denmark, 26 Department of Clinical Biochemistry, Herlev and Gentofte Hospital, Copenhagen University
Hospital, Copenhagen, Denmark, 27 Faculty of Health and Medical Sciences, University of Copenhagen,
Copenhagen, Denmark, 28 Markey Cancer Center, Lexington, Kentucky, United States of America, 29 The
University of Texas MD Anderson Cancer Center, Texas, Houston, United States of America, 30 Department
of Preventive Medicine, Seoul National University College of Medicine, Seoul, Korea, 31 Merinoff Center for
Patient-Oriented Research, The Feinstein Institute for Medical Research, New York, United States of
America, 32 Epidemiology and Research, Northwell Health, New York, United States of America, 33 Hofstra
Northwell School of Medicine, New York, United States of America
* [email protected] (TW); [email protected] (GYFH)
PLOS ONE | https://doi.org/10.1371/journal.pone.0185660 September 28, 2017 1 / 17
a1111111111
a1111111111
a1111111111
a1111111111
a1111111111
OPENACCESS
Citation: Wang T, Moon J-Y, Wu Y, Amos CI, Hung
RJ, Tardon A, et al. (2017) Pleiotropy of genetic
variants on obesity and smoking phenotypes:
Results from the Oncoarray Project of The
International Lung Cancer Consortium. PLoS ONE
12(9): e0185660. https://doi.org/10.1371/journal.
pone.0185660
Editor: David Meyre, McMaster University,
CANADA
Received: July 4, 2017
Accepted: September 16, 2017
Published: September 28, 2017
Copyright: This is an open access article, free of all
copyright, and may be freely reproduced,
distributed, transmitted, modified, built upon, or
otherwise used by anyone for any lawful purpose.
The work is made available under the Creative
Commons CC0 public domain dedication.
Data Availability Statement: Genotype data
analyzed in this study are available through dbGAP.
The accession number is phs001273.v2.p1.
Funding: This study was funded by National
Cancer Institution (https://www.cancer.gov, R21
CA202529, TWG YFH). The funders had no role in
study design, data collection and analysis, decision
to publish, or preparation of the manuscript.
Competing interests: The authors have declared
that no competing interests exist.

Abstract
Obesity and cigarette smoking are correlated through complex relationships. Common
genetic causes may contribute to these correlations. In this study, we selected 241 loci
potentially associated with body mass index (BMI) based on the Genetic Investigation of
ANthropometric Traits (GIANT) consortium data and calculated a BMI genetic risk score
(BMI-GRS) for 17,037 individuals of European descent from the Oncoarray Project of the
International Lung Cancer Consortium (ILCCO). Smokers had a significantly higher BMI-
GRS than never-smokers (p = 0.016 and 0.010 before and after adjustment for BMI, respec-
tively). The BMI-GRS was also positively correlated with pack-years of smoking (p<0.001)
in smokers. Based on causal network inference analyses, seven and five of 241 SNPs were
classified to pleiotropic models for BMI/smoking status and BMI/pack-years, respectively.
Among them, three and four SNPs associated with smoking status and pack-years
(p<0.05), respectively, were followed up in the ever-smoking data of the Tobacco, Alcohol
and Genetics (TAG) consortium. Among these seven candidate SNPs, one SNP
(rs11030104, BDNF) achieved statistical significance after Bonferroni correction for multiple
testing, and three suggestive SNPs (rs13021737, TMEM18; rs11583200, ELAVL4; and
rs6990042, SGCZ) achieved a nominal statistical significance. Our results suggest that
there is a common genetic component between BMI and smoking, and pleiotropy analysis
can be useful to identify novel genetic loci of complex phenotypes.
Introduction
Both obesity and cigarette smoking are risk factors for many human diseases, including multi-
ple cancers.[1–4] There are complex sources of correlations between smoking behavior and
obesity.[5,6] In general, current smokers tend to have a lower body mass index (BMI) than
never-smokers, while smoking cessation is associated with weight gain.[7–9] The reasons for
the association between BMI and smoking status may involve smoking-induced appetite sup-
pression via neural pathways [10] and increased energy expenditure via energy-regulating hor-
monal feedback loops.[11,12] On the other hand, heavy smokers tend to have a greater BMI
than light smokers; an observation that is seemingly contradictory to the metabolic effects of
smoking,[7,13] but may be partially attributed to the unhealthy behaviors associated with
heavy smoking. Another reason for the correlation between smoking behavior and obesity is
that there may be common underlying biological causes. There is growing evidence suggesting
that obesity may be partially due to addiction to food.[14,15] One plausible common mecha-
nism for obesity and smoking is brain reward effects arising from neuronal activity within the
dopamine system.[16] In any case, the reasons for the relationship between BMI and smoking
behavior remain uncertain.
Shared genetic susceptibility may offer another explanation for the correlation between
obesity and smoking. Both smoking and obesity have significant genetic components. In the
past, large-scale genome-wide association studies (GWAS) on obesity or variables related to
smoking characteristics (e.g., smoking status, age started smoking, and pack-years of smoking,
etc) have successfully identified multiple loci associated with these phenotypes.[17–25] Yet,
total variation in obesity or smoking traits explained by these GWAS loci is still limited.
[20,26–29] The remaining genetic variants still need to be identified. It was estimated that the
genetic correlation between smoking status and BMI was 0.20.[30] In a previous study in
Common genetic causes of smoking and BMI
PLOS ONE | https://doi.org/10.1371/journal.pone.0185660 September 28, 2017 2 / 17

Iceland, the genetic risk score (GRS) of 32 common variants identified in GWAS of BMI was
associated with smoking initiation and the number of cigarettes smoked per day (CPD), sug-
gesting that smoking and BMI may share common genetic components.[31] However, this
study in Iceland only observed correlations of BMI associated SNPs with smoking variables,
without accounting for possible causal relationships between SNPs, BMI and smoking vari-
ables. We hypothesized that analyzing pleiotropic effects on BMI and smoking behavior may
discover novel genetic loci, otherwise undiscovered in GWAS with stringent genome-wide sig-
nificance, which in turn would further elucidate genetic architectures underlying both smok-
ing behavior and obesity. In this study, leveraging existing genotyping, BMI, and smoking data
from a lung cancer consortium, we confirmed the association between the BMI-GRS and
smoking-related variables with adjustment for BMI and important covariates, and used causal
network inference to identify potential genetic loci with pleiotropic effects on both BMI and
smoking-related phenotypes.
Materials and methods
Study population
The International Lung Cancer Consortium (ILCCO) was established in 2004 with the goal of
sharing comparable research data and maximizing research efficiency (http://ilcco.iarc.fr). To
further characterize cancer genetic architecture of common cancers, a custom OncoArray
(http://oncoarray.dartmouth.edu) genotyping chip that includes 550K markers was designed
to genotype samples in collaboration with other cancer consortia under The National Cancer
Institute (NCI) initiative on the Genetic Associations and Mechanisms in Oncology (GAME-
ON). In this study, we analyzed OncoArray genotypic data of 36,000 subjects of European
descent in ILCCO; among them, 17,037 provided individual epidemiological data and were of
European descent.
OncoArray genotyping, quality control and imputation
The GAME-ON OncoArray chip was previously described.[32] In brief, it includes a GWAS
backbone and a customized panel for dense mapping of known susceptibility regions, rare var-
iants from sequencing experiments, pharmacogenetic markers and cancer related traits includ-
ing smoking and BMI. The genotyping quality control of Oncoarray data was previously
described.[33] After filtering out SNPs by success rate and genotype distribution deviation
from the expected by Hardy-Weinberg equilibrium, 517,482 SNPs were available for analysis.
Standard quality control procedures were used to exclude underperforming samples (2,408),
unexpected duplicated or related samples (2,411), samples with sex error (316) and non-Cau-
casians (8,240). After quality control, 17,037 subjects with full information on both BMI and
smoking status, and other important covariates (age, sex, study sites, and lung cancer status)
were kept for analysis. Genotype data were imputed by the GAME-ON data coordinating cen-
ter for all scans for over 10 million SNPs using data from the 1000 Genomes Project (Phase 3,
October 2014) as reference.[34,35]. The data were imputed in a two-stage procedure using
SHAPEIT [36] to derive phased genotypes, and IMPUTEv2 to perform imputation of the
phased data. [35] Genotypes were aligned to the positive strand in both imputation and actual
genotyping.
SNP selection and derivation of the BMI-GRS
We first identified a large set of 4,961 SNPs associated with BMI with p<10−5 based on results
from the Genetic Investigation of ANthropometric Traits (GIANT) consortium, a large
Common genetic causes of smoking and BMI
PLOS ONE | https://doi.org/10.1371/journal.pone.0185660 September 28, 2017 3 / 17

collaborative GWAS on human body size and shape. We then pruned SNPs by applying a
threshold value of r2 = 0.2 and requiring selected SNPs at least 500Kb apart to reduce redun-
dancy and obtained a subset of 241 independent SNPs that were at least 500Kb apart (S1
Table). To calculate the BMI-GRS, each SNP was recoded as 0, 1, or 2 according to the number
of risk alleles (BMI increasing alleles). The BMI-GRS was calculated using the equation: GRS =
(weight1×SNP1 + weight 2×SNP2 + . . . + weight n×SNPn), where n is the total number of
SNPs. Both un-weighted and weighted BMI-GRSs were calculated in which the weight is 1 for
all SNPs and the weight is the β coefficient of each individual SNP on BMI derived from
GIANT for the un-weighted and weighted GRS, respectively. The results of un-weighted and
weighted GRS were largely similar and we presented un-weighted BMI-GRS in the Results. To
examine the robustness of the results based on the BMI-GRS of our selected SNPs, we also cal-
culated the BMI-GRS based on 97 BMI-associated SNPs which reached genome-wide signifi-
cant levels (P< 5×10⁻⁸) in the GIANT BMI GWAS including up to 322,154 European
descents and 17,072 non-European descents [37].
Statistical analysis
Age, sex, smoking statuses, pack-years, BMI, and BMI categories were compared between lung
cancer statuses by student t-test and Chi-square test for categorical variables. All statistical
tests are two-sided. The analyses were performed using R (v2.6).
Association of BMI with smoking phenotypes
Linear regression model was applied for comparison of BMI among individuals with different
smoking categories (never-smokers, current smokers and ex-smokers) with adjustment for
age, sex, and study sites. Adjusted means of BMI of individuals with different smoking catego-
ries and their 95% confidence intervals (CIs) were calculated using the lm function in the sta-
tistical software R with a fixed intercept of zero. Additional stratification analyses by lung
cancer status were performed.
Association of the BMI-GRS with BMI and smoking phenotypes
Linear regression was also used to compare the BMI-GRS between different BMI categories
(underweight, <18.5; Normal, 18.5–24.9; Overweight, 25.0–29.9; and Obese,� 30) by adjust-
ing for age, sex, study sites, and top four genetic principal components. Although our analyses
were performed only for participants of European descent, study sites and top four genetic
principle components generated using common SNPs were included in the regression models
for BMI-GRS in order to further limit the effects of any possible cryptic population stratifica-
tion that might cause inflation of test statistics. Trend tests were performed by analyzing the
BMI categories as a continuous variable in the regression model. A similar regression analysis
was also performed to compare the BMI-GRS between individuals with different smoking cat-
egories (never-smokers, current-smokers, and ex-smokers). Partial correlation coefficients
between the BMI-GRS and pack-years of smoking were estimated by Pearson correlation coef-
ficients of their residuals from linear regression models after adjusting for age, sex, study sites,
and top four genetic principal components. Additional stratification analyses were performed
by lung cancer status.
Identifying candidate pleiotropic SNPs for BMI and smoking phenotypes
We used a causal network inference model to identify possible pleiotropic SNPs for both BMI/
pack-years and BMI/smoking status (smokers versus non-smokers), respectively.[38] We
Common genetic causes of smoking and BMI
PLOS ONE | https://doi.org/10.1371/journal.pone.0185660 September 28, 2017 4 / 17

describe the approach here using BMI and pack-years as an example. A similar approach was
used to identify pleiotropic SNPs for BMI and remaining smoking traits. Specifically, we mod-
eled 12 possible directed acyclic graphs (DAGs) of the genotype value of a SNP on BMI and/or
pack-years (Fig 1). We classified these DAGs into four categories: (1) the SNP did not have
effects on either BMI or pack-years, (2) the SNP had direct effects on BMI, but not pack-years,
(3) the SNP had direct effects on pack-years, but not BMI, and (4) the SNP had pleiotropic
effects on both BMI and pack-years.
Based on a given DAG, we fit two linear regression models for BMI and pack-years, respec-
tively, with adjustment for sex, age, study sites, and genetic principal components (PCs). For
example, two linear regression models for the DAG of SNP! pack-years! BMI (DAG 8
with gentic effects on pack-years only) are
BMI � Ageþ Sexþ Study Sitesþ PCsþ Pack years;
Pack years � Ageþ Sexþ Study Sitesþ PCsþ SNP:
To identify the model that was the most supported by the data, we calculated AIC for each
DAG
� 2 loglik ðRegression Model 1Þ � 2 loglik ðRegression Model 2Þ þ 2�number of edges:
We then compared the minimum AIC values of four categories. SNPs with at least 2 of the
minimum AIC value of category 4 (model 10, 11, or 12) less than other categories were further
examined for their association with pack-years. Similar analyses were performed for smoking
status using logistic regression. Those SNPs that achieved a nominal statistical significance
(p<0.05) were considered as candidate pleiotropic SNPs, and further validated for their associ-
ations with ever-smoking using the independent database from TAG (The Tobacco, Alcohol
and Genetics) consortium.(https://www.med.unc.edu/pgc/results-and-downloads)
Fig 1. Twelve possbile directed acyclic graphs (DAGs) of one SNP, BMI and pack-years (PY) of
smoking. Possible DAGs between one SNP, BMI and PY. The DAGs are categorized into 4 groups. SNPs in
Category 1 (DAGs of 1, 2, and 3) do not have effects on either BMI or pack-years. SNPs in Category 2 (DAGs
of 4, 5, and 6) have direct effects on BMI, but not PY. SNPs in Category 3 (DAGs of 7, 8, and 9) have direct
effects on PY, but not BMI. SNPs in Category 4 (DAGs of 10, 11, and 12) have pleiotropic effects on BMI and
PY.� represents models that are not differentiable.
https://doi.org/10.1371/journal.pone.0185660.g001
Common genetic causes of smoking and BMI
PLOS ONE | https://doi.org/10.1371/journal.pone.0185660 September 28, 2017 5 / 17

Results
Characteristics of the study population
In our analysis, 17,037 subjects of European descent from 17 study sites had full information
on both BMI and smoking status, and other important covariates (age, sex, study sites, and
lung cancer status). As expected, compared to the controls, lung cancer cases were older, had a
higher proportion of smokers, and were slightly leaner (Table 1).
Association of BMI and smoking variables
We compared BMI levels among never-smokers, ex-smokers, and current smokers. As expected
and as compared to never-smokers, ex-smokers had a significantly higher BMI (difference from
never-smokers = 0.39 kg/m2, p = 2.64×10⁻⁴), while current smokers were leaner (difference
from never-smokers = -1.08 kg/m2, p = 8.20×10⁻²⁴) after adjustment for age, sex and study
sites. Such differences in BMI by smoking status were similar for cases and controls (Fig 2).
BMI and pack-years of smoking were positively correlated in both current smokers and ex-
smokers after adjustment for age, sex and study sites, and the correlations were stronger in ex-
smokers than those in current-smokers (Table 2). Specifically, the partial coefficient of pack-
years of smoking and BMI was 0.054 (95%CI 0.027–0.075) and 0.112 (95%CI 0.088–0.136) for
current smokers and ex-smokers, respectively. The correlations between BMI and pack-years
were similar for cases and controls.
Association of the BMI-GRS with BMI
We first confirmed if the BMI-GRS based on 241 SNPs identified in GIANT was associated
with BMI in the OncoArray Project population. Comparing the BMI-GRS of individuals in
different BMI categories with adjustment for age, sex, study sites, genetic principal compo-
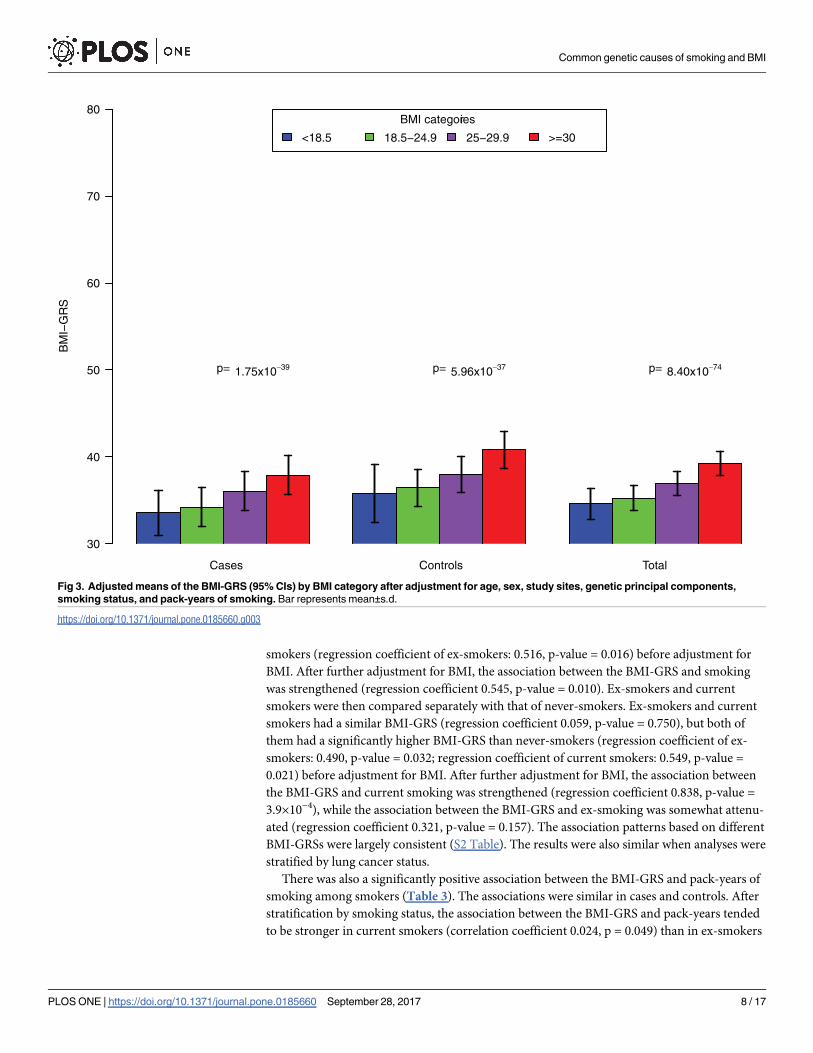
nents, smoking types, and pack-years (Fig 3), we found that the BMI-GRS significantly
increased from the categories underweight (BMI<18.5), to normal weight (BMI 18.5–24.9), to
Table 1. Characteristics of 17,037 European-descent subjects in the OncoArray Project and epidemi-
ologic data.
Cases Controls P-values
N 9,633 7,404
Male (%) 5,461 (56.7) 42,71 (57.7) 0.199
Age (sd) 65.2 (10.2) 61.1 (10.1) <0.001
Smoking type (%)
Never-smokers 1,101 (11.4) 2,353 (31.8) <0.001
Ex-smokers 3,934 (40.8) 2,782 (37.6)
Current smokers 4,598 (47.7) 2,269 (30.6)
Pack-years of smoking among smokers (sd) 47.8 (31.3) 33.1 (26.5) <0.001
BMI, kg/m2 (sd) 26.3 (4.9) 26.9 (4.8) <0.001
BMI categories (kg/m2) <0.001
Under weight (<18.5) 268 (2.8) 66 (0.9)
Normal (18.5–24.9) 3,862 (40.1) 2,708 (36.6)
Over weight (25–29.9) 3,684 (38.2) 3,154 (42.6)
Obese (�30) 1,819 (18.9) 1,476 (19.9)
The Basic characteristics of the subjects were described as mean (sd) for continuous variables, and number
(proportion, %) for category variables. The p-values were obtained by student t-test for continuous variables
and Chi-square test for category variables.
https://doi.org/10.1371/journal.pone.0185660.t001
Common genetic causes of smoking and BMI
PLOS ONE | https://doi.org/10.1371/journal.pone.0185660 September 28, 2017 6 / 17

overweight (BMI 25–29.9), and to obese (BMI�30) with ptrend = 8.40×10−74. Similar associa-
tions between the BMI-GRS and BMI categories were found in cases and controls (ptrend =
1.75×10−39 and p trend = 5.96×10−37 for cases and controls, respectively).
Association of the BMI-GRS with smoking phenotypes
The BMI-GRS of smokers that include both ex-smokers and current smokers, was first com-
pared with that of never-smokers. Smokers had a significantly higher BMI-GRS than never-
Cases Controls Total
Smoking Status
BM
I
2025
3035
never-smokers ex-smokers current smokers
Fig 2. Adjusted means of BMI (95% CIs) for never-smokers, ex-smokers, and current smokers with adjustment for age, sex, and study sites. Bar
represents mean±s.d.
https://doi.org/10.1371/journal.pone.0185660.g002
Table 2. Partial correlations between BMI and pack-years of smoking by smoking status.
Current Smokers Ex-smokers
n Coef 95%CI P N Coef 95%CI P
All* 6,577 0.054 0.027–0.075 <0.001 6,245 0.112 0.088–0.136 <0.001
Cases** 4,396 0.052 0.023–0.082 <0.001 3,682 0.106 0.074–0.138 <0.001
Controls** 2,181 0.072 0.030–0.114 <0.001 2,563 0.140 0.102–0.178 <0.001
A table for the partial correlation coefficients between BMI and pack-years in smokers.
* For all subjects, the analysis was adjusted for age, sex, study sites and disease status.
** For cases and controls, the analyses were adjusted for age, sex, and study sites.
https://doi.org/10.1371/journal.pone.0185660.t002
Common genetic causes of smoking and BMI
PLOS ONE | https://doi.org/10.1371/journal.pone.0185660 September 28, 2017 7 / 17
smokers (regression coefficient of ex-smokers: 0.516, p-value = 0.016) before adjustment for
BMI. After further adjustment for BMI, the association between the BMI-GRS and smoking
was strengthened (regression coefficient 0.545, p-value = 0.010). Ex-smokers and current
smokers were then compared separately with that of never-smokers. Ex-smokers and current
smokers had a similar BMI-GRS (regression coefficient 0.059, p-value = 0.750), but both of
them had a significantly higher BMI-GRS than never-smokers (regression coefficient of ex-
smokers: 0.490, p-value = 0.032; regression coefficient of current smokers: 0.549, p-value =
0.021) before adjustment for BMI. After further adjustment for BMI, the association between
the BMI-GRS and current smoking was strengthened (regression coefficient 0.838, p-value =
3.9×10⁻⁴), while the association between the BMI-GRS and ex-smoking was somewhat attenu-
ated (regression coefficient 0.321, p-value = 0.157). The association patterns based on different
BMI-GRSs were largely consistent (S2 Table). The results were also similar when analyses were
stratified by lung cancer status.
There was also a significantly positive association between the BMI-GRS and pack-years of
smoking among smokers (Table 3). The associations were similar in cases and controls. After
stratification by smoking status, the association between the BMI-GRS and pack-years tended
to be stronger in current smokers (correlation coefficient 0.024, p = 0.049) than in ex-smokers
Cases Controls Total
BMI categories
<18.5 18.5−24.9 25−29.9 >=30
BM
I−G
RS
30
40
50
60
70
80
p= 1.75x10−39 p= 5.96x10−37 p= 8.40x10−74
Fig 3. Adjusted means of the BMI-GRS (95% CIs) by BMI category after adjustment for age, sex, study sites, genetic principal components,
smoking status, and pack-years of smoking. Bar represents mean±s.d.
https://doi.org/10.1371/journal.pone.0185660.g003
Common genetic causes of smoking and BMI
PLOS ONE | https://doi.org/10.1371/journal.pone.0185660 September 28, 2017 8 / 17

(correlation coefficient 0.009, p = 0.472). The results based on different BMI-GRSs were largely
consistent (S3 Table).
Identifying pleiotropic SNPs for both BMI and smoking status
The above analyses suggested that among the 241 SNPs composed of the BMI-GRS (or in link-
age disequilibrium with the 241 SNPs), there may be some pleiotropic SNPs that have direct
effects on smoking and BMI. To identify the pleiotropic loci (DAGs 10, 11, or 12 in Fig 1),
we first used network inference to determine the possible causal models of 241 SNPs. In total,
five SNPs were classfied into category four to be pleiotropic for both BMI and pack-years of
smoking, and seven SNPs were classfied into category four to be pleiotropic for both BMI and
smoking by network inference. We then examined the associations of each of these SNPs with
BMI and pack-years of smoking (or smoking status) with adjustment for age, sex, study sites,
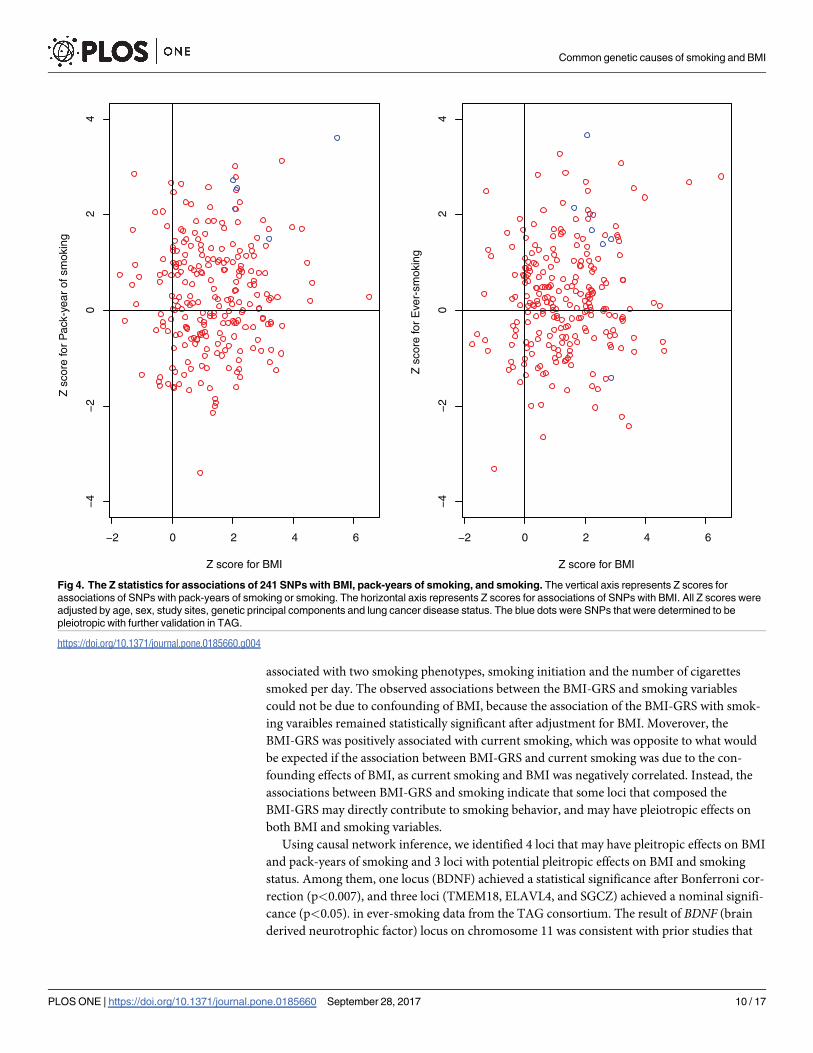
genetic principal components and lung cancer disease status. (Fig 4). There were four and
three SNPs associated with pack-years of smoking and smoking status with p<0.05, respec-
tively (Table 4). The SNPs classified as Category 4 and associated with smoking status or pack-
years with a nominal significance (p<0.05) were considered as candidate SNPs of pleiotropy.
The associations of these candidate pleiotropic SNPs with BMI were quite similar with and
without adjustment for pack-years or smoking status (S4 Table). We validated these SNPs
using data from the TAG consortium. Of the total of seven candidate pleiotropic SNPs for
BMI and pack-years or smoking status, rs11030104 (BDNF) was associated with ever-smoking
in TAG data after Bonferroni correction (p = 0.002), and rs13021737 (TMEM18), rs11583200
(ELAVL4) and rs6990042 (GCZ) achieved a nominal significance of 0.05 (p-values were 0.018,
0.008, and 0.043, respectively). Another interesting SNP that achieved a nominal significance
in TAG data (p = 0.020) was rs12016871 (MTIF3), but it did not achieve statistical significance
with smoking status in the OncoArray Project dataset (p = 0.161).
Discussion
In summary, we calculated the BMI-GRS for subjects who had OncoArray data of ILCCO
using 241 common SNPs potentially associated with BMI and demonstrated that the BMI-GRS
was associated with increased propensity to smoke as well as elevated pack-years after adjust-
ing for the potential confounding effects of BMI. These results were consistent with those from
a previous study in Iceland in which the GRS of 32 SNPs identified in GWAS was found to be
Table 3. Partial correlations between pack-years of smoking and BMI-GRS.
Category* Coef 95%CI p-value
Total (n = 12,822)** 0.022 0.004–0.039 0.014
Stratified by smoking categories**
Current smokers (n = 6,575) 0.024 0.0001–0.048 0.049
Ex-smokers (n = 6,245) 0.009 -0.016–0.034 0.472
Stratified by disease status***
Cases (n = 8,078) 0.018 -0.004–0.040 0.109
Controls (n = 4,744) 0.031 0.003–0.060 0.030
*The partial correlation coefficients between BMI-GRS and pack-years were calculated in smokers.
** The correlation coefficients were adjusted for age, sex, BMI, study sites, genetic principal components,
and disease status.
*** The correlation coefficients were adjusted for age, sex, BMI, study sites, and genetic principal
components.
https://doi.org/10.1371/journal.pone.0185660.t003
Common genetic causes of smoking and BMI
PLOS ONE | https://doi.org/10.1371/journal.pone.0185660 September 28, 2017 9 / 17
associated with two smoking phenotypes, smoking initiation and the number of cigarettes
smoked per day. The observed associations between the BMI-GRS and smoking variables
could not be due to confounding of BMI, because the association of the BMI-GRS with smok-
ing varaibles remained statistically significant after adjustment for BMI. Moverover, the
BMI-GRS was positively associated with current smoking, which was opposite to what would
be expected if the association between BMI-GRS and current smoking was due to the con-
founding effects of BMI, as current smoking and BMI was negatively correlated. Instead, the
associations between BMI-GRS and smoking indicate that some loci that composed the
BMI-GRS may directly contribute to smoking behavior, and may have pleiotropic effects on
both BMI and smoking variables.
Using causal network inference, we identified 4 loci that may have pleitropic effects on BMI
and pack-years of smoking and 3 loci with potential pleitropic effects on BMI and smoking
status. Among them, one locus (BDNF) achieved a statistical significance after Bonferroni cor-
rection (p<0.007), and three loci (TMEM18, ELAVL4, and SGCZ) achieved a nominal signifi-
cance (p<0.05). in ever-smoking data from the TAG consortium. The result of BDNF (brain
derived neurotrophic factor) locus on chromosome 11 was consistent with prior studies that
−2 0 2 4 6
−4
−2
02
4
−2 0 2 4 6
−4
−2
02
4
Z s
core
for
Pac
k-ye
ar o
f sm
okin
g
Z s
core
for
Eve
r-sm
okin
g
Z score for BMI Z score for BMI
Fig 4. The Z statistics for associations of 241 SNPs with BMI, pack-years of smoking, and smoking. The vertical axis represents Z scores for
associations of SNPs with pack-years of smoking or smoking. The horizontal axis represents Z scores for associations of SNPs with BMI. All Z scores were
adjusted by age, sex, study sites, genetic principal components and lung cancer disease status. The blue dots were SNPs that were determined to be
pleiotropic with further validation in TAG.
https://doi.org/10.1371/journal.pone.0185660.g004
Common genetic causes of smoking and BMI
PLOS ONE | https://doi.org/10.1371/journal.pone.0185660 September 28, 2017 10 / 17

Tab
le4.
SN
Ps
wit
hp
leio
tro
pic
eff
ects
on
BM
Ian
dsm
okin
gvari
ble
sam
on
g241
SN
Ps
co
mp
osed
ofth
eB
MI-
GR
S.
SN
Pch
rp
osit
ion
Gen
eO
nco
Arr
ay
Pro
ject
GIA
NT
TA
G
Asso
cia
tio
n
dir
ecti
on
wit
h
sm
okin
g
ph
en
oty
pe
p-v
alu
eo
f
asso
cia
tio
n
wit
hsm
okin
g
vari
ab
le
Asso
cia
tio
n
dir
ecti
on
wit
hB
MI
p-v
alu
e
asso
cia
tio
n
wit
hB
MI
Asso
cia
tio
n
Dir
ecti
on
wit
h
BM
I
p-v
alu
e
asso
cia
tio
n
wit
hB
MI
Asso
cia
tio
n
dir
ecti
on
wit
h
ever-
sm
okin
g
p-v
alu
e
asso
cia
tio
n
wit
hever-
sm
okin
g
SN
Ps
ple
iotr
op
icfo
rp
ack-y
ears
an
dB
MI
rs13021737
2632348
TM
EM
18
Positiv
e3.0
e-4
Positiv
e5.0
E-0
8P
ositiv
e5.4
e-5
4P
ositiv
e0.0
18
rs1528435
2181550962
AC
009478.1
Positiv
e6.4
e-3
Positiv
e0.0
43
Positiv
e4.8
e-0
9N
egative
0.9
36
rs11583200
150559820
ELA
VL4
Positiv
e0.0
11
Positiv
e0.0
36
Positiv
e6.0
e-0
9P
ositiv
e0.0
08
rs3888190
16
28889486
AT
P2A
1P
ositiv
e0.0
34
Positiv
e0.0
38
Positiv
e3.5
e-2
5N
egative
0.6
06
rs11165643
196924097
PT
BP
2P
ositiv
e0.1
33
Positiv
e0.0
01
Positiv
e1.4
e-1
3P
ositiv
e0.2
82
SN
Ps
ple
iotr
op
icfo
rsm
okin
gsta
tus
an
dB
MI
rs11030104
11
27684517
BD
NF
Positiv
e2.4
e-4
Positiv
e0.0
38
Positiv
e6.7
e-3
0P
ositiv
e2.0
e-4
rs6990042
814173974
SG
CZ
Positiv
e0.0
31
Positiv
e0.1
01
Positiv
e4.5
e-0
7P
ositiv
e0.0
45
rs9275595
632681355
XX
bac-
BP
G254F
23.7
Positiv
e0.0
43
Positiv
e0.0
31
Positiv
e5.6
e-0
6P
ositiv
e0.2
14
rs7550711
1110082886
GP
R61
Positiv
e0.0
94
Positiv
e0.0
26
Positiv
e5.1
e-1
4P
ositiv
e0.5
94
rs929641
258792377
LIN
C01122
Positiv
e0.1
36
Positiv
e0.0
04
Positiv
e5.1
e-0
8P
ositiv
e0.7
61
rs12016871
13
28017782
MT
IF3
Negative
0.1
61
Positiv
e0.0
04
Positiv
e9.3
e-1
1N
egative
0.0
20
rs12220375
10
104901491
NT
5C
2P
ositiv
e0.1
68
Positiv
e0.0
10
Positiv
e1.8
e-0
9P
ositiv
e0.1
42
The
SN
Ps
pre
sente
din
this
table
were
cla
ssifie
das
Cate
goriy
four(D
AG
sof10,1
1,1
2in
Fig
1).
The
associa
tion
directions
and
p-v
alu
es
ofth
ese
SN
Ps
with
BM
Iin
GIA
NT
and
with
ever-
sm
okin
gin
TA
Gare
als
opre
sente
d.S
NP
sin
the
shadow
were
sta
tistically
sig
nficantfo
rth
eassocia
tion
with
pack-y
ears
ofsm
okin
gorsm
okin
gsta
tus
inth
eO
ncoA
rray
Pro
ject
popula
tion
(p<0
.05)and
with
ever-
sm
okin
gdata
ofT
AG
consort
ium
with
anom
inals
ignific
ance
ofp<0
.05.
htt
ps:
//doi.o
rg/1
0.1
371/jo
urn
al.p
one.
0185660.t004
Common genetic causes of smoking and BMI
PLOS ONE | https://doi.org/10.1371/journal.pone.0185660 September 28, 2017 11 / 17

had shown strong associations of this locus with BMI [18,39] and various smoking pheno-
types.[17] Evidence from epidemiological studies [40] and animal studies [41] also indicate
associations of BDNF gene with other substance abuse related disorders, eating disorders, and
schizophrenia. The protein BDNF belongs to a neurotrophin family growth factors [42] and is
the most abundant of the neurotrophins in the brain with high concentrations in the hippo-
campus and cerebral cortex.[43,44] BDNF expression in the brain is regulated by the seroto-
nergic[45] and the dopaminergic[46] neurotransmitter systems which are known to be
involved in nicotine use, addictive behaviors, mood and food intake. [47–50]
The TMEM18 (transmembrane protein 18) locus is another known GWAS locus of BMI.
[19] The Icelandic study that examined 32 GWAS loci of BMI had found significant associa-
tions of TMEM18 with both smoking initiation and cigarettes per day, an observation that was
consistent with what we found [31]. The function of TMEM18 is largely unknown. TMEM18 is
highly expressed in neural tissue and has been hypothesized to play a role in energy homeosta-
sis via neural pathways controlling food intake [51].
To our knowledge, both ELAVL4 (ELAV Like RNA Binding Protein 4) and SCGZ (Sarco-
glycan zeta) loci have not been associated with smoking bahavior in GWAS. We examined the
GTEx database, and both ELAVL4 ad SGCZ are highly expressed in multiple brain tissues (Fig
5). The ELAVL4 gene is known to be associated with hallucinogen abuse, paraneoplastic
neurologic disorders, and Parkinson disease [52]. Although there was suggestive evidence of
association between SCGZ locus and BMI, it has not been considered as the GWAS BMI locus;
[20] however, a previous copy number variation (CNV) analysis in two African American pop-
ulations had identified a CNV overlapping with SGCZ gene region to be signficantly associated
with BMI.[53] Previously, SGCZ and other genes invovled in cell adhesion processes were
linked to addiction vulnerability.[54] Cell adhesion mechanisms are central for properly estab-
lishing and regulating neuronal connections during development and can play major roles in
mnemonic processes in adults [55–57]. In addition to reward processes, there are growing
bodies of data implicating that cell-adhesion and related memory-like processes play impor-
tant roles in substance dependence.[54,55,57,58]
Future studies of identification of pleiotropic genes on both BMI and smoking phenotypes
may focus on pathways of those candidate loci, in particular BDNF gene. Among 241 SNPs,
there was one SNP (rs3800229) in the locus of FOXO3 that can be inactivated by signaling path-
ways acctived by neurotrophins (such as BDNF).[59,60] This SNP was assciated with pack-years
in the OncoArray Project data and ever-smoking in TAG data with a nominal signficance of
p<0.05 (data not shown), but this SNP did not achived the cut-off to be classified into the pleio-
tropic categoriy. Nevertheless, our finding on associatons of BDNF suggests the regulatory path-
way of BDNF and its other target loci may play a role in both smoking behavior and BMI.
In general, genetic variants, BMI and smoking phenotypes are in complex relationships. In
addtion to pleiotropic effects of genetic varaints on BMI and smoking phentoypes, there may
also be interactions between genetic variants and smokings on BMI. For example, a recent
study identified several novel BMI loci by accounting for SNP-smoking interactions. [61] In
the presence of such interaction, one would also expect assoications between a SNP and smok-
ing status in BMI-based ascertained samples, although the SNPs is not associated with smoking
status in the general population. A future study fully accounting for these relationships may
reveal additional novel loci of obesity and smoking phenotypes.
In summary, we identified four potential loci that may have pleiotropic effects on BMI and
smoking traits. All four potential pleiotropic loci on BMI and smoking phenotypes are
expressed in the human brain, and prior experimental evidence indicates that these genes are
invovled in relevant complex brain functions, e.g. brain’s reward circutry and neural cell adhe-
sion mechanisms. The biological functions of these genes support our findings. Future studies
Common genetic causes of smoking and BMI
PLOS ONE | https://doi.org/10.1371/journal.pone.0185660 September 28, 2017 12 / 17

of confirmation of these loci may suggest targets for searching new drugs for controlling smok-
ing and eating behaviors. Sequencing these genes and other genes in relevant pathways may be
helpful for identifying funtional variants that have pleiotropic effects on both BMI and smok-
ing behavior.
Supporting information
S1 Table. 241 selected SNPs and the AIC values of different DAGs and minimum AIC val-
ues of different categories.
(DOCX)
Fig 5. The gene expressions of ELAVL4 and SGCZ across different tissue in GTEx database. The bar shows the expression median and interalquartile
range in different tissues. The yellow bars repsent tissues in brain.
https://doi.org/10.1371/journal.pone.0185660.g005
Common genetic causes of smoking and BMI
PLOS ONE | https://doi.org/10.1371/journal.pone.0185660 September 28, 2017 13 / 17

S2 Table. The comparison of associations between different BMI-GRSs and smoking cate-
gories (n = 17,037).
(DOCX)
S3 Table. The comparison of partial correlations between different BMI-GRSs and pack-
years of smoking in smokers.
(DOCX)
S4 Table. The comparison of associations between seven candidate pleiotropic SNPs and
BMI before and after adjustment for smoking phenotypes.
(DOCX)
Acknowledgments
This work was supported by an R21 grant (CA202529, Wang/Ho).
URLs. OncoArray, http://epi.grants.cancer.gov/oncoarray/ and http://oncoarray.
dartmouth.edu/; FastPop, http://sourceforge.net/projects/fastpop/; IMPUTE2, http://mathgen.
stats.ox.ac.uk/impute/impute_v2.html; SHAPEIT, https://mathgen.stats.ox.ac.uk/genetics_
software/shapeit/shapeit.html; GTEx, http://www.gtexportal.org/home/; Braineac, http://
braineac.org/; Tobacco and Genetics (TAG) consortium, https://www.med.unc.edu/pgc/
downloads.
Author Contributions
Conceptualization: Tao Wang, Yun-Chul Hong, Gloria Y. F. Ho.
Data curation: Christopher I. Amos, Rayjean J. Hung, Adonina Tardon, Angeline Andrew,
Chu Chen, David C. Christiani, Demetrios Albanes, Erik H. F. M. van der Heijden, Eric
Duell, Gadi Rennert, Gary Goodman, Geoffrey Liu, James D. Mckay, Jian-Min Yuan, John
K. Field, Jonas Manjer, Kjell Grankvist, Lambertus A. Kiemeney, Loic Le Marchand,
M. Dawn Teare, Matthew B. Schabath, Mattias Johansson, Melinda C. Aldrich, Michael
Davies, Mikael Johansson, Ming-Sound Tsao, Neil Caporaso, Philip Lazarus, Stephen Lam,
Stig E. Bojesen, Susanne Arnold, Xifeng Wu, Xuchen Zong.
Formal analysis: Tao Wang, Jee-Young Moon, Yiqun Wu.
Funding acquisition: Gloria Y. F. Ho.
Investigation: Tao Wang, Christopher I. Amos, Rayjean J. Hung, Adonina Tardon, Angeline
Andrew, Chu Chen, David C. Christiani, Demetrios Albanes, Erik H. F. M. van der Heij-
den, Eric Duell, Gadi Rennert, Gary Goodman, Geoffrey Liu, James D. Mckay, Jian-Min
Yuan, John K. Field, Jonas Manjer, Kjell Grankvist, Lambertus A. Kiemeney, Loic Le Marc-
hand, M. Dawn Teare, Matthew B. Schabath, Mattias Johansson, Melinda C. Aldrich,
Michael Davies, Mikael Johansson, Ming-Sound Tsao, Neil Caporaso, Philip Lazarus, Ste-
phen Lam, Stig E. Bojesen, Susanne Arnold, Xifeng Wu, Xuchen Zong, Yun-Chul Hong.
Methodology: Tao Wang, Jee-Young Moon, Gloria Y. F. Ho.
Supervision: Gloria Y. F. Ho.
Writing – original draft: Tao Wang.
Writing – review & editing: Yiqun Wu, Christopher I. Amos, Rayjean J. Hung, Adonina Tar-
don, Angeline Andrew, Chu Chen, David C. Christiani, Demetrios Albanes, Gloria Y. F.
Ho.
Common genetic causes of smoking and BMI
PLOS ONE | https://doi.org/10.1371/journal.pone.0185660 September 28, 2017 14 / 17

References1. Humans IWGotEoCRt (2012) Personal habits and indoor combustions. Volume 100 E. A review of
human carcinogens. IARC Monogr Eval Carcinog Risks Hum 100: 1–538.
2. McMichael AJ (2008) Food, nutrition, physical activity and cancer prevention. Authoritative report from
World Cancer Research Fund provides global update. Public Health Nutr 11: 762–763. https://doi.org/
10.1017/S1368980008002358 PMID: 18462560
3. Renehan AG, Zwahlen M, Egger M (2015) Adiposity and cancer risk: new mechanistic insights from epi-
demiology. Nat Rev Cancer 15: 484–498. https://doi.org/10.1038/nrc3967 PMID: 26205341
4. Gandini S, Botteri E, Iodice S, Boniol M, Lowenfels AB, et al. (2008) Tobacco smoking and cancer: a
meta-analysis. Int J Cancer 122: 155–164. https://doi.org/10.1002/ijc.23033 PMID: 17893872
5. Chiolero A, Faeh D, Paccaud F, Cornuz J (2008) Consequences of smoking for body weight, body fat
distribution, and insulin resistance. Am J Clin Nutr 87: 801–809. PMID: 18400700
6. Song M, Giovannucci E (2016) Estimating the Influence of Obesity on Cancer Risk: Stratification by
Smoking Is Critical. J Clin Oncol 34: 3237–3239. https://doi.org/10.1200/JCO.2016.67.6916 PMID:
27458311
7. Chiolero A, Jacot-Sadowski I, Faeh D, Paccaud F, Cornuz J (2007) Association of cigarettes smoked
daily with obesity in a general adult population. Obesity (Silver Spring) 15: 1311–1318.
8. Aubin HJ, Farley A, Lycett D, Lahmek P, Aveyard P (2012) Weight gain in smokers after quitting ciga-
rettes: meta-analysis. BMJ 345: e4439. https://doi.org/10.1136/bmj.e4439 PMID: 22782848
9. Samet JM (1990) The 1990 Report of the Surgeon General: The Health Benefits of Smoking Cessation.
Am Rev Respir Dis 142: 993–994. https://doi.org/10.1164/ajrccm/142.5.993 PMID: 2240852
10. Mineur YS, Abizaid A, Rao Y, Salas R, DiLeone RJ, et al. (2011) Nicotine decreases food intake through
activation of POMC neurons. Science 332: 1330–1332. https://doi.org/10.1126/science.1201889
PMID: 21659607
11. Nicklas BJ, Tomoyasu N, Muir J, Goldberg AP (1999) Effects of cigarette smoking and its cessation on
body weight and plasma leptin levels. Metabolism 48: 804–808. PMID: 10381158
12. Audrain-McGovern J, Benowitz NL (2011) Cigarette smoking, nicotine, and body weight. Clin Pharma-
col Ther 90: 164–168. https://doi.org/10.1038/clpt.2011.105 PMID: 21633341
13. Bamia C, Trichopoulou A, Lenas D, Trichopoulos D (2004) Tobacco smoking in relation to body fat
mass and distribution in a general population sample. Int J Obes Relat Metab Disord 28: 1091–1096.
https://doi.org/10.1038/sj.ijo.0802697 PMID: 15197410
14. Gearhardt AN, Grilo CM, DiLeone RJ, Brownell KD, Potenza MN (2011) Can food be addictive? Public
health and policy implications. Addiction 106: 1208–1212. https://doi.org/10.1111/j.1360-0443.2010.
03301.x PMID: 21635588
15. Ziauddeen H, Farooqi IS, Fletcher PC (2013) Obesity and the brain: how convincing is the addiction
model? European Neuropsychopharmacology 23: S156–S156.
16. Volkow ND, Wang G-J, Fowler JS, Telang F (2008) Overlapping neuronal circuits in addiction and obe-
sity: evidence of systems pathology. Philosophical Transactions of the Royal Society B: Biological Sci-
ences 363: 3191–3200. https://doi.org/10.1098/rstb.2008.0107 PMID: 18640912
17. Tobacco, Genetics C (2010) Genome-wide meta-analyses identify multiple loci associated with smok-
ing behavior. Nat Genet 42: 441–447. https://doi.org/10.1038/ng.571 PMID: 20418890
18. Thorleifsson G, Walters GB, Gudbjartsson DF, Steinthorsdottir V, Sulem P, et al. (2009) Genome-wide
association yields new sequence variants at seven loci that associate with measures of obesity. Nat
Genet 41: 18–24. https://doi.org/10.1038/ng.274 PMID: 19079260
19. Speliotes EK, Willer CJ, Berndt SI, Monda KL, Thorleifsson G, et al. (2010) Association analyses of
249,796 individuals reveal 18 new loci associated with body mass index. Nat Genet 42: 937–948.
https://doi.org/10.1038/ng.686 PMID: 20935630
20. Locke AE, Kahali B, Berndt SI, Justice AE, Pers TH, et al. (2015) Genetic studies of body mass index
yield new insights for obesity biology. Nature 518: 197–206. https://doi.org/10.1038/nature14177
PMID: 25673413
21. Vink JM, Smit AB, de Geus EJ, Sullivan P, Willemsen G, et al. (2009) Genome-wide association study
of smoking initiation and current smoking. Am J Hum Genet 84: 367–379. https://doi.org/10.1016/j.
ajhg.2009.02.001 PMID: 19268276
22. Thorgeirsson TE, Gudbjartsson DF, Surakka I, Vink JM, Amin N, et al. (2010) Sequence variants at
CHRNB3-CHRNA6 and CYP2A6 affect smoking behavior. Nat Genet 42: 448–453. https://doi.org/10.
1038/ng.573 PMID: 20418888
Common genetic causes of smoking and BMI
PLOS ONE | https://doi.org/10.1371/journal.pone.0185660 September 28, 2017 15 / 17

23. Liu JZ, Tozzi F, Waterworth DM, Pillai SG, Muglia P, et al. (2010) Meta-analysis and imputation refines
the association of 15q25 with smoking quantity. Nat Genet 42: 436–440. https://doi.org/10.1038/ng.
572 PMID: 20418889
24. Yoon D, Kim YJ, Cui WY, Van der Vaart A, Cho YS, et al. (2012) Large-scale genome-wide association
study of Asian population reveals genetic factors in FRMD4A and other loci influencing smoking initia-
tion and nicotine dependence. Hum Genet 131: 1009–1021. https://doi.org/10.1007/s00439-011-1102-
x PMID: 22006218
25. David SP, Hamidovic A, Chen GK, Bergen AW, Wessel J, et al. (2012) Genome-wide meta-analyses of
smoking behaviors in African Americans. Transl Psychiatry 2: e119.
26. Speliotes EK, Willer CJ, Berndt SI, Monda KL, Thorleifsson G, et al. (2010) Association analyses of
249,796 individuals reveal 18 new loci associated with body mass index. Nat Genet 42: 937–948.
https://doi.org/10.1038/ng.686 PMID: 20935630
27. Lee SH, DeCandia TR, Ripke S, Yang J, Schizophrenia Psychiatric Genome-Wide Association Study
C, et al. (2012) Estimating the proportion of variation in susceptibility to schizophrenia captured by com-
mon SNPs. Nat Genet 44: 247–250. https://doi.org/10.1038/ng.1108 PMID: 22344220
28. Yang J, Li MD (2016) Converging findings from linkage and association analyses on susceptibility
genes for smoking and other addictions. Mol Psychiatry 21: 992–1008. https://doi.org/10.1038/mp.
2016.67 PMID: 27166759
29. Yang J, Benyamin B, McEvoy BP, Gordon S, Henders AK, et al. (2010) Common SNPs explain a large
proportion of the heritability for human height. Nat Genet 42: 565–569. https://doi.org/10.1038/ng.608
PMID: 20562875
30. Bulik-Sullivan B, Finucane HK, Anttila V, Gusev A, Day FR, et al. (2015) An atlas of genetic correlations
across human diseases and traits. Nat Genet 47: 1236–1241. https://doi.org/10.1038/ng.3406 PMID:
26414676
31. Thorgeirsson TE, Gudbjartsson DF, Sulem P, Besenbacher S, Styrkarsdottir U, et al. (2013) A common
biological basis of obesity and nicotine addiction. Transl Psychiatry 3: e308. https://doi.org/10.1038/tp.
2013.81 PMID: 24084939
32. Amos CI, Dennis J, Wang Z, Byun J, Schumacher FR, et al. (2017) The OncoArray Consortium: A Net-
work for Understanding the Genetic Architecture of Common Cancers. Cancer Epidemiol Biomarkers
Prev 26: 126–135. https://doi.org/10.1158/1055-9965.EPI-16-0106 PMID: 27697780
33. McKay JD, Hung RJ, Han Y, Zong X, Carreras-Torres R, et al. (2017) Large-scale association analysis
identifies new lung cancer susceptibility loci and heterogeneity in genetic susceptibility across histologi-
cal subtypes. Nat Genet 49: 1126–1132. https://doi.org/10.1038/ng.3892 PMID: 28604730
34. Howie BN, Donnelly P, Marchini J (2009) A flexible and accurate genotype imputation method for the
next generation of genome-wide association studies. PLoS Genet 5: e1000529. https://doi.org/10.
1371/journal.pgen.1000529 PMID: 19543373
35. Howie B, Fuchsberger C, Stephens M, Marchini J, Abecasis GR (2012) Fast and accurate genotype
imputation in genome-wide association studies through pre-phasing. Nat Genet 44: 955–959. https://
doi.org/10.1038/ng.2354 PMID: 22820512
36. Delaneau O, Marchini J, Zagury JF (2011) A linear complexity phasing method for thousands of
genomes. Nat Methods 9: 179–181. https://doi.org/10.1038/nmeth.1785 PMID: 22138821
37. Locke AE, Kahali B, Berndt SI, Justice AE, Pers TH, et al. (2015) Genetic studies of body mass index
yield new insights for obesity biology. Nature 518: 197–U401. https://doi.org/10.1038/nature14177
PMID: 25673413
38. Pearl J (2000) Causality: Models, Reasoning and Inference Cambridge University Press.
39. Gunstad J, Schofield P, Paul RH, Spitznagel MB, Cohen RA, et al. (2006) BDNF Val66Met polymor-
phism is associated with body mass index in healthy adults. Neuropsychobiology 53: 153–156. https://
doi.org/10.1159/000093341 PMID: 16707914
40. Gratacos M, Gonzalez JR, Mercader JM, de Cid R, Urretavizcaya M, et al. (2007) Brain-derived neuro-
trophic factor Val66Met and psychiatric disorders: meta-analysis of case-control studies confirm associ-
ation to substance-related disorders, eating disorders, and schizophrenia. Biol Psychiatry 61: 911–922.
https://doi.org/10.1016/j.biopsych.2006.08.025 PMID: 17217930
41. Grimm JW, Lu L, Hayashi T, Hope BT, Su TP, et al. (2003) Time-dependent increases in brain-derived
neurotrophic factor protein levels within the mesolimbic dopamine system after withdrawal from
cocaine: implications for incubation of cocaine craving. J Neurosci 23: 742–747. PMID: 12574402
42. Leibrock J, Lottspeich F, Hohn A, Hofer M, Hengerer B, et al. (1989) Molecular cloning and expression
of brain-derived neurotrophic factor. Nature 341: 149–152. https://doi.org/10.1038/341149a0 PMID:
2779653
Common genetic causes of smoking and BMI
PLOS ONE | https://doi.org/10.1371/journal.pone.0185660 September 28, 2017 16 / 17

43. Conner JM, Lauterborn JC, Yan Q, Gall CM, Varon S (1997) Distribution of brain-derived neurotrophic
factor (BDNF) protein and mRNA in the normal adult rat CNS: evidence for anterograde axonal trans-
port. J Neurosci 17: 2295–2313. PMID: 9065491
44. Katoh-Semba R, Takeuchi IK, Semba R, Kato K (1997) Distribution of brain-derived neurotrophic factor
in rats and its changes with development in the brain. J Neurochem 69: 34–42. PMID: 9202291
45. Mossner R, Daniel S, Albert D, Heils A, Okladnova O, et al. (2000) Serotonin transporter function is
modulated by brain-derived neurotrophic factor (BDNF) but not nerve growth factor (NGF). Neurochem
Int 36: 197–202. PMID: 10676853
46. Guillin O, Diaz J, Carroll P, Griffon N, Schwartz JC, et al. (2001) BDNF controls dopamine D3 receptor
expression and triggers behavioural sensitization. Nature 411: 86–89. https://doi.org/10.1038/
35075076 PMID: 11333982
47. Lyons WE, Mamounas LA, Ricaurte GA, Coppola V, Reid SW, et al. (1999) Brain-derived neurotrophic
factor-deficient mice develop aggressiveness and hyperphagia in conjunction with brain serotonergic
abnormalities. Proc Natl Acad Sci U S A 96: 15239–15244. PMID: 10611369
48. Janhunen S, Ahtee L (2007) Differential nicotinic regulation of the nigrostriatal and mesolimbic dopami-
nergic pathways: implications for drug development. Neurosci Biobehav Rev 31: 287–314. https://doi.
org/10.1016/j.neubiorev.2006.09.008 PMID: 17141870
49. Kenny PJ, File SE, Neal MJ (2000) Evidence for a complex influence of nicotinic acetylcholine receptors
on hippocampal serotonin release. J Neurochem 75: 2409–2414. PMID: 11080192
50. Seth P, Cheeta S, Tucci S, File SE (2002) Nicotinic—serotonergic interactions in brain and behaviour.
Pharmacol Biochem Behav 71: 795–805. PMID: 11888570
51. Ward LD, Kellis M (2012) HaploReg: a resource for exploring chromatin states, conservation, and regu-
latory motif alterations within sets of genetically linked variants. Nucleic Acids Res 40: D930–934.
https://doi.org/10.1093/nar/gkr917 PMID: 22064851
52. Noureddine MA, Qin XJ, Oliveira SA, Skelly TJ, van der Walt J, et al. (2005) Association between the
neuron-specific RNA-binding protein ELAVL4 and Parkinson disease. Hum Genet 117: 27–33. https://
doi.org/10.1007/s00439-005-1259-2 PMID: 15827745
53. Zhao W, Wineinger NE, Tiwari HK, Mosley TH, Broeckel U, et al. (2012) Copy number variations associ-
ated with obesity-related traits in African Americans: a joint analysis between GENOA and HyperGEN.
Obesity (Silver Spring) 20: 2431–2437.
54. Liu QR, Drgon T, Johnson C, Walther D, Hess J, et al. (2006) Addiction molecular genetics: 639,401
SNP whole genome association identifies many "cell adhesion" genes. Am J Med Genet B Neuropsy-
chiatr Genet 141B: 918–925. https://doi.org/10.1002/ajmg.b.30436 PMID: 17099884
55. Welzl H, Stork O (2003) Cell adhesion molecules: key players in memory consolidation? News Physiol
Sci 18: 147–150. PMID: 12869614
56. Qiu S, Korwek KM, Weeber EJ (2006) A fresh look at an ancient receptor family: emerging roles for low
density lipoprotein receptors in synaptic plasticity and memory formation. Neurobiol Learn Mem 85:
16–29. https://doi.org/10.1016/j.nlm.2005.08.009 PMID: 16198608
57. Benson DL, Schnapp LM, Shapiro L, Huntley GW (2000) Making memories stick: cell-adhesion mole-
cules in synaptic plasticity. Trends Cell Biol 10: 473–482. PMID: 11050419
58. Uhl GR (2004) Molecular genetic underpinnings of human substance abuse vulnerability: likely contribu-
tions to understanding addiction as a mnemonic process. Neuropharmacology 47 Suppl 1: 140–147.
59. Zhu W, Bijur GN, Styles NA, Li X (2004) Regulation of FOXO3a by brain-derived neurotrophic factor in
differentiated human SH-SY5Y neuroblastoma cells. Brain Res Mol Brain Res 126: 45–56. https://doi.
org/10.1016/j.molbrainres.2004.03.019 PMID: 15207915
60. Zheng WH, Kar S, Quirion R (2002) FKHRL1 and its homologs are new targets of nerve growth factor
Trk receptor signaling. J Neurochem 80: 1049–1061. PMID: 11953455
61. Justice AE, Winkler TW, Feitosa MF, Graff M, Fisher VA, et al. (2017) Genome-wide meta-analysis of
241,258 adults accounting for smoking behaviour identifies novel loci for obesity traits. Nat Commun 8:
14977. https://doi.org/10.1038/ncomms14977 PMID: 28443625
Common genetic causes of smoking and BMI
PLOS ONE | https://doi.org/10.1371/journal.pone.0185660 September 28, 2017 17 / 17