c_subline_13: masox am doku · web viewto complete the prioritisation exercise, a simple matrix was...
TRANSCRIPT
w
CIVITAS CAPITAL Sustainable Mobility IndicatorsSummary of the interviews conducted with the cities of Paris, Lyon, Copenhagen, Stuttgart, Zurich and Edinburgh
Deliverable No.:
Project Acronym: CAPITAL
Full Title: CIVITAS CAPITAL – making the best of CIVITAS
Grant Agreement No.: 604778
Workpackage/Measure No.: 2
Workpackage/ Measure Title: CIVITAS Advisory Groups
Responsible Author(s): Damian Stantchev and Tom Rye
Responsible Co-Author(s): Henrik Gudmundsson, Daniel Sauter, Jimmy Armoogum, Christian Rydén
<Deliverable No.> - <Deliverable Title> <Date>
Abstract
This report builds on the work undertaken by the CIVITAS CAPITAL Data and Statistics Advisory Group (AG5) and summarises the results of a number of interviews conducted with the cities of Edinburgh, Copenhagen, Paris, Lyon, Stuttgart and Zurich
Project Partners
Organization Country Abbreviation
Edinburgh Napier University UK ENU
Document History
Date Person Action Status Diss. Level
13/07/16 Damian Stantchev Submitted to PC Final PC
Status: Draft, Final, Approved, and Submitted (to European Commission).
Dissemination Level: PC = Project Coordinator, SC=Site Coordinator, TC=Technical Coordinator, EM=Evaluation Manager.
2 / 59

<Deliverable No.> - <Deliverable Title> <Date>
Table of Contents
1 EXECUTIVE SUMMARY4
2 SUMMARY OF THE INTERVIEWS CONDUCTED WITH SELECTED EUROPEAN CITIES 4
2.1 EXISTING DATA COLLECTED BY THE CITIES IN COMPARISON TO THOSE IN THE CAPITAL INDICATOR SET
4
2.2 COLLECTION OF DATA THAT ARE NOT COVERED BY THE AG5 INDICATORS 5
2.3 THE NUMBER AND SCOPE OF INDICATORS SEEN AS NECESSARY TO COLLECT 5
2.4 MAIN REASONS FOR COLLECTING DATA AND THE WAYS IN WHICH IT IS USED 6
2.5 DATA COLLECTION FUNDING SOURCES 6
2.6 DATA COLLECTION FUNDING SOURCES 7
3 PRIORITISATION AND CONSOLIDATIO………………………………………………………………….7
4 GENERAL CONCLUSIONS……………………………………………………………………………….10
5 APPENDICES………………………………………………………………………………………………11
List of Figures
Figure 1: An example of the prioritised indicators...................................................................11
List of Tables
Table 1: Criteria for prioritisation of the indicators..................................................................10
Table 2: Criteria for prioritisation of the indicators..................................................................10
Acknowledgements
We would like to thank the following people for their invaluable contribution to this report:
Robert Dorbritz, Verkehr+Stadtraum, Tiefbauamt, City of Zurich Manfred Wacker, Lehrstuhl für Verkehrsplanung und Verkehrsleittechnik, Institut für
Strassen- und Verkehrswesen, University of Stuttgart Annette Kayser, City of Copenhagen Anne-Eole Meret-Conti, Division Etudes Générales, STIF, City of Paris Christelle Paulo, Division Etudes Générales, STIF, City of Paris Asselot-Hurez Séverine, Direction de la prospective, des études amont et du PDU,
SYTRAL, City of Lyon
This report is based on the deliberations and discussions of the expert members of the project’s Advisory Group 5 on Data and Statistics. These members are:
Isabelle Maës, European Commission
3 / 59

<Deliverable No.> - <Deliverable Title> <Date>
Daniel Sauter, Urban Mobility Research Jimmy Armoogum, IFSTTAR Henrik Gudmundsson, DTU Christian Ryden, Lunds Kommun
4 / 59

<Deliverable No.> - <Deliverable Title> <Date>
1 Executive SummaryThis report builds on the work undertaken by the CIVITAS CAPITAL Data and Statistics Advisory Group (AG5), which resulted in the production of a short document (a brochure) that cities can use to guide them in the collection and use of data. This brochure presents a set of simple, easy to use indicators that cities can utilise to measure how well their transport system is performing. In order to assess the practicality and appropriateness of such a system of indicators, several cities across Europe, including Edinburgh, Copenhagen, Paris, Lyon, Stuttgart and Zurich, were consulted about their views on the indicator set and their use in general of such indicators. The AG5 experts used a questionnaire and conducted face-to-face interviews with city representatives (or appointed representatives) to collect data. The results and feedback received from these cities are summarised in this report.
2 Summary of the interviews conducted with selected European cities
2.1 Existing data collected by the cities in comparison to those in the CAPITAL indicator set
The cities interviewed collect data on a number of indicators either by themselves or through other organisations. A wide range of methods and sources for data collection are used, such as questionnaire surveys, automatic or manual counts, calculations based on mapping or other input, registry and general statistics.
Even though there are quite a few similarities in the ways cities collect data, the responses are very specific to each city and if the response data is aggregated, some valuable detailed knowledge will be lost. To avoid this, the data collection efforts on a city-by-city basis are presented in the appendices.
Overall it is a clear finding and important to note that the interviewed cities currently gather a narrower range of indicators than that set out in the indicator set developed by AG5. Most cities gather data together with other agencies in their respective region or use disaggregated national-level data. Taking all data sources together, only the three cities of Stuttgart, Copenhagen and Zurich gather data related to more than half of the indicators in the AG5 indicator set – although often not in the same format as that proposed by AG5.
The main areas where data are gathered or are available among the six cities are shown below. This list includes areas where data are not at present regularly gathered in certain cities, but where those interviewed had a reasonable certainty that the data are available either from the city’s own sources, or from another agency locally:
Safety (collisions, casualties)
Public transport supply
Air quality
Car ownership
5 / 59

<Deliverable No.> - <Deliverable Title> <Date>
Mode split
Bike stations, car club cars
Length of pedestrianised, traffic calmed streets
Cost of public transport
Cost of parking
2.2 Collection of data that are not covered by the AG5 indicatorsSome of the cities interviewed collect data that are not covered by the list of indicators included in the brochure produced by AG5. Specific examples include the city of Zurich which collects bicycle and walking data based on around 20 automatic bicycle and as many pedestrian counters as well as data on bicycle parking and data related to the walking network and its infrastructure (e.g. inventory of benches). Some of these data are collected only for internal purposes.
The City of Edinburgh collects the following additional data: length of bus lanes, number of PT passengers per year, annual city centre passenger and pedestrian cordon count, numbers of paid on-street parking acts per year, number of parking fines per year, number of parking fines appealed (successfully), number of people slightly injured, and queues at traffic signals. It also has access to automatic vehicle location data for the main bus operator’s vehicles meaning that it has a record of the journey time of every single bus vehicle trip undertaken in the city by this operator; however, this data is rarely interrogated by the City authority itself.
2.3 The number and scope of indicators seen as necessary to collect
The general view from the cities is that the range of indicators is interesting but rather too large and that it could therefore be too expensive and complex to collect. However, Stuttgart did agree that 20-30 indicators is a very good number if a comprehensive picture of the city’s mobility system is to be gained. Specific comments were as follows:
Paris already collects a large set of indicators and for this reason they would not use the proposed set of indicators.
Lyon mentioned that the indicators were too complicated to collect and that they would be put off by the frequency of data collection.
Zurich mentioned that one important issue for them would be communication if they adopted the indicator set. They already have their own set and only communicate a limited number of indicators. They would not publish further indicators but may possibly use them internally.
6 / 59

<Deliverable No.> - <Deliverable Title> <Date>
Edinburgh said that it seems many indicators are quite expensive to collect and it is not totally clear what they would do with the data if they had it - with the possible exception of those related to accessibility and access to services, and CO2. They felt that the data they have gives them a sufficient idea of their progress against their SUMP objectives and targets.
2.4 Main reasons for collecting data and the ways in which it is used
AG5 was interested to understand what the interviewed cities actually do with the data that they already collect. Clearly, a possible use of a standard set of indicators is the ability to benchmark one’s performance against that of other cities, whilst a set of indicators specific to one city only permits that city to monitor its progress internally, over time, in relation to its own objectives. The majority of cities interviewed use their data primarily for the second of these two purposes, as is confirmed by the following individual responses:
No benchmarking is done because the challenge is to find comparable territories – and how to characterize these cities/authorities (Lyon);
The data is used mostly internally. Benchmarking would be nice but the indicators are rarely comparable due to different contexts, definitions, situations and backgrounds of and within the cities. Even between Swiss cities the data is very difficult to compare on a fair basis (Zurich);
The data is only used internally (Stuttgart);
The data is primarily used internally and for SUMP monitoring. Benchmarking rarely is a major issue (Edinburgh).
The main motivations of cities for collecting the data are statutory requirements (Paris, Lyon), monitoring or controlling requirements (to measure the progress of Zurich’s “Stadtverkehr 2025” mobility strategy), data requirements (to get basic figures for operating and planning the transport supply in the city of Stuttgart) and monitoring longer-term impacts of policies (Edinburgh). Copenhagen also collects data to inform and engage the public in urban policy, e.g. through ‘green accounts’. In this sense there is a commonality between most cities – they are collecting data to understand how to plan the city’s transport system, and then to see whether or not their policy objectives have been achieved. The external communication of results is of lesser concern to most of the cities interviewed.
2.5 Data collection funding sourcesThe general pattern is that cities pay themselves to collect the data, but if there is a survey that is the responsibility of a higher level of government, then that level of government pays, sometimes with a contribution from the city for an increase in local sample size (as for
7 / 59

<Deliverable No.> - <Deliverable Title> <Date>
example for Copenhagen). In France there are specific state contributions for the collection of household travel survey data. In the cases of Paris and Lyon, the local authorities pay for the data (and the analysis) with a contribution from the state. Unlike these two French cities, the city of Zurich pays for all data collection and processing. It contributes to the national travel survey by enlarging the sample. The main costs of that survey are paid by the federal government. The Region of Stuttgart (VRS) pays for data collected within the region, including therefore data collected from residents of the City of Stuttgart. In Scotland, mode share data collection is financed by Scottish Government but with a contribution from the City of Edinburgh to boost sample size.
2.6 Storage and availability of dataThe AG5 team sought to understand whether cities not only collect data, but also store it in a “location” and format that makes it accessible to other professionals and potentially also to the public – so-called “open data”. The tendency, with some exceptions, is that although in principle there are some provisions in place for storing the data in a central data bank, this has not been fully done yet. The data is also only partially accessible to the public. The following specific responses were obtained from the cities:
No storage, but it can be done (as all the data files since the beginning are available) (Paris)
Yes, there is a central storage (Réseau Quételet) with a systematic approach to archiving the data if the city accepts the financial contribution from the state (Lyon)
Yes, there is central data bank (TAZ Datenbank) and a systematic approach to archiving the data (Zurich)
There is a partial storage (Stuttgart)
No storage (Edinburgh)
Has created Open Data website with some transport data (Copenhagen)
The public availability of the data still remains an issue as no open data policy is in place as reported by Paris, Lyon and Stuttgart. Nevertheless, anonymized data are available to researchers (Paris and Lyon) and raw data on bicycle counts are public in Zurich. The City of Zurich intends to increase data availability in the future, and currently there are plans to make the data on parking spaces for cars and bicycles available to the public. In the case of Edinburgh, data are published periodically in the regular updates of the city’s Local Transport Strategy. Copenhagen publishes its indicators in a biennial cycling monitor document, and in their Green Account, and is also pioneering an Open Data site (http://data.kk.dk/).
3 Prioritisation and consolidation
8 / 59

<Deliverable No.> - <Deliverable Title> <Date>
The interviews with a number of cities across Europe have shown that collecting data on a regular basis for all indicators is an almost impossible task, mainly due to various resource constraints. Therefore, there was a need to prioritise the indicators for which data need to be collected.
To reduce subjectivity and improve the usefulness of the indicators, the AG5 experts proposed that this prioritisation should follow a set of criteria (as shown in Table 1) and should take into consideration the characteristics of each individual city, such as size, level of economic development, political governance and history. The individual characteristics of a city are important as they will inevitably place different priorities and pressures on the need to collect data for each of the indicators.
The issue of subjectivity is exacerbated even more if the selection has to be made across the entire set of indicators. Therefore, the indicators have been divided into the following 9 groups at an earlier stage, as shown below:
(1) Travel patterns(2) Accessibility(3) Speed and safety(4) Walking(5) Cycling(6) Public transport(7) Cars and parking(8) Social impacts/Liveability(9) Environmental impacts
To ensure that each of the reference categories are represented, at least one indicator per group was selected. In this way, the prioritisation exercise was carried out among a more limited number (typically 3-4) of indicators within each group, which also to an extent alleviates the issues arising from the inevitable subjectivity during the selection process.
The requirement to select one indicator per category does not only ensure full coverage of the entire range of topics, but also satisfies the criterion on having all modes represented (since there are modal categories), and (partly) the one of having sustainability dimensions represented.
9 / 59

<Deliverable No.> - <Deliverable Title> <Date>
No Criterion for prioritisation
C1 Relevance for one or more of the three impact dimensions of sustainability (environment, social, economic), or measuring key transport system features (which are precursors of those impacts)
C2 Representation of all urban modes, especially SUMP compatible modes such as walking, cycling and public transport, bust also motor vehicles and freight distribution that need to be managed
C3 Alignment with data and indicators that many cities use already
C4 Easy data collection, preferably with standard concepts and methods
C5 Actionability and decision relevance for a city, including for urban planning, financial allocation, and communication
C6 Support reporting for key European urban transport policy goals, such a GHG emissions, fuel mix of vehicles in use, traffic safety, congestion, ICT/ITS deployment
Table 1: Criteria for prioritisation of the indicators
To counterbalance the unavoidable subjectivity during the selection process, the prioritisation exercise was undertaken by a group of experts (a panel of academics and practitioners in urban planning from different European countries) and resulted in selecting one indicator with the highest score within each category, as shown in Table 2.
Category Indicator with highest score within category
Travel Patterns Modal split
Accessibility Density (land use)
Speed and safety Safety – people killed and seriously injured in traffic collisions
Walking Accessibility of outside built environment
Cycling Extent of on-street cycle network
10 / 59

<Deliverable No.> - <Deliverable Title> <Date>
Public Transport Public transport service per head of population
Cars and parking Car ownership
Social impacts/Liveability Citizen satisfaction with transport system
Environmental impacts CO2 emissions from personal transport per capita
Table 2: Indicators with the highest scores within each category as a result of the prioritisation process
To complete the prioritisation exercise, a simple matrix was used and each of the indicators was assessed on a 1-5 scale (where 1 is poor fit and 5 is best fit) to see how well each of the indicators corresponds to each of the criteria. A score for each of the indicators was obtained and the ranking of indicators within each group was also derived.
An example of the prioritisation is shown in Figure 1 below.
Figure 1: An example of the prioritised indicators
11 / 59

<Deliverable No.> - <Deliverable Title> <Date>
The scores between the four experts were not identical, but almost unanimous when it came to selecting the indicator with the highest score within each category. The ranking across the entire set of indicators resulted in much more random and diverse scores, which confirmed the initial assumption by the team that the prioritisation would be more consistent if performed within each category group.
It should also be noted that cities in principle can derive their own set of “top priority” indicators. This approach, however, although it can be beneficial to individual cities, would not allow benchmarking against other cities to be performed due to the lack of consistency in priorities related to data collection and analysis. If cities do not collect data on the same or at least very similar prescribed set of indicators and monitor and analyse the data over a sufficient period of time, it is clear that any robust comparisons between cities become rather difficult or even impossible. Which approach would cities take will of course depend on their individual needs and preferences.
4 General conclusions
This study has shown that the interviewed cities do collect at least some data either from primary or secondary sources and produce a range of sustainable mobility indicators. There are similarities, but also important differences in the way they collect, use and store the data. Most cities use the data internally and these are partially available to the public. Cities also reported some gaps in the data collection and its archiving in a systematic way.
It has transpired that most cities interviewed produce indicators in addition to the set listed in the brochure produced by AG5. The City of Edinburgh was the one that collects by far the largest number of indicators not mentioned in the brochure. On the other hand, other cities such as Zurich and Copenhagen along with other agencies in their region collect data that relates to a quite high proportion of the indicators produced by the CAPITAL Advisory Group.
Collecting data for all indicators was seen as an almost impossible task, due to various resource constraints. In practice even ”leaders” or ”champions” of sustainable transport gather far less than the full set included in the brochure. Therefore, the need to prioritise the indicators for which data is collected was identified. Furthermore, it was concluded that this prioritisation should follow a set of criteria and should take into consideration the characteristics of each individual city. An attempt to prioritise the indicators using a set of criteria and a worked example were included in this report. It would be very useful to conduct similar exercise involving larger groups of experts and stakeholders, for example involving groups of cities with similar characteristics.
12 / 59

<Deliverable No.> - <Deliverable Title> <Date>
A possible use of a standard set of indicators is the ability to benchmark one’s performance against that of other cities. However, this research found little interest from cities in benchmarking. Although cities would like to get an idea about their own performance, it was acknowledged that benchmarking is difficult because of the different contexts of the cities that cannot properly be reflected in the existing set of indicators. Some local political influences that affect the process of communicating the indicators to the public were also reported.
The proposed set of indicators may therefore be helpful primarily in providing cities with knowledge of how they can establish their own monitoring system and in helping them to identify how to use these indicators for at least internal purposes. While it would be highly desirable that cities adopted the proposed indicators and published the collected data, the reality is that some cities already have their own indicators, others do not want to change their definitions and still others only want to communicate their own limited set of data.
It should also be noted that cities in principle can derive their own set of top indicators. This approach, however, although it can be beneficial to individual cities, would not allow benchmarking against other cities to be performed due to the lack of consistency in priorities related to data collection and analysis. If cities do not collect data on the same or at least very similar prescribed set of indicators and monitor and analyse the data over a sufficient period of time, it is clear that any robust comparisons between cities become rather difficult or even impossible. Which approach would cities take will of course depend on their individual needs and preferences.
13 / 59

<Deliverable No.> - <Deliverable Title> <Date>
Appendix 1: Responses from the City of Paris
Questions to cities on collection and use(-fulness) of data and CIVITAS CAPITAL AG5 indicator set
Thank you for taking the time to look through the indicator set that has been produced by the Data and Statistics Expert Advisory Group of the EU’s CIVITAS CAPITAL project. We have a few questions about how much data your organisation currently collects in relation to our suggested indicators, and your views on the indicators. When it comes to data that you already collect, we are interested in whether data are collected, not whether they are published publicly as indicators of your city’s performance (so please think about published and unpublished data when answering the questions).
Question 1.
Please complete the following table for each indicator. Please note that you only need to complete the columns about method and frequency of data collection, and how you use the data, if you personally know that this data is collected regularly by your or another organisation, and you know where to access it. In terms of the method used to collect data, instead of writing a description, please use one of the following codes:
M1 questionnaire survey, M5 general statistics,
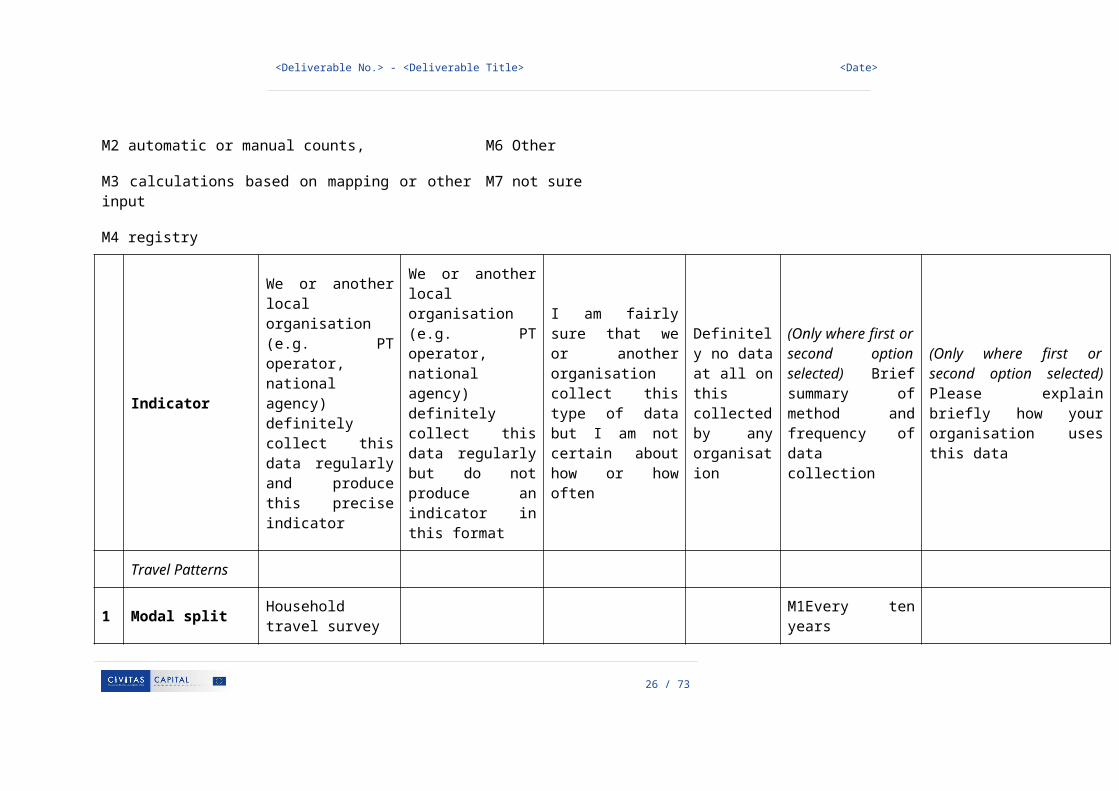
M2 automatic or manual counts, M6 Other
M3 calculations based on mapping or other input M7 not sure
14 / 59

<Deliverable No.> - <Deliverable Title> <Date>
M4 registry
Indicator
We or another local organisation (e.g. PT operator, national agency) definitely collect this data regularly and produce this precise indicator
We or another local organisation (e.g. PT operator, national agency) definitely collect this data regularly but do not produce an indicator in this format
I am fairly sure that we or another organisation collect this type of data but I am not certain about how or how often
Definitely no data at all on this collected by any organisation
(Only where first or second option selected) Brief summary of method and frequency of data collection
(Only where first or second option selected) Please explain briefly how your organisation uses this data
Travel Patterns
1 Modal splitCollected by the STIF through the “EGT”
M1Every ten years
2Trip lengths and travel time by different modes
Collected by the STIF through the “EGT”
M1 Every ten years
Accessibility
3 Density (land use) Collected by “INSEE” M4 (Census) Every year
15 / 59

<Deliverable No.> - <Deliverable Title> <Date>
4Accessibility to key services
Could be done with a GIS
5
Distance from home to nearest public transport stop
Could be done with a GIS
Speed and safety
6Traffic calmed and car-free/pedestrianised streets
Collected by the STIF (only traffic calmed streets)
7Percentage of vehicles speeding
Don’t know
8
Safety – people killed and seriously injured in traffic collisions
Collected by the State services (DRIEA)
M7 not sure - Monthly
Walking
9 Extent of off-street walking path
Could be done with a
16 / 59

<Deliverable No.> - <Deliverable Title> <Date>
network GIS
10Accessibility of outside built environment
Don’t know
Cycling
11Extent of on-street cycle network
Could be done with a GIS
12 Bike ownershipCollected by the STIF through the “EGT”
M1 Every ten years
13Bike sharing bikes and stations per capita
Vélib’
Public Transport
14 Public transport service per head of population
Collected by the STIF (and total of population collected by “INSEE”)
M5 Every year
15 Cost of public Collected by the STIF M5 Every year
17 / 59

<Deliverable No.> - <Deliverable Title> <Date>
transport
16 Peak PT speed related to car speed at peak times
Partially available at STIF (no indicator published)
17 Public Transport reliability
Collected by the STIF
The STIF uses the data by publishing every month a newsletter about the punctuality of the public transport.
Cars and parking
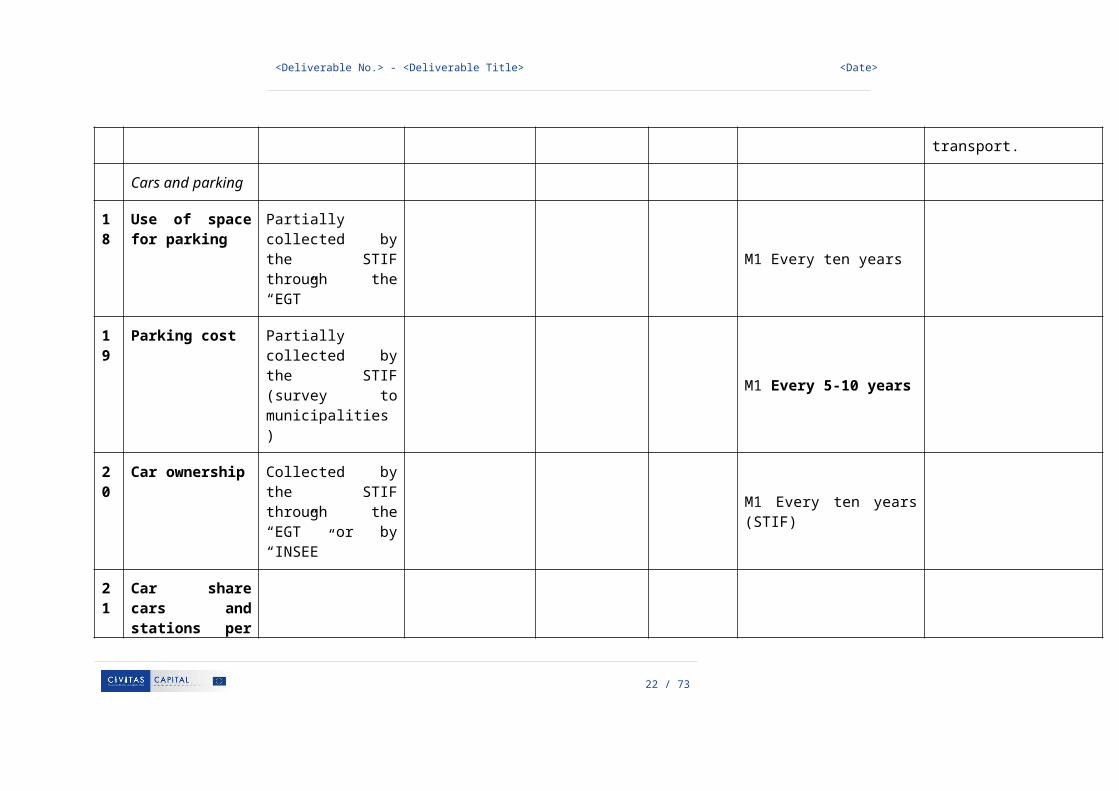
18 Use of space for parking
Partially collected by the STIF through the “EGT”
M1 Every ten years
19 Parking cost Partially collected by the STIF (survey to municipalities)
M1 Every 5-10 years
20 Car ownership Collected by the STIF through the “EGT” or by “INSEE”
M1 Every ten years (STIF)
18 / 59

<Deliverable No.> - <Deliverable Title> <Date>
21 Car share cars and stations per capita
Social impacts/Liveability
22 Citizen satisfaction with transport system Collected by the STIF M1 questionnaire survey
The STIF uses the data by publishing each quarter a newsletter about the quality of service of the public transport system.
23 Health (physical activity)
?
24 Retail activity
Environmental impacts
25 CO2 emissions from personal transport per capita
Don’t know
26 PM10 (particulates) Collected by AIRPARIF The STIF uses the data by publishing every semester
19 / 59

<Deliverable No.> - <Deliverable Title> <Date>
a newsletter with these indicators.
27
NO Collected by AIRPARIF
The STIF uses the data by publishing every semester a newsletter with these indicators.
28Noise
Collected by BRUITPARIF
20 / 59

<Deliverable No.> - <Deliverable Title> <Date>
Appendix 2: Responses from the City of Lyon
Questions to cities on collection and use(-fulness) of data and CIVITAS CAPITAL AG5 indicator set
Thank you for taking the time to look through the indicator set that has been produced by the Data and Statistics Expert Advisory Group of the EU’s CIVITAS CAPITAL project. We have a few questions about how much data your organisation currently collects in relation to our suggested indicators, and your views on the indicators. When it comes to data that you already collect, we are interested in whether data are collected, not whether they are published publicly as indicators of your city’s performance (so please think about published and unpublished data when answering the questions).
Question 1.
Please complete the following table for each indicator. Please note that you only need to complete the columns about method and frequency of data collection, and how you use the data, if you personally know that this data is collected regularly by your or another organisation, and you know where to access it. In terms of the method used to collect data, instead of writing a description, please use one of the following codes:
M1 questionnaire survey, M5 general statistics,
M2 automatic or manual counts, M6 Other
M3 calculations based on mapping or other input M7 not sure
21 / 59
<Deliverable No.> - <Deliverable Title> <Date>
M4 registry
Indicator
We or another local organisation (e.g. PT operator, national agency) definitely collect this data regularly and produce this precise indicator
We or another local organisation (e.g. PT operator, national agency) definitely collect this data regularly but do not produce an indicator in this format
I am fairly sure that we or another organisation collect this type of data but I am not certain about how or how often
Definitely no data at all on this collected by any organisation
(Only where first or second option selected) Brief summary of method and frequency of data collection
(Only where first or second option selected) Please explain briefly how your organisation uses this data
Travel Patterns
1 Modal splitHousehold travel survey
M1Every ten years
2Trip lengths and travel time by different modes
Household travel survey
M1 Every ten years
Accessibility
3 Density (land use)Collected by “INSEE” + satellite pictures (SPOT TEMAS)
M4 (Census) Every year
Only by Planning Agency
22 / 59

<Deliverable No.> - <Deliverable Title> <Date>
4Accessibility to key services
Could be done with a GIS
Subject to have information from a GIS
5
Distance from home to nearest public transport stop
Done at IRIS levelM3 From home or from work
Speed and safety
6Traffic calmed and car-free/pedestrianised streets
Collected by the Grand Lyon (road administrator)
Do not exist everywhere / need to create an administrator of data base
7Percentage of vehicles speeding
Don’t know No
8
Safety – people killed and seriously injured in traffic collisions
Collected by the State services (Grand Lyon)
M7 public administration and et gendarmerie at national level on an annual basis
Walking
9 Extent of off-street Could be Not done but could be done
23 / 59

<Deliverable No.> - <Deliverable Title> <Date>
walking path network
done with a GIS
10Accessibility of outside built environment
Don’t knowWe are able to say the number of intersection but not the share
Cycling
11Extent of on-street cycle network
Could be done with a GIS
Not done but could be done
12 Bike ownershipHousehold travel survey
M1 Every ten years
it is not reliable because of children's bikes (we know the number of bikes including children bikes)
13Bike sharing bikes and stations per capita
We know the number of bikes stations et the number of bikes.
24 / 59

<Deliverable No.> - <Deliverable Title> <Date>
Public Transport
14 Public transport service per head of population
Avalaible for seat kilometer
15 Cost of public transport
Collected M5 Every year
16 Peak PT speed related to car speed at peak times
Not used but Could be done – by The Grand Lyon.
17 Public Transport reliability
Could be doneThere is an indicator for this, but not exactly this one
Cars and parking
18 Use of space for parking
Do not exist
19 Parking costYes
It’s the Municipalities that define the rates
20 Car ownership Household travel M1 Every ten years
25 / 59
<Deliverable No.> - <Deliverable Title> <Date>
survey
21 Car share cars and stations per capita
Yes By the Grand Lyon
Social impacts/Liveability
22 Citizen satisfaction with transport system
Enquête de satisfaction pour le TC urbain. May be not for intercity train
M1 questionnaire survey
23 Health (physical activity)
NO
24 Retail activity No but income in shops by mode could be done
Environmental impacts
25 CO2 emissions from personal transport per capita
Household travel survey
26 / 59

<Deliverable No.> - <Deliverable Title> <Date>
26PM10 (particulates)
Collected by AIR Rhône-Alpes
AIRRhone-Alpes from models + measurement by sensors of air rhône-Alpes
27NO
Collected by AIR Rhône-Alpes
AIRRhone-Alpes from models + measurement by sensors of air rhône-Alpes
28Noise
Collected by ACCOUCITE
27 / 59

Appendix 3: Responses from the City of Zurich
Questions to cities on collection and use(-fulness) of data and CIVITAS CAPITAL AG5 indicator set
Thank you for taking the time to look through the indicator set that has been produced by the Data and Statistics Expert Advisory Group of the EU’s CIVITAS CAPITAL project. We have a few questions about how much data your organisation currently collects in relation to our suggested indicators, and your views on the indicators. When it comes to data that you already collect, we are interested in whether data are collected, not whether they are published publicly as indicators of your city’s performance (so please think about published and unpublished data when answering the questions).
Question 1.
Please complete the following table for each indicator. Please note that you only need to complete the columns about method and frequency of data collection, and how you use the data, if you personally know that this data is collected regularly by your or another organisation, and you know where to access it. In terms of the method used to collect data, instead of writing a description, please use one of the following codes:
M1 questionnaire survey, M5 general statistics,
M2 automatic or manual counts, M6 Other
M3 calculations based on mapping or other input M7 not sure
M4 registry

Indicator We or another local organisation (e.g. PT operator, national agency) definitely collect this data regularly and produce this precise indicator
We or another local organisation (e.g. PT operator, national agency) definitely collect this data regularly but do not produce an indicator in this format
I am fairly sure that we or another organisation collect this type of data but I am not certain about how or how often
Definitely no data at all on this collected by any organisation
(Only where first or second option selected) Brief summary of method and frequency of data collection
(Only where first or second option selected) Please explain briefly how your organisation uses this data
Travel Patterns
1 Modal split M1 (MZMV) National household survey “Mikrozensus Mobilität und Verkehr”, every 5 years with a sample size of around 60.000 households, sample increased for the city of Zurich.
Used for the city’s mobility strategy “Stadtverkehr 2025”, main mode of city population; trips made within city.

2 Trip lengths and travel time by different modes
M1 (MZMV) National household survey “Mikrozensus Mobilität und Verkehr”, every 5 years with a sample size of around 60.000 households, sample increased for the city of Zurich.
Is regularly analysed but not used in the city’s monitoring system
Accessibility
3 Density (land use)
M3, M4 Collected continuously Land use data published yearly; density can easily be calculated, part of planning e.g. providing transport services to new developments
4 Accessibility to key services
M3, M4 National statistics office assembles this data from time to time
Irregular data collection; no details for the city of Zurich available
5 Distance from home to nearest public transport stop
M1 (MZMV) M3 public transport operator (VBZ) likely collects this data as well.
National travel survey also includes measurements of pt quality in terms of accessibility.
Speed and safety

6 Traffic calmed and car-free/pedestrianised streets
M3 Data is available but not prepared in the form needed here; likely collected continuously but usually not published
Internal planning tool
7 Percentage of vehicles speeding
M2 Police department has a worked out strategy with systemized random checks; some stationary speed cameras and loops at traffic lights are installed as well.
The measurements are used for planning purposes e.g. in speed 30 zones (safety) and in terms of noise
8 Safety – people killed and seriously injured in traffic collisions
M5 Crash data collected continuously and published yearly (VUSTA); plus regular in-depth analysis of systematic crash causes, involved persons (e.g. pedelecs) and sites
Used to improve safety and sense of safety; input for planning and infrastructure measures
Walking
9 Extent of off-street walking path network
M3 Data is collected and available in principle but it would take substantial resources to analyse it and come up with this indicator
Data in some other form is currently used for the city’s route planning tool to provide info about fast or attractive (off-street) walking routes

10 Accessibility of outside built environment
M3, M4 The data is likely available in the GIS basis. It was used a few years ago to lower curbs systematically, unclear how often it gets updated; data is not published
For specific planning and implementation purposes.
Cycling
11 Extent of on-street cycle network
M3 Data is collected (but on the basis of 30 km/h not 40 km/h) and available in principle but it would take some resources to come up with this indicator
Data currently used for the city’s route planning tool to provide info about fast or attractive/safe cycling routes
12 Bike ownership M1 (MZMV) National travel survey (household survey).
Possibly also some information available from regular city household survey (set of questions about traffic done every 6 years)
Bicycle and general traffic planning
13 Bike sharing bikes and stations per capita
M6 A bike sharing system is just about to start in Zurich. Data will be available on the number of bikes and stations
Not so much the number of bikes and stations but the usage will be used to measure effects on mode share,

as planning tool etc.
Public Transport
14 Public transport service per head of population
M3 Available from the public transport providers (local & regional), data is not published;
Time table information is widely available, so the indicator can also easily be calculated
15 Cost of public transport
M3 / M5 Costs are known, general data from general statistics.
16 Peak PT speed related to car speed at peak times
Not available as such. PT speeds are known from every vehicle; data could also be gathered from field tests or be calculated from transport model

17 Public Transport reliability
M2 Trams and local busses: GIS data from operation system (continuous monitoring of each tram / bus); data is broken down into delays of less than 2 mins (=on time), 2 to 5 mins, and 5 and more mins.
Regional train (S-Bahn): statistics in delays for each train / station available.
Data is used as quality indicator for city as well. Planning tool
Cars and parking
18 Use of space for parking
M3 (in terms of number of parking places, but not in terms of area covered by parking)
Data is collected on an annual basis and published in detail also annually.
Used to steer traffic flows, mode share etc.
Indicator also part of city’s main indicators
19 Parking cost M3 / M5 Costs are known, general data from general statistics.
20 Car ownership M5 Information available from general statics, regularly collected
21 Car share cars and stations
M2 / M4 Mobility, the Swiss car sharing organisation has all

per capita this data; it is openly available on the internet
Social impacts/Liveability
22 Citizen satisfaction with transport system
M1 Regular questionnaires to a sample of citizens.
Satisfaction in terms of modes used
Important steering tool for city.
Also an indicator used by city itself.
23 Health (physical activity)
M1 (MZMV) Data can be derived from national travel survey (household survey)
24 Footfall in shopping areas
(Retail activity)
M2 Continuous counting of pedestrians in several streets (not only shopping); single counts in several shopping locations, but not on a regular basis
Indicator is used by city to monitor progress re its mobility strategy; also used as planning tool
Environmental impacts
25 CO2 emissions from personal transport per capita
M3 Annual calculations done by the Environmental and Health Office (UGZ)
Indicator also used by the city, data published annually

26 PM10 (particulates)
M2 Continuous measurements at hotspots (UGZ), not all stations with continuous measurements
Data published annually
27 NOx M2 Continuous measurements at hotspots (UGZ)
Indicator also used by the city; data published annually
28 Noise M2 / M3 Noise measurements continuously (UGZ)
Indicator also used by the city; used to lower speed limits; data published annually;

Appendix 4: Responses from the City of Stuttgart
Questions to cities on collection and use(-fulness) of data and CIVITAS CAPITAL AG5 indicator set
Thank you for taking the time to look through the indicator set that has been produced by the Data and Statistics Expert Advisory Group of the EU’s CIVITAS CAPITAL project. We have a few questions about how much data your organisation currently collects in relation to our suggested indicators, and your views on the indicators. When it comes to data that you already collect, we are interested in whether data are collected, not whether they are published publicly as indicators of your city’s performance (so please think about published and unpublished data when answering the questions).
Question 1.
Please complete the following table for each indicator. Please note that you only need to complete the columns about method and frequency of data collection, and how you use the data, if you personally know that this data is collected regularly by your or another organisation, and you know where to access it. In terms of the method used to collect data, instead of writing a description, please use one of the following codes:
M1 questionnaire survey, M5 general statistics,
M2 automatic or manual counts, M6 Other
M3 calculations based on mapping or other input M7 not sure
M4 registry

Indicator We or another local organisation (e.g. PT operator, national agency) definitely collect this data regularly and produce this precise indicator
We or another local organisation (e.g. PT operator, national agency) definitely collect this data regularly but do not produce an indicator in this format
I am fairly sure that we or another organisation collect this type of data but I am not certain about how or how often
Definitely no data at all on this collected by any organisation
(Only where first or second option selected) Brief summary of method and frequency of data collection
(Only where first or second option selected) Please explain briefly how your organisation uses this data
Travel Patterns
1 Modal split M1 (VRS) Household survey, every ~ 10 - 12 years, in conjunction with revision of regional transport plan.
Covering the whole region of Stuttgart. The sample is in the Municipality of Stuttgart relatively higher than in the counties around Stuttgart.

2 Trip lengths and travel time by different modes
M1 (VRS) Household survey, every ~ 10 - 12 years, in conjunction with revision of regional transport plan.
Covering the whole region of Stuttgart. The sample is in the Municipality of Stuttgart relatively higher than in the counties around Stuttgart.
Accessibility
3 Density (land use)
M3, M4 (VRS) (How often ?)
4 Accessibility to key services
M6 (Studies, every now and then, depending on political meaning of the issue) BUT: Other services like shopping. Primary schools: ???
5 Distance from home to nearest public transport stop
√
Speed and safety

6 Traffic calmed and car-free/pedestrianised streets
M3 The municipality is mapping the road network and knows exactly the length of the road network in several categories including walking network. If there is any change in the network, this will be registered immediately.
7 Percentage of vehicles speeding
M2 There are stationary and randomised speed measurements. These are not done to collect the resp. data but to increase road safety. One side effect is to get the data asked for. These data are partly published (newspaper to inform the public, statistics).
8 Safety – people killed and seriously injured in traffic collisions
M5 Crash Types Mapping (“Unfalltypensteckkarte”) (Has to be done annually by the police).
Walking
9 Extent of off-street walking path network
√

10 Accessibility of outside built environment
M3 The technical department responsible for traffic lights knows of cause the technical details of each traffic light in the city. Based on that it should be possible to calculate the indicator.
Cycling
11 Extent of on-street cycle network
M3 The municipality is mapping the cycle network and knows exactly the length of it.
12 Bike ownership M1 (VRS) Household survey, every ~ 10 - 12 years, in conjunction with revision of regional transport plan.
Covering the whole region of Stuttgart. The sample is in the Municipality of Stuttgart relatively higher than in the counties around Stuttgart.
13 Bike sharing bikes and stations per capita
M3 / M4 The municipality knows exactly the number of bike sharing bikes and stations, since the municipality orders the service. So, it´s easy to calculate this

indicator.
Public Transport
14 Public transport service per head of population
M3 Time table information is available!
15 Cost of public transport
M3 / M5 Costs are known, general data from general statistics.
16 Peak PT speed related to car speed at peak times
Not available from any survey. Can be calculated from transport model.
17 Public Transport reliability
M3 Light Rail / local busses: GIS data from operation system (continuous monitoring of each train / bus)
Regional train (S-Bahn): statistics in delays for each train / station available.

Cars and parking
18 Use of space for parking
M3 (in terms of number of parking stalls, but not in terms of area covered by parking)
Statistics of the different operators of parking facilities (Municipality, private companies), building inventories of the Municipality.
19 Parking cost M3 / M5 Costs are known, general data from general statistics.
20 Car ownership M5 Information available from the car registration office.
21 Car share cars and stations per capita
√ (but seems to be easy to determine)
Social impacts/Liveability
22 Citizen satisfaction with transport system
M1 Regularly questionnaires to a sample of citizens.
23 Health (physical
M1 (VRS) Household survey, every ~ 10 - 12 years, in conjunction with

activity) revision of regional transport plan.
Covering the whole region of Stuttgart. The sample is in the Municipality of Stuttgart relatively higher than in the counties around Stuttgart.
24 Retail activity M2 Continuous counting of pedestrians in main pedestrian area (Königstraße) (52/7/24), additional counts at other locations, in malls and shops by retail organisation (“City Initiative”)
Environmental impacts
25 CO2 emissions from personal transport per capita
M3 Annual calculations done by the Environmental Office
26 PM10 (particulates)
M2 Continuous measurements at hotspots
27 NO M2 Continuous measurements at

hotspots
28 Noise M3 Noise mapping every five years

Appendix 5: Responses from the City of Copenhagen
Questions to cities on collection and use(-fulness) of data and CIVITAS CAPITAL AG5 indicator set
Thank you for taking the time to look through the indicator set that has been produced by the Data and Statistics Expert Advisory Group of the EU’s CIVITAS CAPITAL project. We have a few questions about how much data your organisation currently collects in relation to our suggested indicators, and your views on the indicators. When it comes to data that you already collect, we are interested in whether data are collected, not whether they are published publicly as indicators of your city’s performance (so please think about published and unpublished data when answering the questions).
Question 1.
Please complete the following table for each indicator. Please note that you only need to complete the columns about method and frequency of data collection, and how you use the data, if you personally know that this data is collected regularly by your or another organisation, and you know where to access it. In terms of the method used to collect data, instead of writing a description, please use one of the following codes:
M1 questionnaire survey, M5 general statistics,
M2 automatic or manual counts, M6 Other
M3 calculations based on mapping or other input M7 not sure
M4 registry

Indicator We or another local organisation (e.g. PT operator, national agency) definitely collect this data regularly and produce this precise indicator
We or another local organisation (e.g. PT operator, national agency) definitely collect this data regularly but do not produce an indicator in this format
I am fairly sure that we or another organisation collect this type of data but I am not certain about how or how often
Definitely no data at all on this collected by any organisation
(Only where first or second option selected) Brief summary of method and frequency of data collection
(Only where first or second option selected) Please explain briefly how your organisation uses this data
Travel Patterns
1 Modal split Yes, but important which split, definitions, delimitations, trips (e.g. is it residents’ trips or all trips in an area) etc.
M1. National Travel survey (breakdown to city)
Data collected yearly, more specific data for CPH every second year
Many functions, such as municipal plan, cycle account etc.
2 Trip lengths and travel time by different modes
Yes, same comment as above
M1. National Travel survey (breakdown to city)
Less used, urban life account, (what about E-bikes)
Accessibility
3 Density (land use) Yes M4 Various (basic data)
4 Accessibility to key services
Yes, data available M3/M4 Not in use, but possible

5 Distance from home to nearest public transport stop
Yes, data available M3/M4 Various purposes (including public transport planning and application for Green Capital Award) but different distance definitions etc.
Speed and safety
6 Traffic calmed and car-free/pedestrianised streets
Yes, available M3/M4 Exits in databases; could be produced, for traffic safety planning (but approximation)
7 Percentage of vehicles speeding
yes, could be retrieved
M4/M6 Police registration
Relevance? (depend on traffic speed/levels and especially on speed limits. E.g. if you have a low speed limit this is good for safety but there will be higher percentage of speeding) more selective approach recommended.
8 Safety – people killed and seriously injured in traffic collisions
Yes/police registry M4/M6 Police registration
Traffic safety planning/reporting
(in the future: possibly use hospital data)
Walking

9 Extent of off-street walking path network
Yes (on street, possibly off street)
(M3) Possibly space rather than length? relevance/definition debated?
10 Accessibility of outside built environment
(yes, but not quite clear)
Possibly mobile apps as alternative
Cycling
11 Extent of on-street cycle network
yes M4 Definitions must be precise for comparison
How about of-street / separate cycle paths?
12 Bike ownership (yes) access to bike per household sample survey
M1 Definitions must be precise for comparison
13 Bike sharing bikes and stations per capita
yes M4 The official bike share system - Used for public information, not measured as indicator. Various other share initiatives may not be counted
Public Transport

14 Public transport service per head of population
PT companies could produce
M4 Not obvious purpose
15 Cost of public transport
Yes, to calculate by PT companies
16 Peak PT speed related to car speed at peak times
Could be produced, data should be available
Some relevance for traffic management plan
17 Public Transport reliability
Yes, to be calculated for the traffic management / ITS plan (M3)
We have a service goal for busses: To increase travel time reliability by 10 % (ITS / Traffic management plan)
Cars and parking
18 Use of space for parking
Can be calculated Maybe also occupancy rate? (too low rates indicates that space could be used for other reasons, too high rates give problems with finding an available p-space)
19 Parking cost CPH has data
20 Car ownership Yes (Danmarks Statistik)
M4

21 Car share cars and stations per capita
Yes M4 / M3 CPH has a goal for the number of carsharing cars, so to follow the development
Social impacts/Liveability
22 Citizen satisfaction with transport system
Yes for cyclists and pedestrians.
PT companies might have info??
M1 Used for bicycle account and city life account
23 Health (physical activity)
When related to cycling
M3 Used for bicycle account
24 Retail activity Yes, some data collected
To measure use of transport modes when shopping and to have knowledge when reconstructing a street or area
Environmental impacts
25 CO2 emissions from personal transport per capita
Yes M3
(IPCC standard)
Climate account and green account, yearly
26 PM10 (particulates) Yes M4 green account, yearly

27 NO Yes M4 green account, yearly
28 Noise Number of housing be disturbed
M3 green account, yearly

Appendix 6: Responses from the City of Edinburgh
Questions to cities on collection and use(fullness) of data and CIVITAS CAPITAL AG5 indicator set – City of Edinburgh
Thank you for taking the time to look through the indicator set that has been produced by the Data and Statistics Expert Advisory Group of the EU’s CIVITAS CAPITAL project. We have a few questions about how much data your organisation currently collects in relation to our suggested indicators, and your views on the indicators. When it comes to data that you already collect, we are interested in whether data are collected, not whether they are published publicly as indicators of your city’s performance (so please think about published and unpublished data when answering the questions).
Question 1.
Please complete the following table for each indicator. Please note that you only need to complete the columns about method and frequency of data collection, and how you use the data, if you personally know that this data is collected regularly by your or another organisation, and you know where to access it. In terms of the method used to collect data, instead of writing a description, please use one of the following codes:
M1 questionnaire survey, M5 general statistics,
M2 automatic or manual counts, M6 Other
M3 calculations based on mapping or other input M7 not sure
M4 registry

Indicator We or another local organisation (e.g. PT operator, national agency) definitely collect this regularly
I am fairly sure that we or another organisation coll-ect this but I am not certain about how or how often
There might be some data out there about this but am really not sure where or how often it’s gathered
Definitely no data at all on this
(Only where first option selected) Brief summary of method and frequency of data collection
(Only where first option selected) Please explain briefly how your organisation uses this data; or other comments you want to make
Travel Patterns
1 Modal split This one M1 – regular household survey
We have targets for mode split in our SUMP and use this data to monitor progress towards them.
2 Trip lengths and travel time by different modes
This one This data is collected by the Scottish Government in an ongoing Household Survey but then only released at a very aggregate level due to privacy concerns.
Accessibility
3 Density (land use) This one For land use planning purposes I think we may measure density but not in this way as the indicator is defined
4 Accessibility to key services
This one As above

5 Distance from home to nearest public transport stop
This one We can derive this data from our GIS consultants if we need to but we don’t on a citywide basis because we have to pay for it
Speed and safety
6 Traffic calmed and car-free/pedestrianised streets
This one We keep a record of the length of the road network with physical traffic calming on it
7 Percentage of vehicles speeding
Possibly our Safety Camera Partnership
8 Safety – people killed and seriously injured in traffic collisions
This one We have had a target related to this for many years but not related to exposure – although we could do based on household travel survey
Walking
9 Extent of off-street walking path network
Possibly Paths for All
10 Accessibility of outside built environment
We are trying to gather some of this data currently (dropped kerbs)
This is to monitor our compliance with legislation and to be able to budget for and implement improvements

Cycling
11 Extent of on-street cycle network
This one We are under political pressure to increase the extent of our cycle network, and have a significant budget to do so. Monitoring implementation is an important aspect of this.
12 Bike ownership This one M1 National census every 10 years
From national census
13 Bike sharing bikes and stations per capita
Not applicable
We do not have a bike sharing scheme
Public Transport
14 Public transport service per head of population
This one
15 Cost of public transport
This one This could be calculated but we do not do so
16 Peak PT speed related to car speed at peak times
This one
17 Public Transport reliability
This one This could be calculated but we do not
Cars and parking
18 Use of space for parking
This one We could possibly calculate this from our GIS
19 Parking cost This one This information is available but only compiled currently for Council operated car parking and not related to income
20 Car ownership This one M1 national census household survey
Gathered by national census. Useful for us to track policy progress.
21 Car share cars and This one We know how many carshare

stations per capita stations there are and could find out the number of cars. We do not relate this to population currently, but could do
Social impacts/Liveability
22 Citizen satisfaction with transport system
This one We periodically gather data on this at a very basic level and not in this exact format
23 Health (physical activity)
This one The Public Health Board may gather this data, not sure; and not in this format, definitely
24 Retail activity This one Given the difficulty of counting footfall, we measure retail activity by numbers of shop vacancies
Environmental impacts
25 CO2 emissions from personal transport per capita
This one This could be calculated from existing data, but we do not do it as it would be rather complicated
26 PM10 (particulates) This one AQ monitoring equipment
To monitor compliance with EU AQ standards and to drive the choice of policy instruments in our AQMA

27 NO This one AQ monitoring equipment
As above
28 Noise This one Noise modelling based on traffic model
Mapped as per the EU Noise Directive