the prioritisation matrix
TRANSCRIPT

THEPRIORITISATIONMATRIX

Copyright © 2020 Singapore Economic Development BoardAll rights reserved.
Singapore Economic Development Board (EDB), a government agency under the Ministry of Trade and Industry, is responsible for strategies that enhance Singapore’s position as a global centre for business, innovation, and talent. We undertake investment promotion and industry development, and work with international businesses, both foreign and local, by providing information, connection to partners and access to government incentives for their investments. Our mission is to create sustainable economic growth, with vibrant business and good job opportunities for Singapore.
For more information, please visit www.edb.gov.sg.
Smart Industry Readiness Index | The Prioritisation Matrix 1

At a Glance
03Foreword
04Executive Summary
06Introduction
Calculation Methodology of the Prioritisation Matrix
The 14 Industries
Acknowledgements References
The Way Forward
35 42
45 46
34
15The Smart Industry Readiness Index Prioritisation Matrix
3112The 4 Principles of Prioritisation
Bringing It All Together: An Illustrative Case Study
Catalysing the transformation of manufacturing 2

Since the inception of the term Industrie 4.0 in 2011, the global manufacturing community has come a long way. The conversation around Industry 4.0 has evolved from learning about its key concepts and benefits to exploring how to best implement transformation roadmaps.
Today, more companies are aware of Industry 4.0, and fewer doubt that the benefits are real. Instead, they are asking a new set of questions around implementation: How can I start? Where should I focus on? As companies acquire knowledge about Industry 4.0, it is evident that there is a struggle to progress towards implementation.
In 2017, we launched the Smart Industry Readiness Index (“SIRI”) to help manufacturers learn about the key tenets of Industry 4.0. We also introduced an Assessment Matrix to allow manufacturers to evaluate the existing state of their facilities and assess their Industry 4.0 readiness levels. SIRI has helped many companies kick-start their Industry 4.0 journey over the last two years. Looking ahead, we realised that we needed to do more to help companies better design and execute their transformation roadmaps.
Developed with the support of Industry 4.0 thought leaders McKinsey & Company, SAP, Siemens, and TÜV SÜD, this new Prioritisation Matrix serves to guide manufacturers – in Singapore and globally – towards identifying the Industry 4.0 areas that will yield the greatest benefit to them. We believe that the ability to prioritise key areas will alleviate some of the long-standing uncertainties that manufacturers face and be the needle-mover in accelerating the pace of Industry 4.0 transformation.
Foreword
Dr Beh Swan Gin Chairman Singapore Economic Development Board
Smart Industry Readiness Index | The Prioritisation Matrix 3

Executive Summary
THE TIER FRAMEWORK
Emulate the successes of the broader manufacturing community, and learn from
their mistakes as well
Develop an in-depth understanding of
the company’s current Industry 4.0
maturity level
TODAY’S STATE
Determine the most critical business
objectives to guide the selection of relevant
Industry 4.0 areas
ESSENTIAL BUSINESS OBJECTIVES
REFERENCES TO THE BROADER COMMUNITY
Analyse how distinct Industry 4.0 areas affect profits and identify those
that can generate the greatest financial return
IMPACT TO BOTTOM LINE
Over the last few years, manufacturers’ understanding of Industry 4.0 and its potential value has grown steadily, yet many have been unable to translate their acquired knowledge to actionable transformation plans. According to a 2018 McKinsey survey of manufacturing companies, while 75 per cent of respondents recognised that Industry 4.0 solutions could improve business performance, only 13 per cent had embarked on Industry 4.0 initiatives. Many manufacturers that had completed the Smart Industry Readiness Index (“SIRI”) Assessment Matrix also reflected the same uncertainty regarding next steps.
This gap between awareness and implementation is usually due to companies lacking an overall Industry 4.0 roadmap. Prioritisation is a critical undertaking for companies in order to formulate an effective Industry 4.0 roadmap as it helps identify focus areas that will generate the greatest value. This drives both informed decision-making and effective resource allocation. Yet, despite the importance of prioritisation, there has been little assistance and guidance available for manufacturers – big and small – that want to embark on this process in a robust and comprehensive way. This whitepaper is a deliberate attempt to help companies approach prioritisation in a systematic fashion that is both robust and comprehensive.
TIER: A Holistic Framework for Prioritisation
The TIER Framework provides a conceptual framework which underscores the four key principles that companies must factor into consideration for a holistic prioritisation.
Figure 1: The TIER Framework
Catalysing the transformation of manufacturing 4

The Prioritisation Matrix
To help companies translate the four principles into practice, the Prioritisation Matrix was developed with the support of knowledge partners Fraunhofer Institute, McKinsey & Company, SAP, Siemens, and TÜV SÜD. Designed as a management planning tool, the Prioritisation Matrix aims to assist companies in quantitatively identifying the high-priority SIRI Dimensions in which improvements will bring the most benefit, by comparing the Impact Values across the different SIRI Dimensions.
The Way Forward
Together, the TIER Framework and Prioritisation Matrix offer a holistic approach to help ensure that companies move in the right direction as they forge ahead with their Industry 4.0 transformation roadmaps.
Key Performance Indicators
Cost ProfileAssessmentMatrix Score
Best-in-ClassBenchmark
THE PRIORITISATION MATRIX FORMULA
AMS: Assessment Matrix Score
BIC: Industry Best-in-Class Benchmark
CDOR : Degree of Relevance (Cost)
KDOR : Degree of Relevance (KPI)
W: Weightage assigned to the factor
Wc Cost Factor i
Wc c [DOR Cost Profile] i+ +
Wk KPI Factor i
Wk k [DOR Top KPIs] i
+ +=
=
Impact Value ofSIRI Dimension i
Weighted Cost Factor i Weighted KPI Factor i+ +=
Wp Proximity Factor i
Weighted Proximity Factor i
Wp [BIC - AMS] i
Figure 2: The Prioritisation Matrix Formula
Smart Industry Readiness Index | The Prioritisation Matrix 5

Introduction
Industry 4.0 Transformation Journey: The LEAD Framework
The transformation and upgrading of a manufacturing facility is not a one-off exercise. Rather, it is a continuous and iterative process. This is encapsulated in the LEAD Framework – a continuous four-step process that all manufacturers can adopt in their approach towards Industry 4.0 transformation.
LEARN key concepts and build a common language for alignment;
EVALUATE the current Industry 4.0 maturity levels of existing facilities;
ARCHITECT a comprehensive transformation strategy and implementation roadmap; and
DELIVER impact and sustain transformation initiatives
Figure 3: The LEAD Framework
Evaluate the current Industry 4.0 maturity levels of existing facilities
Catalysing the transformation of manufacturing 6

Background: The Smart Industry Readiness Index (2017)
The Smart Industry Readiness Index (“SIRI”) was created by the Singapore Economic Development Board (“EDB”), in partnership with a network of leading technology companies, consultancy firms, and industry and academic experts. SIRI comprises a suite of frameworks and tools to help manufacturers – regardless of their size and industry – start, scale, and sustain their manufacturing transformation journeys.
The SIRI Framework comprises three layers. The topmost layer identifies three fundamental building blocks of Industry 4.0: Technology, Process, and Organisation. All three building blocks must be considered to harness the full potential of Industry 4.0. Underpinning the building blocks are eight pillars, which represent critical aspects that companies must focus on to become future-ready organisations. The third and final layer comprises 16 dimensions that companies should reference when evaluating the current Industry 4.0 maturity levels of their facilities.
Smart Industry Readiness Index
PROCESS TECHNOLOGY ORGANISATION
Talent Readiness Structure &Management Operations Supply Chain Product
Lifecycle Intelligence Automation Connectivity
VerticalIntegration
HorizontalIntegration
IntegratedProduct
Lifecycle
1. 2. 3.
4.
5.
6.
7.
8.
9.
10.
13.
14.
15.
16.
11.
12.
Shop Floor
Enterprise
Facility
Workforce Learning& Development
Inter- and Intra- Company
Collaboration
LeadershipCompetency
Strategy &Governance
Figure 4: The SIRI Framework
Smart Industry Readiness Index | The Prioritisation Matrix 7

The Assessment Matrix
Launched in tandem with the SIRI Framework, the Assessment Matrix is the world’s first self-diagnostic Industry 4.0 tool. The Assessment Matrix is validated by a global advisory panel of industry experts and is designed to strike a balance among technical rigour, usability, and relevance. Companies can refer to “The Smart Industry Readiness Index” whitepaper published in November 2017 for the complete Assessment Matrix.
Within the Assessment Matrix, there are six bands, in ascending order, tied to each of the 16 SIRI Dimensions. Each band describes a specific state within that dimension. Identifying a manufacturing facility’s bands across all 16 dimensions therefore presents a snapshot of the manufacturing facility’s current Industry 4.0 maturity level. This is referred to as the facility’s Assessment Matrix Score.
Catalysing the transformation of manufacturing 8

The Gap from Awareness to Implementation
% of Manufacturers
Gap
Awareness Implementation
Figure 5: The Gap from Awareness to Implementation
A Perennial Challenge: Moving from Awareness to Implementation
Since its launch, SIRI has helped many companies better understand Industry 4.0 and its potential value to their manufacturing facilities. Despite the increased knowledge, many firms have remained noncommittal about developing and executing action plans, exposing a significant gap between awareness and implementation of Industry 4.0 solutions.
This observation is also echoed by various global consultancy reports and surveys. For example, in a 2018 McKinsey survey of over 200 manufacturing
companies across six ASEAN markets, 75 per cent of respondents recognised that Industry 4.0 technologies and concepts could improve business performance, yet only 13 per cent had embarked on Industry 4.0 initiatives.
Referencing the LEAD Framework, it is apparent that manufacturers continue to be apprehensive in moving from the Evaluation phase to the Architecting phase of their digital transformation journey.
Smart Industry Readiness Index | The Prioritisation Matrix 9

Prioritisation: A Key Exercise to Bridge the Awareness-Implementation Gap
There are many reasons why companies have been slow to adopt Industry 4.0 solutions despite high levels of awareness. One of the most cited barriers is the lack of an effective strategy. In a world of scarce resources, information overload, and pressures to deliver short-term results, a clear Industry 4.0 vision is essential for companies to push beyond small-scale pilots and embrace real transformative projects.
Prioritisation is a critical exercise for any company formulating an Industry 4.0 strategy and roadmap. It also plays an important role in closing the awareness-implementation gap. Prioritisation enables companies to identify focus areas that will generate the greatest value, which drives informed decision-making and effective resource allocation.
Yet, despite the importance of prioritisation, there has been little assistance and guidance available for manufacturers – big and small alike – that want to embark on this process in a robust and comprehensive way.
This whitepaper thus aims to provide a conceptual framework and an accompanying tool to help the global manufacturing community unlock the power of prioritisation. It is an attempt to support companies in Architecting their digital transformation and progressing towards implementation and Delivery.
“The overarching objective of SIRI is to help manufacturers leverage Industry 4.0 technologies and concepts to stay relevant and competitive in an increasingly digital age. As more companies develop a good understanding of their manufacturing facilities’ Industry 4.0 maturity level, we must work more closely with them to translate their knowledge into action. Prioritisation is an important step to achieve that.”
– Mr Lim Kok Kiang, Executive Vice President, EDB
Catalysing the transformation of manufacturing 10

“Prioritisation is important for companies to gain clarity on the right Industry 4.0 areas to focus on, but it has to be carried out in a rigorous manner to drive the right outcomes. The TIER Framework, and Prioritisation Matrix, is a first of its kind reference to catalyse the digital transformation of manufacturing sectors.”
– Mr Raimund Klein, Executive Vice President & Head, Digital Industries, ASEAN, Siemens
Smart Industry Readiness Index | The Prioritisation Matrix 11

TIER: A Holistic Prioritisation Framework
Companies may find it challenging to prioritise their Industry 4.0 focus areas. One of the most common mistakes is failing to factor in all necessary considerations for a holistic prioritisation, resulting in suboptimal outcomes.
What are the key elements that companies should consider? How should companies approach a prioritisation exercise in a systematic fashion?
To answer these questions, this whitepaper establishes four key principles of prioritisation. These four principles – collectively known as the TIER Framework – will help manufacturers home in on the Industry 4.0 areas where improvements made will deliver the greatest value. This will enable companies to start, scale, and sustain their Industry 4.0 transformation journeys in the right direction.
Figure 6: The TIER Framework
THE TIER FRAMEWORK
Emulate the successes of the broader manufacturing community, and learn from
their mistakes as well
Develop an in-depth understanding of
the company’s current Industry 4.0
maturity level
TODAY’S STATE
Determine the most critical business
objectives to guide the selection of relevant
Industry 4.0 areas
ESSENTIAL BUSINESS OBJECTIVES
REFERENCES TO THE BROADER COMMUNITY
Analyse how distinct Industry 4.0 areas affect profits and identify those
that can generate the greatest financial return
IMPACT TO BOTTOM LINE
The 4 Principles of Prioritisation
Catalysing the transformation of manufacturing 12

Before starting on any prioritisation exercise, it is important for companies to be aware of the present state of their factories. This can be achieved by conducting a detailed and ideally independent assessment of their manufacturing facilities. With that knowledge, manufacturers can identify areas of strengths to build on and areas of weaknesses for improvements. The assessment results can also empower companies to identify the most pressing opportunities for change.
A comprehensive and neutral evaluation of their manufacturing facilities will also allow companies to review any notions that may be outdated or inaccurate. Awareness and willingness to address potential misperceptions is a critical early step in developing a well-defined transformation plan.
Companies exist to sell goods and/or services to make a profit, and their fundamental aim is to maximise profits. While there may be numerous initiatives that a company may find exciting and appealing, some may not be financially feasible. Even initiatives that are economically viable will vary in their return on investments and profitability. Hence, a company must constantly decide how to allocate its resources while bearing in mind its profit maximisation objective.
Any manufacturer that intends to adopt Industry 4.0 concepts and technologies must consider the potential impact on profits. For instance, if a company’s utilities costs make up a significant percentage of revenue, investing in digital technologies that reduce energy and water consumption will likely result in bigger savings compared to investments in another area like IT integration.
By being mindful of the impact of an Industry 4.0 area on the bottom line, companies will be better equipped at identifying action areas that will yield the greatest financial benefits and consequently, ensure a more sustainable Industry 4.0 transformation.
TODAY’S STATE IMPACT TO BOTTOM LINEDevelop an in-depth understanding of the company’s current Industry 4.0 maturity level.
Analyse how distinct Industry 4.0 areas affect profits and identify those that can generate the greatest financial return.
Smart Industry Readiness Index | The Prioritisation Matrix 13
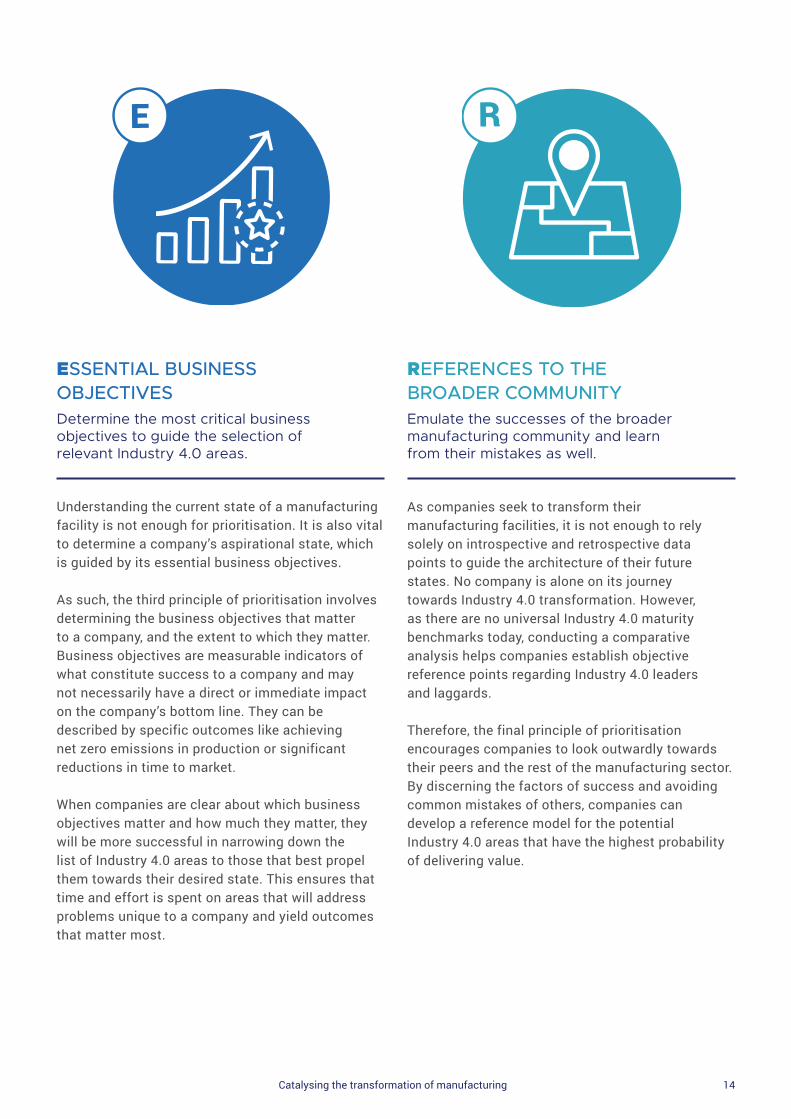
Determine the most critical business objectives to guide the selection of relevant Industry 4.0 areas.
Emulate the successes of the broader manufacturing community and learn from their mistakes as well.
Understanding the current state of a manufacturing facility is not enough for prioritisation. It is also vital to determine a company’s aspirational state, which is guided by its essential business objectives.
As such, the third principle of prioritisation involves determining the business objectives that matter to a company, and the extent to which they matter. Business objectives are measurable indicators of what constitute success to a company and may not necessarily have a direct or immediate impact on the company’s bottom line. They can be described by specific outcomes like achieving net zero emissions in production or significant reductions in time to market.
When companies are clear about which business objectives matter and how much they matter, they will be more successful in narrowing down the list of Industry 4.0 areas to those that best propel them towards their desired state. This ensures that time and effort is spent on areas that will address problems unique to a company and yield outcomes that matter most.
As companies seek to transform their manufacturing facilities, it is not enough to rely solely on introspective and retrospective data points to guide the architecture of their future states. No company is alone on its journey towards Industry 4.0 transformation. However, as there are no universal Industry 4.0 maturity benchmarks today, conducting a comparative analysis helps companies establish objective reference points regarding Industry 4.0 leaders and laggards.
Therefore, the final principle of prioritisation encourages companies to look outwardly towards their peers and the rest of the manufacturing sector. By discerning the factors of success and avoiding common mistakes of others, companies can develop a reference model for the potential Industry 4.0 areas that have the highest probability of delivering value.
ESSENTIAL BUSINESS OBJECTIVES
REFERENCES TO THE BROADER COMMUNITY
Catalysing the transformation of manufacturing 14
Smart Industry Readiness Index | The Prioritisation Matrix 16
Objectives and Intent
Development Process
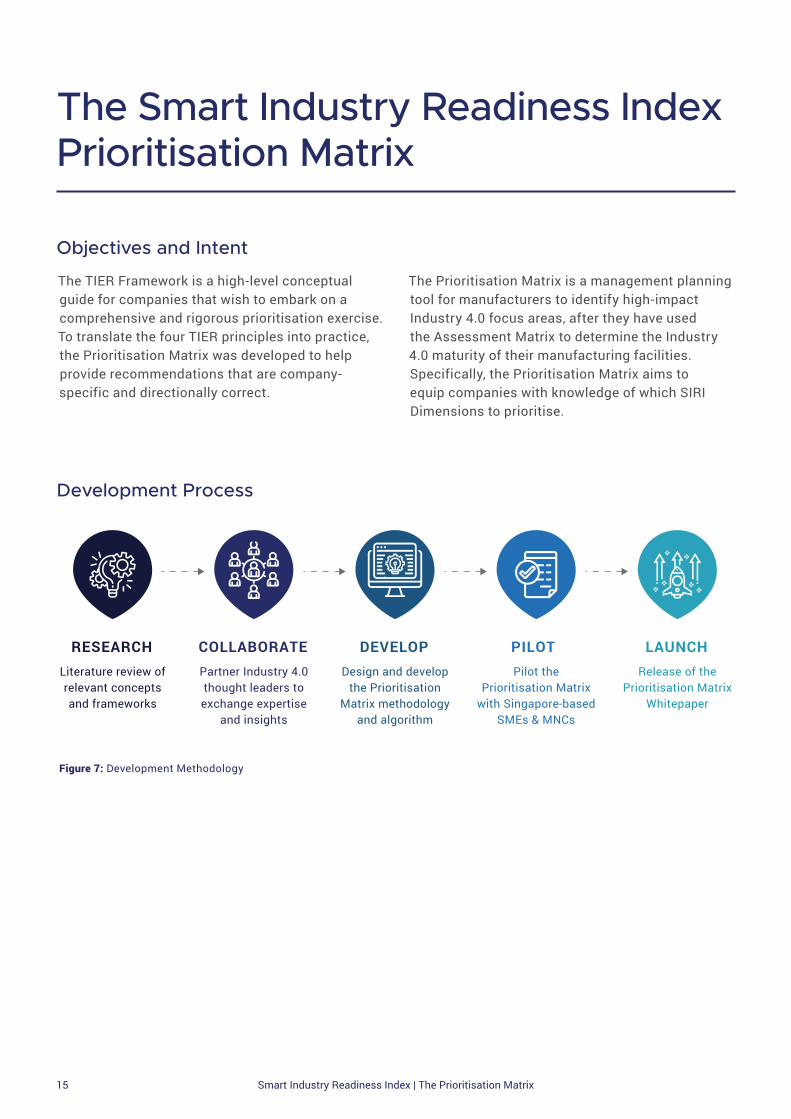
The TIER Framework is a high-level conceptual guide for companies that wish to embark on a comprehensive and rigorous prioritisation exercise. To translate the four TIER principles into practice, the Prioritisation Matrix was developed to help provide recommendations that are company-specific and directionally correct.
The Prioritisation Matrix is a management planning tool for manufacturers to identify high-impact Industry 4.0 focus areas, after they have used the Assessment Matrix to determine the Industry 4.0 maturity of their manufacturing facilities. Specifically, the Prioritisation Matrix aims to equip companies with knowledge of which SIRI Dimensions to prioritise.
LAUNCHRESEARCH COLLABORATE DEVELOP PILOT Literature review of relevant concepts and frameworks
Partner Industry 4.0 thought leaders to exchange expertise
and insights
Design and develop the Prioritisation
Matrix methodology and algorithm
Pilot the Prioritisation Matrix
with Singapore-based SMEs & MNCs
Release of the Prioritisation Matrix
Whitepaper
Figure 7: Development Methodology
The Smart Industry Readiness Index Prioritisation Matrix
Smart Industry Readiness Index | The Prioritisation Matrix 15
“Many companies that have begun their Industry 4.0 transformations find themselves stuck at the pilot stage. Our research shows the successful ones are those that holistically tackle business processes, technology architecture, and organisation challenges. With this logic, the Prioritisation Matrix helps companies understand where to further diagnose, design, and ultimately implement Industry 4.0 at scale. ”
– Dr Alpesh Patel, Director of Digital Capability Centre, Singapore, McKinsey & Company
Development of the Prioritisation Matrix began with a wide-ranging literature review of Industry 4.0-related concepts and frameworks. These included industry reports, landscape studies, business surveys, and models produced by leading associations and industry players.
To ensure the technical robustness of the Prioritisation Matrix, Fraunhofer Institute, McKinsey & Company, SAP, Siemens, and TÜV SÜD were consulted in the development process. As established leaders in their respective fields, the knowledge partners provided their expertise and counsel to enhance the integrity of the tool.
The Prioritisation Matrix was then piloted with a diverse group of manufacturers, ranging from small and medium-sized enterprises (SMEs) to multinational corporations (MNCs) across both discrete and process industries. Each pilot was conducted through a workshop involving the company’s senior management, operations, and finance teams. The insights, suggestions, and feedback gained from each pilot were used to further refine the Prioritisation Matrix.
“There is no shortage of technologies, products and solutions for the average manufacturing facility that wants to start its digitalisation journey. The challenge is in knowing which areas to work on to realise the greatest amount of benefit given a certain amount of resources available. The Prioritisation Matrix serves as a useful and neutral tool to guide companies to identify those areas.”
– Dr Andreas Hauser, Director, Digital Services, TÜV SÜD
Catalysing the transformation of manufacturing 16

The Prioritisation Matrix formula comprises three key factors: cost, top key performance indicator categories, and a company’s proximity to the industry best-in-class. Each is weighted based on how much it influences the company at the point of the prioritisation exercise. The three factors are derived from four inputs which in turn reflect principles of prioritisation in the TIER Framework.
To identify the high-priority SIRI Dimensions, the Prioritisation Matrix formula processes the three weighted factors to calculate an Impact Value for each of the 16 SIRI Dimensions. Manufacturers
The Prioritisation Matrix Formula
can then quantitatively identify the dimensions to prioritise, by comparing the Impact Values across the 16 SIRI Dimensions.
To develop a holistic Industry 4.0 transformation strategy and roadmap, it is important that firms consider all three building blocks of the SIRI Framework (Process, Technology, and Organisation). Therefore, the Prioritisation Matrix will recommend at least one SIRI Dimension – the one with the highest Impact Value – from each building block.
Key Performance Indicators
Cost ProfileAssessmentMatrix Score
Best-in-ClassBenchmark
THE PRIORITISATION MATRIX FORMULA
AMS: Assessment Matrix Score
BIC: Industry Best-in-Class Benchmark
CDOR : Degree of Relevance (Cost)
KDOR : Degree of Relevance (KPI)
W: Weightage assigned to the factor
Wc Cost Factor i
Wc c [DOR Cost Profile] i+ +
Wk KPI Factor i
Wk k [DOR Top KPIs] i
+ +=
=
Impact Value ofSIRI Dimension i
Weighted Cost Factor i Weighted KPI Factor i+ +=
Wp Proximity Factor i
Weighted Proximity Factor i
Wp [BIC - AMS] i
Figure 8: The Prioritisation Matrix Formula
Smart Industry Readiness Index | The Prioritisation Matrix 17

The Cost Factor of a SIRI Dimension reflects the level of impact that the SIRI Dimension can have on a company’s bottom line. The Cost Factor is essential as it guides companies to prioritise SIRI Dimensions that have greater influence over key cost drivers. This ensures that the recommended SIRI Dimensions will include those that deliver the greatest financial benefits to companies.
Calculating the Cost Factor of a SIRI Dimension requires information on the Cost Profile of a company and the Degree of Relevance (Cost) (“DORc”) Table (page 38).
The Cost Profile of a company refers to the breakdown of a company’s costs as percentages of its overall revenue. For instance, if a company has an annual revenue of $100 million and spends $15 million on maintenance and repairs, then maintenance and repair costs can be represented as 15 per cent of the company’s overall revenue.
The company’s overall revenue is used as the divisor so that the influence of each cost category can be diminished or amplified, depending on whether the company is profitable or loss-making. For example, a company has a total cost of $40 million, of which $20 million is attributed to labour costs. When the company’s revenue is at a profitable level of $50 million, labour as a cost category is represented at 40 per cent of revenue. However, if the same company’s revenue falls to an unprofitable level of $30 million, labour increases to 66 per cent of revenue. Consequently, labour as a cost category will have greater influence in the Prioritisation Matrix formula.
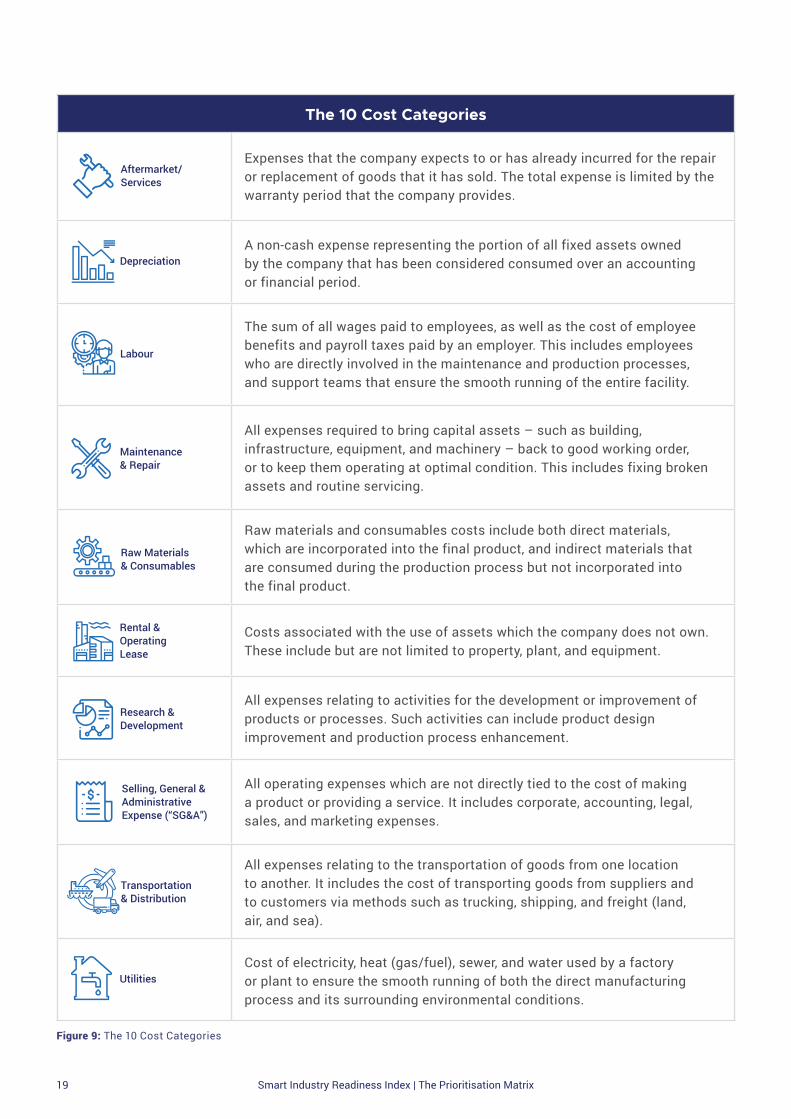
A company’s Cost Profile can be distilled into 10 cost categories that are commonly reflected in companies’ financial statements.
Cost Factor
The 3 Factors of the Prioritisation Matrix Formula
THE PRIORITISATION MATRIX FORMULA
Wc c [DOR Cost Profile]
i + +Wk k [DOR Top KPIs] i W [BIC - AMS] ip=Impact Value ofSIRI Dimension i
How a company’s Cost Profile influences the prioritisation of SIRI Dimensions
If a company’s direct labour cost is 50 per cent of its overall revenue while its utilities cost is only five per cent, then directing resources to achieve improvements in a dimension like Shop Floor Automation (strongly correlated to reducing labour costs) is likely to be more valuable than investing in another dimension like Facility Connectivity (strongly correlated to reducing energy costs).
Catalysing the transformation of manufacturing 18
Raw Materials& Consumables
Aftermarket/Services
Depreciation
Labour
Maintenance & Repair
Rental & Operating Lease
Research & Development
Selling, General & AdministrativeExpense (“SG&A”)
Utilities
Transportation & Distribution
The 10 Cost Categories
Figure 9: The 10 Cost Categories
Expenses that the company expects to or has already incurred for the repair or replacement of goods that it has sold. The total expense is limited by the warranty period that the company provides.
A non-cash expense representing the portion of all fixed assets owned by the company that has been considered consumed over an accounting or financial period.
The sum of all wages paid to employees, as well as the cost of employee benefits and payroll taxes paid by an employer. This includes employees who are directly involved in the maintenance and production processes, and support teams that ensure the smooth running of the entire facility.
All expenses required to bring capital assets – such as building, infrastructure, equipment, and machinery – back to good working order, or to keep them operating at optimal condition. This includes fixing broken assets and routine servicing.
Raw materials and consumables costs include both direct materials, which are incorporated into the final product, and indirect materials that are consumed during the production process but not incorporated into the final product.
Costs associated with the use of assets which the company does not own. These include but are not limited to property, plant, and equipment.
All expenses relating to activities for the development or improvement of products or processes. Such activities can include product design improvement and production process enhancement.
All operating expenses which are not directly tied to the cost of making a product or providing a service. It includes corporate, accounting, legal, sales, and marketing expenses.
All expenses relating to the transportation of goods from one location to another. It includes the cost of transporting goods from suppliers and to customers via methods such as trucking, shipping, and freight (land, air, and sea).
Cost of electricity, heat (gas/fuel), sewer, and water used by a factory or plant to ensure the smooth running of both the direct manufacturing process and its surrounding environmental conditions.
Smart Industry Readiness Index | The Prioritisation Matrix 19

Key Performance Indicator (KPI) Factor
THE PRIORITISATION MATRIX FORMULA
+ +Wk W [BIC - AMS] ip=Impact Value ofSIRI Dimension i
[DORWc c Cost Profile] i k [DOR Top KPIs]
i
Key Performance Indicators (KPIs) are measures used to evaluate a company’s success or effectiveness in achieving its key business objectives and strategic directives. Therefore, the KPI Factor of a SIRI Dimension reflects the level of impact that the SIRI Dimension can have on a company’s essential business objectives.
Calculating the KPI Factor of a SIRI Dimension requires companies to identify their Top KPI Categories1 that best reflect their desired future positioning and business outcomes, as well as the Degree of Relevance (KPI) (“DORK”) Table (page 39).
The Prioritisation Matrix considers the following 14 categories of KPIs that are organised into four groups: Productivity, Quality, Flexibility, and Speed.
The 14 Key Performance Indicator (KPI) Categories
• Product Quality
• Process Quality
• Safety
• Security
Quality•
•
Time to Market
Time to Delivery
Speed
• Asset & Equipment Efficiency
• Inventory Efficiency
• Materials Efficiency
• Utilities Efficiency
• Workforce Efficiency
Productivity•
•
•
Planning & SchedulingEffectiveness
Production Flexibility
Workforce Flexibility
Flexibility
Figure 10: The 14 Key Performance Indicator (KPI) Categories
1 For the purposes of the Prioritisation Matrix formula calculation, the top five KPI categories are selected.
Catalysing the transformation of manufacturing 20
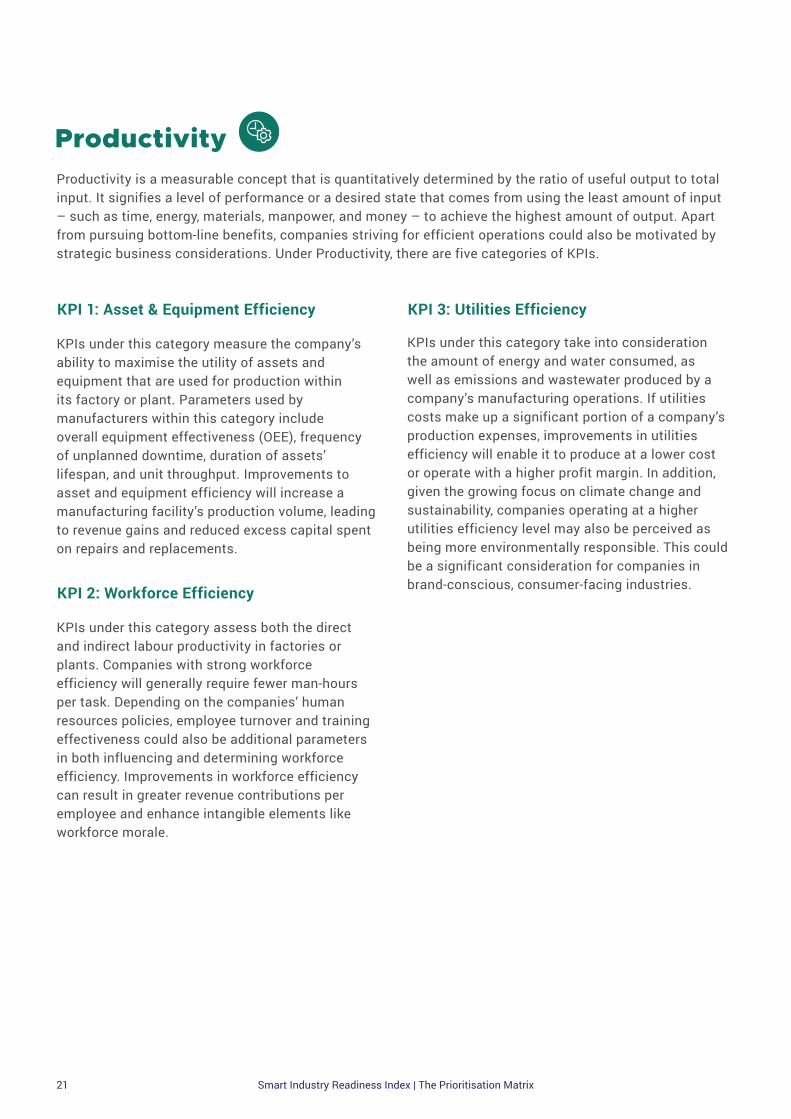
Productivity is a measurable concept that is quantitatively determined by the ratio of useful output to total input. It signifies a level of performance or a desired state that comes from using the least amount of input – such as time, energy, materials, manpower, and money – to achieve the highest amount of output. Apart from pursuing bottom-line benefits, companies striving for efficient operations could also be motivated by strategic business considerations. Under Productivity, there are five categories of KPIs.
Productivity
KPI 1: Asset & Equipment Efficiency
KPI 2: Workforce Efficiency
KPI 3: Utilities Efficiency
KPIs under this category measure the company’s ability to maximise the utility of assets and equipment that are used for production within its factory or plant. Parameters used by manufacturers within this category include overall equipment effectiveness (OEE), frequency of unplanned downtime, duration of assets’ lifespan, and unit throughput. Improvements to asset and equipment efficiency will increase a manufacturing facility’s production volume, leading to revenue gains and reduced excess capital spent on repairs and replacements.
KPIs under this category assess both the direct and indirect labour productivity in factories or plants. Companies with strong workforce efficiency will generally require fewer man-hours per task. Depending on the companies’ human resources policies, employee turnover and training effectiveness could also be additional parameters in both influencing and determining workforce efficiency. Improvements in workforce efficiency can result in greater revenue contributions per employee and enhance intangible elements like workforce morale.
KPIs under this category take into consideration the amount of energy and water consumed, as well as emissions and wastewater produced by a company’s manufacturing operations. If utilities costs make up a significant portion of a company’s production expenses, improvements in utilities efficiency will enable it to produce at a lower cost or operate with a higher profit margin. In addition, given the growing focus on climate change and sustainability, companies operating at a higher utilities efficiency level may also be perceived as being more environmentally responsible. This could be a significant consideration for companies in brand-conscious, consumer-facing industries.
Smart Industry Readiness Index | The Prioritisation Matrix 21

KPI 4: Inventory Efficiency
KPIs under this category aim to guide manufacturers towards optimising and/or minimising the average volume of inventory required. Storing excess inventory creates unnecessary burdens and costs, particularly for factories or plants that have limited land or storage space. In addition to locking up working capital, manufacturing facilities with large volumes of unutilised inventory can experience increased costs resulting from higher land and/or building rentals, extra manpower to manage inventory, and greater wastage due to expiring inventory. In extreme cases, excess inventory can even cannibalise space that could have been designated for new manufacturing lines or functions such as product design or testing.
KPI 5: Materials Efficiency
KPIs under this category aim to measure the company’s efforts in optimising the usage of raw materials in its production process. Success in this category can come from using less inputs for the same amount of output or recycling a larger amount of unused/unprocessed inputs for subsequent production. Achieving higher levels of material efficiency can not only yield economic benefits such as savings in raw materials, but also contribute towards environmental stewardship by reinforcing the sustainability imperative of the company.
“At Rockwell Automation, we recognise the urgency to bring the Connected Enterprise to life to maintain our competitiveness. The TIER framework provides us with a comprehensive, yet easy-to-use approach to guide our digital transformation efforts towards areas that are of high-impact to our company.”
– Mr Yeoh Pit Wee, Director of Operations for Asia-Pacific, Europe, Middle East and Africa,Rockwell Automation
Catalysing the transformation of manufacturing 22

KPI 8: SafetyKPI 6: Process Quality
KPI 7: Product Quality
KPIs under this category measure and track the number of workplace health and safety incidents in the company’s facilities. Having few or no health and safety issues within the working environment will help minimise disruptions and ensure the company’s operations continue running smoothly. Additionally, keeping employees healthy and safe reduces regulatory and compensation costs, and more importantly, helps to raise the morale and confidence of employees. In the long run, this can also create positive spin-offs in employer branding and customer confidence.
KPIs under this category evaluate the performance and resilience of a company’s core and support processes, which include the company’s ability to achieve and maintain the required product specifications during production, while minimising the number of deviations and irregularities from the intended system parameters and conditions. Success in this KPI category is characterised by dependable production lines, increased production output, lower defect rates, or reduced material wastage.
KPIs under this category emphasise the company’s ability to produce a low percentage of defective products – both work-in-progress and finished goods – and that all products are manufactured as closely to the target specifications as possible. Achieving this will reduce the defect rate of finished goods and the likelihood of after-sale failures and product rejections. This will enable the company to sell more products per batch and reduce the costs associated with product repairs, replacements, and warranties.
KPI 9: Security
KPIs under this category measure and track the number of security (physical and digital) breaches in the company’s facilities. In recent times, the increasing digitalisation of manufacturing facilities and growing interconnectivity of assets have led to a heightened level of vulnerability in production systems and networks. This results in a greater need for more robust and resilient cyber-physical security plans to lower the risk of cyber-physical threats that may disrupt the smooth running of manufacturing facilities. The threats include the introduction of viruses and malware that may shut down or reconfigure ongoing production processes and the exposure of sensitive information to non-authorised personnel.
KPI categories under the Quality group reflect a company’s desire to prevent defects in its work-in-progress and finished goods during the manufacturing process, as well as faults in its products after they have been delivered to the customers. While Quality KPIs have always been important to ensure that a manufacturer can meet the ever-rising demands and expectations of customers, a growing number of manufacturers today are voluntarily holding themselves to higher standards in this area. This is because excellent performance in these KPIs not only strengthens customer trust and loyalty, but also reduces costs associated with remanufacturing or replacing faulty products. Over time, this establishes a stronger reputation and brand premium for the manufacturer. There are four KPI categories under the Quality group.
FlexibilityFlexibilityQuality
Smart Industry Readiness Index | The Prioritisation Matrix 23

KPI categories under the Flexibility group evaluate a company’s overall ability to adapt and manage ever-changing business conditions and demands. Today, a company might look to enhance its flexibility in areas such as the production floor, workforce, and/or supply chain. Companies that stress excellence in flexibility are often within the first wave of enterprises that successfully exploit new opportunities arising from dynamic market forces. They are often the same companies that other businesses will turn to for time-sensitive and/or critical contracts due to their ability to react responsively and flex accordingly. There are three KPI categories under the Flexibility group.
KPI 10: Planning & Scheduling Effectiveness
KPIs under this category focus on the manufacturer’s proficiency and adaptability in its planning and scheduling functions. Companies that excel in this area generally have strong predictive analytic capabilities and clear visibility of their supply chains. This is on top of a wide network of reliable partners (suppliers and customers) which allows them to effectively handle volatile market demand and supply, and take on/fulfil orders at short notice, without significant disruptions to manufacturing and supply chain operations. Success in this area will drive top-line growth through an enhanced ability to take on more business. It also limits the adverse impacts of any market demand and supply shortfall, which subsequently fosters a strong corporate reputation for reliability and adaptability.
KPI 11: Production Flexibility
KPIs under this category measure a manufacturer’s ability to augment and decentralise its production processes through a plug-and-play approach. Flexible production is where equipment, machinery, and computer-based systems can be modified, reconfigured, and retasked quickly and easily when needed, thus enabling a manufacturer to manage various permutations of product mix and volume. This allows the manufacturer to promptly achieve a high number of SKUs in accordance with changing customer needs and market demands, while incurring relatively low cost.
KPI 12: Workforce Flexibility
KPIs under this category assess the ability of a company’s workforce to perform a variety of different job functions. Building a strong team of multi-skilled workers across the different levels of the organisation allows a manufacturer more options in potentially redeploying employees during periods of volatility, such as when market demandfluctuates. This enables the company to achieve stability more quickly and effectively. Having a flexible workforce also enables a company to better cope with sudden attrition, thus strengthening the company’s business continuity.
Flexibility
Catalysing the transformation of manufacturing 24

The growing interconnectivity of systems and rise of new digital technologies such as big data and advanced analytics are providing companies with richer insights into their products, customer preferences, and market expectations. This has led to shorter product life cycles. With this overall trend, Speed is evolving to be less of a differentiator, and more of a necessity for manufacturers to remain competitive. Increased speed to market enables a manufacturer to reach a wider pool of consumers and maximise sales. There are two KPI categories under the Speed group.
FlexibilityFlexibilitySpeed
KPI 14: Time to Delivery
KPIs under this category measure the length of time a company needs to go from initiation of a project or contract to producing and delivering the finished products to end-customers. For many industries, most product orders are subjected to some level of time-sensitivity, and a delayed delivery could translate to substantial losses in future business opportunities. Companies that can deliver outcomes more quickly and reliably will be able to establish themselves as the premier providers in the industry, and possibly command a service premium for urgent orders.
KPI 13: Time to Market
KPIs under the Time to Market (TTM) category measure the length of time it takes for a company to conceive a new product, or augment an existing one, and launch it in the market. The digitalisation of industrial sectors has led to an increase in information flow and data exchange across the entire product value chain and allowed companies today to have greater access to customer feedback. This reduces the amount of time needed to augment or develop products that can better support changing market needs. Having a short TTM will allow companies to capitalise on emerging business trends, especially when there is a narrow window of opportunity. By ensuring its products hit the markets ahead of its competitors, a company with a shorter TTM can capture a larger market share through its first-mover advantage.
Smart Industry Readiness Index | The Prioritisation Matrix 25

How a company’s strategic direction is reflected in their selection of top KPI categories
Consumer Goods IndustryA shoe manufacturer that aims to position itself as the go-to company for high-end customised sneakers will place greater importance on KPI categories such as Product Quality and Production Flexibility. Performing well in those KPI categories allows the company to manufacture a diverse range of long-lasting, hyper-personalised shoes while maintaining a healthy profit margin.
Chemicals IndustryPolyethylene is the most used plastic in the world, with global production topping more than 80 million tonnes in 2017. However, it is also highly commoditised. As polyethylene manufacturers are unable to set the price of the product, they typically strive to be the most cost-competitive to extract the highest possible profit margin. These manufacturers would place a larger emphasis on Productivity-linked KPI categories such as Asset & Equipment Efficiency, Materials Efficiency, Workforce Efficiency, and Utilities Efficiency.
“As a medium-sized enterprise with limited resources, it is especially important that we invest our time and effort in the right areas. The Prioritisation Matrix is a valuable tool because it highlights the high-impact areas that we should focus on for our Industry 4.0 plans.”
– Mr Aaron Teo, CEO, Shine Precision
Catalysing the transformation of manufacturing 26

Understanding the Degree of Relevance Tables
THE PRIORITISATION MATRIX FORMULA
Top KPIs] iCost Profile] + +Wk W [BIC - AMS] ip=Impact Value ofSIRI Dimension i
Wc [ [i k DORc DOR
The Degree of Relevance (“DOR”) Tables reflect the relative impact that each SIRI Dimension can have on a cost or KPI category. The DORC and DORK Tables can be found on pages 38 and 39.
The levels of impact in the DOR Tables are ranked into three degrees of relevance, indicated in Figure 11 below.
0 – Negligible 1 – Small and/or Indirect3 – High and Direct
The 3 Degrees of Relevance
For instance, in the DORC Table, the Shop Floor Automation SIRI Dimension has a DOR of “3” for the Labour cost category. This is because improvements in automating shop floor production processes will significantly help to reduce labour costs. On the other hand, the Integrated Product Lifecyle SIRI Dimension has a DOR of “0” for the Utilities cost category, as the association between the SIRI Dimension and the cost category is negligible.
Similarly, in the DORK Table, the Horizontal Integration SIRI Dimension has a DOR of “3” for the Time to Delivery KPI category. This is because when the company’s supply chain processes are more integrated with those of suppliers, delivery operations are better optimised and the time to transport goods to customers may be shortened. On the other hand, the Enterprise Automation SIRI Dimension has a DOR of “0” for the Utilities Efficiency KPI category, as the association between the SIRI Dimension and the KPI category is negligible.
2 There is a step increase in the degrees of relevance between “1” and “3” to create greater differentiation in the mathematical
calculations between SIRI Dimensions that have a high level of impact and those that have a moderate level of impact.
Figure 11: The 3 Degrees of Relevance2
Smart Industry Readiness Index | The Prioritisation Matrix 27

The final factor in the Prioritisation Matrix formula is the Proximity Factor. A company’s Assessment Matrix Score serves as the baseline from which it will measure the impact of changes and track the progress of its transformation. The Proximity Factor of a SIRI Dimension reflects the gap between a company’s current state and that of the best-in-class. It is therefore calculated by taking the difference between the company’s Assessment Matrix Score and the Industry Best-in-Class Benchmark (indicated in the formula as “AMS” and “BIC” respectively).
The Industry Best-in-Class Benchmark is defined as the average performance of the top 10 per cent of manufacturers in a particular industry, across all 16 SIRI Dimensions. The Industry Best-in-Class Benchmarks for 14 manufacturing industries3, derived from the Official SIRI Assessment database and further refined by a panel of industry experts, can be found on page 40.
Knowing and comparing with the Industry Best-in-Class Benchmark is important for two reasons. Firstly, a company that knows what its industry’s best-in-class looks like has a better sense of what is achievable. Not every Industry 4.0 technology or solution in the market is financially practical to procure today. Even among the technologies and solutions that are commercially viable, many are often beyond what a typical manufacturer needs to become industry-leading. By recognising what the top manufacturers in their industries have attained, companies have a more realistic point of reference and are better able to set pragmatic goals and aspirations.
Secondly, by comparing one’s facility against its Industry Best-in-Class Benchmark, manufacturers are better able to identify aspects where they lag the most, which are often the areas with the greatest scope for improvements.
For companies that are best-in-class in certain aspects, the information can be a basis for deliberate efforts to widen the gap between them and the rest of the manufacturing community, which further extends their leadership position. Either way, when companies know where they stand relative to their Industry Best-in-Class Benchmark, they can better articulate the rationales for embarking on transformation in specific Industry 4.0 areas.
Proximity Factor
+ [DOR Top KPIs] iWk k [DORWc c Cost Profile] i + Wp=Impact Value ofSIRI Dimension i
[BIC - AMS]i
THE PRIORITISATION MATRIX FORMULA
3 The list of 14 industries and their descriptions can be found on pages 42, 43 and 44
Catalysing the transformation of manufacturing 28

Assigning Weightages: Using a Company’s Planning Horizon as a Guide
THE PRIORITISATION MATRIX FORMULA
[BIC - AMS] i+ [DOR Top KPIs] ikkWc [DOR Cost Profile] icW +=Impact Value ofSIRI Dimension i
kW
The Prioritisation Matrix formula incorporates three key factors described in the earlier sections. While the three key factors ensure a comprehensive prioritisation exercise, each factor will have a varying level of influence depending on a company’s considerations.
To incorporate each factor’s varying level of influence, we introduced the concept of applying weights to each factor in the Prioritisation Matrix formula. In addition, this whitepaper recommends the use of a company’s business planning horizon to guide the assignment of weightages across the three key factors. A company’s business planning
horizon is the length of time into the future that is accounted for in the development of a business plan or strategy. It often reflects the various considerations that the company may have for its prioritisation exercise and hence provides a good indication as to how the weightages should be distributed across the three key factors.
The weights indicated in the Figure 12 below are organised according to a company’s business planning horizon and they provide a reference for companies. However, companies may choose to adjust the weights for each factor according to their unique circumstances.
Weightage Distribution according to Planning Horizon
Cost Factor (Wc)Planning Horizon KPI Factor (Wk) Proximity Factor (Wp)
30%40%30%Strategic
(3 – 5 years)Tactical
(1 – 2 years)
Operational(3 – 6 months)
25%30%45%
20%20%60%
Figure 12: Weightage Distribution according to Planning Horizon
Smart Industry Readiness Index | The Prioritisation Matrix 29

Strategic
The Strategic planning horizon accords the highest weightage to the KPI Factor. Compared to the other planning horizons, it also accords the greatest weightage to the Proximity Factor. Companies that reference the Strategic planning horizon are often large MNCs that aspire to keep pushing the boundaries and maintain a lead over their peers, or those that intend to make a deliberate push to overtake their closest competitors. It is generally recommended that a company should seek to adopt a Strategic planning horizon only if there is no near-term pressure to improve its financial and market positions.
Tactical
Operational
Globally, the Tactical planning horizon is the one most commonly adopted by businesses, particularly SMEs. These businesses either lack the resources and risk appetites to commit to transformation plans beyond two years or have no need and/or ability to transform into a global best-in-class manufacturing firm. Even a number of organisations with regional presence, both publicly listed and family-owned, may choose to adopt the Tactical planning horizon from time to time. This helps them remain nimble in responding to changing market conditions, especially during periods when the business outlook offers limited security or certainty.
The Operational planning horizon accords the greatest weightage to the Cost Factor. This planning horizon should be adopted by companies that are under pressure to deliver quick, short-term financial returns. A small weightage remains attributed to both the KPI and Proximity Factors as cost reduction, while important, is not the only effective intervention to address short-term business issues. Micro-sized local enterprises with a very limited product range and/or volume may choose to reference this planning horizon.
“The logic behind the practical Prioritisation Matrix approach to maturity measurement in the context of Industry 4.0 is sound. I am confident that this approach will greatly assist companies in managing their activities as they move towards Industry 4.0.”
– Prof. Dr. Michael Henke, Director, Enterprise Logistics, Fraunhofer Institute for Material Flow and Logistics IML
Catalysing the transformation of manufacturing 30
Bringing It All Together: An Illustrative Case Study
Key Performance Indicators
Cost ProfileAssessmentMatrix Score
Best-in-ClassBenchmark
THE PRIORITISATION MATRIX FORMULA
AMS: Assessment Matrix Score
BIC: Industry Best-in-Class Benchmark
CDOR : Degree of Relevance (Cost)
KDOR : Degree of Relevance (KPI)
W: Weightage assigned to the factor
Wc Cost Factor i
Wc c [DOR Cost Profile] i+ +
Wk KPI Factor i
Wk k [DOR Top KPIs] i
+ +=
=
Impact Value ofSIRI Dimension i
Weighted Cost Factor i Weighted KPI Factor i+ +=
Wp Proximity Factor i
Weighted Proximity Factor i
Wp [BIC - AMS] i
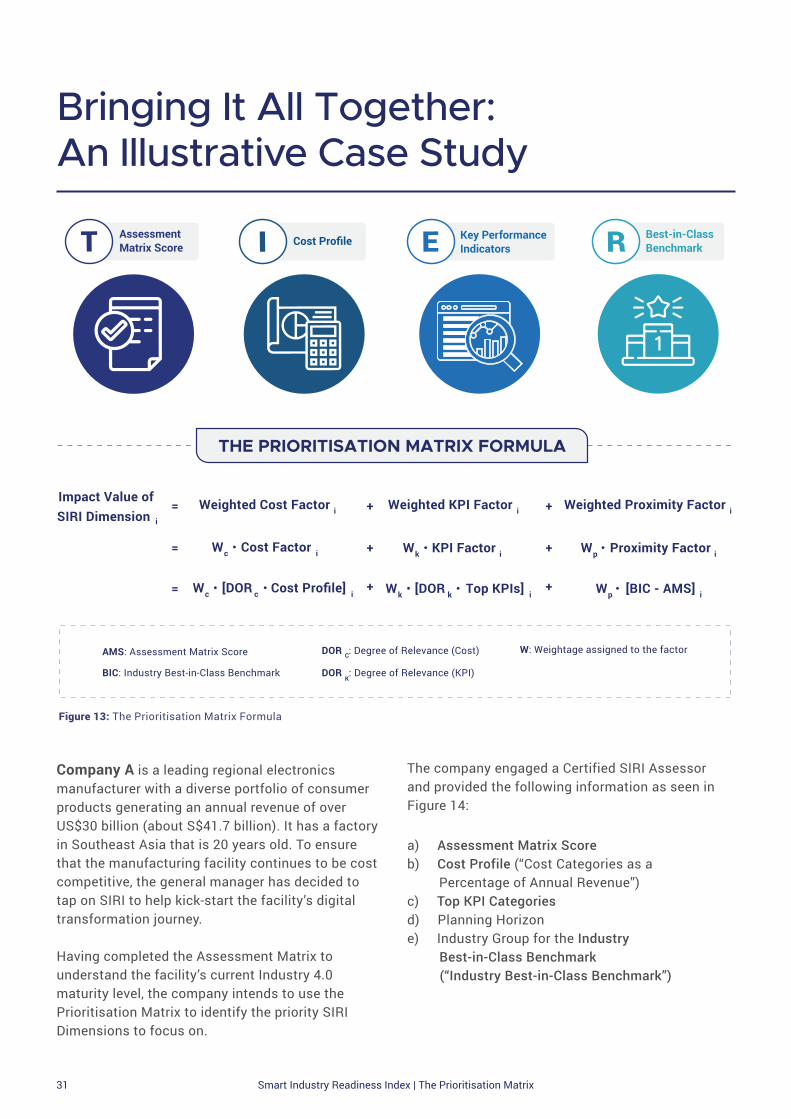
Company A is a leading regional electronics manufacturer with a diverse portfolio of consumer products generating an annual revenue of over US$30 billion (about S$41.7 billion). It has a factory in Southeast Asia that is 20 years old. To ensure that the manufacturing facility continues to be cost competitive, the general manager has decided to tap on SIRI to help kick-start the facility’s digital transformation journey.
Having completed the Assessment Matrix to understand the facility’s current Industry 4.0 maturity level, the company intends to use the Prioritisation Matrix to identify the priority SIRI Dimensions to focus on.
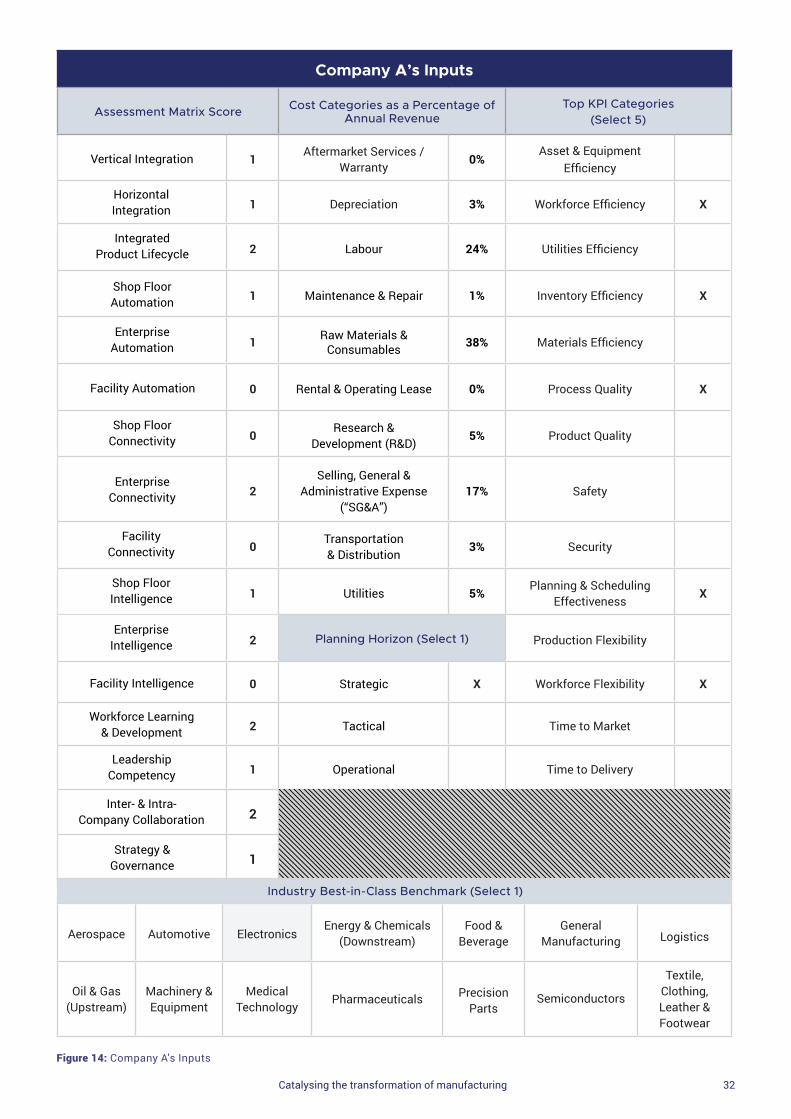
The company engaged a Certified SIRI Assessor and provided the following information as seen in Figure 14:
a) Assessment Matrix Scoreb) Cost Profile (“Cost Categories as a Percentage of Annual Revenue”)c) Top KPI Categoriesd) Planning Horizone) Industry Group for the Industry Best-in-Class Benchmark (“Industry Best-in-Class Benchmark”)
Figure 13: The Prioritisation Matrix Formula
Smart Industry Readiness Index | The Prioritisation Matrix 31
Horizontal Integration
Integrated Product Lifecycle
Shop Floor Automation
Enterprise Automation
Facility Automation
Shop Floor Connectivity
Enterprise Connectivity
Facility Connectivity
Shop Floor Intelligence
Enterprise Intelligence
Facility Intelligence
Strategy & Governance
Inter- & Intra- Company Collaboration
Leadership Competency
Workforce Learning& Development
Company A’s Inputs
Assessment Matrix Score Cost Categories as a Percentage of Annual Revenue
Top KPI Categories(Select 5)
1Aftermarket Services /
Warranty0%
Asset & Equipment Efficiency
1 Depreciation 3% Workforce Efficiency X
2 Labour 24% Utilities Efficiency
1 Maintenance & Repair 1% Inventory Efficiency X
1 Raw Materials & Consumables 38% Materials Efficiency
0 Rental & Operating Lease 0% Process Quality X
0Research &
Development (R&D)5% Product Quality
2Selling, General &
Administrative Expense (“SG&A”)
17% Safety
0Transportation & Distribution
3% Security
1 Utilities 5%Planning & Scheduling
EffectivenessX
2 Planning Horizon (Select 1) Production Flexibility
0 Strategic X Workforce Flexibility X
2 Tactical Time to Market
1 Operational Time to Delivery
2
1
Figure 14: Company A's Inputs
Aerospace Automotive Electronics
Energy & Chemicals (Downstream)
Food & Beverage
General Manufacturing Logistics
Oil & Gas
(Upstream)
Machinery & Equipment
Medical
Technology
Pharmaceuticals
Precision
Parts
Semiconductors
Textile, Clothing, Leather & Footwear
Industry Best-in-Class Benchmark (Select 1)
Catalysing the transformation of manufacturing 32
Vertical Integration

4 The step-by-step calculation methodology of the Prioritisation Matrix tool can be found on pages 35-41
Results
Using the information provided by Company A, the Prioritisation Matrix4 identified the following four SIRI Dimensions as the high-impact areas for Company A to focus its resources and attention on:
• Vertical Integration• Horizontal Integration
• Shop Floor Intelligence • Leadership Competency
Enhancing Vertical Integration and Shop Floor Intelligence will improve Company A’s ability to uphold the quality of its manufacturing processes through processing and analysing data. Working on these two dimensions will consequently strengthen Company A’s Workforce Efficiency and Workforce Flexibility, both of which were highlighted as the company’s top KPI categories.
Furthermore, Company A’s improvement in the Horizontal Integration dimension will increase its Planning & Scheduling Effectiveness. This will help the company optimise the management of its
Raw Materials & Consumables, which currently make up more than a third (38 per cent) of the company’s annual revenue.
Finally, improvements to Leadership Competency will position Company A’s management team to better leverage the latest trends and technologies to develop relevant transformation initiatives. This will enhance the company’s capability to develop a more robust, long-term transformation plan, which is aligned with its intentions to adopt a Strategic planning horizon.
Technology OrganisationProcess
Figure 15: High-impact areas of focus for Company A
“There is no favourable wind for the sailor who does not know where to go (Seneca). The Prioritisation Matrix helps a company to identify the key areas that it should focus on as it starts its Industry 4.0 journey. Knowing which is the first step in the right direction and the expected outcomes, is crucial before you decide to make the required investment in the people, the technology and the processes that will ultimately make your manufacturing business more agile and resilient.”
– Mr David Marchesseau, Regional Vice President, Head of Industries, SAP
Smart Industry Readiness Index | The Prioritisation Matrix 33

The Way Forward
Planning and executing an Industry 4.0 transformation plan is no small undertaking. It requires companies to invest significant resources into areas such as conducting research, engaging potential solution providers, performing cost-benefit analyses, and monitoring the progress of projects. As a result, few companies are willing to take the plunge, unless they are highly confident that implemented projects will achieve their desired outcomes.
The TIER Framework and the Prioritisation Matrix can help bolster clarity and reduce uncertainty, by offering manufacturers a systematic approach to prioritise their focus areas.
EDB and its knowledge partners look forward to companies making full use of the TIER Framework and the Prioritisation Matrix, to move in the right direction and forge ahead with their Industry 4.0 transformation.
“For a company like Infineon that has embarked on our Industry 4.0 plans, the Prioritisation Matrix serves as a useful tool to help us review whether our on-going efforts are in the right direction.”
– Dr Laurent Filipozzi, VP and Site Head Plant Singapore, Infineon
Catalysing the transformation of manufacturing 34

Calculation Methodology of the Prioritisation Matrix
This step-by-step guide outlines the calculation methodology of the Prioritisation Matrix tool. This is referenced in the Company A case study on page 31.
Step Instructions
1
Obtain the company’s inputs for the Prioritisation Matrix The inputs required for the Prioritisation Matrix are: • Assessment Matrix Score: Conduct an evaluation of the facility’s current state by using the Assessment Matrix to obtain the banding across the 16 SIRI Dimensions • Cost Profile: Input the breakdown of each cost category as a percentage of the company’s annual revenue* • Top KPI Categories: Choose five out of the 14 KPI categories • Planning Horizon: Indicate the company’s planning horizon • Industry Best-in-Class Benchmark: Select the appropriate industry group
* The percentages need not add up to 100% if the company is profitable. The percentages may add up to more than 100% if the company is loss-making.
2
Calculate the Cost Factor a. In the DORC Table (page 38), insert the company’s Cost Profile in the “Input” column as a decimal representation of the percentage (for example, input 0.15 if the cost category is 15 per cent of annual revenue) b. For each SIRI Dimension: • Multiply the DORC value by the corresponding value in the “Input” column for all 10 cost categories and sum the values to obtain a cumulative value • In the “Cost Factor” row, indicate the cumulative value
Example calculation:[Cost Factor]Vertical Integration = (0.00*0) + (0.03*1) + (0.24*3) + (0.01*3) + (0.38*3) + (0.00*1) + (0.05*1) + (0.17*1) + (0.03*0) + (0.05*1) = 2.19
DORC Table
Smart Industry Readiness Index | The Prioritisation Matrix 35

Step Instructions
3
Calculate the KPI Factor
a. In the DORk Table (page 39), indicate the following in the “Input” column: • For the 5 chosen KPI categories, indicate “1” • For the remaining 9 KPI categories, indicate “0” b. For each SIRI Dimension: • Multiply the DORk value by the corresponding value in the “Input” column for all 14 KPI categories and sum the values to obtain a cumulative value • In the “KPI Factor” row, indicate the cumulative value
Example calculation:[KPI Factor]Vertical Integration = (0*3) + (1*3) + (0*1) + (1*3) + (0*3) + (1*3) + (0*3) + (0*1) + (0*1) + (1*1) + (0*3) + (1*3) + (0*0) + (0*3) = 13
4
Calculate the Proximity Factor
a. In the Industry Best-in-Class Benchmarks Table (page 40) • Indicate “X” in the “Input” column against the selected industry for comparison • Input Company A’s Assessment Matrix Score in the “Assessment Matrix Score” row b. For each SIRI Dimension: • Subtract the value in the “Assessment Matrix Score” row from the value in the selected “Industry” row and indicate the difference* in the “Proximity Factor” Row
*If the difference has a negative value, indicate “0” into the “Proximity Factor” row.
Example calculation:[Proximity Factor]Vertical Integration
= [Selected Industry] value – [Assessment Matrix Score] value= 4 – 1= 3
5
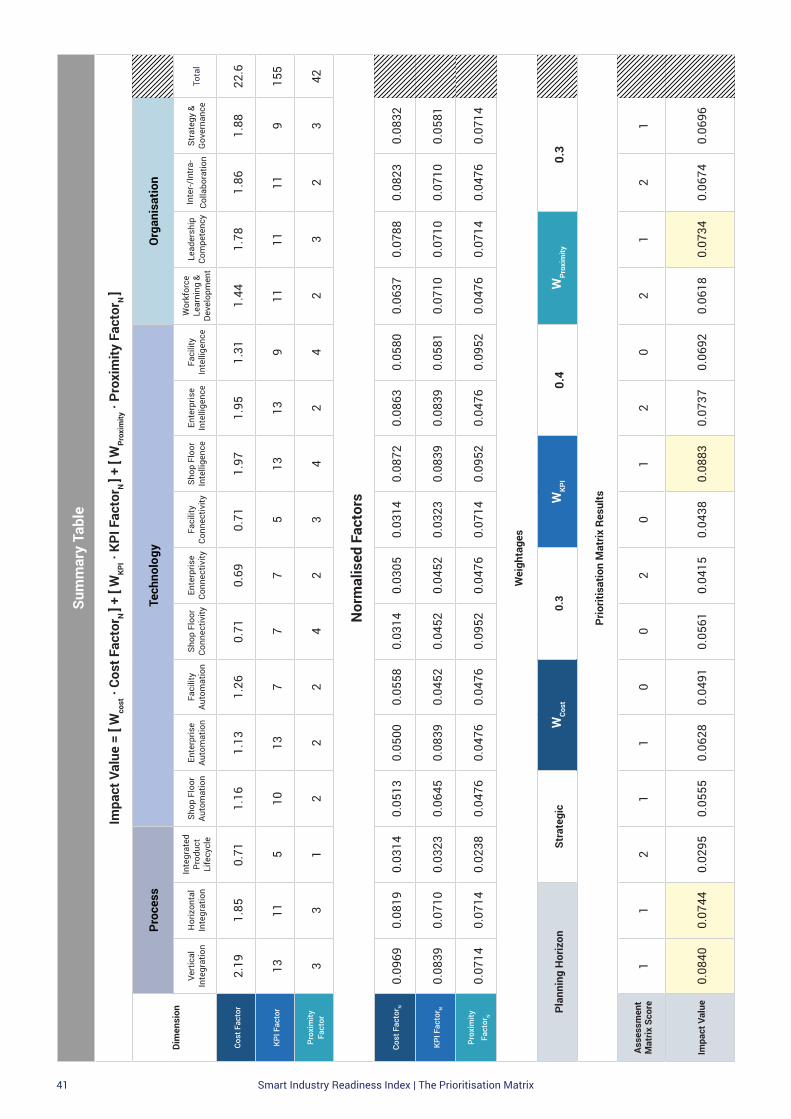
Compile the Cost, KPI, and Proximity Factor values into the Summary Table a. In the Summary Table, input the respective rows: • Cost Factors for all 16 SIRI Dimensions • KPI Factors for all 16 SIRI Dimensions • Proximity Factors for all 16 SIRI Dimensions • Selected planning horizon and the corresponding weights for each factor • Company A’s Assessment Matrix Score
b. For each of the 3 factors, sum the values across all 16 SIRI Dimensions and input the cumulative value in the “Total” column.
DORk Table
Industry Best-in-Class Benchmarks Table
Summary Table
Catalysing the transformation of manufacturing 36

Step Instructions
6
Normalise the values for all 3 factorsAt present, the Cost, KPI, and Proximity Factors differ in the magnitude of their ranges. To allow for a more equitable comparison, the factors are normalised. a. In the Summary Table, for each of the 16 SIRI Dimensions:
• Divide the “Cost Factor” value by the corresponding value in the “Total” column of the same row. Input the resulting value (to 3 significant figures) in the “Cost FactorN” row
• Divide the “KPI Factor” value by the corresponding value in the “Total” column of the same row. Input the resulting value (to 3 significant figures) in the “KPI FactorN” row • Divide the “Proximity Factor” value by the corresponding value in the “Total” column of the same row. Input the resulting value (to 3 significant figures) in the “Proximity FactorN” row
Example calculation:[Cost FactorN ]Vertical Integration = (2.19 / 22.6) = 0.0969
7
Apply the weights to the normalised factors a. In the Summary Table, for each of the 16 SIRI dimensions: • Multiply the values in the “Cost FactorN”, “KPI FactorN”, and “Proximity FactorN” rows with the corresponding weight for each factor • Sum up the 3 weighted values and input the result into the “Impact Value” row
Example calculation:[Impact Value]Vertical Integration = Wcost · Cost FactorN + WKPI · KPI FactorN + WProximity · Proximity FactorN
= (0.30 * 0.0969) + (0.40 * 0.0839) + (0.30 * 0.0714) = 0.0840
8
Select the Prioritised SIRI Dimensions a. In each of the 3 building blocks of the SIRI Framework (“Process”, “Technology”, and “Organisation”), select the SIRI Dimension that corresponds to the highest Impact Value b. Among the remaining 13 SIRI Dimensions, select the SIRI Dimension with the highest Impact Value
Smart Industry Readiness Index | The Prioritisation Matrix 37
Summary Table
Summary Table

Catalysing the transformation of manufacturing 38
Degr
ee o
f Rel
evan
ce (C
ost)
Cost
Ca
tego
ries
Inpu
t
Proc
ess
Tech
nolo
gyO
rgan
isat
ion
Vert
ical
In
tegr
atio
nH
oriz
onta
l In
tegr
atio
n
Inte
grat
ed
Prod
uct
Life
cycl
e
Shop
Flo
orAu
tom
atio
nEn
terp
rise
Auto
mat
ion
Faci
lity
Auto
mat
ion
Shop
Flo
orCo
nnec
tivity
Ente
rpris
eCo
nnec
tivity
Faci
lity
Conn
ectiv
itySh
op F
loor
Inte
llige
nce
Ente
rpris
eIn
telli
genc
eFa
cilit
yIn
telli
genc
e
Wor
kfor
ce
Lear
ning
&
Deve
lopm
ent
Lead
ersh
ip
Com
pete
ncy
Inte
r- &
Intr
a-
Com
pany
Co
llabo
ratio
n
Stra
tegy
&
Gov
erna
nce
Afte
rmar
ket
Serv
ices
/
War
rant
y0.
000
13
03
00
10
03
01
11
1
Depr
ecia
tion
0.03
10
00
00
10
11
01
01
01
Labo
ur0.
243
00
30
31
01
30
33
33
3
Mai
nten
ance
&
Repa
ir0.
013
11
11
11
11
31
33
11
1
Raw
Mat
eria
l &
Cons
umab
les
0.38
33
11
11
11
13
31
01
11
Rent
al &
O
pera
ting
Leas
e 0.
001
10
11
11
11
11
10
10
1
Rese
arch
&
Deve
lopm
ent
0.05
11
30
30
01
00
30
31
33
SG&A
0.17
13
10
30
01
00
30
33
33
Tran
spor
atio
n
& Di
strib
utio
n 0.
030
30
01
00
10
03
01
13
1
Util
ities
0.
051
10
11
31
11
11
30
10
1
Cost
Fac
tor
2.19
1.85
0.71
1.16
1.13
1.26
0.71
0.69
0.71
1.97
1.95
1.31
1.44
1.78
1.86
1.88

Smart Industry Readiness Index | The Prioritisation Matrix 39
Degr
ee o
f Rel
evan
ce (K
PI)
KPI
Cate
gorie
sIn
put
Proc
ess
Tech
nolo
gyO
rgan
isat
ion
Vert
ical
In
tegr
atio
nH
oriz
onta
l In
tegr
atio
n
Inte
grat
ed
Prod
uct
Life
cycl
e
Shop
Flo
orAu
tom
atio
nEn
terp
rise
Auto
mat
ion
Faci
lity
Auto
mat
ion
Shop
Flo
orCo
nnec
tivity
Ente
rpris
eCo
nnec
tivity
Faci
lity
Conn
ectiv
itySh
op F
loor
Inte
llige
nce
Ente
rpris
eIn
telli
genc
eFa
cilit
yIn
telli
genc
e
Wor
kfor
ce
Lear
ning
&
Deve
lopm
ent
Lead
ersh
ip
Com
pete
ncy
Inte
r- &
Intr
a-
Com
pany
Co
llabo
ratio
n
Stra
tegy
&
Gov
erna
nce
Asse
t &
Equi
pmen
t Effi
ciency
03
10
31
33
13
31
31
11
1
Wor
kfor
ce
Efficiency
13
33
33
31
11
33
33
33
3
Util
ities
Effi
ciency
01
00
10
31
03
10
31
11
1
Inve
ntor
y Effi
ciency
13
30
33
01
10
33
01
11
1
Mat
eria
ls
Efficiency
03
03
11
01
10
33
01
11
1
Proc
ess
Q
ualit
y1
31
13
33
11
13
33
33
31
Prod
uct
Qua
lity
03
13
31
11
11
31
13
13
1
Safe
ty0
10
03
03
10
13
03
13
11
Secu
rity
01
11
00
03
33
11
13
31
3
Plan
ning
&
Sche
dulin
g Ef
fect
iven
ess
11
30
03
01
30
13
01
11
1
Prod
uctio
n Fl
exib
ility
03
10
30
13
01
30
11
31
3
Wor
kfor
ce
Flex
ibili
ty1
31
11
11
31
33
13
33
33
Tim
e to
M
arke
t0
00
30
30
03
00
30
13
13
Tim
e to
De
liver
y0
33
03
31
33
13
31
13
31
KPI
Fact
or13
115
1013
77
75
1313
911
1111
9

Catalysing the transformation of manufacturing 40
Indu
stry
Bes
t-In
-Cla
ss (B
IC) B
ench
mar
ks
SIRI
Indu
stry
Classification
Inpu
t
Proc
ess
Tech
nolo
gyO
rgan
isat
ion
Vert
ical
In
tegr
atio
nH
oriz
onta
l In
tegr
atio
n
Inte
grat
ed
Prod
uct
Life
cycl
e
Shop
Flo
orAu
tom
atio
nEn
terp
rise
Auto
mat
ion
Faci
lity
Auto
mat
ion
Shop
Flo
orCo
nnec
tivity
Ente
rpris
eCo
nnec
tivity
Faci
lity
Conn
ectiv
itySh
op F
loor
Inte
llige
nce
Ente
rpris
eIn
telli
genc
eFa
cilit
yIn
telli
genc
e
Wor
kfor
ce
Lear
ning
&
Deve
lopm
ent
Lead
ersh
ip
Com
pete
ncy
Inte
r- &
Intr
a-
Com
pany
Co
llabo
ratio
n
Stra
tegy
&
Gov
erna
nce
Aero
spac
e3
33
23
24
42
33
23
33
3
Auto
mot
ive
34
42
32
44
23
32
44
44
Elec
tron
ics
X4
43
33
24
43
54
44
44
4
Ener
gy &
Che
mic
als
(Dow
nstr
eam
)4
33
33
34
44
43
44
44
4
Food
& B
ever
ages
43
33
33
44
43
22
44
44
Gen
eral
M
anuf
actu
ring
44
43
32
44
23
32
44
44
Logi
stic
s2
43
34
34
44
23
23
33
3
Mac
hine
ry &
Eq
uipm
ent
34
42
22
44
22
32
33
43
Med
ical
Te
chno
logy
44
34
32
44
23
22
44
44
Oil
& G
as
(Ups
trea
m)
23
32
22
23
22
32
22
22
Phar
mac
eutic
als
43
33
23
44
44
34
44
44
Prec
isio
n Pa
rts
33
33
32
44
22
22
33
33
Sem
icon
duct
ors
44
33
33
44
43
32
44
44
Text
iles,
Clo
thin
g,
Leat
her &
Foo
twea
r3
44
23
24
42
33
23
44
4
Asse
ssm
ent
Mat
rix S
core
11
21
10
02
01
20
21
21
Prox
imity
Fac
tor
33
12
22
42
34
24
23
23
Smart Industry Readiness Index | The Prioritisation Matrix 41
Sum
mar
y Ta
ble
Dim
ensi
onVe
rtic
al
Inte
grat
ion
Hor
izon
tal
Inte
grat
ion
Inte
grat
ed
Prod
uct
Life
cycl
e
Shop
Flo
orAu
tom
atio
nEn
terp
rise
Auto
mat
ion
Faci
lity
Auto
mat
ion
Shop
Flo
orCo
nnec
tivity
Ente
rpris
eCo
nnec
tivity
Faci
lity
Conn
ectiv
itySh
op F
loor
Inte
llige
nce
Ente
rpris
eIn
telli
genc
eFa
cilit
yIn
telli
genc
e
Wor
kfor
ce
Lear
ning
&
Deve
lopm
ent
Lead
ersh
ip
Com
pete
ncy
Inte
r-/In
tra-
Co
llabo
ratio
nSt
rate
gy &
G
over
nanc
eTo
tal
Cost
Fac
tor
2.19
1.85
0.71
1.16
1.13
1.26
0.71
0.69
0.71
1.97
1.95
1.31
1.44
1.78
1.86
1.88
22.6
KPI F
acto
r13
115
1013
77
75
1313
911
1111
915
5
Prox
imity
Fa
ctor
33
12
22
42
34
24
23
23
42
Nor
mal
ised
Fac
tors
Cost
Fac
tor N
0.09
690.
0819
0.03
140.
0513
0.05
000.
0558
0.03
140.
0305
0.03
140.
0872
0.08
630.
0580
0.06
370.
0788
0.08
230.
0832
KPI F
acto
r N0.
0839
0.07
100.
0323
0.06
450.
0839
0.04
520.
0452
0.04
520.
0323
0.08
390.
0839
0.05
810.
0710
0.07
100.
0710
0.05
81
Prox
imity
Fact
orN
0.07
140.
0714
0.02
380.
0476
0.04
760.
0476
0.09
520.
0476
0.07
140.
0952
0.04
760.
0952
0.04
760.
0714
0.04
760.
0714
Wei
ghta
ges
Plan
ning
Hor
izon
Stra
tegi
c0.
30.
40.
3
Prio
ritis
atio
n M
atrix
Res
ults
Asse
ssm
ent
Mat
rix S
core
11
21
10
02
01
20
21
21
Impa
ct V
alue
0.08
400.
0744
0.02
950.
0555
0.06
280.
0491
0.05
610.
0415
0.04
380.
0883
0.07
370.
0692
0.06
180.
0734
0.06
740.
0696
Proc
ess
Tech
nolo
gyO
rgan
isat
ion
Impa
ct V
alue
= [
Wco
st ·
Cost
Fac
tor N
] +
[ WKP
I · K
PI F
acto
r N ]
+ [ W
Prox
imity
· Pr
oxim
ity F
acto
r N ] W
Prox
imity
WKP
IW
Cost

The 14 Industries
Aerospace
The Aerospace Industry comprises companies that manufacture, assemble, repair, and/or service equipment, parts, and products for civil aircraft, military aircraft, and spacecraft. Products include but are not limited to engines, fan blades, avionics, and remanufactured parts.
Automotive
The Automotive Industry comprises companies that manufacture and assemble motor vehicles and/or the parts and accessories for motor vehicles. Motor vehicles include but are not limited to cars, motorcycles, trucks, and buses.
Electronics
The Electronics Industry comprises companies that manufacture electronic components, equipment, computer peripherals, data storage products, and consumer electronics products. Products include but are not limited to connection devices, electron tubes, electronic capacitors, resistors, communications equipment, and printed circuit boards.
Energy & Chemicals (Downstream)
The Energy & Chemical (Downstream) Industry comprises companies that engage in the refining and cracking of crude oil as well as the production of petrochemicals, specialty chemicals, and other chemical products. Products include but are not limited to petroleum naphtha, gasoline, diesel, liquefied petroleum gas, olefins, fuel oils, plastics, synthetic fibres, additives, adhesives, sealants, specialty paints, pigments, coatings, and fragrances.
Food & Beverage
The Food & Beverage (F&B) Industry comprises companies that process, produce, and package food and beverage products. Products include but are not limited to baked goods, canned products, dairy, alcoholic/non-alcoholic beverages, grains, and tobacco products.
Industry Description
Catalysing the transformation of manufacturing 42
Sum
mar
y Ta
ble
Dim
ensi
onVe
rtic
al
Inte
grat
ion
Hor
izon
tal
Inte
grat
ion
Inte
grat
ed
Prod
uct
Life
cycl
e
Shop
Flo
orAu
tom
atio
nEn
terp
rise
Auto
mat
ion
Faci
lity
Auto
mat
ion
Shop
Flo
orCo
nnec
tivity
Ente
rpris
eCo
nnec
tivity
Faci
lity
Conn
ectiv
itySh
op F
loor
Inte
llige
nce
Ente
rpris
eIn
telli
genc
eFa
cilit
yIn
telli
genc
e
Wor
kfor
ce
Lear
ning
&
Deve
lopm
ent
Lead
ersh
ip
Com
pete
ncy
Inte
r-/In
tra-
Co
llabo
ratio
nSt
rate
gy &
G
over
nanc
eTo
tal
Cost
Fac
tor
2.19
1.85
0.71
1.16
1.13
1.26
0.71
0.69
0.71
1.97
1.95
1.31
1.44
1.78
1.86
1.88
22.6
KPI F
acto
r13
115
1013
77
75
1313
911
1111
915
5
Prox
imity
Fa
ctor
33
12
22
42
34
24
23
23
42
Nor
mal
ised
Fac
tors
Cost
Fac
tor N
0.09
690.
0819
0.03
140.
0513
0.05
000.
0558
0.03
140.
0305
0.03
140.
0872
0.08
630.
0580
0.06
370.
0788
0.08
230.
0832
KPI F
acto
r N0.
0839
0.07
100.
0323
0.06
450.
0839
0.04
520.
0452
0.04
520.
0323
0.08
390.
0839
0.05
810.
0710
0.07
100.
0710
0.05
81
Prox
imity
Fact
orN
0.07
140.
0714
0.02
380.
0476
0.04
760.
0476
0.09
520.
0476
0.07
140.
0952
0.04
760.
0952
0.04
760.
0714
0.04
760.
0714
Wei
ghta
ges
Plan
ning
Hor
izon
Stra
tegi
c0.
30.
40.
3
Prio
ritis
atio
n M
atrix
Res
ults
Asse
ssm
ent
Mat
rix S
core
11
21
10
02
01
20
21
21
Impa
ct V
alue
0.08
400.
0744
0.02
950.
0555
0.06
280.
0491
0.05
610.
0415
0.04
380.
0883
0.07
370.
0692
0.06
180.
0734
0.06
740.
0696

General Manufacturing
The General Manufacturing Industry comprises companies that manufacture broad-based consumer and commercial products that are not classified under other industries. Products include but are not limited to bicycles, packaging boxes, and printed media.
Logistics
The Logistics Industry comprises companies that provide freight transportation, courier, warehousing, and other logistical services. Services include but are not limited to storage, distribution, freight forwarding, and end-to-end goods delivery.
Oil & Gas (Upstream)
The Oil & Gas (Upstream) Industry comprises companies that manufacture, assemble, repair, and/or service machinery and equipment for the exploration and extraction of crude oil and natural gas. Products include land drilling rigs, completion tools, offshore platforms, and Floating Production Storage & Offloading (FPSO) conversion units.
Machinery & Equipment
The Machinery & Equipment Industry comprises companies that manufacture, assemble, and repair complex machinery and equipment serving a wide variety of industries such as electronics, aerospace, and medical technology. Products include but are not limited to laser systems, welding equipment, semiconductor foundry equipment, industrial process control equipment, robots, transformers, and machine tools.
Medical Technology
The Medical Technology Industry comprises companies that engage in the production of life science tools, implantables, eyecare, healthcare equipment, and supplies. Products include but are not limited to sequencers, hearing aids, heart valves, contact lenses, mass spectrometers, and cardiovascular and orthopaedic devices.
Pharmaceuticals
The Pharmaceuticals Industry comprises companies that engage in the production of pharmaceuticals products. Products include but are not limited to active pharmaceutical ingredients, medicines, and veterinary drugs.
Industry
Industry Description
Smart Industry Readiness Index | The Prioritisation Matrix 43

Precision Parts
The Precision Parts Industry comprises companies that manufacture precision parts, modules, and components serving a wide variety of industries such as electronics, aerospace, and medical technology. Products include but are not limited to bearings, tubes, rings, springs, wires, gears, casings, and seals.
Semiconductors
The Semiconductors Industry comprises companies engaged in the production, assembly, and testing of semiconductors and related products. Products include but are not limited to integrated circuits, solar wafers and cells, and electronic discrete components such as diodes and transistors.
Textile, Clothing, Leather and Footwear
The Textile, Clothing, Leather and Footwear Industry comprises companies that convert natural and/or synthetic fibres such as cotton, wool, and polyesters into textiles, textile products and clothes; and companies that manufacture leather products and footwear. Products include but are not limited to textiles (fabrics, carpets, knitted garments), wearable apparel (shirts, pants, dresses), leather goods (handbags) and footwear (boots, shoes).
Industry
Industry Description
Catalysing the transformation of manufacturing 44

Acknowledgements
The Singapore Economic Development Board would like to thank all the organisations and individuals that have contributed to the development of the Prioritisation Matrix. These include industrial companies, technology providers, trade associations, institutes of higher learning, research institutions, and government agencies.
Special thanks to TÜV SÜD for its role as the technical advisor, and to Fraunhofer Institute, McKinsey, SAP, and Siemens, for their roles as knowledge partners. EDB would also like to acknowledge all individuals who have set aside time to provide thoughts, insights, and suggestions.
EDB Core Development Team
1. Lim Kok Kiang, Executive Vice President2. Fong Pin Fen, Vice President3. Ben Ong, Senior Manager4. Tan Kiat Hui, Senior Manager5. Ng Wei Wen, Regional Director6. Ong Shu Fen, Manager7. Tey Hui Jie, Manager8. Jerome Ong, Senior Associate
Knowledge Partners
1. Andreas Günter, Project Manager, Fraunhofer Institute for Material Flow and Logistics IML
2.. Michael Henke, Director, Enterprise Logistics, Fraunhofer Institute for Material Flow and Logistics IML
3. Alpesh Patel, Director, Director of Digital Capability Center, McKinsey & Co.
4. Hidayat Hidayat, Consultant, McKinsey & Co.5. Milan Shah, Engagement Manager,
McKinsey & Co.6. David Marchesseau, Regional Vice President,
Head of Industries, SAP7. Teck Ch’ang Lim, Business Development
Manager, Discrete Manufacturing, Industries & Digital Leadership, SAP
8. Raimund Klein, Executive Vice President, Digital Factory & Process Industry & Drives, Siemens
Technical Advisors
1. Andreas Hauser, Director, Digital Service, TÜV SÜD
2. Jackie Tan, Vice President, Digital Service, TÜV SÜD
3. Benson Ang, Senior Consultant, Digital Service, TÜV SÜD
Participating Companies
1. Infineon Technologies Asia Pacific Pte. Ltd.2. Kimberly Clark Singapore Pte. Ltd.3. Pacific Refreshments Pte. Ltd.4. Procter & Gamble International Operations SA
Singapore Branch5. Rockwell Automation Asia Pacific Business
Center Pte. Ltd.6. SATS Ltd.7. Shine Precision Engineering Pte. Ltd.8. Sunningdale Tech Ltd9. Univac Precision Engineering Pte. Ltd.
Smart Industry Readiness Index | The Prioritisation Matrix 45

References
Aldag, Mustafa, and Bulent Eker. “What is Quality 4.0 in the Era of Industry 4.0?.” 3rd International Conference on Quality of Life, Kravujevac, 2018, pp. 31-34. ResearchGate, www.researchgate.net/publication/329442755_WHAT_IS_QUALITY_40_IN_THE_ERA_OF_INDUSTRY_40.
Ang, Joo H., et al. “Energy-Efficient Through-Life Smart Design, Manufacturing and Operation of Ships in an Industry 4.0 Environment.” Energies, vol. 10, no. 5, 29 Apr. 2017, p. 610, doi:10.3390/en10050610.
Arbulu, Imanol, et al. “Industry 4.0: Reinvigorating ASEAN Manufacturing for the Future.” McKinsey & Company, Feb. 2018, www.mckinsey.com/~/media/mckinsey/business%20functions/operations/our%20insights/industry%204%200%20reinvigorating%20asean%20manu-facturing%20for%20the%20future/industry-4-0-reinvigorating-asean-manufacturing-for-the-future.ashx.
Brettel, Malte, et al. “How Virtualization, Decentralization and Network Building Change the Manufacturing Landscape: An Industry 4.0 Perspective.” International Journal of Information and Communication Engineering, vol. 8, no. 1, 2014, pp. 37-44, waset.org/publica-tions/9997144/.
Brettel, Malte, et al. “The Relevance of Manufacturing Flexibility in the Context of Industrie 4.0.” Procedia CIRP, vol. 41, 2016, pp. 105-110. ScienceDirect, doi:10.1016/j.procir.2015.12.047.
Carpi, Raffaele, et al. “The Future of Manufacturing: Your People.” McKinsey & Company, Feb, 2019, www.mckinsey.com/business-func-tions/operations/our-insights/the-future-of-manufacturing-your-people.
Chen, Baotong, et al. “Smart Factory of Industry 4.0: Key Technologies, Application Case, and Challenges.” IEEE Access, vol. 6, 2018, pp. 6505-6519, doi:10.1109/ACCESS.2017.2783682.
Erol, Selim, et al. “Strategic Guidance Towards Industry 4.0–A Three-Stage Process Model.” International Conference on Competitive Man-ufacturing 2016, Stellenbosch, 2016, pp. 495-500. ResearchGate, www.researchgate.net/publication/286937652_Strategic_guidance_to-wards_Industry_40_-_a_three-stage_process_model.
Flatt, Holger, et al. “Analysis of the Cyber-Security of Industry 4.0 Technologies Based on RAMI 4.0 and Identification of Requirements.” 2016 IEEE 21st International Conference on Emerging Technologies and Factory Automation (ETFA), Berlin, 2016, pp. 1-4, doi:10.1109/ETFA.2016.7733634.
“Fortune 500 Companies Accelerating Renewable Energy, Energy Efficiency Efforts.” Ceres, 24 Apr. 2017, www.ceres.org/news-center/press-releases/report-fortune-500-companies-accelerating-renewable-energy-energy.
Glass, Rupert, et al. “Identifying the Barriers to Industrie 4.0.” Procedia CIRP, vol. 72, 2018, pp. 985-988. ScienceDirect, doi:10.1016/j.pro-cir.2018.03.187.
Grangel-González, Irlán, et al. “An RDF-based Approach for Implementing Industry 4.0 Components with Administration Shells.” 2016 IEEE 21st International Conference on Emerging Technologies and Factory Automation (ETFA), Berlin, 2016, pp. 1-8, doi:10.1109/ETFA.2016.7733503.
Hofmann, Erik, and Marco Rüsch. “Industry 4.0 and the Current Status as well as Future Prospects on Logistics.” Computers in Industry, vol. 89, 2017, pp. 23-34. ResearchGate, doi:10.1016/j.compind.2017.04.002.
“IDC Forecasts Worldwide Spending on the Internet of Things to Reach $745 Billion in 2019, Led by the Manufacturing, Consumer, Trans-portation, and Utilities Sectors”. International Data Corporation, 3 Jan. 2019, www.idc.com/getdoc.jsp?containerId=prUS44596319.
Illés, Béla, et al. “New Challenges for Quality Assurance of Manufacturing Processes in Industry 4.0.” Solid State Phenomena, vol. 261, 2017, pp. 481–486, Scientific.net, doi:10.4028/www.scientific.net/ssp.261.481.
Catalysing the transformation of manufacturing 46

Jazdi, Nasser. “Cyber Physical Systems in the Context of Industry 4.0.” 2014 IEEE International Conference on Automation, Quality and Testing, Robotics, Cluj-Napoca, 2014, pp. 1-4, doi:10.1109/aqtr.2014.6857843.
Kagermann, Henning. “Change Through Digitization—Value Creation in the Age of Industry 4.0.” Management of Permanent Change, 2014, pp. 23–45. Springer, doi:10.1007/978-3-658-05014-6_2.Lahiff, Keris. “Volatility is the ‘New Normal,’ But That’s Not a Bad Thing, Says Market Watcher.” CNBC, 12 Feb. 2018, www.cnbc.com/2018/02/12/volatility-is-the-new-normal-but-thats-not-a-bad-thing-says-market-watcher.html.
Lasi, Heiner, et al. “Industry 4.0.” Business & Information Systems Engineering, vol. 6, no. 4, 2014, pp. 239-242. Springer, doi:10.1007/s12599-014-0334-4.
Lee, Jay, et al. “A Cyber-Physical Systems Architecture for Industry 4.0-Based Manufacturing Systems.” Manufacturing Letters, vol. 3, 2015, pp. 18–23. ScienceDirect, doi:10.1016/j.mfglet.2014.12.001.
Leskiw, Sheri‐Lynne, and Parbudyal Singh. “Leadership Development: Learning from Best Practices.” Leadership & Organization Develop-ment Journal, vol. 28, no. 5, 2007, pp. 444–464. EmeraldInsight, doi:10.1108/01437730710761742.
Leurent, Helena, et al. “Fourth Industrial Revolution: Beacons of Technology and Innovation in Manufacturing.” World Economic Forum, in collaboration with McKinsey & Company, 2019, www.weforum.org/whitepapers/fourth-industrial-revolution-beacons-of-technology-and-in-novation-in-manufacturing.
Lu, Yang. “Industry 4.0: A Survey on Technologies, Applications and Open Research Issues.” Journal of Industrial Information Integration, vol. 6, 2017, pp. 1-10. ScienceDirect, doi.org/10.1016/j.jii.2017.04.005.
Lydon, Bill. “Industry 4.0: Intelligent and Flexible Production.” InTech Magazine, 1 Jun. 2016, ISA Publications, 2016, www.isa.org/in-tech/20160601/.
Moeuf, Alexandre, et al. “The Industrial Management of SMEs in the Era of Industry 4.0.” International Journal of Production Research, vol. 56, no. 3, 2018, pp. 1118-1136. Taylor & Francis Online, doi:10.1080/00207543.2017.1372647.
Moffat, Branwell. “Digital Transformation: Stop Talking and Start Doing.” The Future of Customer Engagement and Commerce, 28 May. 2018, www.the-future-of-commerce.com/2018/05/28/digital-transformation-stop-talking-start-doing/.
Mohamed, Nader, et al. “Leveraging the Capabilities of Industry 4.0 for Improving Energy Efficiency in Smart Factories.” IEEE Access, 2019, pp. 1–1. ResearchGate, doi:10.1109/access.2019.2897045.
Mohr, Stephan, et al. “Manufacturing Resource Productivity.” McKinsey & Company, Jun. 2012, www.mckinsey.com/business-functions/sustainability/our-insights/manufacturing-resource-productivity.
“More than 300 Companies Commit to Set Ambitious Science-Based Climate Targets, Including 50 U.S. Businesses.” Science Based Tar-gets Initiative, 18. Sep. 2017, sciencebasedtargets.org/2017/09/18/more-than-300-to-set-science-based-targets/.
Müller, Julian Marius, et al. “What Drives the Implementation of Industry 4.0? The Role of Opportunities and Challenges in the Context of Sustainability.” Sustainability, vol. 10, no. 1, 2018, p. 247, doi:10.3390/su10010247.
“Organizational Health Index (OHI).” McKinsey & Company, www.mckinsey.com/~/media/mckinsey/industries/public%20sector/how%20we%20help%20clients/organization/organizational%20health%20indexpsp.ashx .
Schlechtendahl, Jan, et al. “Making Existing Production Systems Industry 4.0-Ready.” Production Engineering, vol. 9, no. 1, 2014, pp. 143–148. ResearchGate, doi:10.1007/s11740-014-0586-3.
Schumacher, Andreas, et al. “A Maturity Model for Assessing Industry 4.0 Readiness and Maturity of Manufacturing Enterprises.” Procedia CIRP, vol. 52, 2016, pp. 161–166. ScienceDirect, doi:10.1016/j.procir.2016.07.040.
Smart Industry Readiness Index | The Prioritisation Matrix 47

Shrouf, Fadi, et al. “Smart Factories in Industry 4.0: A Review of the Concept and of Energy Management Approached in Production Based on the Internet of Things Paradigm.” 2014 IEEE International Conference on Industrial Engineering and Engineering Management, Bandar Sunway, 2014, pp. 697-701, doi:10.1109/ieem.2014.7058728.
Ślusarczyk, Beata. “Industry 4.0: Are We Ready?.” Polish Journal of Management Studies, vol. 17, 2018, pp. 232-248. ResearchGate, doi:10.17512/pjms.2018.17.1.19. Stentoft, Jan, et al. “Drivers and Barriers for Industry 4.0 Readiness and Practice: A SME Perspective with Empirical Evidence.” Pro-ceedings of the 52nd Hawaii International Conference on System Sciences, Hawaii, 2019, pp. 5155-5164, ScholarSpace, hdl.handle.net/10125/59952.
Thiede, Sebastian, et al. “Implementing Cyber-Physical Production Systems in Learning Factories.” Procedia CIRP, vol. 54, 2016, pp. 7–12. ScienceDirect, doi:10.1016/j.procir.2016.04.098.
Ustundag, Alp, and Emre Cevikcan. Industry 4.0: Managing the Digital Transformation. Springer, 2018, doi:10.1007/978-3-319-57870-5.
Wang, Shiyong, et al. “Implementing Smart Factory of Industrie 4.0: An Outlook.” International Journal of Distributed Sensor Networks, vol. 12, no. 1, 2016, p. 3159805. Sage Journals, doi:10.1155/2016/3159805. Wang, Shiyong, et al. “Towards Smart Factory for Industry 4.0: A Self-organized Multi-agent System with Big Data Based Feedback and Coordination.” Computer Networks, vol. 101, 2016, pp: 158-168. ScienceDirect, doi:10.1016/j.comnet.2015.12.017.
Zaidin, Nur H.M., et al. “Quality Management in Industry 4.0 Era.” Journal of Management and Science, vol. 8, no. 2, 2018, pp. 82-91. Re-searchGate, www.researchgate.net/publication/328630839_Quality_Management_in_Industry_40_Era.
Zhou, Keliang, et al. “Industry 4.0: Towards Future Industrial Opportunities and Challenges.” 2015 12th International Conference on Fuzzy Systems and Knowledge Discovery (FSKD), Zhangjiajie, 2015, pp. 2147-2152, doi:10.1109/fskd.2015.7382284.
Catalysing the transformation of manufacturing 48

“We began our transformation journey back in 2014, when Industry 4.0 was a relatively new concept. The Prioritisation Matrix is therefore timely as it not only validates our ongoing initiatives, but also helps provide greater clarity on their desired outcomes. We will be using the recommendation from the Prioritisation Matrix to review our implementation plans and ensure that we are able to harness the full potential of Industry 4.0 over time.”
– Ms Maeve Lynch, Plant Manager of Pacific Refreshments Pte. Ltd. (Coca-Cola)
Smart Industry Readiness Index | The Prioritisation Matrix 49


Copyright © 2020 Singapore Economic Development Board
www.edb.gov.sg
All rights reserved.