cse 6 242/cx 4 242: d ata a nd v isual a nalytics | g...
TRANSCRIPT

CSE 6242/CX 4242: Data and Visual Analytics | Georgia Tech | Fall 2017
Homework 3: Hadoop, Spark, Pig and Azure
Due: Friday, November 3, 2017, 11:55 PM EST
Prepared by Kiran Sudhir, Varun Bezzam, Yuyu Zhang, Akanksha Bindal, Vishal Bhatnagar, Vivek Iyer, Polo Chau
Submission Instructions and Important Notes: It is important that you read the following instructions carefully and also those about the deliverables at the end of each question or you may lose points. ❏ Always check to make sure you are using the most up-to-date assignment PDF (e.g., re-download it from
the course homepage if unsure). ❏ Submit a single zipped file, called “HW3-{YOUR_LAST_NAME}-{YOUR_FIRST_NAME}.zip”, containing all
the deliverables including source code/scripts, data files, and readme. Example: ‘HW3-Doe-John.zip’ if your name is John Doe. Only .zip is allowed (no other format will be accepted)
❏ You may collaborate with other students on this assignment, but you must write your own code and give the explanations in your own words, and also mention the collaborators’ names on T-Square’s submission page. All GT students must observe the honor code. Suspected plagiarism and academic misconduct will be reported to and directly handled by the Office of Student Integrity (OSI). Here are some examples similar to Prof. Jacob Eisenstein’s NLP course page (grading policy): ❏ OK: discuss concepts and strategies (e.g., how cross-validation works, use hashmap instead of array) ❏ Not OK: several students work on one master copy together (e.g., by dividing it up), sharing solutions, or
using solution from previous years or from the web. ❏ If you use any “slip days”, you must write down the number of days used in the T-square submission page.
For example, “Slip days used: 1”. Each slip day equals 24 hours. E.g., if a submission is late for 30 hours, that counts as 2 slip days.
❏ At the end of this assignment, we have specified a folder structure about how to organize your files in a single zipped file. 5 points will be deducted for not following this strictly.
❏ We will use auto-grading scripts to grade some of your deliverables (there are hundreds of students), so it is extremely important that you strictly follow our requirements. Marks may be deducted if our grading scripts cannot execute on your deliverables.
❏ Wherever you are asked to write down an explanation for the task you perform, stay within the word limit or you may lose points.
❏ In your final zip file, please do not include any intermediate files you may have generated to work on the task, unless your script is absolutely dependent on it to get the final result (which it ideally should not be).
❏ After all slip days are used, 5% deduction for every 24 hours of delay. (e.g., 5 pts for 100-point homework) ❏ We will not consider late submission of any missing parts of a homework assignment or project deliverable.
To make sure you have submitted everything, download your submitted files to double check.
1 Version 1

DO THIS NOW: apply for AWS Educate account, and set up alarms Apply for an “AWS Educate” account RIGHT AWAY to get $100 free credit, and verify that the credit has been properly applied on your account. Creating the account can take days and this assignment’s computation can take hours to run, so if you do not do this now, you may not be able to submit your work in time, because you may still be *waiting* for jobs to complete.
● Go to AWS Educate page ● Click the Join AWS Educate Today button. ● Choose Student, and click Next ● Fill out the application
○ You must use your @gatech.edu email address (GT is an AWS member school). ○ Stay with the default option one (do NOT choose option two “starter” account), or you
will NOT receive the full $100 credit. ○ If you do not have an AWS account ID, sign up for one, as the form suggests. ○ Your AWS Account ID is at the top of this screen.
EXTREMELY IMPORTANT: enable billing alerts AND set up a billing alarm on AWS to notify you when your credits are running low. SHUT DOWN EVERYTHING when you're done with the instances (don’t leave them on over weekends/holidays!), or you may get surprising credit card bills. Highest record from previous classes went above $2000! The good news is you can call AWS to explain the situation and they should be able to waive the charges -- call (phone) AWS customer care immediately (not email) to so you
can resolve the issue quickly (usually within minutes).
DO THIS NOW: apply for Azure free trial account VERY IMPORTANT: Use Firefox or Chrome in incognito/private browsing mode when configuring anything related to Azure (e.g., when using Azure portal), to prevent issues due to browser caches. Safari sometimes loses connections. Create your Azure free trial account RIGHT AWAY using your @gatech.edu email address that includes your Georgia Tech account ID -- the one with alphabets and numbers ([email protected]). Your account comes up with $200 worth of Azure free credit and should be more than enough for this assignment. If you run out of credit, request extra credit by sending us (Polo + TAs) a private Piazza post, with a brief explanation of why you need the credit. It can take a day or more before you can use the extra credit; if you make last-minute requests, you may not be able to turn in your work in time. (See Azure Free Account FAQ to learn more about free credit.)
2 Version 1
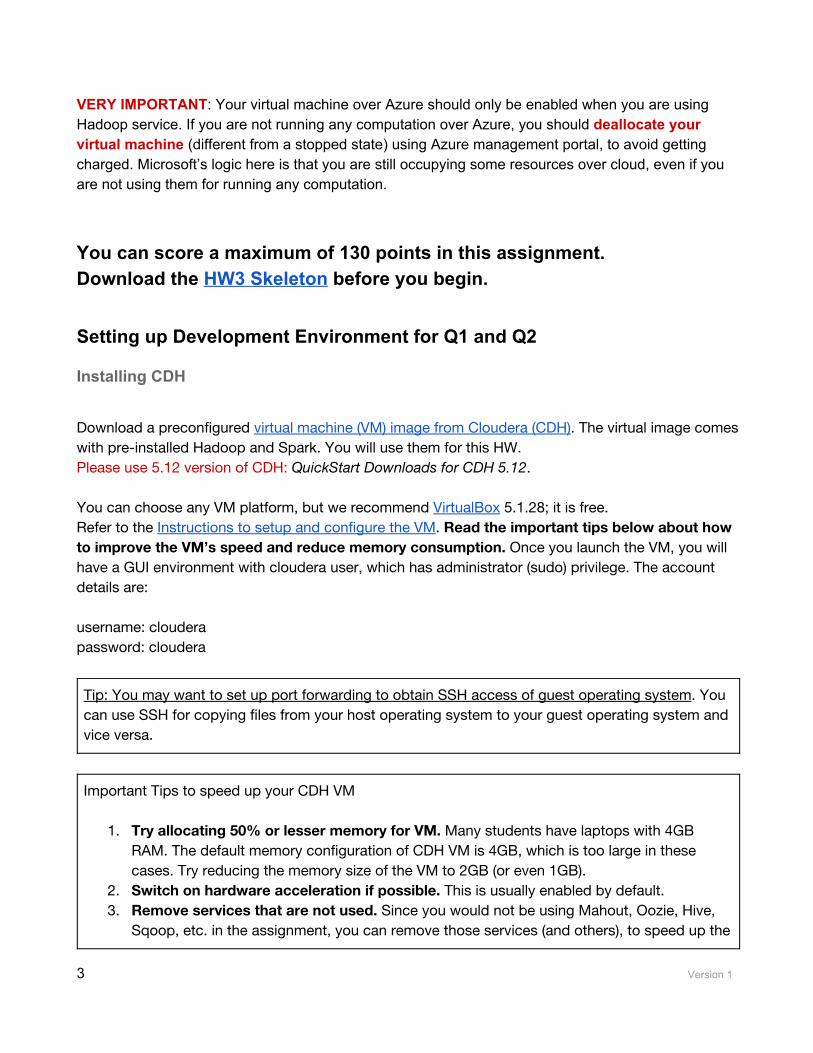
VERY IMPORTANT: Your virtual machine over Azure should only be enabled when you are using Hadoop service. If you are not running any computation over Azure, you should deallocate your virtual machine (different from a stopped state) using Azure management portal, to avoid getting charged. Microsoft’s logic here is that you are still occupying some resources over cloud, even if you are not using them for running any computation. You can score a maximum of 130 points in this assignment. Download the HW3 Skeleton before you begin.
Setting up Development Environment for Q1 and Q2
Installing CDH Download a preconfigured virtual machine (VM) image from Cloudera (CDH). The virtual image comes with pre-installed Hadoop and Spark. You will use them for this HW. Please use 5.12 version of CDH: QuickStart Downloads for CDH 5.12. You can choose any VM platform, but we recommend VirtualBox 5.1.28; it is free. Refer to the Instructions to setup and configure the VM. Read the important tips below about how to improve the VM’s speed and reduce memory consumption. Once you launch the VM, you will have a GUI environment with cloudera user, which has administrator (sudo) privilege. The account details are: username: cloudera password: cloudera
Tip: You may want to set up port forwarding to obtain SSH access of guest operating system. You can use SSH for copying files from your host operating system to your guest operating system and vice versa.
Important Tips to speed up your CDH VM
1. Try allocating 50% or lesser memory for VM. Many students have laptops with 4GB RAM. The default memory configuration of CDH VM is 4GB, which is too large in these cases. Try reducing the memory size of the VM to 2GB (or even 1GB).
2. Switch on hardware acceleration if possible. This is usually enabled by default. 3. Remove services that are not used. Since you would not be using Mahout, Oozie, Hive,
Sqoop, etc. in the assignment, you can remove those services (and others), to speed up the
3 Version 1

VM’s overall speed. Use the following command to remove each service: sudo yum remove mahout sudo yum remove oozie oozie- client sudo yum remove sqoop sudo yum remove sqoop2- server sqoop2- client The entire list of services running can be found at: http://www.cloudera.com/documentation/enterprise/latest/topics/cdh_ig_cdh_comp_uninstall.html
Loading Data into HDFS Now, let us load our dataset into the HDFS (Hadoop Distributed File System), an abstract file system that stores files on clusters. Your Hadoop or Spark code will directly access files on HDFS. Paths on the HDFS look similar to those on the UNIX system, but you cannot explore them directly using standard UNIX commands. Instead, you need to use hadoop fs commands. For example hadoop fs -ls / Download the following two graph files: graph1.tsv (~5MB) and graph2.tsv (~1.1GB when unzipped).
1 2
Use the following commands to setup a directory on the HDFS to store the two graph datasets. Do not change the directory structure below (/user/cse6242/) since we will grade your homework using the scripts that assume the following directory structure. sudo su hdfs hadoop fs -mkdir /user/cse6242/ hadoop fs -chown cloudera /user/cse6242/ exit su cloudera hadoop fs -put path/to/graph1.tsv /user/cse6242/graph1.tsv hadoop fs -put path/to/graph2.tsv /user/cse6242/graph2.tsv Now both files (graph1.tsv and graph2.tsv) are on HDFS, at /user/cse6242/graph1.tsv and /user/cse6242/graph2.tsv. To check this, try:
hadoop fs -ls /user/cse6242
1 Graph derived from the LiveJournal social network dataset, with around 30K nodes and 320K edges. 2 Graph derived from the LiveJournal social network dataset, with around 300K nodes and 69M edges. 4 Version 1
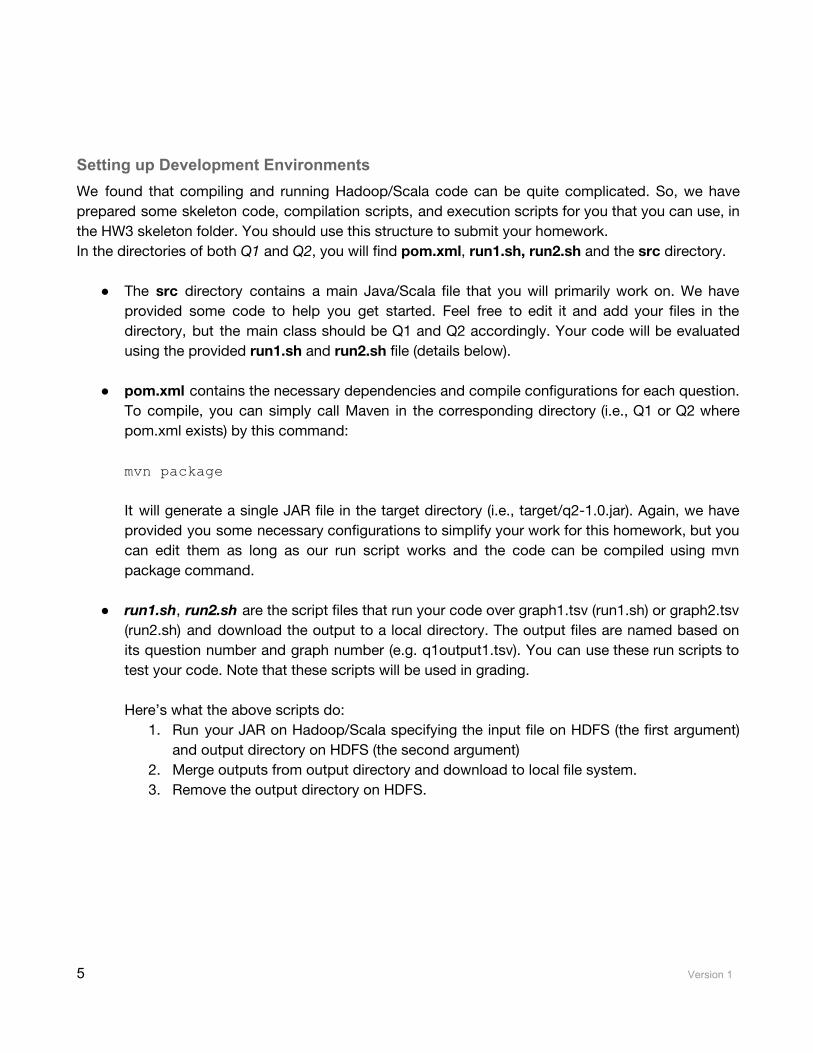
Setting up Development Environments We found that compiling and running Hadoop/Scala code can be quite complicated. So, we have prepared some skeleton code, compilation scripts, and execution scripts for you that you can use, in the HW3 skeleton folder. You should use this structure to submit your homework. In the directories of both Q1 and Q2, you will find pom.xml, run1.sh, run2.sh and the src directory.
● The src directory contains a main Java/Scala file that you will primarily work on. We have provided some code to help you get started. Feel free to edit it and add your files in the directory, but the main class should be Q1 and Q2 accordingly. Your code will be evaluated using the provided run1.sh and run2.sh file (details below).
● pom.xml contains the necessary dependencies and compile configurations for each question.
To compile, you can simply call Maven in the corresponding directory (i.e., Q1 or Q2 where pom.xml exists) by this command: mvn package It will generate a single JAR file in the target directory (i.e., target/q2-1.0.jar). Again, we have provided you some necessary configurations to simplify your work for this homework, but you can edit them as long as our run script works and the code can be compiled using mvn package command.
● run1.sh, run2.sh are the script files that run your code over graph1.tsv (run1.sh) or graph2.tsv
(run2.sh) and download the output to a local directory. The output files are named based on its question number and graph number (e.g. q1output1.tsv). You can use these run scripts to test your code. Note that these scripts will be used in grading.
Here’s what the above scripts do:
1. Run your JAR on Hadoop/Scala specifying the input file on HDFS (the first argument) and output directory on HDFS (the second argument)
2. Merge outputs from output directory and download to local file system. 3. Remove the output directory on HDFS.
5 Version 1
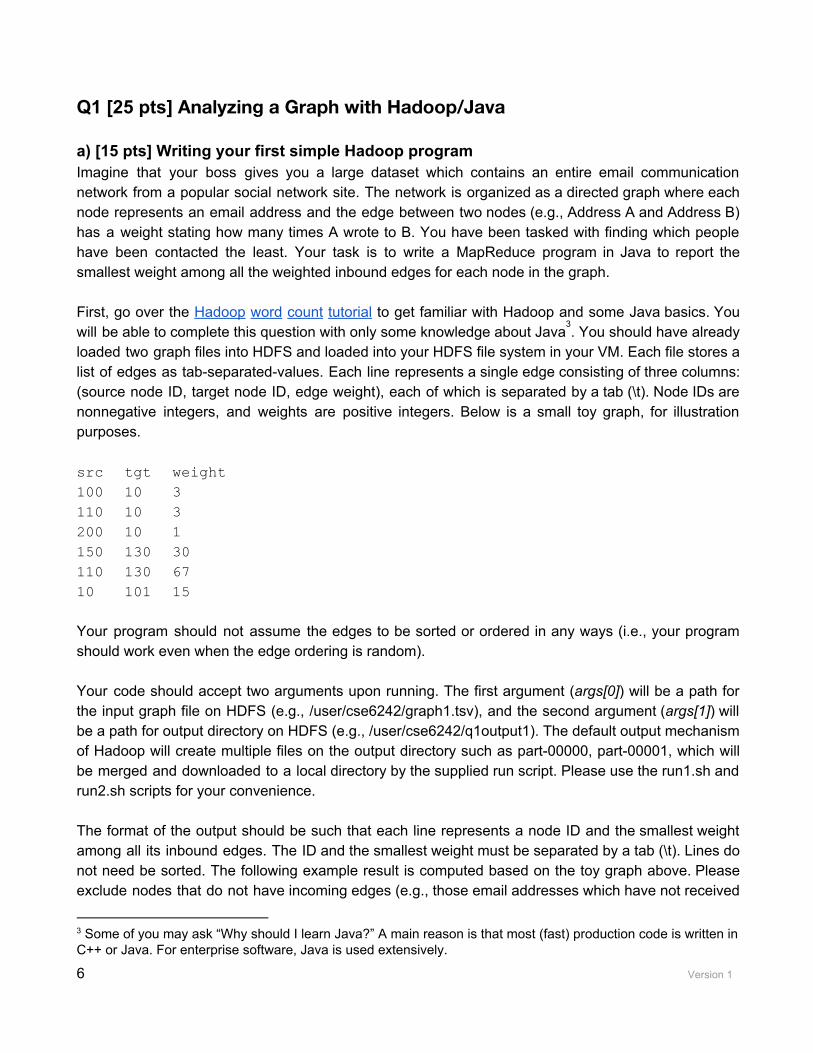
Q1 [25 pts] Analyzing a Graph with Hadoop/Java a) [15 pts] Writing your first simple Hadoop program Imagine that your boss gives you a large dataset which contains an entire email communication network from a popular social network site. The network is organized as a directed graph where each node represents an email address and the edge between two nodes (e.g., Address A and Address B) has a weight stating how many times A wrote to B. You have been tasked with finding which people have been contacted the least. Your task is to write a MapReduce program in Java to report the smallest weight among all the weighted inbound edges for each node in the graph. First, go over the Hadoop word count tutorial to get familiar with Hadoop and some Java basics. You will be able to complete this question with only some knowledge about Java . You should have already
3
loaded two graph files into HDFS and loaded into your HDFS file system in your VM. Each file stores a list of edges as tab-separated-values. Each line represents a single edge consisting of three columns: (source node ID, target node ID, edge weight), each of which is separated by a tab (\t). Node IDs are nonnegative integers, and weights are positive integers. Below is a small toy graph, for illustration purposes. src tgt weight
100 10 3
110 10 3
200 10 1
150 130 30
110 130 67
10 101 15
Your program should not assume the edges to be sorted or ordered in any ways (i.e., your program should work even when the edge ordering is random). Your code should accept two arguments upon running. The first argument (args[0]) will be a path for the input graph file on HDFS (e.g., /user/cse6242/graph1.tsv), and the second argument (args[1]) will be a path for output directory on HDFS (e.g., /user/cse6242/q1output1). The default output mechanism of Hadoop will create multiple files on the output directory such as part-00000, part-00001, which will be merged and downloaded to a local directory by the supplied run script. Please use the run1.sh and run2.sh scripts for your convenience. The format of the output should be such that each line represents a node ID and the smallest weight among all its inbound edges. The ID and the smallest weight must be separated by a tab (\t). Lines do not need be sorted. The following example result is computed based on the toy graph above. Please exclude nodes that do not have incoming edges (e.g., those email addresses which have not received
3 Some of you may ask “Why should I learn Java?” A main reason is that most (fast) production code is written in C++ or Java. For enterprise software, Java is used extensively. 6 Version 1

any communication). For the toy graph above, the output is as follows. 10 1 130 30 101 15
Test your program on graph1.tsv and graph2.tsv. To demonstrate how your MapReduce procedure works, use the inline example above, trace the input and output of your map and reduce functions. That is, given the above graph as the input, describe the input and output of your map and reduce function(s) and how the functions transform/process the data (provide examples whenever appropriate). Write down your answers in description.pdf. Your answers should be written in 12pt font with at least 1” margin on all sides. Your pdf (with answers for both parts a and b) should not exceed 2 pages. You are welcome to explain your answers using a combination of text and images. b) [10 pts] Designing a MapReduce algorithm (and thinking in MapReduce) Design a MapReduce algorithm that accomplishes the following task: given an unordered collection of two kinds of records, the algorithm will join (combine) record pairs from the collection. In practice, if you need to join a lot of data on Hadoop, you would typically use higher level tools like Hive and Pig, instead of writing code to perform the joins yourself. Learning how to write the code here will help you gain deeper understanding of the innerworking of the join operations, and will help you decide what kinds of joins to use under different situations.
We highly recommend that you read this excellent article about joins using MapReduce, which will give you some hints to correctly complete this question.
NOTE: You only need to submit pseudo code, a brief explanation of your algorithm, and the trace of input and output of your map and reduce functions for the example given below. No coding is required.
Input of your algorithm:
Student, Alice, 1234 Student, Bob, 1234 Department, 1123, CSE Department, 1234, CS Student, Carol, 1123
7 Version 1

The input is an unordered collection of records of two types: Student and Department . The Student record is of the form <Student, Name, Department_ID> The Department record is of the form <Department, Department_ID, Department_Name> Output of your algorithm:
1123, Carol, CSE 1234, Bob, CS 1234, Alice, CS
Your algorithm will join a department record and a student record if they have the same Department_ID. Each output record is of the form <Department_ID, Name, Department_Name> . For example, Joe’s student record Student, Carol, 1123 should be joined with Department, 1123, CSE , producing the output record 1123, Carol, CSE . Notes:
1. The number of output records should be the same as the number of students. We assume each student appears exactly once in the input data.
2. The output records should be sorted in ascending order of Department_ID. It is not necessary to perform any secondary sort (e.g., no need to further sort the records by name).
3. Note that we want student name (e.g., Alice) to always precede department name (e.g., CS) in each output record. (Does a reduce function typically guarantee its input data be sorted?)
4. You can assume that there is enough RAM to store all the students belonging to a department. Explain your algorithm by using the above example data and tracing the input and output of your map and reduce functions. That is, given the above records as the input, describe and explain the input and output of your map and reduce function(s). Write down your answers in the same description.pdf. You are welcome to explain your answers using a combination of text and images. Deliverables
1. [5 pts] Your Maven project directory including Q1.java. Please see detailed submission guide at the end of this document. You should implement your own MapReduce procedure and should not import external graph processing library.
2. [2 pts] q1output1.tsv: the output file of processing graph1.tsv by run1.sh.
3. [3 pts] q1output2.tsv: the output file of processing graph2.tsv by run2.sh.
4. [15 pts] description.pdf: Answers for parts a and b. Your answers should be written in 12pt
font with at least 1” margin on all sides. Your pdf must not exceed 2 pages.
8 Version 1

Q2 [25 pts] Analyzing a Large Graph with Spark/Scala
Tutorial: First, go over this Spark word count tutorial to get more background about Spark/Scala.
Goal Your task is to calculate the gross accumulated node weights for each node in graph1.tsv and graph2.tsv from edge weights using Spark and Scala. Assume the graph to be a representation of a network flow where each edge represents the number of items flowing from source to target. The gross accumulated node weight for a node is now defined as the number of items produced/consumed by the node, and can be evaluated using the following formula:
(all incoming edge weights) (all outgoing edge weights)∑
− ∑
You should perform this task using the DataFrame API in Spark. Here is a guide that will help you get started on working with data frames in Spark. Load your input data into a data frame by inferring the schema using reflection (Refer to the guide above). Filter out (ignore) all edges whose edge weights are less than 5, i.e., only consider edges whose edge weights are equal to or greater than 5. Then use other DataFrame operations to calculate the gross accumulated node weight for each node. You may find some of the following DataFrame operations helpful: toDF, filter, join, select, groupBy Note: You must use only DataFrame operations for this task. You will lose points if you use SQL queries. Consider the following example: Input: src tgt weight 1 2 40 2 3 100 1 3 60 3 4 1
3 1 10
Output: 1 -90 = (10) - (40 + 60) 2 -60 = (40) - (100) 3 150 = (100 + 60) - (10) Notice here that the edge from 3 to 4 is ignored since its weight is less than 5.
9 Version 1

Your Scala program should handle the same two arguments as in Question 1 for input and output from the console, and should generate the same formatted output file on the supplied output directory (tab-separated-file). Please note that the default Spark saveastextfile method uses a saving format that is different from Hadoop’s, so you need to format the result before saving to file (Tip: use map and mkString). The result doesn’t need to be sorted. Deliverables
1. [10 pts] Your Maven project directory including Q2.scala. Please see the detailed submission guide at the end of this document. You may not use any external graph processing libraries.
2. [4 pts] q2output1.tsv: the output file of processing graph1 by run1.sh.
3. [6 pts] q2output2.tsv: the output file of processing graph2 by run2.sh.
4. [5 pts] description.txt: describe your approach and refer to line numbers in your code to explain how you’re performing each step in no more than 150 words.
10 Version 1

Q3 [35 pts] Analyzing Large Amount of Data with Pig on AWS You will try out Apache Pig for processing n-gram data on Amazon Web Services (AWS). This is a fairly simple task, and in practice you may be able to tackle this using commodity computers (e.g., consumer-grade laptops or desktops). However, we would like you to use this exercise to learn and solve it using distributed computing on Amazon EC2, and gain experience (very helpful for your future career in research or industry), so you are prepared to tackle the more complex problems. The services you will primarily be using are Amazon S3 storage, Amazon Elastic Cloud Computing (EC2) virtual servers in the cloud, and Amazon Elastic MapReduce (EMR) managed Hadoop framework. For this question, you will only use up a very small fraction of your $100 credit. AWS allows you to use up to 20 instances in total (that means 1 master instance and up to 19 core instances) without filling out a “limit request form”. For this assignment, you should not exceed this quota of 20 instances. Refer to details about instance types, their specs, and pricing. In the future, for larger jobs, you may want to use AWS’s pricing calculator. AWS Guidelines Please read the AWS Setup Guidelines provided to set up your AWS account. Datasets In this question, you will use subsets of the Google books n-grams dataset (full dataset for reference), on which you will perform some analysis. An ‘n-gram’ is a phrase with n words; the full n-gram dataset lists n-grams present in the books on books.google.com along with some statistics. You will perform your analysis on two custom datasets, extracted from the Google books bigrams (2-grams), that we have prepared for you: a small one s3://cse6242-2017fall-aws-small (~1GB) and a large one s3://cse6242-2017fall-aws-big (~130GB). VERY IMPORTANT: Both the datasets are in the US East (N. Virginia) region. Using machines in other regions for computation would incur data transfer charges. Hence, set your region to US East (N. Virginia) in the beginning (not Oregon, which is the default). This is extremely important otherwise your code may not work and you may be charged extra. The files in these two S3 buckets are stored in a tab (‘\t’) separated format. Each line is in the following format: n-gram TAB year TAB occurrences TAB books NEWLINE
11 Version 1

Some example lines: I am 1936 342 90 I am 1945 211 25 I am 1951 47 12 very cool 1923 118 10 very cool 1980 320 100 very cool 2012 994 302
very cool 2017 1820 612
The above lines tell us that, in 1936, the bigram “I am” appeared 342 times in 90 different books. In 1945, “I am” appeared 211 times in 25 different books. And so on. Goal Output the 10 bigrams having the highest average number of appearances per book along with their corresponding averages, in tab-separated format, sorted in descending order. Only consider entries with at least 200 occurrences and at least 10 books. If multiple bigrams have the same average, order them alphabetically. For the example above, the output will be: I am 4.80 very cool 3.09
Refer to the calculations given below I am (342 + 211) / (90 + 25) = 4.80 very cool (320 + 994 + 1820) / (100 + 302 + 612) = 3.09
Sample Output To help you evaluate the correctness of your output, we have uploaded the output for the small dataset on T-Square. Using PIG (Read these instructions carefully) There are two ways to debug PIG on AWS (all instructions are in the AWS Setup Guidelines):
1. Use the interactive PIG shell provided by EMR to perform this task from the command line (grunt). Refer to Section 8: Debugging in the AWS Setup Guidelines for a detailed step-by-step procedure. You should use this method if you are using PIG for the first time as it is easier to debug your code. However, as you need to have a persistent ssh connection to your cluster until your task is complete, this is suitable only for the smaller dataset.
2. Upload a PIG script with all the commands which computes and direct the output from the
command line into a separate file. Once you verify the output on the smaller dataset, use this method for the larger dataset. You don’t have to ssh or stay logged into your account. You can start your EMR job, and come back after a few hours when the job is complete!
12 Version 1

Note: In summary, verify the output for the smaller dataset with Method 1 and submit the results for the bigger dataset using Method 2. Sample Commands: Load data in PIG To load the data from the s3://cse6242-2017fall-aws-small bucket into a PIG table, you can use the following command: grunt> bigrams = LOAD ‘s3://cse6242-2017fall-aws-small/*’ AS (bigram:chararray, year:int, occurrences:int, books:int);
Note:
● Refer to other commands such as LOAD, USING PigStorage, FILTER, GROUP, ORDER BY, FOREACH, GENERATE, LIMIT, STORE, etc.
● Copying the above commands directly from the PDF and pasting on console/script file may lead to script failures due to the stray characters and spaces from the PDF file.
● Your script will fail if your output directory already exists. For instance, if you run a job with the output folder as s3://cse6242-<gt-username>/output-small, the next job which you run with the same output folder will fail. Hence, please use a different folder for the output for every run.
● You might also want to change the input data type for occurrences and books to handle floating point values.
● While working with the interactive shell (or otherwise), you should first test on a small subset of the data instead of the whole data (the whole data is over one hundred GB). Once you believe your PIG commands are working as desired, you can use them on the complete data and … wait ... since it will take some time.
Deliverables:
● pig-script.txt: The PIG script for the question (using the larger data set). ● pig-output.txt: Output (tab-separated) (using the larger data set).
Note: Please strictly follow the formatting requirements as we would be using an autograder.
13 Version 1

Q4 [35 pts] Analyzing a Large Graph using Hadoop on Microsoft Azure VERY IMPORTANT: Use Firefox or Chrome in incognito/private browsing mode when configuring anything related to Azure (e.g., when using Azure portal), to prevent issues due to browser caches. Safari sometimes loses connections.
Goal Your task is to write a MapReduce program to compute the distribution of a graph’s node degree differences (see example below). Note that this question shares some similarities with Question 1 (e.g., both are analyzing graphs). Question 1 can be completed using your own computer. This question is to be completed using Azure. We recommend that you first complete Question 1. You will use data files small.tsv (~75MB) and large.tsv (~3GB), for this question. Each file stores a 4 5
list of edges as tab-separated-values. Each line represents a single edge consisting of two columns: (Source, Target), each of which is separated by a tab. Node IDs are positive integers and the rows are already sorted by Source. Source Target
1 2 2 1 2 3 3 2 4 2 4 3 Your code should accept two arguments upon running. The first argument (args[0]) will be a path for the input graph file, and the second argument (args[1]) will be a path for output directory. The default output mechanism of Hadoop will create multiple files on the output directory such as part-00000, part-00001, which will have to be merged and downloaded to a local directory. The format of the output should be as follows. Each line of your output is of the format diff count where (1) diff is the difference between a node’s out-degree and in-degree (out-degree - in-degree); and (2) count is the number of nodes that have the value of difference (specified in 1). The out-degree of a node is the number of edges where that node is the Source. The in-degree of a node is the number of edges where that node is the Target. diff and count must be separated by a tab (\t), and lines do not have to be sorted. The following result is computed based on the toy graph above.
4 subset of LiveJournal data 5 subset of Friendster data
14 Version 1
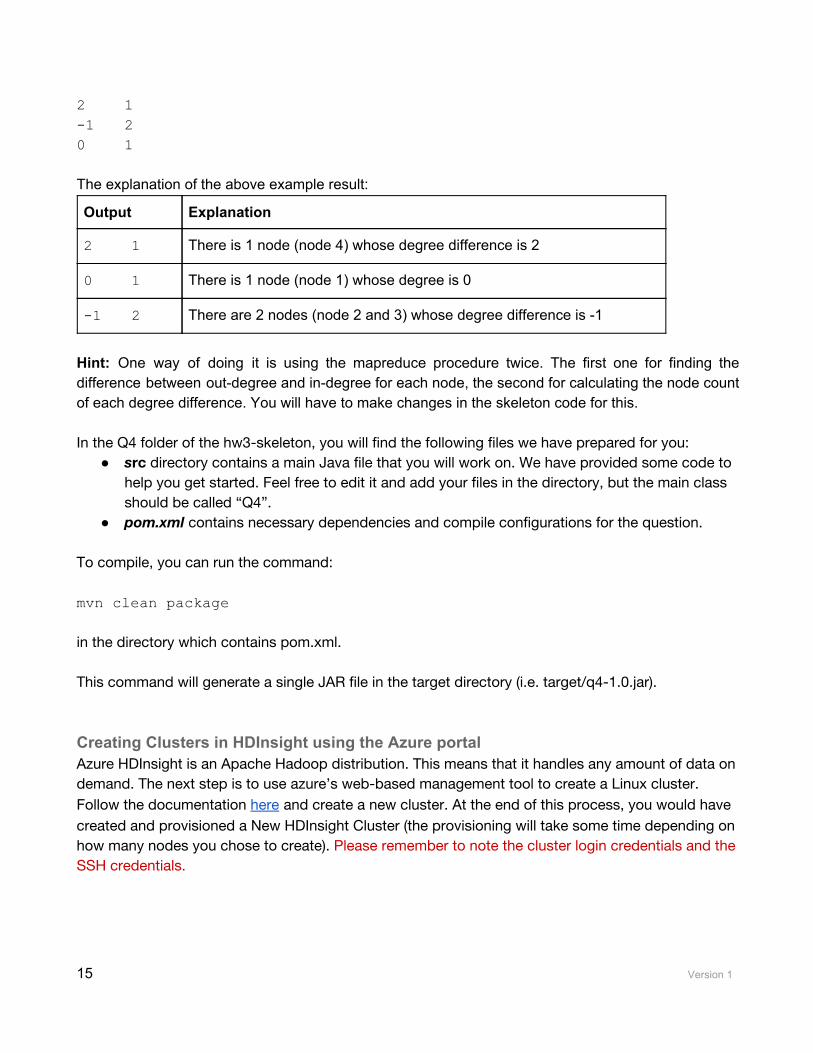
2 1
-1 2
0 1
The explanation of the above example result:
Output Explanation
2 1 There is 1 node (node 4) whose degree difference is 2
0 1 There is 1 node (node 1) whose degree is 0
-1 2 There are 2 nodes (node 2 and 3) whose degree difference is -1
Hint: One way of doing it is using the mapreduce procedure twice. The first one for finding the difference between out-degree and in-degree for each node, the second for calculating the node count of each degree difference. You will have to make changes in the skeleton code for this. In the Q4 folder of the hw3-skeleton, you will find the following files we have prepared for you:
● src directory contains a main Java file that you will work on. We have provided some code to help you get started. Feel free to edit it and add your files in the directory, but the main class should be called “Q4”.
● pom.xml contains necessary dependencies and compile configurations for the question. To compile, you can run the command: mvn clean package
in the directory which contains pom.xml. This command will generate a single JAR file in the target directory (i.e. target/q4-1.0.jar). Creating Clusters in HDInsight using the Azure portal Azure HDInsight is an Apache Hadoop distribution. This means that it handles any amount of data on demand. The next step is to use azure’s web-based management tool to create a Linux cluster. Follow the documentation here and create a new cluster. At the end of this process, you would have created and provisioned a New HDInsight Cluster (the provisioning will take some time depending on how many nodes you chose to create). Please remember to note the cluster login credentials and the SSH credentials.
15 Version 1
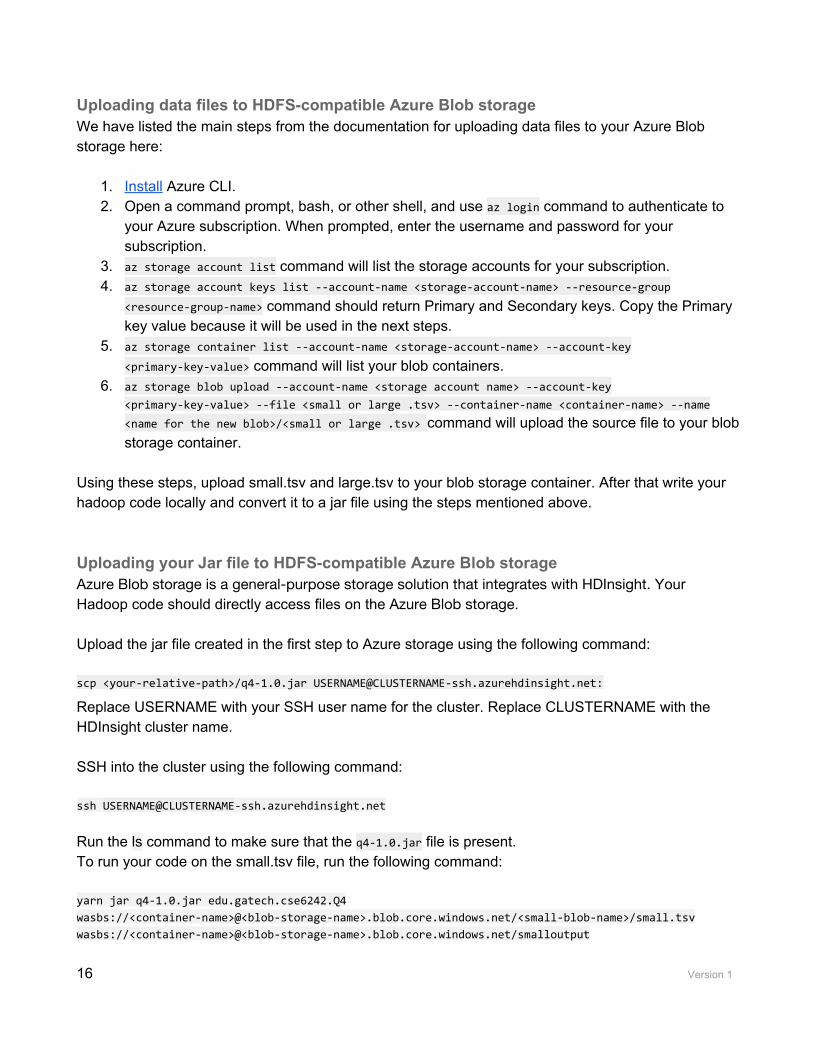
Uploading data files to HDFS-compatible Azure Blob storage We have listed the main steps from the documentation for uploading data files to your Azure Blob storage here:
1. Install Azure CLI. 2. Open a command prompt, bash, or other shell, and use az login command to authenticate to
your Azure subscription. When prompted, enter the username and password for your subscription.
3. az storage account list command will list the storage accounts for your subscription. 4. az storage account keys list --account-name <storage-account-name> --resource-group
<resource-group-name> command should return Primary and Secondary keys. Copy the Primary key value because it will be used in the next steps.
5. az storage container list --account-name <storage-account-name> --account-key
<primary-key-value> command will list your blob containers. 6. az storage blob upload --account-name <storage account name> --account-key
<primary-key-value> --file <small or large .tsv> --container-name <container-name> --name <name for the new blob>/<small or large .tsv> command will upload the source file to your blob storage container.
Using these steps, upload small.tsv and large.tsv to your blob storage container. After that write your hadoop code locally and convert it to a jar file using the steps mentioned above. Uploading your Jar file to HDFS-compatible Azure Blob storage Azure Blob storage is a general-purpose storage solution that integrates with HDInsight. Your Hadoop code should directly access files on the Azure Blob storage. Upload the jar file created in the first step to Azure storage using the following command: scp <your-relative-path>/q4-1.0.jar [email protected]:
Replace USERNAME with your SSH user name for the cluster. Replace CLUSTERNAME with the HDInsight cluster name. SSH into the cluster using the following command: ssh [email protected]
Run the ls command to make sure that the q4-1.0.jar file is present. To run your code on the small.tsv file, run the following command: yarn jar q4-1.0.jar edu.gatech.cse6242.Q4 wasbs://<container-name>@<blob-storage-name>.blob.core.windows.net/<small-blob-name>/small.tsv
wasbs://<container-name>@<blob-storage-name>.blob.core.windows.net/smalloutput
16 Version 1

Command format: yarn jar jarFile packageName.ClassName dataFileLocation outputDirLocation
The output will be located in the wasbs://<container-name>@<blob-storage-name>.blob.core.windows.net/smalloutput. If there are multiple output files, merge the files in this directory using the following command: hdfs dfs -cat wasbs://<container-name>@<blob-storage-name>.blob.core.windows.net/smalloutput/* > small.out
Command format: hdfs dfs -cat location/* >outputFile
Download the merged file to the local machine (this can be done either from https://portal.azure.com/ or by using the scp command from the local machine). Here is the scp command for downloading this output file to your local machine: scp <username>@<cluster-name>-ssh.azurehdinsight.net:/home/<username>/small.out .
Using the above command from your local machine will download the small.out file into the current directory. Repeat this process for large.tsv.
Deliverables
1. [15pt] Q4.java & q4-1.0.jar: Your java code and converted jar file. You should implement your own map/reduce procedure and should not import external graph processing library.
2. [10pt] small.out: the output file generated after processing small.tsv.
3. [10pt] large.out: the output file generated after processing large.tsv.
17 Version 1

Q5 [10 pts] Regression: Automobile price prediction, using Azure ML Studio Note: Create and use a free workspace instance at https://studio.azureml.net/ instead of your Azure credit for this question.
Goal This question’s main purpose is to introduce you to Microsoft Azure Machine Learning Studio and familiarize you with its basic functionality and typical machine learning workflow. Go through the “Automobile price prediction” tutorial and complete the tasks below.
1. [3pts] Repeat the experiment mentioned in the tutorial and report the values of the metrics as mentioned in the ‘Evaluate Model’ section of the tutorial.
2. [3pts] Repeat the same experiment, change the ‘Fraction of rows in the first output’ value in the split module to 0.9 (originally set to 0.75) and report the corresponding values of the metrics.
3. [4pts] After changing the split value back to 0.75, experiment with different features or other Regression Models in the given tutorial and report the results along with the justification for the results in no more than 50 words (i.e., try and explain why the results have changed).
Optional reading: note that the above tutorial does NOT cover how to use cross validation to evaluate models. To learn how to perform cross validation in Azure ML studio, please read the “How to evaluate model performance in Azure Machine Learning“ tutorial.
Deliverables
1. [6pt] results.txt: a text file containing results for all the three parts. 2. [4pt] explanation.txt: a text file containing explanation for third part.
18 Version 1

Submission Guideline Submit the deliverables as a single zip file named HW3-Lastname-Firstname.zip. Specify the name(s) of any students you have collaborated with on this assignment, using the text box on the T-Square submission page. The directory structure of the zip file should be exactly as below (the unzipped file should look like this): HW3-Smith-John/ Q1/ src/main/java/edu/gatech/cse6242/Q1.java description.pdf pom.xml run1.sh run2.sh q1output1.tsv q1output2.tsv (do not attach target directory) Q2/ src/main/scala/edu/gatech/cse6242/Q2.scala description.txt pom.xml run1.sh run2.sh q2output1.tsv q2output2.tsv (do not attach target directory) Q3/ pig-script.txt pig-output.txt Q4/
src/main/java/edu/gatech/cse6242/Q4.java pom.xml q4-1.0.jar (from target directory) small.out large.out
(do not attach target directory) Q5/ results.txt explanation.txt
19 Version 1