cry wolf - chemsecchemsec.org/.../2016/03/chemsec_cry-wolf_150701.pdf · one reason is obviously...
TRANSCRIPT

CRY WOLFPredicted costs by industry
in the face of new environmental regulations

contentIntroduction 3
Summary 4
LESSONS FROM THE PAST
1. Was saving the ozone layer cost-effective? 6
2. What did laws to cut air pollutant emissions cost? 8
3. Costs and benefits of green legislation in the United States 14
4. Do pesticide regulations cause yield and financial loss to farmers? 16
5. Can chemical companies afford to test their product’s safety? 20
6. Can electronic devises be manufactured with less toxic chemicals? 24
Who is crying wolf? 27
Conclusions 30
We would like to thank the European Environment and Health Initiative for their support.

654321
Few would argue against the need for major transitions towards a less polluting and more resource-efficient society. Environmental regulations play an important role in this. However, one question causing intense debate is industry’s ability to adapt to stricter regulations. There is a widely held percep-tion among politicians that regulation could damage business if “too much green tape” is imposed on companies. Therefore, a common belief is that legal require ments need to be moderate and implemented over long time spans, that laws must be harmonis-ed with other regions – and ultimately globally – to avoid industry moving production and jobs to areas where regulation is minimal.
how true is this, really? A study made for the European Commission in 2007 examined the costs of environmental policy for some of the manu facturing sectors most affected.1 From a broad survey among industry throughout the EU, the main conclusions were:
interestingly, the survey Found that the percep-tions of the industry representatives interviewed were quite different from the empirical results. The compa-nies thought that their environmental costs were much
higher than they actually were. So why is it that “green tape” is generally regarded as negative to industry?
One reason is obviously that some parts of industry feel threatened by proposed restrictions, and use a battery of tactics to communicate this message. One of them is to “show” how costly – even devastating – a certain law would be, based on a more or less flawed or unrealistic calculation of direct and indirect costs.
this report describes some of the exaggerations through historical examples, and what the actual out-come was. From this, we examine some of the ongoing political debates, and find many similarities.
The first edition of this report was published in 2004, in the midst of the debate leading up to the new EU chemicals regulation REACH, which was adopted in 2006. Many of the examples originated from a report published by the Stockholm Environmental Institute.2 That edition has now been thoroughly revised and more recent data and examples of industry estimates have been added.
So, let’s look at some well known health and environ-mental problems, political initiatives to solve them, and the industry’s responses to this.
IntRoDUctIon
environmental policy accounts for a relatively low percentage of costs for the different sectors. statistical data indicates that annualised environmental costs in the four sectors studies are typically less than two percent of production value.
environmental policy seems to account for broadly similar levels of costs for firms operating in the eu, australia and the united states.
there is no evidence that environmental policy has a material effect on the competitiveness of europe’s manufacturing sectors or leads to relocation.
the costs of environmental policy since the 1990s vary between the studied sectors, but generally tend to fall, except for refineries, where environmental costs show an increasing trend.
during this period there has been a marked improvement in environmental performance. one would expect a higher unit cost to reduce the more costly emissions. however, innovation and the shift from endofpipe towards integrated investments could be viewed as important factors stabilising the unit costs of environmental protection.
there seem to be synergies between different policies, meaning that the cumulative costs of environmental policy are less than the costs would be for individual policies with no integrated measures by businesses.
C RY WOLF I NTRODUCTION 3
1. Sectoral Costs of Envi-ronmental Policy, Study accomplished under the authority of the European Commission, DG Environ-ment, 2007/IMS/R/427.
2. Costs and strategies presented by industry during the negotiation of environmental regulations, Stockholm Environment Institute (SEI), 1999.
note: Sectors researched were; oil, textile, power generation and metal.

sUmmaRyContrary to common belief among decision makers, scientific research shows that environmental policy measures only give rise to marginal costs for industry. And these industry costs are on a similar level in various OECD regions, e.g. the United States and Europe. In addition, the cost for industry to adapt to environmental policies has decreased since the 1990s. Overall, industry has managed to adjust its operations well, mainly through innovative technology and improved efficiency.
In spite of this, many trade organisations continue to systematically inflate cost estimates in order to combat new environmental regulations. Industry shouts that the wolf is coming, but it’s a false warning.
This report presents cost estimates for compliance with regulations commissioned and used by specific interest groups within industry, and compares them with actual costs after the laws have entered into force.
The reported cases show clearly that estimates from specific interest groups within industry generally overestimate anticipated compliance costs and underestimate innovation potential. Three methodological problems can be mentioned:
• The use of estimate models that are too static and limiting• Ignorance of synergy effects and industry’s ability to innovate• Underestimation of beneficial effects to industry
This report reinforces that political decision makers should approach the costs presented by industry with caution, as in the past it has tended to overestimate the costs of compliance and underestimate the potential for the development of new technologies.
4 C RY WOLF SUMMARY
C RY WOLF SUMMARY 5
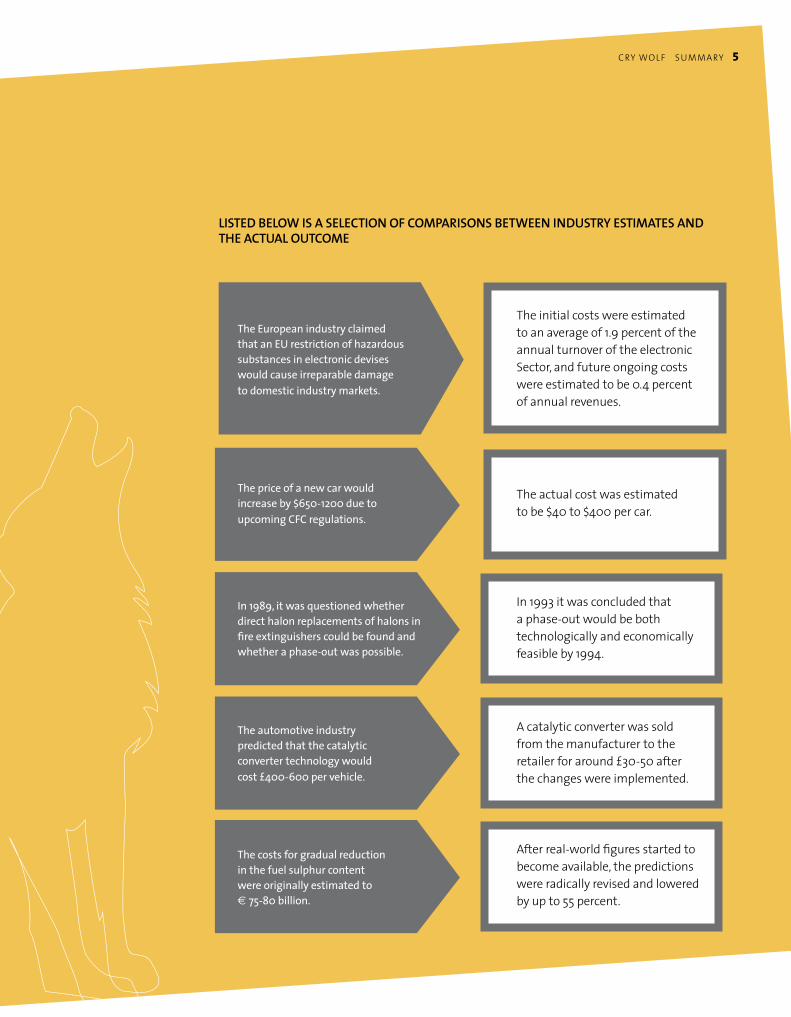
listed below is a selection oF comparisons between industry estimates and the actual outcome
The initial costs were estimated to an aver age of 1.9 percent of the annual turnover of the electronic Sector, and future ongoing costs were estimated to be 0.4 percent of annual revenues.
The European industry claimed that an EU restriction of hazardous substances in electronic devises would cause irreparable damage to domestic industry markets.
The price of a new car would increase by $6501200 due to upcoming CFC regulations.
The actual cost was estimated to be $40 to $400 per car.
In 1989, it was questioned whether direct halon replacements of halons in fire extinguishers could be found and whether a phaseout was possible.
In 1993 it was concluded that a phase-out would be both technologically and economically feasible by 1994.
The automotive industry predicted that the catalytic converter technology would cost £400600 per vehicle.
A catalytic converter was sold from the manufacturer to the retailer for around £30-50 after the changes were imple mented.
The costs for gradual reduction in the fuel sulphur content were originally estimated to € 7580 billion.
After real-world figures started to become available, the predictions were radically revised and lowered by up to 55 percent.

lesson 1
Was savIng the ozone layeR cost-effectIve?Legal context: the montreal Protocol under the vienna convention
beForeIn the late 1970s, the chemical industry viciously opposed any ODS regulation. The main arguments were that there was no scientific basis for regulation and that costs were too high. No cost estimates were presented. Instead industry pointed to the great significance to the world economy of the production of ODSs.
While evidence of environmental harm was mounting, industry continued op pos ing regulation throughout the 1980s on economic grounds. The European Chemicals Industry Associa
tion (Cefic) claimed that a phaseout would cause ”very large” costs leading to ”redesign and reequipping of large sectors of vital industry..., smaller firms going out of business... and an effect on inflation and employment nationally and internationally”.3
The economic significance of CFCs and other ODSs was initially enhanced by the claim that there were no alternatives and that none would ”become available in the foreseeable future”.
OzoneDepleting Substances (ODSs) are chemicals that can survive long enough to reach the stratosphere where they undergo reactions that break down ozone, thus reducing the ozone layer that protects the Earth’s bio sphere from harmful UV radiation.

The weight of evidence for the negative effects of ODSs on the ozone layer, grew steadily in the 1970s and 1980s. Under the auspices of the United Nations the global community agreed to adopt the Vienna Convention in 1985, and laid down provisions for phas ing out the production and use of ODSs through the Montreal Protocol in 1987. The use of ODSs was reduced as a direct result of the agreement. Without these legally bind ing decisions, it is estimat ed that the thickness of the ozone layer would have been re-duced to about one third of its pre-industrial size by 2065, with highly damaging effects for humans and many other organisms.
A study carried out for the European Commission in 2006 found that the cost for substitution of ODSs – when measured on a macroeconomic level – was 30 percent lower than predicted. In some cases the actual cost became as low as one fortieth of the pre-dicted cost.4
avoidance oF damageThe incidence of skin cancers in response to increased UV radiation is expected to peak about 60 years af-ter exposure. UNEP has estimated that more than 20
million cases of skin cancer and 130 million cataract cases have been prevented globally as a result of the Montreal Protocol and subsequent agreements.5
In addition, since many ODSs are effective green-house gases, the avoided impacts on climate change are also substantial. The combined greenhouse effect of ODSs in 1990 was about 33 percent of the annual carbon dioxide (CO2) emissions from fossil fuels. If – in the absence of a Montreal Protocol – an increase of three percent annually is assumed in ODS and halocarbon production, the 2010 emissions would have amounted to 14 million tons of CO2-equivalents. In other words, the Montreal Protocol has reduced emissions by about 215 million tons of CO2-equivalent over 20 years! 6
Supposing that ODSs had not been regulated sepa-rately, but were also counted under the Kyoto Proto-col, then the scenario would have been very different. These emissions, which stem mainly from developed countries, should have been offset and could have represented a cost to society of about € 2.150 bil-lion7 or about 0.5 percent of annual GDP of the OECD count ries over these two decades.
In 1993 car manufacturers estimated that the price of a new car would increase by $650-1200 due to upcoming CFC regulations, as CFCs were used in air conditioning installations. In 1997 the actual cost was estimated to be $40 to $400 per car.
Halons are substances found in fire extinguishers that de-stroy the ozone layer faster than CFCs. In 1989, members of the United nations envi-ronment Program’s Halons Technical options Commit-tee disagreed on whether direct halon replacements could be found and whether a phase-out was possible. However, in 1993 the com-mittee concluded that a phase-out of halons would be both technologically and economically feasible by 1994.
aFterAs early as 1995, the Technology and Eco-nomic Assessment Panel of the Montreal Protocol concluded that virtually all of the global reduction in CFC use had come at little or no cost to consumers and that ”par-ticular examples of successful changeovers from ozone-depleting technologies are now too numerous to mention individually”. In conclusion, the ODS phase out has hardly affected industry negatively at all. There are even numerous examples where ”the sub-stitute technologies have saved money and improved quality over the CFC technologies they replaced”.
In 1988, reducing CFC production by 50 per-cent within 10 years was estimated by the US EPA to cost $3.55 per kilogram. By 1993, the goal had become much more ambitious: complete elimination of CFC production, with the deadline moved up two years, to 1996. Nevertheless, the estimated cost of compliance fell more than 30 percent, to $2.45 per kilogram. And where substitutes for certain CFCs had not been expected to be available for eight or nine years, industry was able to identify and adopt substitutes in as little as two years.
C RY WOLF LESSON 1 7
3. Costs and strategies presented by industry during the negotiation of environmental regulations, Stockholm Environment Institute, Stockholm, Sweden, 1999
4. Ex-post estimates of costs to business of EU environmental policies: A case study looking at Ozone Depleting Substances, Policy Studies Institute (2006)
5. Assuming prevention of a 48 % decrease in the ozone layer by 2050,6. Andersen & Clubb; Understanding and accounting for the costs of inaction, in; Late Lessons from Early Warnings; science,
precaution, innovation, European Environmental Agency, 1/20137. Assuming a price of EUR 10 per tCO2-equivalent
lesson 2
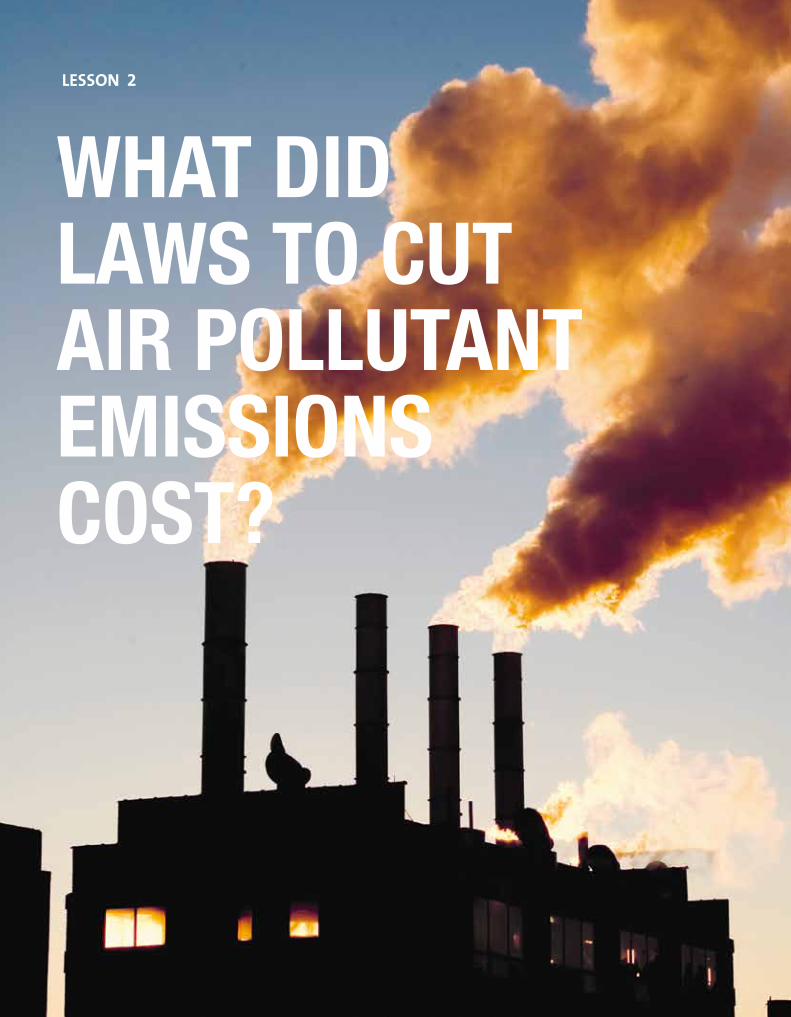
What DID laWs to cUt aIR PollUtant emIssIons cost?

In the early 1980s, emissions from road transport contributed a major share of these pollutants. The European Community started a process in the 1980s to curb emissions through more stringent fuel and emission standards for motor vehicles. Following the example of the United States, it proposed to in-troduce emission standards that would require the
application of catalytic converters on new petrol-fuelled cars. The operation of this emission control technology would in turn require lead-free petrol. In spite of strong opposition from the car industry, these requirements were introduced gradually for all new petrol cars through EU acts adopted in 1991 and 1994.
What DID laWs to cUt aIR PollUtant emIssIons cost?
aFterA catalytic converter was sold from the ma-nufacturer to the retailer for around £30–50 after the changes were implemented. There were other costs involved that are not readily available. Overall, however, car prices did not change suddenly or markedly when the direc-tives came into force.
The emission standards led to smaller, cheaper cars being equipped with more sophisticated engines and fuel management technologies, which in turn led to improved fuel efficiency in spite of the supposed fuel consumption penal-ty of the requirements.
bEFOrEThe automotive industry predicted that the catalytic converter technology would cost £400 – 600 per vehicle with a fuel consumption penalty on top.
Emissions of sulphur and nitrogen oxides harm human health and the environment. There are strong links between morbidity and mortality and exposure to air pollutants.8 Through eutrophi-cation and acidification these air pollutants also cause large-scale damage to ecosystems and biodiversity.
C RY WOLF LESSON 2 9
Later studies have shown substantial health bene-fits resulting from compliance with vehicle emission
standards, far in excess of the predicted costs.
8. Smith, et. al.; 2009, ’Public health benefits of strategies to reduce greenhouse-gas emissions: Health implications of short-lived greenhouse pollutants’, The Lancet, (374/9 707) 2 091–2 103.
Legal context: ec Directive on vehicle emissions standards (91/441/eec)
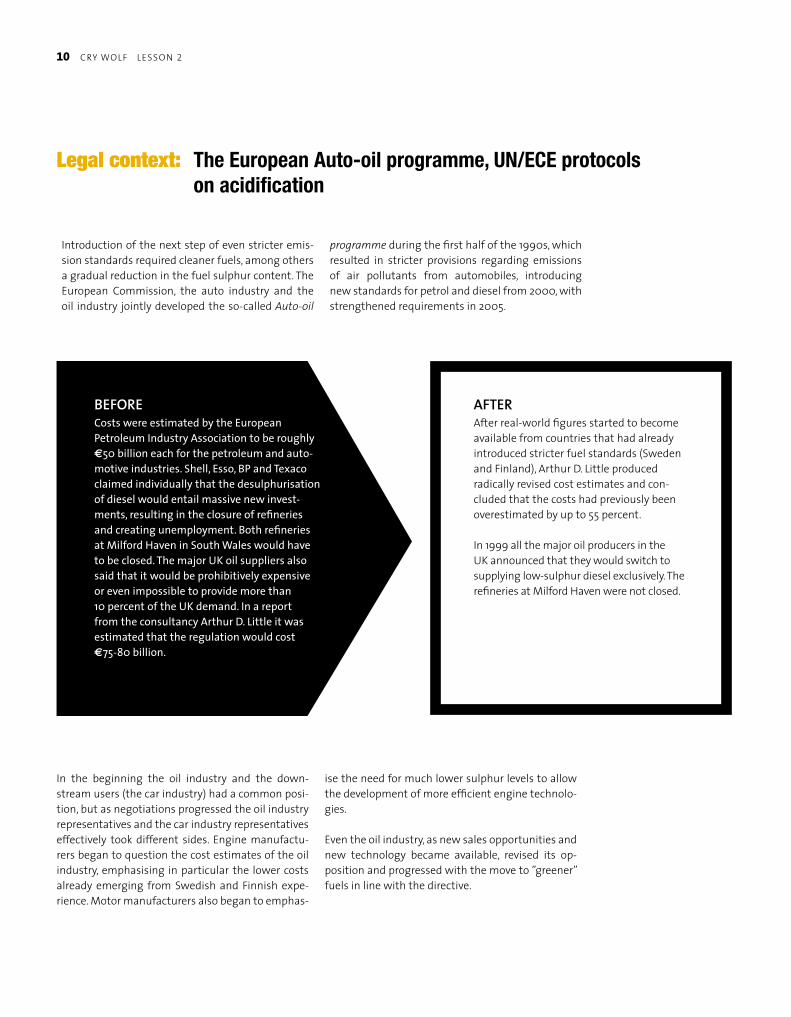
Legal context: the european auto-oil programme, Un/ece protocols on acidification
Introduction of the next step of even stricter emis-sion standards required cleaner fuels, among others a gradual reduction in the fuel sulphur content. The European Commission, the auto industry and the oil industry jointly develop ed the so-called Auto-oil
programme during the first half of the 1990s, which resulted in stricter provisions regarding emissions of air pollutants from automobiles, introducing new standards for petrol and diesel from 2000, with strengthened requirements in 2005.
aFterAfter real-world figures started to become available from countries that had already introduced stricter fuel stand ards (Sweden and Finland), Arthur D. Little produced radically revised cost estimates and con-cluded that the costs had previously been overestimated by up to 55 percent.
In 1999 all the major oil producers in the UK announced that they would switch to supplying low-sulphur diesel exclusively. The refineries at Milford Haven were not closed.
beForeCosts were estimated by the European Petroleum Industry Association to be roughly €50 billion each for the petroleum and automotive industries. Shell, Esso, bP and Texaco claimed individually that the desulphurisation of diesel would entail massive new investments, resulting in the closure of refineries and creating un employment. both refineries at Milford Haven in South Wales would have to be closed. The major UK oil suppliers also said that it would be prohibitively expensive or even impossible to provide more than 10 percent of the UK demand. In a report from the consultancy Arthur D. Little it was estimated that the regulation would cost €7580 billion.
In the beginning the oil industry and the down-stream users (the car industry) had a common posi-tion, but as negotiations progressed the oil industry representatives and the car industry representatives effectively took different sides. Engine manufactu-rers began to question the cost estimates of the oil industry, emphasising in particular the lower costs already emerging from Swedish and Finnish expe-rience. Motor manufacturers also began to emphas-
ise the need for much lower sulphur levels to allow the development of more efficient engine technolo-gies.
Even the oil industry, as new sales opportunities and new technology became available, revised its op-position and progressed with the move to ”greener” fuels in line with the directive.
10 C RY WOLF LESSON 2

Legal context: the ec Directive on air pollutant emissions from large combustion plant (88/609/eec)
aFterThe sulphur and nitrogen oxides reduction targets set in the 1988 Directive had no sig-nificant impact on the costs of generating electricity or on consumer prices.
Pre-regulation warnings from industry proved to be way off the mark, the real costs were nowhere near the factor of two over the UBA estimates. Instead, the cost figures from UBA were con sidered to provide a reasonably good indication of the resulting real costs.
beForeSome governments and industries opposed the 1983 proposal by the European Commission to regulate sulphur and nitrogen oxides emissions from large power plants. The General Electricity Generating board in the United Kingdom predicted for instance that the regulation would ”increase the cost of electricity generated at the power stations by about 2530 percent”.
In Germany and the Netherlands there were similar claims. The German Power Plant Association (VDEW) warned that the costs would be twice as high as estimated by the German Environmental Agency UbA (Umweltbundesamt). Industry and trade unions also warned of loss of competitiveness for the energy sector and loss of jobs in the coalmining sector.
C RY WOLF LESSON 2 11

costs and beneFits oF curbing air pollution in europeLargely due to legislation introduced since the 1980s, emissions of sulphur dioxide (SO2) and nitrogen oxides (NOx) have gradually decreased in Europe and North America. (See figure.) In the beginning many industrialists were sceptical about the costs of the measures entailed. Some were even arguing that legislators handled a “million-dollar problem with a billion-dollar solution”.
In hindsight, it is clear that air pollution is definitely a billion-dollar problem. In a cost-benefit study com-missioned by the European Commission in 2005, the health costs of air pollution in the EU were esti-
mated to amount to between € 276 and 427 billion per year, equivalent to 3-5 percent of GDP. In some EU countries with less pollution control, the costs exceeded 20 percent of GDP. 9
How much of this cost can be avoided in the future? According to the same EU study, the ap plication of readily available and technically feasible air pollu-tion abatement measures would cut annual societal cost by about € 56-181 billion. This is equivalent to 0.6-2 percent of GDP in the European Union. Hence, appropriate controls will save society a substantial amount of money, while also protecting health and environmental values.
9. AEA Technology Environment: Damages per tonne emission of PM, NH3, SO2, NOx and VOCs from each EU25 state and surrounding seas, Service contract for carrying out cost benefit analysis for air quality related issues in particular the CAFE Programme (2005)
10. http://www.eea.europa.eu/data-and-maps/indicators/eea-32-sulphur-dioxide-so2-emissions-1/assessment-3#toc-1
Source: European Environmental Agency (EEA): Sulphur dioxide SO2 emissions (APE 001) – Assessment, Jan 2014.10
Chart – Emission trends of sulphur oxides
100
75
50
25
0
30000
25000
20000
15000
10000
500
Inde
x (E
U-28
199
0 =
100)
Emiss
ions
(kt)
12 C RY WOLF LESSON 2

C RY WOLF LESSON 2 13

lesson 3
costs anD benefIts of gReen legIslatIon In the UnIteD states

C RY WOLF LESSON 3 15
11. 2014 Draft Report to Congress on the Benefits and Costs of Federal Regulations and Unfunded Mandates on State, Local, and Tribal Entities; The White House Office of Information and Regulatory Affairs within the Office of Management and Budget (2014) http://www.whitehouse.gov/sites/default/files/omb/inforeg/2014_cb/draft_2014_cost_benefit_report-updated.pdf
12. Using USD value in 2001
According to a 2014 report to the US Congress from the White House11, benefits have greatly exceeded the costs for 34 major rules that were introduced by the US Environmental Protection Agency (EPA) from 2003 until 2013. The estimated annual costs of these were between $31.6 and 38.2 billion, while benefits ranged from $136.4 billion to 703.1 billion per year.12
For its proposed regulation to reduce greenhouse gas emissions from power plants, EPA has estimat-ed that in 2020, the proposal will yield climate benefits of $17-18 billion depending on its approach and between $15 billion and $40 billion in additional benefits from cutting down on ozone and particle pollution. Total compliance costs in 2020 would be $5.5-7.5 billion.
aggregated costs & benefits from all24 epa rules surveyed (billion $)
compliance cost benefits
34
400
To use cost as an important argument against environmental regulations is a world-wide phenomenon. But the full picture requires an acurate calculation also of the benefits. A recent US report shows that the benefits of environmental regulations introduced during the last decade can be measured in hundereds of billions of dollars.

lesson 4
Do PestIcIDe RegUlatIons caUse yIelD anD fInancIal losses foR faRmeRs?Legal context: national and international pesticide regulations

To reduce risks from pesticides – substances that are toxic by design – national and international regula-tions are among the strictest in relation to chemical control. Legal systems involve pre-market approval and registration procedures. Particularly toxic pesti-cides are prohibited from use in many countries, and severely limited in other countries. Because of the risks at stake, such laws are often precautionary in the sense of “better safe than sorry”. Alternative ways of managing crops, such as Integrated Pest Management (IPM) are also adopted, in order to reduce the need for pesticides in general. Directive 2009/12815 establishes a frame work for Community
action to achieve sustainable use of pesticides. The directive states that pesticid es should only be used as a last resort and not as a matter of course. Some of the alternatives mentioned are the use of crop rotation and that the pesticid es applied must be as specific as possible and have the least side effects.
The agro-industrial sector that produces and mar-kets pesticides to farmers is often very sceptical towards such precautionary legislation. It argues that pesticide bans and restrictions cause exces-sive costs to farmers and to society. Lobbying efforts often focus on predicted yield losses as a result of
The World Health Organisation (WHO) has estimated that in 2004, the unintentional acute and occupational poisonings from selected chemicals (including pesticides) caused a total of 964,000 deaths and almost 21 million DALYs13, equivalent to 1.6 per cent of the total deaths and 1.4 per cent of the total burden of disease worldwide.14
C RY WOLF LESSON 4 17
aFterAlmost no pesticides were banned as a result of the EC regulation 1107/200917. In contrast, the number of pesticides approved increased with 60 per cent, from 250 in 2010 to 400 in 2014.
beForeThe british Pesticide Industry estimated that 15 per cent of all pesticides would be banned or restricted as a result of EC regulation and that this would cause a 2030 per cent yield loss in cereals. This estimate was accepted by the UK government and referred to in official reports.16
13. DALY (Disability-Adjusted Life Year) is a measure of overall disease burden, expressed as the number of years lost due to ill-health, diability or early death
14. Cost of inaction on the sound management of chemicals, UNEP 2012
15. DIRECTIVE 2009/128/EC OF THE EUROPEAN PARLIAMENT AND OF THE COUNCIL of 21 October 2009, establishing a framework for Community action to achieve the sustainable use of pesticides
16. Assessment of the impact on crop protection in the UK of the ‘cut-off criteria’ and substitution provisions in the proposed Regula-tion of the European Parliament and of the Council Concerning, UK Pesticides Safety Directorate, May 2008
17. EC/1107/2009 Regulation concerning the placing of plant protection products on the market

lack of efficient pesticides. Industry arguments either criticise preventative approaches in general, or target specific proposals to ban certain pesticides.
Industry estimates hardly ever take into account the full range of possibilities for changing agricul-tural practices in response to a ban. A typical flaw in industry’s projections is to use a dishonest base line. Calculations are not based on IPM practices, but on intensive spraying regimes. Such regimes generally do not make use of crop rotation, do not use resist-ant crop varieties, wide planting distances, balanced fertilisation, nor do they make use of beneficial organisms or biological control. They use an extreme
and vulnerable system by suggesting they need a synthetic equivalent to the pesticide that is expect-ed to be banned.
The economy of IPM-based agriculture is difficult to assess. A report for the European Commission in 200218 indicated that it is possible to achieve similar levels of profitability using integrated crop manage ment techniques as a result of lower yields and hence revenue being balanced out by reduc-tions in production costs. A 2011 study19 showed that in France the use of pesticides can be reduced by 30 percent without impact on farm revenues.
18. Agra CEAS Consulting, Integrated Corp Management Systems in the EU, Amended Final Report for European Commission DG Environment, 2002
19. Florence Jacquet, Jean-Pierre Butault, Laurence Guichard, An economic analysis of the possibility of reducing pesticides in French field crops, Ecological Economics, Vol 70:9, 2011, pp 1638–1648
20. A Future Without Azoles?, Press release, BASF, 07.02.14
There is currently a debate regarding criteria for Endocrine-Disrupting Chemicals (EDC), which is centred around pesticide and biocide regulations in the EU. In light of this ongo-ing discussion it is interesting to see that the pesticide industry and its allies continu-ally use methods mentioned in this report, for example by presenting estimates based on the simple substitution of one chemical for another. In a recent estimate, the chemical company BASF predicts the effects of a with-
drawal of a pesticide group called azoles (the European Commission is considering a ban on these based on their endocrine-disrupting properties). ”The estimated total loss of wheat production which would be caused by the loss of azoles would be 6.8% representing a value of 157 million euro to the UK alone”.20 This claim does not appear to take into account the IPM principles and are therefore most likely exaggerated in an attempt to influence policy makers.
18 C RY WOLF LESSON 4

C RY WOLF LESSON 4 19

lesson 5
can chemIcal comPanIes affoRD to test theIR PRoDUct’s safety?
beForeIndustry fiercely rejected the proposed basic principle of “reversed burden of proof”. They claimed that making producers pay for tests etc. would cause enormous costs and destroy the competiveness of Europe’s chemicals industry.
The Federation of German Industries (bDI) commissioned the consultancy firm Arthur D. Little to study the economic consequences of the original White Paper and the subsequent draft proposal. In a similar study, the French Chemical Industry Association (UIC) and the French government jointly commissioned consultancy firm Mercer Management to estimate the impact the implementation of the White Paper would have on the French economy.
The Arthur D. Little study predicted job losses of up to 2.35 million and a 6.4 percent reduction in the GDP in Germany. A supplemental study for the internet review draft predicted the loss of 1.74 million jobs and a 4.7 percent reduction in the GDP21. The Mercer study predicted costs of € 2954 billion for French industry over a period of ten years, plus total job losses of up to 670,000 and up to 3.2 percent reduction in GDP per year. UIC and Mercer presented an additional study on the final proposal in April 2004. It predicted that rEACH would cost France € 28 billion over a period of ten years, or 1.6 percent of its GDP and cause 360,000 job losses.

Some 140,000 chemical substances are used in society. Some scientific studies suggest that up to 70 percent of all chemicals in use possess hazardous properties that should make them classified as hazardous, such as causing cancer. 22
21. Estimate was presented in a supplemental study for the Internet review draft proposal
22. Hansson and Rudén, ‘A Risk-Neutral Default for Chemical Risk Management’ (2008) 51 American Journal of Industrial Medicine pp 964-967
23. Centre for Strategy and Evaluation Services: Interim Evaluation: Functioning of the European chemical market after the intro-duction of REACH (2012)
Information about the hazardous properties is nec-essary in order to take appropriate precautions to protect human health and the environment. The problem has been the lack of data. Legislation is lag-ging behind; general industrial chemicals have not been subject to any provisions that require testing before they are marketed and used. In the late 1980s, the European governments collectively called on the European Commission to propose a system whereby produc ers and importers were required to provide a
data set for all chemicals. This started a process that led to the chemical framework regulation, REACH.
REACH was enacted in 2006 and builds on the prin-ciple of No data – no market. The regulation obliges manufacturers and importers to provide safety data about chemicals they market. These requirements are introduced over a time span of 12 years and – while data received is still not sufficient to carry out full examination of the safety of a chemical –
aFterAs the regulation is still under implementa-tion, the actual outcome cannot be presented. However, in contrast to industry estimates, the European Commission estimated that the total costs of REACH for the chemical industry and downstream users were in the range € 2.8-5.2 billion over 15 years.
To put the costs into perspective: According to economist Frank Ackerman, a € 3.5 billion cost for complying with REACH, if fully passed on to customers, would increase the average pri-ces of European chemical industry products by a ratio of 0.0006, or 1/16 of one percent. This is, “by any reasonable standard, a very small price change”. The spot price of crude oil changes
by more than that, on average, 51 weeks out of the year.
According to a report made for the European Commission in relation to the review of REACH in 2012, a consultant has evaluated the implementation of the REACH Regulation in relation to its impact on the operation of the single market and the competitiveness of the European chemicals industry. Cost related to registration represent about 1% of firms’ total annual turnover. Regarding the impacts on chemicals market and industry, the overall conclusion is that REACH has not had a sizeable impact on the prices of final consumer products.23
C RY WOLF LESSON 5 21
Legal context: eU regulation on chemicals (Reach)
do represent a first important step in making indu-stry responsible for providing vital data on chemical hazards and risks. REACH also introduces a process for selecting chemicals of very high concern, and re-quiring companies to apply for time-limited author-isations in order to be allowed to continue using them. Foreign governments helped to spread the indu-stry message. The US chemical industry managed to engage four US government agencies to wage a campaign to weaken and defeat the REACH propo-sal. The Secretary of State, Colin Powell, sent cables to US embassies in Europe urging action on behalf of the industry. EPA officials flew to Europe with US chemical industry executives to lobby for US-style voluntary regulation. High-level Commerce Depart-ment officials executed outreach campaigns to sway opinion. And the Office of the US Trade Repre-sentative tasked industry to develop themes to op-pose REACH for use by the US government.
REACH will continue to be implemented in sequen-tial steps until 2018, so the full answer to what REACH costs cannot yet be determined. Also, strong opposition to many of the proposals meant that the
adopted legislation was far from the original scope. For instance, polymers and several other chemical groups were exempted and the data requirements for substances produced in smaller tonnages were reduced. Chemical Safety Reports were not required anymore for substances below 10 tons. The general “Duty of Care” was taken out and transparency was decreased, and so on.
Still – REACH brought a new approach to chemicals control, with responsibility for testing chemicals and for reporting shifted largely to industry. The authorisation process that was introduced means that industry is required to prove that substances of very high health and environmental concern are acceptable to use and apply, even where harm has been verified. Evidence to prove harm is now less of a responsibility for society and more the responsibi-lity of producers.
The authorisation process is still under way, with the first sunset dates for listed chemicals coming up in 2015. The fact that the EU has produced a list of sub-stances of very high concern (SVHCs), the Candidate List, has however in itself influenced the market-ing of products with hazardous ingredients. In an
22 C RY WOLF LESSON 5
“ When we talk about the threat to competitiveness, we mean the threat to the employment of hundreds of thousands of people employed by the industry eU-wide.”
– Judith Hackitt, Director General, Chemical Industry Association, UK (2002)
”The potential damage to the global economy, our employees and communities in which we operate, and yes, our shareholders, is enormous.”
– Greg Lebedev, American Chemistry Council, about REACH. April 2003

C RY WOLF LESSON 5 23
impact assessment from 2012, industry was asked what effect the placing of substances on the Candi-date List has been for their firms. Responses showed that 43 percent had launched initiatives to refor-mulate, 44 percent withdrew those products from their portfolio and 41 percent requested suppliers to substitute those substances. Twenty-five percent launched initiatives to develop new substances to replace them.
These costs to producers should also be compared with the financial benefits of introducing REACH.
A 2005 study from Sheffield University estimated that without REACH, health service costs, product-ivity costs, and the value of lost health-related quality of life for sufferers of occupational asthma, chronic obstructive pulmonary disease (COPD) and dermatitis, would have been approximately € 170 billion over a 30-year time horizon (see grey bars in figure).24 Through the introduction of REACH, costs were estimated to be less than half of that value, or € 78 billion over 30 years (yellow bars).
“ In response to a question from eurActiv on whether ReACH had helped promote innovation in the chemicals sector and bring safer products to the market, BAsF answered ”I think at the end, it is worth the money.”– Ronald Drews, vice president for chemical regulations and trade control at BASF (2012)
24. Pickvance et.al.: Further assessment of the impact of REACH on occupational health with a focus on skin and respiratory diseases, prepared for the European Trade Union Institute for Research, Education and Health & Safety, School of Health and Related Research, University of Sheffield, UK (2005)
estimated cost of deceases (billion €)– impact of reach (30 year time horizon)
asthma copd dermatitis
90,4
45,4
19,79,6
58,5
22,7
without reach
with reach
Source: Pickvance et al. 2005

lesson 6
can electRonIc DevIses be manUfactUReD WIth less toxIc chemIcals?

The growth of the global electronic industry is spec-tacular, now reaching more than $200 billion in an-nual turnover. Electric and electronic products, which encompass everything from electric toothbrushes to large electronic industrial equipment, contain hundreds of different chemicals, some of them with harmful properties. Workers are exposed to toxic
chemicals during their manufacture, and emissions take place during product use, recycling and dispo-sal. Since collection and waste management are still largely uncontrolled, workers in recycling and waste treatment facilities, often in countries with low in-come and safety protection, show remarkably high levels of toxic chemicals in their bodies.
aFterThe European Commission DG Enterprise commissioned a study25 to evaluate the costs and savings made through RoHS. The study, presented in 2008, listed a number of financial benefits to industry, including: • Competitive advantage for EU manufacturers in markets
where RoHS legislation is pending or contemplated• Overall reduced number of defects and increased
production efficiency due to tighter process control• Increased skill levels in the global workforce• Less leakage from landfills because electric and
electronic waste contains less hazardous material• Increased incentives for recycling because lead-free
solders contain silver and gold
The study estimated that compliance with RoHS, includ ing re-search and development and capital costs among companies, averaged 1.9 percent of the annual turnover of the electronic sector. Future ongoing costs of complying with RoHS were estimated to be 0.4 percent of annual revenues.26
beForeThe European industry claimed that an EU restriction of hazardous substances in electronic devises would cause irreparable damage to domestic industry markets and also in the long run society as whole, by setting up such specific restrictions on products.
25. Study on RoHS and WEEE Directives N° 30-CE-0095296/00-09 Final Report, European Commission DG Enterprise and industry 06/11925/AL March 2008
26. Initially, lead-free solder cost approximately twice as much because it contains metals like silver and gold, even when corrected for the lower quantities needed and an increased rate of recycling. Manufacturing costs also increased because (1) lead-free components have higher failure rates during manufacturing and required more re-work and repair, (2) energy costs increased by approximately 19% due to the higher melting temperatures required, (3) throughput decreased by 2 to 7% for some manufacturers
Legal frame: Rohs (Restriction of hazardous substances) Directive 2002/95/eec
C RY WOLF LESSON 6 25

The EU decided to tackle the problem of hazardous substances in electric and electronic products by setting up a list of toxic chemicals that would not be allowed. Six substances were originally singled out based on their hazardous properties and their extensive use in electric and electronic devices. The proposed directive, Restrictions of Hazardous Sub-stances (RoHS), was debated over a number of years, and came into force in 2006.
The European Commission impact study made two main conclusions about the effects of RoHS:
1. Toxicity to humans and the environment has been reduced and that
2. RoHS has been a driver for wider environmen tal awareness concerning materials use, energy effi-ciency, eco-design and sustainable development.
On the toxic reduction effect of introducing RoHS, it noted:
CAdmIUm use in products has been reduced by 14,200 tonnes. Cadmium in waste streams has been reduced by 10,000 tonnes, or 63 %.
leAd use in products has been reduced by 82,700 tonnes in the EU. Lead in waste streams has been reduced by 58,400 tonnes in the EU or approx-imately 20 %.
meRCURy use in products has been reduced by 9,500 tonnes. Mecury in waste streams has been reduced by 6,900 tonnes, or 56 %.
This came at a cost that could be absorbed by the market without reducing functionality. And more importantly, RoHS had a knock-on effect in countries of manufacture that also led to corresponding deve-lopment in those countries.
-20%
leadin waste streams has been reduced by
58,400 tonnes in the eU, or
-63%
cadmiumin waste streams has been reduced by
10,000 tonnes, or
-56%
mercuryin waste streams has been reduced by
6,900 tonnes, or
26 C RY WOLF LESSON 6

Who Is cRyIng Wolf?
Regulatory debates involve a large number of stakeholders, from multinational companies to small interest groups. Alliances form and break up depending on the nature of the issue. Large political issues gather an incomprehensible number of stake holders, which makes it difficult for decision-makers to grasp the interests behind arguments and facts presented.
In this communication battle, financially strong players have more possibilities to present their views, and also to back them up with reports, esti-mates, and surveys. Studies are presented as “scien-tific” even though most do not undergo scrutiny such as an independent peer review. Also, the selec-tion of study areas, and priorities, is always a matter of judgment, based on personal values and precon-ceptions.
Some of the stakeholders in the game are:
• IndIvIdUAl CoRPoRATIonsThe industry that is most vocal in the debate is most often the one that feels most threatened by a new policy direction. Companies that would benefit from the same regulation rarely speak up about this. There is simply no tradition of industry standing up
in support of regulatory intervention. This creates a biased situation, where the policy maker thinks he/she is helping industry by avoiding “green tape”, but in fact causes dis advantages to many more compa-nies.
For instance the chemicals industry greatly exagge-rated the costs and difficulties of phasing out ozone depleting substances (ODSs), but it is essential to differentiate between the chemicals industry and the downstream users who at the time depend-ed on ODSs for manufacturing their products. The downstream users initially support ed the chemicals industry in opposing regulation on ODSs. However, as alternative substances and technologies became available they shifted side and started transferring to non-ODS processes. In the end, the chemicals in-dustry caved in and followed suit.
C RY WOLF WHO IS C RYI NG WOLF 27

Source of illustration: REACH - What Happened and Why? 2004 Schörling/Lind
28 C RY WOLF WHO IS C RYI NG WOLF

• IndUsTRy AssoCIATIons Much of the official industry rhetoric in the debate around legislation is however put forward by indu-stry associations rather than individual companies. These associations regularly present their views as representative of the whole business sector. Both progressive and regressive opinions among the members are boiled down to a single policy position, representing the least common denominator.
As an example, let’s look at the associations involved in what has been called the largest industry lobby campaign ever launched in Europe. The picture [on the left] attempts to show the complexity of indu-stry groups actively lobbying on the REACH legi-slation during the most intensive period – around 2005. In the centre of the lobby campaign is the European Chemical Industry Council, Cefic. From here, numerous links emanates from federations, lobbying firms and companies. Most of the corpo-rate members of the “Cefic family” were also active members in many of the federations as well as in the sector groups, which also have federations at national levels.
Federations and sector groups may also have non-chemical members, such as the Chemical Industry Association (CIA) in the UK. Among its members are some 20 solicitors, crisis management consultants, marketing consultants, railway companies and ac-countants. Additionally, there are numerous insti-tutes, think tanks, non-profit organisations etc. with less official connections to the industry. 27
In the case of chemical regulations such as REACH, stricter data requirements help companies to re-quest more information from their suppliers. This can reduce risks associated with future liabilities for decontamination and/or compensation. Stricter laws also reward innovative companies. New mark-ets, new consumer groups, greater confidence and reduced risks are some of the opportunities created by progressive legislation.
• IndIReCT IndUsTRy loBByIng – qUAsI-CIvIl soCIeTy gRoUPsCompanies that want to stop an environmental re-gulation may also decide to “create” a group of citi-zens or experts (or a combination of both groups): Such groups can be used to publically promote the outcomes desired by the corporation while claiming to represent the public interest. The phenomenon is sometimes called “astroturfing”, meaning creation of “false” grassroot groups.
The use of such ’front groups’ enables corporations to take part in public debates and government hear-ings behind a cover of community concern. These front groups lobby governments to legislate in the corporate interest, to oppose environmental regu-lations, and to introduce policies that enhance cor-porate profitability. Front groups also campaign to change public opinion, so that the markets for cor-porate goods are not threatened and the efforts of environmental groups are defused. 28
”grassroots political action, typically under-stood as the exclusive purview of citizen organizers, has been adapted as a commer-cial practice deployed by consultants on behalf of corporations, trade associations, and the wealthiest and most professional-ized advocacy organi-zations.” 26
26. Grassroots for hire – Public Affairs Consultants in American Democracy”, av Edward T Walker (Cambridge University Press, 2014)
27. Schörling/Lind: REACH - What happened and Why? The Greens of the European Parliament (2004)
28. Walker, E.T.: in ”Grassroots for Hire: Public Affairs Consultants in American Democracy ” (Cambridge University Press). 2014
C RY WOLF WHO IS C RYI NG WOLF 29

conclUsIons
29. P. Vercaemst, S. Vanassche, P. Campling, L. Vranken (VITO) P. Agnolucci, R. Salmons, B. Shaw, (PSI) J. Jantzen, H. van der Woerd (TME) M. Grünig, A. Best (Ecologic); Sectoral Costs of Environmental Policy, Study accompished under the authority of the European Commission, DG Environment, 2007/IMS/R/427
This report reviews cost estimates for compliance with proposed environmental regulations present-ed by industry interest groups, and compares them with actual costs after the laws have entered into force. The cases studied clearly show that industry generally overestimates anticipated compliance costs and underestimates innovation potential. In-dustry shouts that the wolf is coming, but it’s a false warning.
By showing examples from different environ men tal policy areas over recent decades, this report sheds
light on how this is a systematic industry response to regulators’ attempts to protect human health and environment. This is not only a historical strate-gy, it is a continuing trend.
Political decision makers need to take this into con-sideration when they come across this kind of cost estimations presented by industry.
The lessons presented in this report highlight three main methodological problems with industry’s response to proposed laws:
• THe CosT models Used ARe Too sTATIC And lImITed The most widely used strategy is to assume that industry does not adapt to changes (the static model). The static model is a sure-fire way to show that any regulation will incur unacceptably high costs for in-dustry. It is also an insult to decision makers within the industry, as it assumes that they are incapable of adapting to new situations.
For instance, the static model was frequently used in REACH impact studies that were commissioned by chemical industry trade associations – studies that predicted extremely high costs for implementation of the new law. Many earlier studies performed for trade organisations have been based on the same kinds of assumptions.
• CosT RedUCTIons FRom ComPlyIng WITH seveRAl ReqUIRemenTs sImUlTAneoUsly ARe IgnoRed
The EU-wide industry survey on the costs of environmental regulations29 found that the cumulative burden of regulations was considerably less than the sum of the individual policies. The researchers also noticed that the drive for synergies was an important element in the negotiations be tween authorities and companies, e.g. regarding permit reviews. This led to a notion of caution in estimat ing costs of regu-lations:
30 C RY WOLF CONC LUSIONS

30. Vanassche, et.al.; Sectoral Costs of Environmental Policy, study accompished under the authority of the European Commission, DG Environment, 2007/IMS/R/427
31. Driving Innovation. How stronger laws help bring safer chemicals to market, The Center for International Environmental Law (2013)
C RY WOLF CONC LUSIONS 31
In spite of positive effects from enhanced environ-mental legislation – such as innovation of new techniques, increased competiveness for frontrun-ners and not least health and environmental bene-fits – many industry trade organisations continue to systematically inflate cost estimates in order to combat new environmental regulations.
It is of utmost importance that political decision makers take a balanced approach to such “cries of wolf”, and avoid being misled by the special inte-rests of some stakeholders that will slow down pro-gress towards a sustainable society.
“In this respect, one should be very careful in processes assessing the expected effects of
(new) regulation, for example in impact assessments. Typically, one considers the standalone consequences
of a regulation, underestimating the synergetic effects.”30
• BeneFICIAl eFFeCTs To IndUsTRy ARe UndeResTImATed Many studies reaffirm that environmental policy can actually benefit companies, for example, by improv-ing resource efficiency and enhancing performance. The conventional strategy of crying wolf (overesti-mating regulatory costs of new regulations) is therefore actually not even in the interest of companies, at least not those that take a progressive stance on environmental issues, and act as forerunners.
For instance, The Center for International Environmental Law (CIEL) investigated the impact of hazardous chemicals laws on product innovation.31 Through an examination of patents, the study clearly demon-strated that the prospect of legal restrictions on chemicals has sparked industry to multifold activities on innovation, development and adoption of alternatives.
One example is the evolution of safer alternatives to phthalates, a group of substances with hormone-disrupting properties. CIEL showed an exponential growth in the number of patented inventions for such alternatives. The growth in patents started in 1999, coinciding with the adoption of stricter measures on phthalate use in the EU. A second spike of registrations occurred around 2006, the year when the REACH regulation was adopted.
This effect on innovation naturally brings financial benefits. It increases activity both on the production and demand side, speeds up transitions and shortens the invention-to-market time.
Chem
Sec
Janu
ary
2015
A line heard frequently from economists, legislators and even from the industry itself is that ”nobody believes these constructed estimates any-way”. If that really was true then the need for this report is questionable. But ex perience speaks against this. It is obvious that the predicted costs presented by industry, despite the fact that they have been heavily criticised by econom ists, have had paramount importance in influencing the final proposal. Why is this? If nobody believes them, why are they still taken seriously?
One reason is that even if these predictions are built on shaky foundations, they are nonetheless very difficult to refute, as it is impossible to prove that they are wrong. That is the nature of predictions and this can be used stra tegically to kill unwanted regulation. Another reason is that even if most people involved in the negotiations around new legislation are aware that the predicted estimates from specific interest groups within the industry are exaggerated, they can still create the feeling of “no smoke without fire”.
aRe DecIsIon makeRs actUally InflUenceD by the cRy of Wolf?
www.chemsec.org