cross section of stock returns on shari’ah · cross section of stock returns of shari’ah...
TRANSCRIPT

Cross Section of Stock Returns on Shari’ah
Compliant Stocks: Evidence from Pakistan
SALMAN AHMED SHAIKH
Prof. Dr. Abdul Ghafar Ismail
Dr. Mohd Adib Ismail
Assoc. Prof. Dr. Shahida Shahimi
Dr. Muhammad Hakimi Mohd. Shafiai
School of Economics, FEP
UKM Malaysia

Outline
• Theoretical Background
• Research Issues
• Problem Statement
• Research Methodology
▫ Empirical Models
▫ Hypothesis Development
▫ Method of Analysis
▫ Data Specification
• Data Analysis and Discussion
• Conclusion
• Practical Implications
2
CROSS SECTION OF STOCK RETURNS OF SHARI’AH
COMPLIANT STOCKS: EVIDENCE FROM PAKISTAN
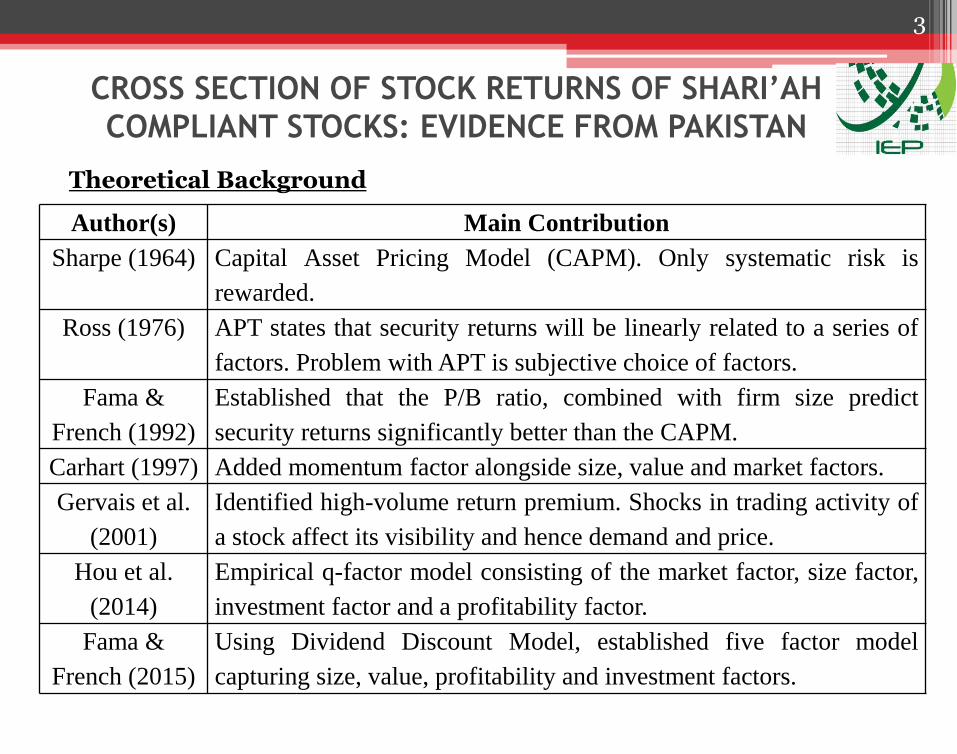
Theoretical Background
Author(s) Main Contribution
Sharpe (1964) Capital Asset Pricing Model (CAPM). Only systematic risk is
rewarded.
Ross (1976) APT states that security returns will be linearly related to a series of
factors. Problem with APT is subjective choice of factors.
Fama &
French (1992)
Established that the P/B ratio, combined with firm size predict
security returns significantly better than the CAPM.
Carhart (1997) Added momentum factor alongside size, value and market factors.
Gervais et al.
(2001)
Identified high-volume return premium. Shocks in trading activity of
a stock affect its visibility and hence demand and price.
Hou et al.
(2014)
Empirical q-factor model consisting of the market factor, size factor,
investment factor and a profitability factor.
Fama &
French (2015)
Using Dividend Discount Model, established five factor model
capturing size, value, profitability and investment factors.
3

CROSS SECTION OF STOCK RETURNS OF SHARI’AH
COMPLIANT STOCKS: EVIDENCE FROM PAKISTAN
Issues
• Need ex-ante pricing tools for security analysis and selection.
• Asset pricing for Muslim investors is crucial since they face:
▫ Challenges with restricted choice of investment opportunity set.
▫ Less liquidity due to no use of short sales, futures and margin financing.
▫ Dividend purification costs.
▫ High cost of portfolio revision
• Shari’ah Compliant stocks may have distinct features:
▫ Less non-asset backed leverage.
Bias Towards Start-ups vs. Mature Companies.
Bias Towards Aggressive vs. Conservative Investment Companies.
▫ Potentially less financial liquidity and financial non-operating income.
▫ High proportion of fixed assets.
Bias Towards Manufacturing vs. Service Sector Companies.
▫ More visibility due to higher analysts’ following.
4
CROSS SECTION OF STOCK RETURNS OF SHARI’AH
COMPLIANT STOCKS: EVIDENCE FROM PAKISTAN
Problem Statement
Investigate the relative performance of single and fundamental (micro-based) multi-factor asset pricing models for explaining the cross section of expected returns of Shari’ah Compliant stocks.
5
CROSS SECTION OF STOCK RETURNS OF SHARI’AH
COMPLIANT STOCKS: EVIDENCE FROM PAKISTAN
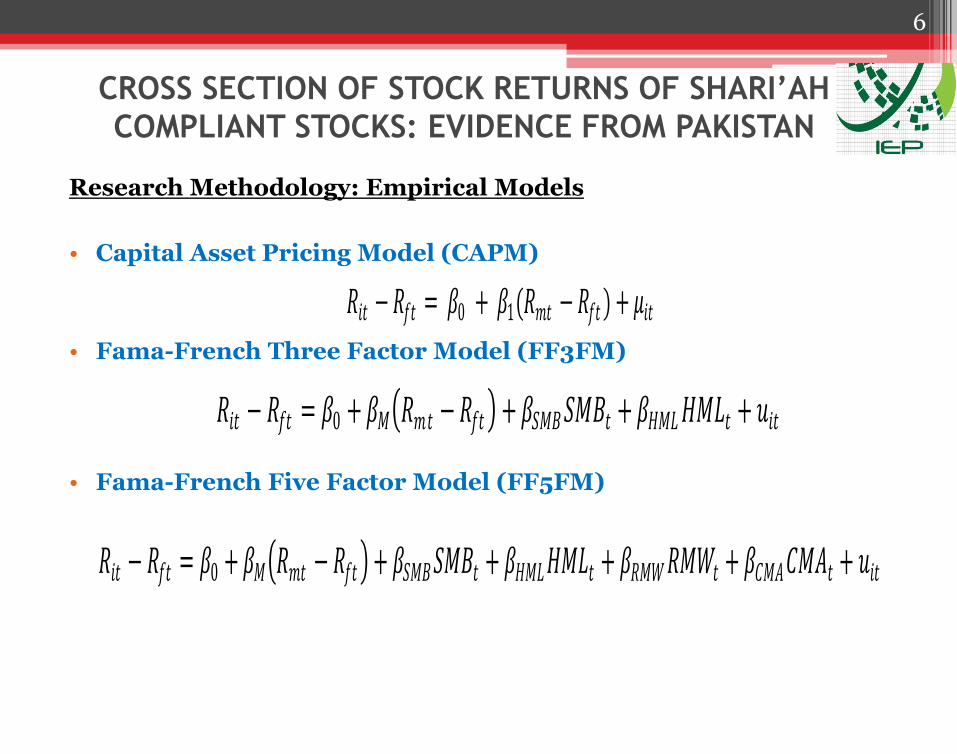
Research Methodology: Empirical Models
• Capital Asset Pricing Model (CAPM)
• Fama-French Three Factor Model (FF3FM)
• Fama-French Five Factor Model (FF5FM)
𝑅𝑖𝑡 − 𝑅𝑓𝑡 = 𝛽0 + 𝛽𝑀 𝑅𝑚𝑡 −𝑅𝑓𝑡 + 𝛽𝑆𝑀𝐵𝑆𝑀𝐵𝑡 + 𝛽𝐻𝑀𝐿𝐻𝑀𝐿𝑡 + 𝑢𝑖𝑡
𝑅𝑖𝑡 − 𝑅𝑓𝑡 = 𝛽0 + 𝛽𝑀 𝑅𝑚𝑡 − 𝑅𝑓𝑡 + 𝛽𝑆𝑀𝐵𝑆𝑀𝐵𝑡 + 𝛽𝐻𝑀𝐿𝐻𝑀𝐿𝑡 + 𝛽𝑅𝑀𝑊𝑅𝑀𝑊𝑡 + 𝛽𝐶𝑀𝐴𝐶𝑀𝐴𝑡 + 𝑢𝑖𝑡
𝑅𝑖𝑡 −𝑅𝑓𝑡 = 𝛽0 + 𝛽1(𝑅𝑚𝑡 − 𝑅𝑓𝑡 ) + 𝜇𝑖𝑡
6
CROSS SECTION OF STOCK RETURNS OF SHARI’AH
COMPLIANT STOCKS: EVIDENCE FROM PAKISTAN
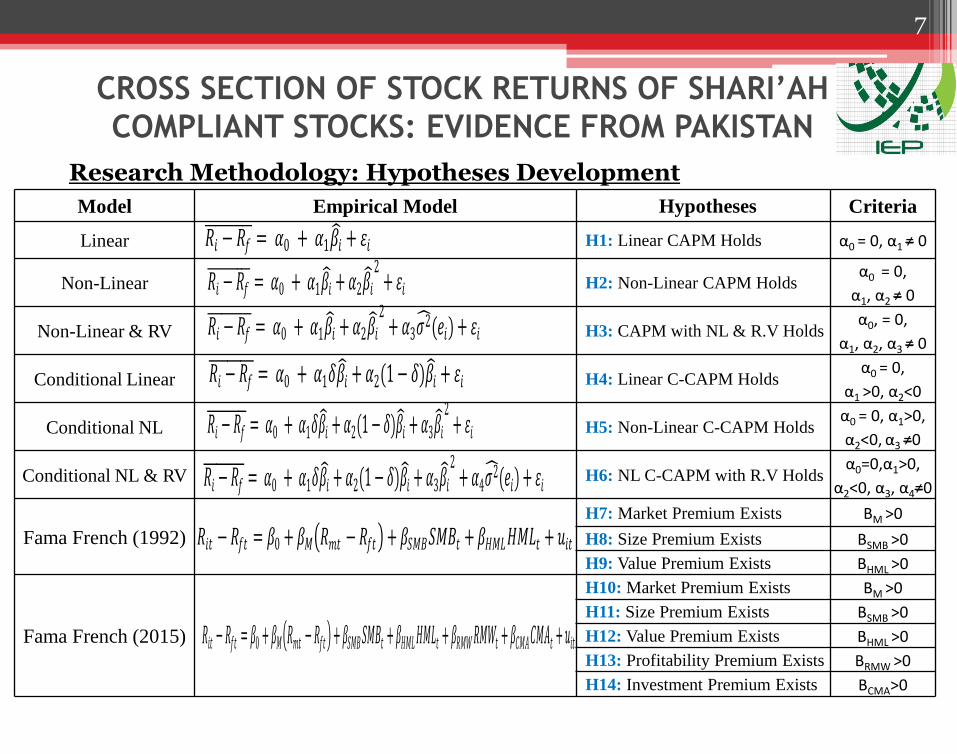
Research Methodology: Hypotheses Development
Model Empirical Model Hypotheses Criteria
Linear H1: Linear CAPM Holds α0 = 0, α1 ≠ 0
Non-Linear H2: Non-Linear CAPM Holds α0 = 0,
α1, α2 ≠ 0
Non-Linear & RV H3: CAPM with NL & R.V Holds α0, = 0,
α1, α2, α3 ≠ 0
Conditional Linear H4: Linear C-CAPM Holds α0 = 0,
α1 >0, α2<0
Conditional NL H5: Non-Linear C-CAPM Holds α0 = 0, α1>0,
α2<0, α3 ≠0
Conditional NL & RV H6: NL C-CAPM with R.V Holds α0=0,α1>0,
α2<0, α3, α4≠0
Fama French (1992)
H7: Market Premium Exists ΒM >0
H8: Size Premium Exists ΒSMB >0
H9: Value Premium Exists ΒHML >0
Fama French (2015)
H10: Market Premium Exists ΒM >0
H11: Size Premium Exists ΒSMB >0
H12: Value Premium Exists ΒHML >0
H13: Profitability Premium Exists ΒRMW >0
H14: Investment Premium Exists ΒCMA>0
𝑅𝑖 − 𝑅𝑓 = 𝛼0 + 𝛼1𝛽𝑖 + 휀𝑖
𝑅𝑖 − 𝑅𝑓 = 𝛼0 + 𝛼1𝛽𝑖 + 𝛼2𝛽𝑖 2
+ 휀𝑖
𝑅𝑖 − 𝑅𝑓 = 𝛼0 + 𝛼1𝛽𝑖 + 𝛼2𝛽𝑖 2
+ 𝛼3𝜎2 (𝑒𝑖) + 휀𝑖
𝑅𝑖𝑡 − 𝑅𝑓𝑡 = 𝛽0 + 𝛽𝑀 𝑅𝑚𝑡 − 𝑅𝑓𝑡 + 𝛽𝑆𝑀𝐵𝑆𝑀𝐵𝑡 + 𝛽𝐻𝑀𝐿𝐻𝑀𝐿𝑡 + 𝑢𝑖𝑡
𝑅𝑖𝑡 − 𝑅𝑓𝑡 = 𝛽0 + 𝛽𝑀 𝑅𝑚𝑡 − 𝑅𝑓𝑡 + 𝛽𝑆𝑀𝐵𝑆𝑀𝐵𝑡 + 𝛽𝐻𝑀𝐿𝐻𝑀𝐿𝑡 + 𝛽𝑅𝑀𝑊𝑅𝑀𝑊𝑡 + 𝛽𝐶𝑀𝐴𝐶𝑀𝐴𝑡 + 𝑢𝑖𝑡
7
𝑅𝑖 − 𝑅𝑓 = 𝛼0 + 𝛼1𝛿𝛽𝑖 + 𝛼2(1− 𝛿)𝛽𝑖 + 휀𝑖
𝑅𝑖 − 𝑅𝑓 = 𝛼0 + 𝛼1𝛿𝛽𝑖 + 𝛼2(1− 𝛿)𝛽𝑖 + 𝛼3𝛽𝑖 2
+ 휀𝑖
𝑅𝑖 − 𝑅𝑓 = 𝛼0 + 𝛼1𝛿𝛽𝑖 + 𝛼2(1− 𝛿)𝛽𝑖 + 𝛼3𝛽𝑖 2
+ 𝛼4𝜎2 (𝑒𝑖) + 휀𝑖

CROSS SECTION OF STOCK RETURNS OF SHARI’AH
COMPLIANT STOCKS: EVIDENCE FROM PAKISTAN
Research Methodology: Method of Analysis
Capital Asset Pricing Model (CAPM)
• For Lintner (1965), Two-Pass Regression on Individual Stocks.
• Rolling Beta Regression for BJS (1972) and FM (1973) Portfolio Approach.
• Pettengill et al. (1995) Conditional Relation Between Beta and Returns .
Multi-Index Models (FF3FM and FF5FM)
• IV-2SLS Generalized Method of Moments (GMM) regression.
• IV First Set
▫ Lagged market return (used in Javid and Ahmed, 2008).
▫ Lagged asset return (used in Javid and Ahmed, 2008).
• IV Second Set
▫ Short-term interest rate (used in Fama and Schwert, 1973).
▫ Default spread (used in Fama and French, 1989).
▫ Term spread (used in Fama and French, 1989).
8
CROSS SECTION OF STOCK RETURNS OF SHARI’AH
COMPLIANT STOCKS: EVIDENCE FROM PAKISTAN
Research Methodology: Data
• Sample Unit: 217 Shari’ah compliant stocks screened by Karachi Stock Exchange Al-Meezan Index (KMI) methodology.
• Period of Study: 2001–2016.
• Proxy for Market Portfolio: Dow Jones Islamic Index for Pakistan.
• Data Source: KSE Quotations.
9

CROSS SECTION OF STOCK RETURNS OF SHARI’AH
COMPLIANT STOCKS: EVIDENCE FROM PAKISTAN
• The average monthly returns for Shari’ah compliant stocks had been higher than the average monthly returns on the market index during 2001-2015. In sub-periods as well, we note the same trend.
• The volatility of returns on Shari’ah compliant stocks is little higher in absolute terms. However, coefficient of variation is lower.
10
Period
Halal Stock
Returns
(Rp)
Standard
Deviation
(Rp)
Coefficient
of Variation
(Rp)
Market
Index
Return
(Rm)
Standard
Deviation
(Rm)
Coefficient
of Variation
(Rm)
2001-15 3.79% 8.42% 2.2216 2.40% 7.10% 2.958
2001-05 6.08% 10.55% 1.7352 3.73% 8.70% 2.3344
2006-10 1.58% 7.08% 4.4810 1.44% 7.06% 4.9028
2011-15 3.60% 6.52% 1.8111 1.98% 4.95% 2.5000
Table 1: Shari’ah Compliant Stock Average Monthly Returns (2001-15)
CROSS SECTION OF STOCK RETURNS OF SHARI’AH
COMPLIANT STOCKS: EVIDENCE FROM PAKISTAN
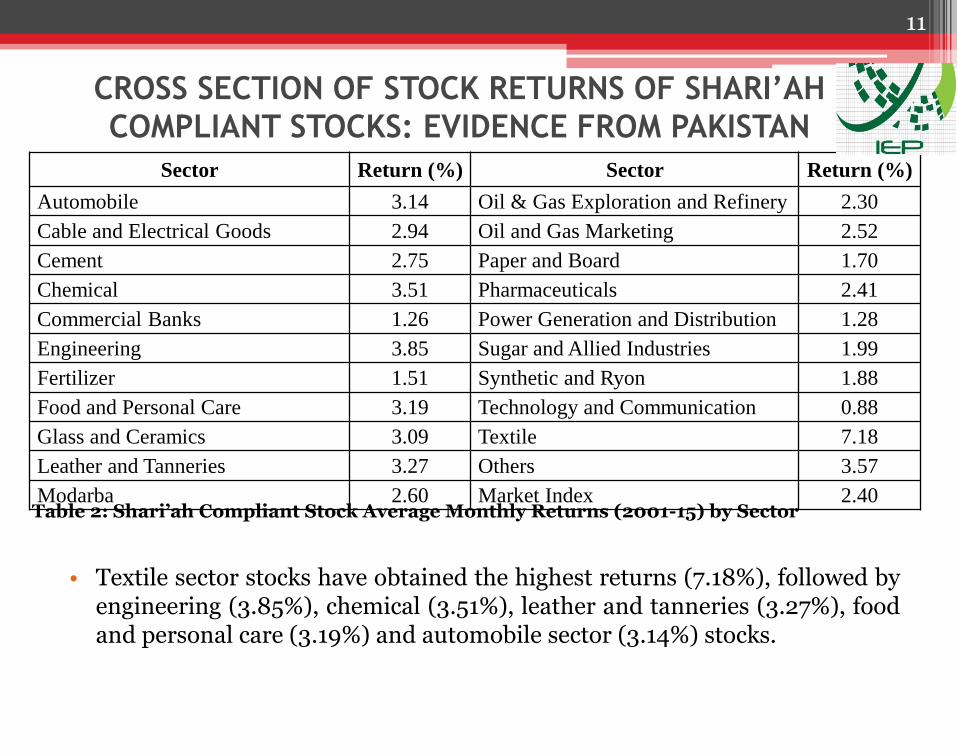
• Textile sector stocks have obtained the highest returns (7.18%), followed by engineering (3.85%), chemical (3.51%), leather and tanneries (3.27%), food and personal care (3.19%) and automobile sector (3.14%) stocks.
11
Table 2: Shari’ah Compliant Stock Average Monthly Returns (2001-15) by Sector
Sector Return (%) Sector Return (%)
Automobile 3.14 Oil & Gas Exploration and Refinery 2.30
Cable and Electrical Goods 2.94 Oil and Gas Marketing 2.52
Cement 2.75 Paper and Board 1.70
Chemical 3.51 Pharmaceuticals 2.41
Commercial Banks 1.26 Power Generation and Distribution 1.28
Engineering 3.85 Sugar and Allied Industries 1.99
Fertilizer 1.51 Synthetic and Ryon 1.88
Food and Personal Care 3.19 Technology and Communication 0.88
Glass and Ceramics 3.09 Textile 7.18
Leather and Tanneries 3.27 Others 3.57
Modarba 2.60 Market Index 2.40
CROSS SECTION OF STOCK RETURNS OF SHARI’AH
COMPLIANT STOCKS: EVIDENCE FROM PAKISTAN
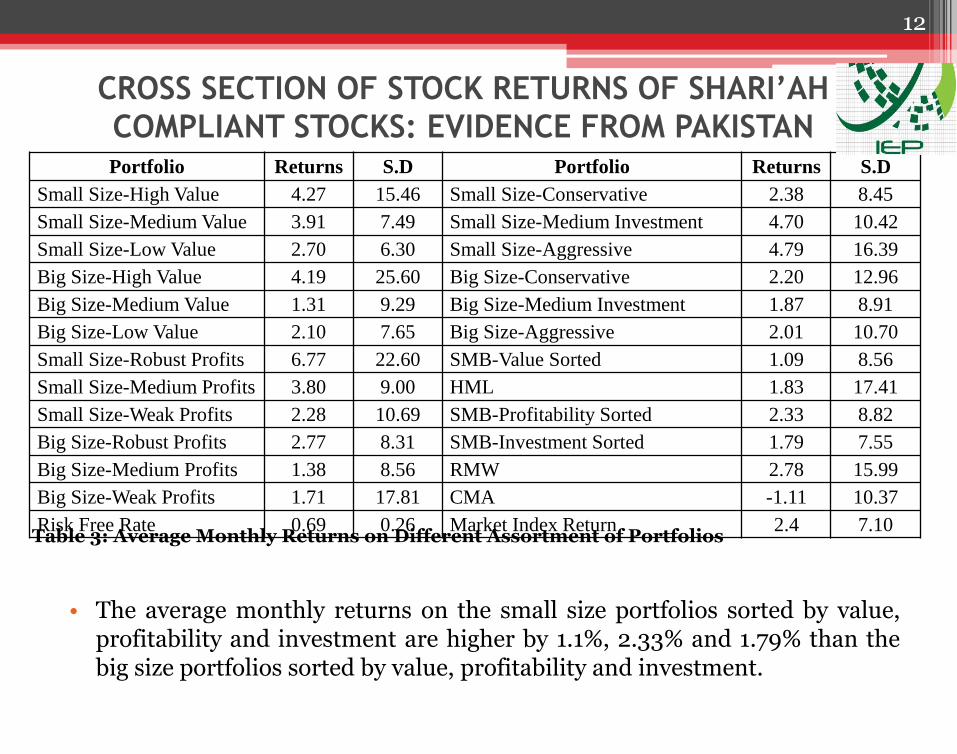
• The average monthly returns on the small size portfolios sorted by value, profitability and investment are higher by 1.1%, 2.33% and 1.79% than the big size portfolios sorted by value, profitability and investment.
12
Table 3: Average Monthly Returns on Different Assortment of Portfolios
Portfolio Returns S.D Portfolio Returns S.D
Small Size-High Value 4.27 15.46 Small Size-Conservative 2.38 8.45
Small Size-Medium Value 3.91 7.49 Small Size-Medium Investment 4.70 10.42
Small Size-Low Value 2.70 6.30 Small Size-Aggressive 4.79 16.39
Big Size-High Value 4.19 25.60 Big Size-Conservative 2.20 12.96
Big Size-Medium Value 1.31 9.29 Big Size-Medium Investment 1.87 8.91
Big Size-Low Value 2.10 7.65 Big Size-Aggressive 2.01 10.70
Small Size-Robust Profits 6.77 22.60 SMB-Value Sorted 1.09 8.56
Small Size-Medium Profits 3.80 9.00 HML 1.83 17.41
Small Size-Weak Profits 2.28 10.69 SMB-Profitability Sorted 2.33 8.82
Big Size-Robust Profits 2.77 8.31 SMB-Investment Sorted 1.79 7.55
Big Size-Medium Profits 1.38 8.56 RMW 2.78 15.99
Big Size-Weak Profits 1.71 17.81 CMA -1.11 10.37
Risk Free Rate 0.69 0.26 Market Index Return 2.4 7.10

CROSS SECTION OF STOCK RETURNS OF SHARI’AH
COMPLIANT STOCKS: EVIDENCE FROM PAKISTAN
• No supportive evidence for standard CAPM. The beta coefficient is marginally positive in linear CAPM in OLS and negative in GMM, but it is insignificant in both estimation methods.
13
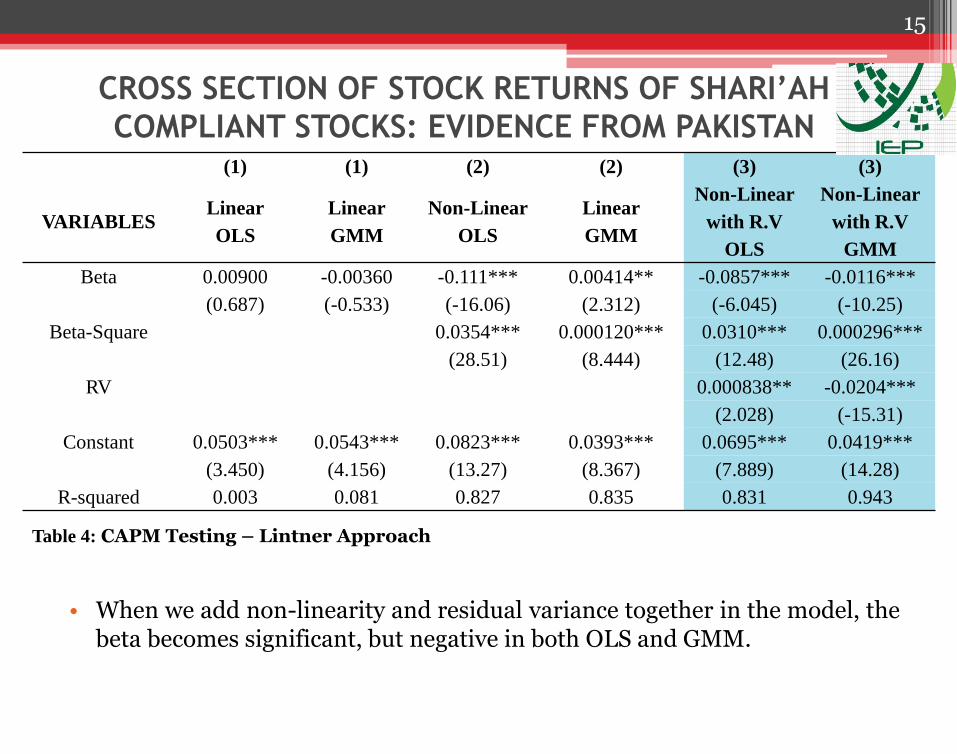
Table 4: CAPM Testing – Lintner Approach
(1) (1) (2) (2) (3) (3)
VARIABLES Linear
OLS
Linear
GMM
Non-Linear
OLS
Linear
GMM
Non-Linear
with R.V
OLS
Non-Linear
with R.V
GMM
Beta 0.00900 -0.00360 -0.111*** 0.00414** -0.0857*** -0.0116***
(0.687) (-0.533) (-16.06) (2.312) (-6.045) (-10.25)
Beta-Square 0.0354*** 0.000120*** 0.0310*** 0.000296***
(28.51) (8.444) (12.48) (26.16)
RV 0.000838** -0.0204***
(2.028) (-15.31)
Constant 0.0503*** 0.0543*** 0.0823*** 0.0393*** 0.0695*** 0.0419***
(3.450) (4.156) (13.27) (8.367) (7.889) (14.28)
R-squared 0.003 0.081 0.827 0.835 0.831 0.943

CROSS SECTION OF STOCK RETURNS OF SHARI’AH
COMPLIANT STOCKS: EVIDENCE FROM PAKISTAN
• When we add non-linearity in the model, the beta becomes significant, but negative in OLS and positive in GMM. Furthermore, the non-linear coefficient turns out to be positive and statistically significant.
14
Table 4: CAPM Testing – Lintner Approach
(1) (1) (2) (2) (3) (3)
VARIABLES Linear
OLS
Linear
GMM
Non-Linear
OLS
Linear
GMM
Non-Linear
with R.V
OLS
Non-Linear
with R.V
GMM
Beta 0.00900 -0.00360 -0.111*** 0.00414** -0.0857*** -0.0116***
(0.687) (-0.533) (-16.06) (2.312) (-6.045) (-10.25)
Beta-Square 0.0354*** 0.000120*** 0.0310*** 0.000296***
(28.51) (8.444) (12.48) (26.16)
RV 0.000838** -0.0204***
(2.028) (-15.31)
Constant 0.0503*** 0.0543*** 0.0823*** 0.0393*** 0.0695*** 0.0419***
(3.450) (4.156) (13.27) (8.367) (7.889) (14.28)
R-squared 0.003 0.081 0.827 0.835 0.831 0.943
CROSS SECTION OF STOCK RETURNS OF SHARI’AH
COMPLIANT STOCKS: EVIDENCE FROM PAKISTAN
• When we add non-linearity and residual variance together in the model, the beta becomes significant, but negative in both OLS and GMM.
15
Table 4: CAPM Testing – Lintner Approach
(1) (1) (2) (2) (3) (3)
VARIABLES Linear
OLS
Linear
GMM
Non-Linear
OLS
Linear
GMM
Non-Linear
with R.V
OLS
Non-Linear
with R.V
GMM
Beta 0.00900 -0.00360 -0.111*** 0.00414** -0.0857*** -0.0116***
(0.687) (-0.533) (-16.06) (2.312) (-6.045) (-10.25)
Beta-Square 0.0354*** 0.000120*** 0.0310*** 0.000296***
(28.51) (8.444) (12.48) (26.16)
RV 0.000838** -0.0204***
(2.028) (-15.31)
Constant 0.0503*** 0.0543*** 0.0823*** 0.0393*** 0.0695*** 0.0419***
(3.450) (4.156) (13.27) (8.367) (7.889) (14.28)
R-squared 0.003 0.081 0.827 0.835 0.831 0.943
CROSS SECTION OF STOCK RETURNS OF SHARI’AH
COMPLIANT STOCKS: EVIDENCE FROM PAKISTAN
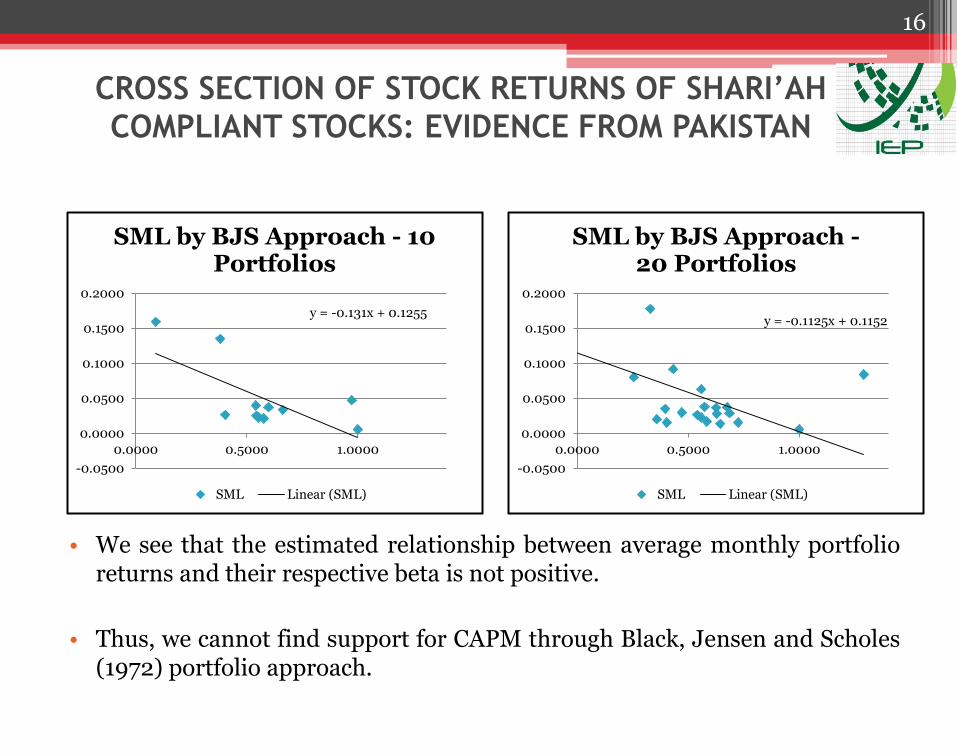
• We see that the estimated relationship between average monthly portfolio returns and their respective beta is not positive.
• Thus, we cannot find support for CAPM through Black, Jensen and Scholes (1972) portfolio approach.
16
y = -0.131x + 0.1255
-0.0500
0.0000
0.0500
0.1000
0.1500
0.2000
0.0000 0.5000 1.0000
SML by BJS Approach - 10 Portfolios
SML Linear (SML)
y = -0.1125x + 0.1152
-0.0500
0.0000
0.0500
0.1000
0.1500
0.2000
0.0000 0.5000 1.0000
SML by BJS Approach - 20 Portfolios
SML Linear (SML)

CROSS SECTION OF STOCK RETURNS OF SHARI’AH
COMPLIANT STOCKS: EVIDENCE FROM PAKISTAN
• The one sample mean comparison test reveals that all the mean values are statistically significant except for residual variance in model specification where both non linear and residual variance are added.
17
Table 5: CAPM Testing – Fama & Macbeth (1973) Approach
Model /
Period
Panel A: Linear Panel B: Non-Linear Panel C: Non-
Linear+RV
All rm>rf rm>rf All rm>rf rm<rf All rm>rf rm<rf
Parameters
α0 0.054 0.057 0.047 0.036 0.037 0.033 0.032 0.034 0.028
α1 -0.019 0.007 -0.009 0.018 -0.011 0.016
α2 -0.065 -0.058 -0.058
α3 0.012 0.014 0.009 0.010 0.012 0.008
α4 -0.003 -0.004 -0.002

CROSS SECTION OF STOCK RETURNS OF SHARI’AH
COMPLIANT STOCKS: EVIDENCE FROM PAKISTAN
• The mean of constant value is far greater than the mean monthly average risk free return (0.82%).
18
Table 5: CAPM Testing – Fama & Macbeth (1973) Approach
Model /
Period
Panel A: Linear Panel B: Non-Linear Panel C: Non-
Linear+RV
All rm>rf rm>rf All rm>rf rm<rf All rm>rf rm<rf
Parameters
α0 0.054 0.057 0.047 0.036 0.037 0.033 0.032 0.034 0.028
α1 -0.019 0.007 -0.009 0.018 -0.011 0.016
α2 -0.065 -0.058 -0.058
α3 0.012 0.014 0.009 0.010 0.012 0.008
α4 -0.003 -0.004 -0.002

CROSS SECTION OF STOCK RETURNS OF SHARI’AH
COMPLIANT STOCKS: EVIDENCE FROM PAKISTAN
• The average beta coefficient for 84 months is negative for overall period. Thus, we see that the results are not supportive of standard CAPM using the overall market period.
19
Table 5: CAPM Testing – Fama & Macbeth (1973) Approach
Model /
Period
Panel A: Linear Panel B: Non-Linear Panel C: Non-
Linear+RV
All rm>rf rm>rf All rm>rf rm<rf All rm>rf rm<rf
Parameters
α0 0.054 0.057 0.047 0.036 0.037 0.033 0.032 0.034 0.028
α1 -0.019 0.007 -0.009 0.018 -0.011 0.016
α2 -0.065 -0.058 -0.058
α3 0.012 0.014 0.009 0.010 0.012 0.008
α4 -0.003 -0.004 -0.002
CROSS SECTION OF STOCK RETURNS OF SHARI’AH
COMPLIANT STOCKS: EVIDENCE FROM PAKISTAN
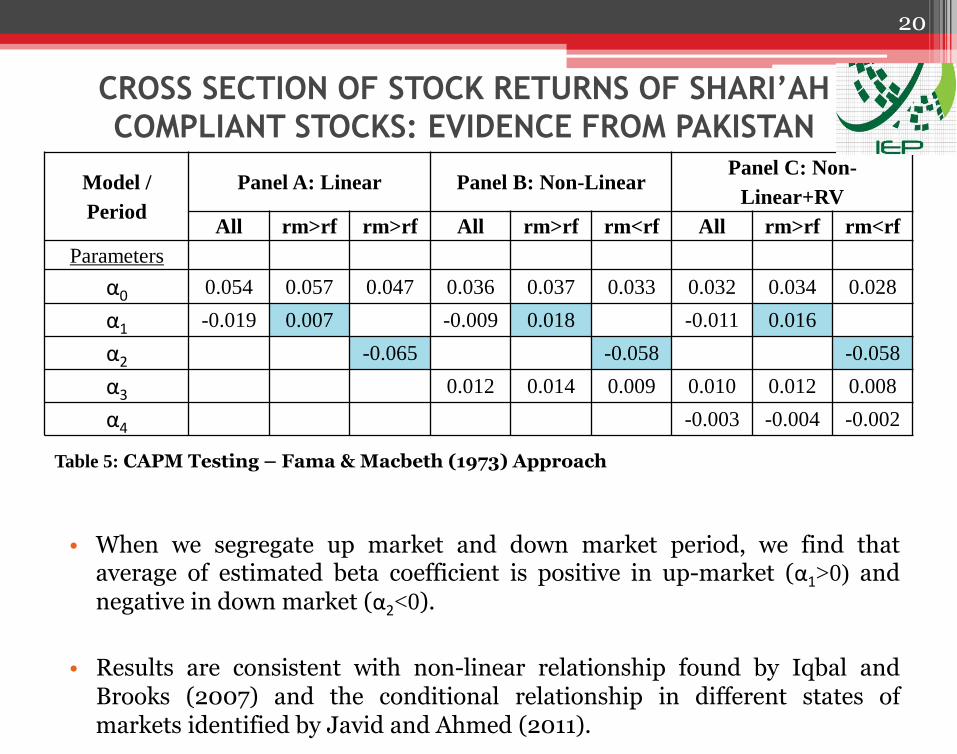
• When we segregate up market and down market period, we find that average of estimated beta coefficient is positive in up-market (α1>0) and negative in down market (α2<0).
• Results are consistent with non-linear relationship found by Iqbal and Brooks (2007) and the conditional relationship in different states of markets identified by Javid and Ahmed (2011).
20
Table 5: CAPM Testing – Fama & Macbeth (1973) Approach
Model /
Period
Panel A: Linear Panel B: Non-Linear Panel C: Non-
Linear+RV
All rm>rf rm>rf All rm>rf rm<rf All rm>rf rm<rf
Parameters
α0 0.054 0.057 0.047 0.036 0.037 0.033 0.032 0.034 0.028
α1 -0.019 0.007 -0.009 0.018 -0.011 0.016
α2 -0.065 -0.058 -0.058
α3 0.012 0.014 0.009 0.010 0.012 0.008
α4 -0.003 -0.004 -0.002
CROSS SECTION OF STOCK RETURNS OF SHARI’AH
COMPLIANT STOCKS: EVIDENCE FROM PAKISTAN
21
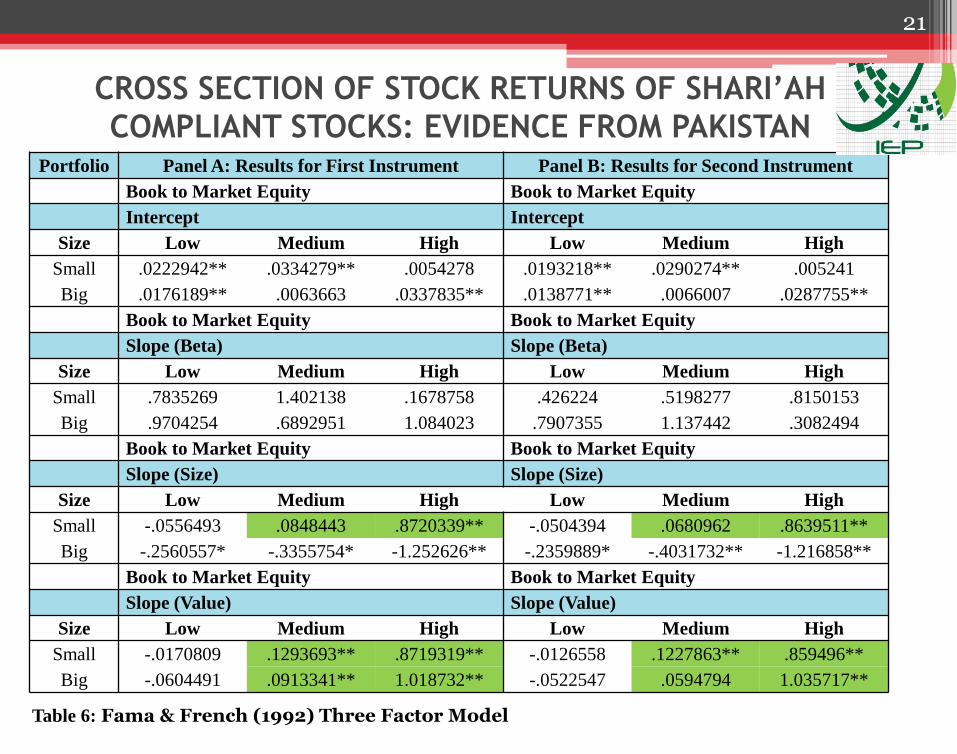
Table 6: Fama & French (1992) Three Factor Model
Portfolio Panel A: Results for First Instrument Panel B: Results for Second Instrument
Book to Market Equity Book to Market Equity
Intercept Intercept
Size Low Medium High Low Medium High
Small .0222942** .0334279** .0054278 .0193218** .0290274** .005241
Big .0176189** .0063663 .0337835** .0138771** .0066007 .0287755**
Book to Market Equity Book to Market Equity
Slope (Beta) Slope (Beta)
Size Low Medium High Low Medium High
Small .7835269 1.402138 .1678758 .426224 .5198277 .8150153
Big .9704254 .6892951 1.084023 .7907355 1.137442 .3082494
Book to Market Equity Book to Market Equity
Slope (Size) Slope (Size)
Size Low Medium High Low Medium High
Small -.0556493 .0848443 .8720339** -.0504394 .0680962 .8639511**
Big -.2560557* -.3355754* -1.252626** -.2359889* -.4031732** -1.216858**
Book to Market Equity Book to Market Equity
Slope (Value) Slope (Value)
Size Low Medium High Low Medium High
Small -.0170809 .1293693** .8719319** -.0126558 .1227863** .859496**
Big -.0604491 .0913341** 1.018732** -.0522547 .0594794 1.035717**

CROSS SECTION OF STOCK RETURNS OF SHARI’AH
COMPLIANT STOCKS: EVIDENCE FROM PAKISTAN
22
Table 7: Fama & French (2015) Three Factor Model
Portfolio Constant Market SML HML RMW CMA F-Stat
S-H .0009 -1.0289 .7191** .8213** .07274 -.1901 281.84**
S-M .0365** 1.4998 .1853 .0692* -.2198** -.1691 25.29**
S-L .0215** .6743 -.0594 .0026 .0494 .0487 2.06
B-H .0362** 1.5696 -1.240** 1.2077** .2429* .3129 751.74**
B-M .01354* -.2763 -.9133** .1385** -.0146 -.5468** 51.79
B-L .01492** .3830 -.3225** .0130 .1308 -.0460 8.22
S-R .0044 -.4427 .7992** .8936** .8717** -.1206 170.48**
S-M .0274** 1.1133 .1899** .1937 .0293 .1692 13.88**
S-W .0190** .4061 .2877** .2982** -.5756** -.3239** 434.37**
B-R .0237** -.0902 -.7085** .0985** .1317 -.2504 38.13**
B-M .0131* 1.2939 -.6059** .2713** .1351* -.0115 63.09
B-W .0115 -.9197 -.2623 .7173** -.4006** -.064 224.14**
S-C .0141** .3991 .0656 .2888** -.0563 .2281* 231.07**
S-M .0341** .6018 .2184* .1829** .0391 .1688 12.24**
S-A .0028 -.2492 .9210** .5980** -.1304 -.9220** 204.77
B-C .0110* -.1845 -.1358 .5576** -.1883 .1196 419.78
B-M .0149** .3239 -.5037** .3004** .1171** .1137 498.04**
B-A .0225** .6182 -.9660** .2359** -.0969 -.6756** 99.21

CROSS SECTION OF STOCK RETURNS OF SHARI’AH
COMPLIANT STOCKS: EVIDENCE FROM PAKISTAN
Conclusion
• Shari’ah compliant stocks are more profitable and have less risk per unit of monthly returns as compared to the benchmark market portfolio.
• The average monthly returns on the small size portfolios sorted by value, profitability and investment were higher than the big size portfolios sorted by value, profitability and investment.
• Our tests of CAPM using individual stocks and portfolio approach showed that there is lack of supportive evidence for standard CAPM, but conditional relationship is found between beta and returns in up-market and down-market states.
• Size and value premium exists in the emerging market of Pakistan.
23
CROSS SECTION OF STOCK RETURNS OF SHARI’AH
COMPLIANT STOCKS: EVIDENCE FROM PAKISTAN
Practical Implications
• These results suggest that Shari’ah compliant stocks in Pakistan provide sizable risk adjusted returns.
• Both Islamic and conventional mutual funds can employ these Shari’ah compliant securities in their portfolios.
• The evidence from multifactor asset pricing models suggests that portfolio evaluation should be cognizant of size and value premium on Shari’ah compliant stocks.
24