credit scoring models - store.leasefoundation.org
TRANSCRIPT

Credit ScoringModels
HOW TOEFFECTIVELY
RATE YOURCREDIT RISK

The Foundation is the only research organization dedicated solelyto the equipment finance industry.
The Foundation accomplishes its mission through development
of future-focused studies and reports identifying critical issues
that could impact the industry.
The Foundation research is independent, predictive and peer-reviewed
by industry experts. The Foundation is funded solely through contributions.
Contributions to the Foundation are tax deductible.
Equipment Leasing & Finance Foundation1825 K STREET • SUITE 900
WASHINGTON, DC 20006WWW.LEASEFOUNDATION.ORG
202-238-3426LISA A. LEVINE, EXECUTIVE DIRECTOR, CAE
Your Eye On The FutureOUNDATION
EQUIPMENT LEASING & FINANCE

EQUIPMENT LEASING & FINANCE FOUNDATION
S U R V E Y R E S U LT S : H O W G O O D I S Y O U R S C O R I N G M O D E L ?
Table of Contents
PREFACE..........................................................................................................................3
EXECUTIVE SUMMARY ..................................................................................................9
OVERVIEW OF MODEL TYPES ....................................................................................12
STATISTICAL-BASED MODELS ....................................................................................16
JUDGMENTAL-BASED MODELS ..................................................................................18
GENERAL MODEL QUESTIONS ..................................................................................20
MODEL VARIABLES – WHAT’S IMPORTANT? ............................................................27
PERFORMANCE EVALUATION OVERVIEW ................................................................30
SUMMARY AND CONCLUSIONS ................................................................................33
STUDY COMMITTEE ....................................................................................................36
APPENDIX - ABOUT PREDICTIVEMETRICS................................................................41
APPENDIX – SURVEY QUESTIONS AND RESPONSES................................................43

EQUIPMENT LEASING & FINANCE FOUNDATION
S U R V E Y R E S U LT S : H O W G O O D I S Y O U R S C O R I N G M O D E L ?

The Equipment Leasing & Finance Foundation (theFoundation) is the leading provider of research fundingfor evaluating current trends, their potential impact onthe equipment finance industry and to help provide asense of direction for the industry’s future. The Foun-dation, recognizing the proliferation of credit scoringmodels in the industry, decided to evaluate the impactof these models and to try to determine whether thistechnology is being used to its best advantage withinthe industry.The Foundation postulated that credit scoring mod-
els have affected the risk-analysis process in the equip-ment leasing and finance industry and that manycompanies may have become increasingly dependenton these tools. Recent lending institution failures out-side the leasing industry may have underscored therisk of over-reliance on automated scoring models inplace of human judgment, and the Foundation wantedto identify trends that might indicate similarities ordifference between the industries’ practices.Many recent failures may also have underscored the
risks of stressing scoring models beyond the scope oftheir original design. Therefore, the Foundation setout to determine how credit scoring models are affect-ing industry credit decisioning and, furthermore,whether the current economic downturn has hadany impact on the predictive capacity of these scoringmodels.To aid the Foundation in preparing its review of the
state of credit scoring models within the leasing indus-try, PredictiveMetrics, Inc. (PMI) was selected to createan industry wide survey that would provide the infor-mation necessary for evaluating the industry’s use ofcredit scoring models and their overall viabilityPMI was selected to work with the Foundation in
preparing this report because of its expertise in the de-velopment and performance evaluation of credit scor-ing models. PMI is one of the leading providers ofstatistical-based predictive scoring models and analyti-cal decision solutions for both the B2C and B2B mar-kets. PMI’s custom analytics and industry/financedecision technology spans many industries, types offinancing, and debt.
How Good is Your Scoring Model? –Report OverviewThis report begins with a general review of model
usage, followed by a specific analysis of the use of sta-tistical-based and judgmental-based models. This is fol-lowed by an analysis of the impact of current economicconditions on model usage and other factors that areaffecting model performance and scope of usage. Addi-tionally, the various data sources that are most com-monly used in credit scoring models are reviewed andevaluated followed, most importantly, by the answer tothe question – How Good is Your Scoring Model? Asummary and suggestions for future industry attentionends the report.
Survey ApproachThe industry survey encompassed a highly struc-
tured questionnaire that contained 87 questions andaddressed all of the salient points that the Founda-tion’s research committee requested be considered.Survey responses were gathered from February 2009through April 2009. During the survey period, busi-ness in general was sluggish and particularly bad forthe leasing industry. As an example, as reported bythe Equipment Leasing and Financing Association(ELFA) in their Monthly Leasing and Financing IndexReport for April 2009, in February 2009 new leasingbusiness was down 37.7% compared to February2008, down 30.9% in March 2009 compared to March2008 and down 42.3% in April 2009 compared toApril 2008. During the same period charge-offs as apercentage of net receivables were up 75.8% in Febru-ary 2009, up 104.6% for March 2009 and up 72.1 forApril 2009 compared to the same months in the pre-vious year. Additionally, credit approvals as a percent-age of decisions submitted on a current month thisyear compared to the same month last year basis weredown 12.1%, 10.9% and 17.3% for the period Febru-ary 2009 through April 2009, respectively.Given the current leasing environment, the following
questions were considered important and are includedin the report’s summary:
1. Do recent lending institution failures outside the
EQUIPMENT LEASING & FINANCE FOUNDATION 3
S U R V E Y R E S U LT S : H O W G O O D I S Y O U R S C O R I N G M O D E L ?
Preface
4 EQUIPMENT LEASING & FINANCE FOUNDATION
S U R V E Y R E S U LT S : H O W G O O D I S Y O U R S C O R I N G M O D E L ?
equipment leasing industry underscore the risk of over-reliance on automated scoring models as opposed tohuman judgment, or are these practices primarily con-fined to other lenders?
2. What is the incidence of models designed for aspecific application being used for an application forwhich they were not designed?
3. What is the impact of the current economic down-turn on the predictive capacity of scoring models?Specifically, do factors such as the mortgage industrycrisis or fuel prices affect scorecard results?
4. Are there specific trends, practices and industrycontrols that exist which will affect the nature of po-tential exposures within the equipment leasing and fi-nance industry?
5. What are specific recommendations for remedialaction in areas where such problems exist?
6. With respect to the future of credit models arethere other factors, not usually included as model vari-ables that should be considered for inclusion in futuremodels?
7. What are the prevalent technologies utilized in de-veloping credit models? And is any one technology su-perior and if so how?
Number of RespondentsThe survey was e-mailed to over 500 members of the
ELFA. We received 81 survey responses and in manycases more than one individual from a given companyparticipated (124 in total). Many of the respondentsdid not complete the entire survey. However, we be-lieve that sufficient data was obtained so that certainvaluable conclusions can be made about the industry’suse of credit scoring models and how well models areperforming.
Market Segment ClassificationConsistent with “traditional” segmentation of the in-
dustry and in prior surveys, respondents were placedinto three categories: Banks (either separately-operat-ing subsidiary or integrated), Captives, and Independ-ent Financial Services companies. Definitions of thesevarious financing categories are as follows:
Bank - Equipment finance activities intermingledwith other bank functions, utilizing internal fundingsources; jurisdiction by Comptroller of the Currency(24.3% of respondents).
Captive - At least 51 percent of equipment financeportfolio consists of products produced by parentand/or affiliates (24.3% of respondents).
Independent, Financial Services - A company witha portfolio for its own account that may provide abroad range of financial products and services includ-ing leasing, lending, and may arrange transactions(51.4% of respondents).
The survey captures four leasing market segments:micro-ticket, small-ticket, middle ticket, and large-ticket. Defined as:
Micro-Ticket – The majority of the new business vol-ume booked in fiscal year 2008 had a transaction sizeof less than $25,000 (14.9% of respondents).
Small-Ticket – The majority of the new business vol-ume booked in fiscal year 2008 had a transaction sizebetween $25,000 and $250,000 (50.0% of respon-dents).
Middle-Ticket – The majority of the new businessvolume booked in fiscal year 2008 had a transactionsize between $250,000 and $5,000,000 (25.7% of re-spondents).
Large-Ticket – The majority of the new business vol-ume booked in fiscal year 2008 had a transaction sizeover $5,000,000 (9.5% of respondents).
Note: The “majority” of new business volume is not necessarily over50% of the total new volume. For instance, if the company booked$120,000,000 in new business volume, of which $40,000,000 was inSmall-Ticket, $50,000,000 in Middle-Ticket and $30,000,000 inLarge-Ticket, the majority of the new business volume would be in theMiddle-Ticket segment.
PredictiveMetrics, Inc. (PMI) has certain opinions, based on ourknowledge and experience, with respect to the industry’s use andmaintenance of credit scoring models and whether or not best prac-tices are being utilized in specific areas. Our feelings are provided inthe Summary and Conclusions section at the end of this report.
PredictiveMetrics, Inc.Albert Fensterstock, Senior Consultant
EQUIPMENT LEASING & FINANCE FOUNDATION 5
S U R V E Y R E S U LT S : H O W G O O D I S Y O U R S C O R I N G M O D E L ?
ObjectiveThis study was designed to determine how well
credit scoring models are performing within the leas-ing industry and whether there is over-reliance on au-tomated scoring models as opposed to humanjudgment. Have these tools been used beyond thescope of their original design, and is the current eco-nomic downturn having an impact on the predictivecapacity of scoring models? To answer these ques-tions the survey was designed to examine trends,practices and controls so that it would be possible toeither refute or confirm whether potential exposuresexist within the equipment leasing and finance indus-try and, thereby, recommend where attention may bewarranted both now and in the future.
Model Origination and ApplicationOf the companies that use statistical-based models,
32.4% utilize internal modeling groups to developthem, while 37.8% use outside contractors, and29.7% utilize a combination of both. With respect tojudgmental-based models, 68.6% of the companies’model development is done by in-house senior riskmanagement/credit staff, 5.7% utilize outside contrac-tors, and 27.5% of the companies use a combinationof both.The credit scoring models, both statistical and judg-
mental appear to be used mostly to aid in the evalua-tion of smaller sized transactions. Almost half of therespondents utilized both types of models. Statistical-based models were used to evaluate 96.6% of the totalnumber of micro-ticket (<$25,000) transactions,100% of the total number of small-ticket ($25,000 to$250,000) transactions, 62.5% of the total number ofmiddle-ticket ($250,000 to $5,000,000) and 31.6% ofthe total number of large-ticket (>$5,000,000) trans-actions, while judgmental-based models were used toevaluate 86.7% of the total number of micro-tickettransactions, 88.2% of the total number of small-ticket transactions, 62.5% of the total number of mid-dle-ticket transactions and 36.8% of the total numberof large-ticket transactions.
Current Model PerformanceAlmost 78% of the companies that responded to the
survey are using some form of credit scoring model;however, there was a strong indication from respon-dents that the downturn in the economy has and willproduce a significant increase in manual review ofmodel results. This was underscored by the fact thatalmost 66% of the companies’ feel that their model re-sults have been affected by the current economic con-ditions and 96.3% believe that the models are lessaccurate.
Current ImpactAbout 48.0% of the companies believe that there are
specific trends, practices and industry controls beingdeployed which will affect delinquency and loss rateswithin the equipment leasing and finance industry.Most frequently mentioned as steps that are beingtaken were the tightening of credit requirements andthat lenders are demanding more favorable transac-tion structures together with limiting their exposure.Additionally, there has already been a notable increasein the manual review of model decisions and marketsthat are considered marginal or more risky are beingde-emphasized or avoided entirely, however the actualmarkets were not disclosed for competitive reasons.There is also serious consideration of revalidation andadjustment of existing models; however the frequencyof future planned revalidation was also not explicitlystated. For the short term, prior to refitting or re-esti-mating existing models many companies have raisedtheir cut-off levels for credit acceptance, thereby mak-ing it more difficult for all but the best credit risks toobtain credit.
Future ImpactSome respondents thought that certain operating
procedures should be put into place, as soon as possi-ble, with the hope of mitigating some of the addi-tional risk perceived by their companies. Specifically,the increased use of business rules to guarantee man-ual review of applications from businesses in stressedsectors would very likely be accelerated together with
Executive Summary

6 EQUIPMENT LEASING & FINANCE FOUNDATION
S U R V E Y R E S U LT S : H O W G O O D I S Y O U R S C O R I N G M O D E L ?
requiring additional underwriting data (financialstatements, credit references, etc.) for applicationsfrom businesses in stressed sectors. Additionally, forconsumer models where the model is being used toevaluate a business owner, it was suggested that animprovement would be to rely less on off-the-shelfconsumer-type scores. It should be noted that the In-dustry does not include consumer financing and islimited to commercial transactions only.In the short term, putting more focus and reliance
on collection staff efforts and tools to effectively man-age portfolios and reduce delinquencies and write-offsis something that is being considered. Additionally,another short term strategy that may help to mitigatelosses is to workout extensions for existing troubledcustomers, where possible.In the longer term, developing new models using
information from this significant downturn as part ofthe model development database was indicated assomething that should be considered and althoughthis recession may be an anomaly, it would be a good
idea not to overly weight or under-weight the historyfrom this period, so that profitable lending opportuni-ties in the future will not be unnecessarily restricted.Additionally, as part of the model developmentprocess, if statistical- based models are being devel-oped, it can be determined which factors have thegreatest impact on losses during a downturn, whichmight provide an early warning system in the future.
How Good is Your Scoring Model?According to the survey findings a majority of the
leasing industry’s model users are not utilizing anytype of consistent statistically-based scoring perform-ance evaluation system and, therefore, may not reallyknow how well their models are performing. Only25.9% of the respondents indicated that they were re-ceiving regularly scheduled credit scoring perform-ance evaluation reports and of these respondents only51% indicated they were revalidating models on anannual frequency or less.

EQUIPMENT LEASING & FINANCE FOUNDATION 7
S U R V E Y R E S U LT S : H O W G O O D I S Y O U R S C O R I N G M O D E L ?
In general, judgmental and statistical-based systemsutilize a similar set of information about a company.In the judgmental-based system, the information isweighted by the senior risk management/credit per-sonnel developing the system according to their pastexperience, judgment, defined credit policy and per-sonal bias. Alternatively, in the statistical-based sys-tem, the weights are determined through a rigorousstatistical analysis performed by professional statisti-cians who are familiar with these types of models. Ifdesired, credit and collection policy rules can be in-corporated into a statistical-based model to improvemodel performance. In the development of a “new ap-plication” statistical-based model the following stepsare typically performed:
1. The model developers are provided with 18 to 24and perhaps 36 months or more of historical data, atthe customer level from a variety of sources includinginternal data, commercial bureau data, consumer bu-reau data and financial statement data.
2. This data serves as the basis for predicting futurecustomer payment activity.
3. The model is developed from the data by uncov-ering past trends, magnitudes and payment patterns,and formulizing this information to predict futurepayment performance.
4. Model results are validated by using actual cus-tomer payment activity, subsequent to the time ofscore, to evaluate the model’s ability to differentiatefuture problem payers from future timely payers.
5. The validation quantifies how accurately themodel predicted future customer payment behavior.
In the development of a statistical based model for“existing accounts”, the lessor’s accounts receivable,application data and other internal data is the basisfor model development. The addition of bureau,financial and other external data is optional basedupon availability and cost.In both judgmental-based and statistical-based
model development, the data used by the models con-sists of information such as: payment histories; bankand trade references; commercial and consumer credit
agency information; applicant financial statements;and various financial ratios to name some of thesources.
Model AssessmentGiven both judgmental-based and statistical-based
models can utilize the same data, some of the criticaldifferences between them are:
1. It is unlikely that any two judgmental-basedmodel developers would agree on the variables or theweights to be assigned for a given model. The factorsand their weights would be biased based upon eachindividual’s past experience and judgment, which isunlikely to be the same. In a statistical-based model,once the factors to be included in the model havebeen determined by various statistical tests, and stat-isticians may differ on which and how many variablesto include, the weights are assigned by the statisticalsoftware used for that purpose. Given the variables se-lected, there will be one best fitting model with somedifferences based upon the model developers skill set.
2. If the judgmental model, for what ever reason, isnot performing as well as hoped, it is extremely diffi-cult to determine which factor(s) and weight(s) needto be adjusted. In a statistical-based model, it is astraight forward process to determine which variablesare causing the problem and fix the model.
3. Judgmental models are rarely, if ever, validated.After the model is determined the developers do notgo back in time and say, “if we had this model sixmonths ago how well would it have predicted thenext six months?” A statistical-based system shouldalways be validated. It’s the validation process thattells how good the model is, and helps the developerdetermine whether it’s adequate for the purpose forwhich it has been developed.
4. Judgmental systems are not easy to build. And,this is probably the main reason that once in place,they are not frequently changed. Alternatively, be-cause of the availability of sophisticated and relativelyinexpensive statistical software, a statistical-basedmodel can be developed in less time than a judgmen-tal model that uses a wide range of input variables.
Overview of Model Types

5. Judgmental systems can not quantify risk. Theyare essentially ranking systems where the companywith the highest score is considered the best risk. Ajudgmental-model produced score cannot predict theprobability or odds that a given company will pay itsbill within any particular time period, which statisti-cal-based models do as a matter of course.
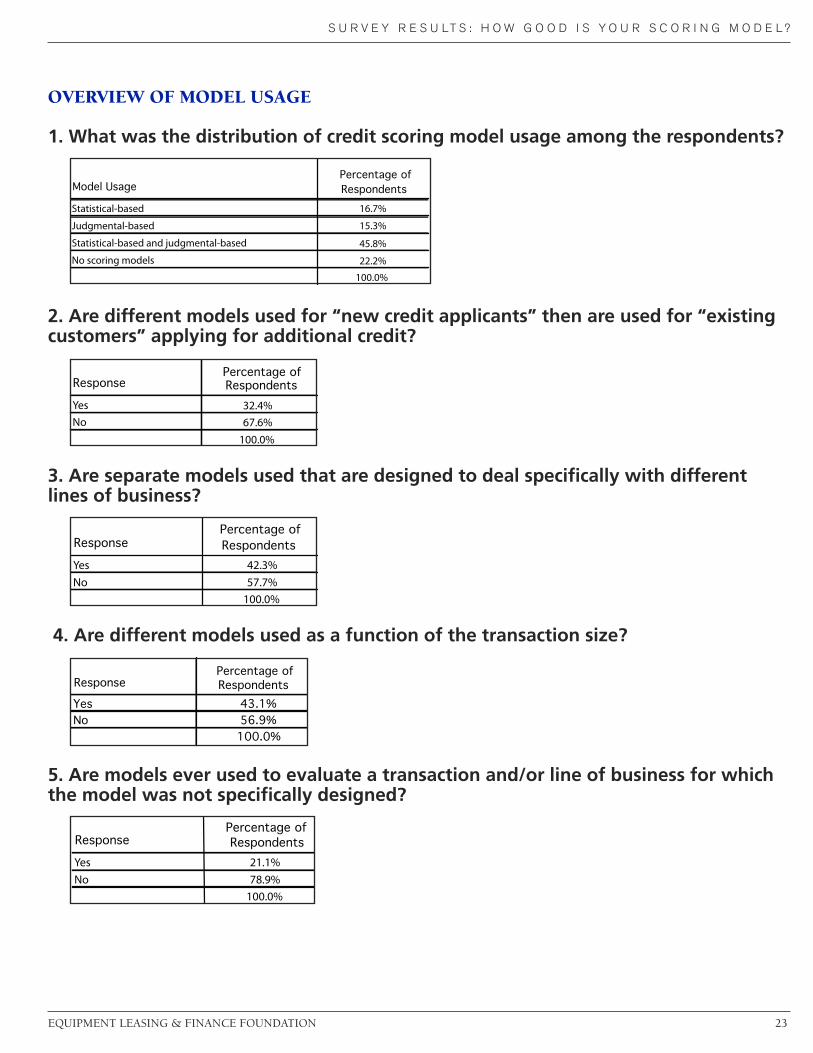
Credit Scoring Model Usage byRespondentsThe distribution by type of credit scoring model
usage by the respondents was as follows:
Only 32.4% of the model users indicated that theyused different models for “new applicants” than for“existing customers”. It should be noted that the pay-ment behavior of existing customers is at the granularlevel (detailed payment history and monthly aged ac-counts receivable balances) - data which has beenproven to be the most predictive for risk managementpurposes. This is data which if we have interpretedthis answer correctly is not used by 67.6% of the re-spondents for evaluating existing customers request-ing additional credit. We arrived at this conclusionbecause these companies indicated that they are usingthe same model for existing customers as they are fornew applicants, where granular level payment data isnot available and only payment history at a higherlevel with previous lenders is possible model input.Separate models are used by 42.3% of the respon-
dents to deal with different lines of business and43.1% of the respondents use different models de-pending on the transaction size. It should be notedthat the more sophisticated the model user, the moregranular the model development, providing there issufficient data available to develop segmented models,i.e. develop alternative models for different lines ofbusiness and/or different transaction sizes. One of thecriteria used for determining whether it is possible to
segment a population is the number of “BADs”, i.e.,the population of customers that meet the definitionof a bad account in the data sample. If there are not asufficient number in the data sample, and statisticiansdiffer as to how many are required (this is one of theareas where statistics is an art rather than a science),you do not have sufficient data to segment the model.This does not necessarily mean that the companiesthat answered “yes” achieve better predictability. Thecompanies that answered “no” could use more fre-quent and detailed manual reviews to achieve their re-quired level of comfort for a given risk analysis.About 21% of the respondents are using models to
evaluate transactions and/or lines of business that themodels were not designed for. These companies maybe taking a larger risk then they think they are, and aswas indicated by the original model developmentwork. In general, you do not want to use a model de-veloped to evaluate a particular population to evalu-ate a different population as the risk metrics can becompletely different. In fact, independent modelingcompanies will usually not warrant models developedfrom one population that are used to evaluate a differ-ent population. Fortunately, however, for our samplepopulation there was no indication that this practicewas causing a significant problem.
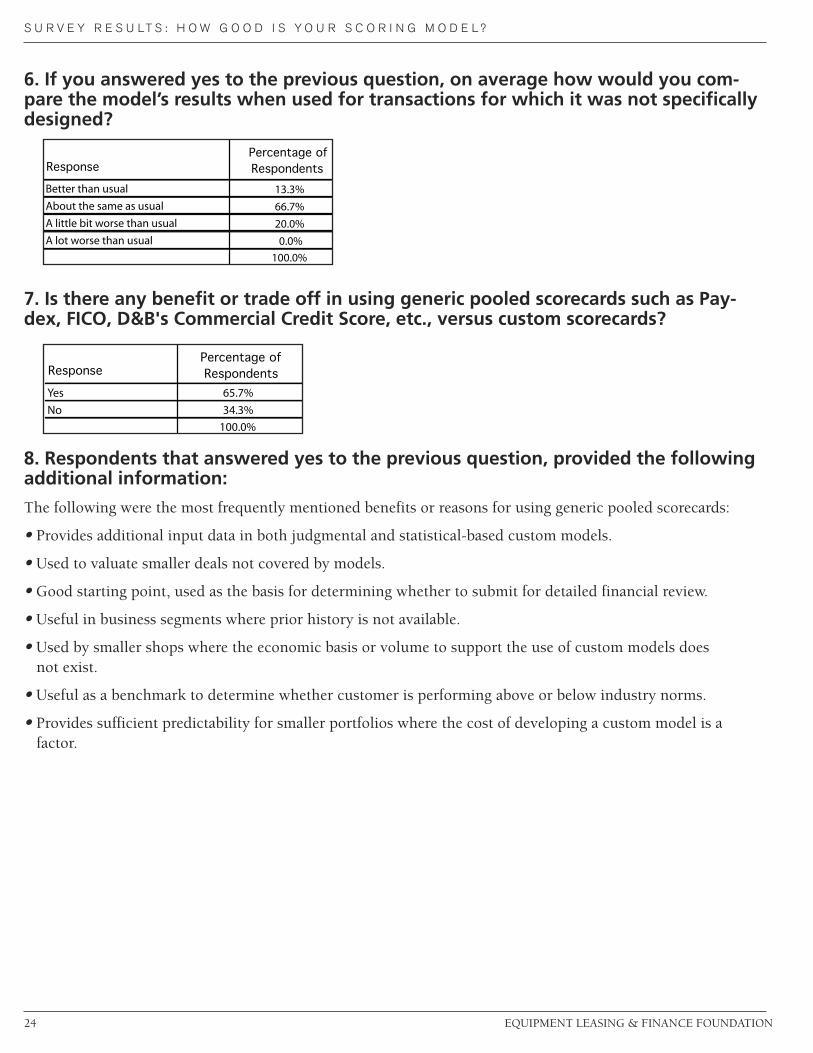
Some Thoughts on Generic ScorecardsAbout 65.7% believe that there are benefits in using
generic scorecards compared to or together with cus-tom scorecards. The benefits most frequently men-tioned were:
• Provides additional input data in both judgmentaland statistical-based custom models.
•They can help to evaluate smaller deals not cov-ered by models.
•They are a good starting point for decidingwhether to submit the transaction for detailed finan-cial review.
•They are useful in business segments where priorhistory is not available.
•They are useful in smaller shops where the eco-nomic basis or volume to support the use of custommodels does not exist.
8 EQUIPMENT LEASING & FINANCE FOUNDATION
S U R V E Y R E S U LT S : H O W G O O D I S Y O U R S C O R I N G M O D E L ?
Model UsagePercentage ofRespondents
16.7%
15.3%
45.8%
22.2%
100.0%
Statistical-based
Judgmental-based
Statistical-based and judgmental-based
No scoring models

•They can provide a benchmark to determinewhether a customer is performing above or below in-dustry norms.
•They provide sufficient predictability for smallerportfolios where the cost of developing a custommodel is not justified.
Planned ChangesWhen asked what, if anything, survey respondents
were planning with respect to their current scoringpractices, the respondents indicated that some combi-nation of the following was most likely to occur:
•Increase reliance on manual/judgmental decisions– 50.0%
•Revalidate and adjust existing scorecards – 42.2%
•Develop new scorecards – 21.9%
•Raise cut-off scores as a means of tightening credit– 16.0%
•Increase due diligence and apply stricter manualand judgmental evaluation – 9.4%
•Increase the amount of down payments – 3.1%.
STATISTICAL-BASED MODELSThe technology used to develop statistical-based
models is centered on two methodologies. Approxi-mately 85% are using either or both logistic regres-sion and discriminant analysis, predominately fortransactions up to $250,000. Other technologies men-tioned were, other types of regression analysis, andgenetic algorithms. No respondent mentioned theywere using neural network technology. Additionally,12.1% use generic scorecards either as a stand-aloneevaluator or as input to their models, and 3.0% use atechnique called reject inference.The personnel used to develop models are about
evenly split among three categories: 32.3% are devel-oped in-house, 37.8% utilized an outside contractorand 29.7% used a combination of both. As for thenumber of models in use for a given company, onecompany utilized more than 50 models, two compa-nies utilized between 21 and 50 models and one com-pany utilized between 11 and 20 models. The average
number of models utilized by the remaining 89.5% ofthe respondents was between 3 and 4. As mentionedpreviously, the more sophisticated model user, pro-vided the data is available, will build numerous mod-els as a function of business type and/or transactionsize as a method to provide additional model predic-tiveness. For example, a model developed specificallyfor a given business segment and transaction size, sayoffice equipment leasing less than $10,000 will mostlikely do a better job on that class of customers than ageneral model developed for any type of lessor for anytransaction size if for no other reason than the vari-ance between possible customers has been signifi-cantly reduced..
When and how are Models Used?Models are used 3.4 times more frequently to aid in
the evaluation of transactions up to $250,000 than forlarger transactions and 89.5% use some type of auto-decisioning either for approval or decline. However, itwas also indicated that there will be increased manualreview of model decisions in the future.Manual reviews are performed greater than 50.0% of
the time by from 34.5% to 60.0% of the respondents,based on the transaction size. This seems to indicatethat regardless of the transaction size, there is a gen-eral feeling that models are not perfect and profes-sional judgment needs to be applied frequently tosupport a model’s decision. Additionally, in most in-stances, the greater the risk, the more likely a manualreview will be performed.Based on the survey responses, manual reviews fre-
quently wind up changing a model’s auto-decision.On average, only 15.1% of the respondents indicatedthat a manual review never changes a model’s auto-approval decision, 74.2% indicated it changed themodel’s decision up to 50.0% of the time and 10.8%indicated it changed the model’s decision over 50.0%of the time. Alternatively, if the auto-decision wasnegative, only 12.0% of the respondents indicatedthat a manual review had never changed a model’s de-cision, 53.0% indicated it changed the model’s deci-sion up to 50% of the time and 35.0% indicated itchanged the model’s decision over 50% of the time.Of interest here is the high percentage of the time anegative decision was overridden. Companies do not
EQUIPMENT LEASING & FINANCE FOUNDATION 9
S U R V E Y R E S U LT S : H O W G O O D I S Y O U R S C O R I N G M O D E L ?

10 EQUIPMENT LEASING & FINANCE FOUNDATION
S U R V E Y R E S U LT S : H O W G O O D I S Y O U R S C O R I N G M O D E L ?
want to lose business because of a model’s decisionand many companies have a policy of reviewing allmodel declines over a certain amount.Another thing of note is that almost 40.0% of the
respondents have raised their auto-approval cut-off asa method of tightening credit due to the current eco-nomic conditions, and that as a result there was froma 5.0% to 25.0% decrease in auto-approvals withabout the same number above as below the meanvalue of a 15.0% decrease. As expected, increasing thecut-off definitely has a material impact and will signif-icantly reduce the amount of credit granted by auto-approvals and, thereby, the risk a leasing company iswilling to assume.With respect to the maximum portfolio exposure
a respondent was willing to take on an “existingcustomer” based purely on a model’s auto-approval,37.5% would not be willing to risk any exposure,essentially indicating that they do not use auto-approvals. The complete distribution of the maximumportfolio risk that the 24 respondents were willing toassume is:
JUDGMENTAL-BASED MODELSModel development by senior risk management/
credit staff accounts for 68.6% of development, out-side contractors were used only 5.7% of the time anda combination of both accounted for 25.7%. As forthe number of judgmental models in use, in a givencompany, only three companies indicated that theywere using more that five models. On average, com-panies that use judgmental-based models use slightlyfewer models than companies that use statistical-based models.In most cases, when the information is available,
the data used by a judgmental system consists of:payment histories; bank and trade references; credit
agency ratings and financial statements and ratios.The factors and weights used by a given companyare based on the past experience and judgment ofthe credit personnel developing the system.
When and How are Models Used?Similar to the use of statistical-based models, judg-
mental-based models are used far more frequently toaid in the evaluation of transactions up to $250,000than for larger transactions. In our experience, thereis a limit which differs from company to company, be-yond which a company will not risk a credit decisionbased solely on a model’s judgment. Beyond thatpoint, a financial analyst will always be involved inthe final decision.Manual reviews are performed greater than 50% of
the time by from 31.0% to 47.8% of the respondents,based on the transaction size. Therefore, whether themodel is statistical or judgmental the use of profes-sional judgment to support a model’s decision waswidely utilized.Manual reviews frequently change a judgmental
model’s auto-decision. On average, only 19.4% of therespondents indicated that a manual review neverchanges a model’s auto-approval decision, 72.4% indi-cated it changed the model’s decision up to 50.0% ofthe time and 7.1% indicated it changed the model’sdecision over 50.0% of the time. Alternatively, if theauto-decision was negative, 23.0% of the respondentsindicated that a manual review had never changed amodel’s decision, 67.0% indicated it changed themodel’s decision up to 50% of the time and 10.0% in-dicated it changed the model’s decision over 50.0% ofthe time compared to 35% of statistical-based modelusers. As noted previously, companies do not want tolose business based on a model’s decision withoutsome level of manual financial review that supportsthe model.With respect to the maximum portfolio exposure a
respondent was willing to risk on an “existing cus-tomer” based purely on a model’s auto-approval,47.8% would not be willing to risk any exposure, i.e.,they do not use auto-decisioning, The complete dis-tribution of the maximum portfolio risk that the 23respondents were willing to assume is:
Maximum PortfolioExposure ($)
Percentage ofRespondents
0 37.5%>0 to 50,000 8.3%
>50,000 to 100,000 29.2%>100,000 to 500,000 8.3%
>500,000 to 1,000,000 16.7%100.0%

EQUIPMENT LEASING & FINANCE FOUNDATION 11
S U R V E Y R E S U LT S : H O W G O O D I S Y O U R S C O R I N G M O D E L ?
For “new applicants” 45.5% were not willing to takeany risk based on a model’s auto-approval: The com-plete distribution of the maximum portfolio risk thatthe 22 respondents were willing to assume is:
GENERAL MODEL QUESTIONSDuring the last twelve months economic conditions
have significantly affected their models’ predictive-ness according to 65.9% of the respondents. Addition-ally, of those that indicated there had been a change,96.3% said their models have been less accurate inpredicting delinquency or loss.Assuming that the accuracy of models has been af-
fected, we wanted to know what has been the positiveor negative percent change in predicting delinquencyor loss? According to the 19 companies that providedactual percentage information the impact of thechange in model accuracy ran the entire gamut from0% change in accuracy of loss prediction or estimatedbad rate to 100%, as follows:
Expected Changes in the Industry ThatMight Affect Delinquency and Loss RatesRespondents were about evenly split as to whether
there were specific trends, practices and industrycontrols in existence which will effect current delin-quency and loss rates within the equipment leasingand finance industry. Of the companies that thoughtsuch factors were in existence, the following activitieswere the only ones mentioned by more than onerespondent:
•Credit requirements have tightened and lenders aredemanding more favorable transaction structures, andreduced exposure limits.
•Additional manual reviews are occurring.
•Marginal markets have been exited.
•Revalidation and adjustment of models is moreprevalent.
When asked what remedial action they recom-mended in areas where problems were perceived thefollowing were recommended:
•Increased use of business rules to ensure manualreview of applications from businesses in stressedsectors.
•Increased requirements for additional underwrit-ing data (i.e., financial statements, credit references,etc.) for applications from businesses in stressedsectors.
•Redlining industries at a more granular level - Forexample 4-digit SIC rather than 2-digit industry seg-ments at the filter level (i.e. 65xx - Real Estatewhereas 4-digits distinguish between commercial andconsumer real estate segments).
•For consumer models, rely less on off-the-shelfconsumer-type scores.
•Developing new models using data from this sig-nificant downturn as part of the basis. However, itwas suggested not to overly weight the history fromthis recession, as the future may not look like the re-cent past and you do not want to unnecessarily re-strict profitable lending opportunities in the future.
Maximum PortfolioExposure ($)
Percentage ofRespondents
0>0 to 50,000
>50,000 to 100,000>100,000 to 250,000>250,000 to 500,000
47.8%17.4%13.0%13.0%4.3%
>500,000 to 750,000 4.3%100.0%
Maximum PortfolioExposure ($)
Percentage ofRespondents
0>0 to 50,000
>50,000 to 100,000>100,000 to 500,000
>500,000 to 1,000,000
45.5%27.3%
4.5%22.7%
0.0%100.0%
% Change in Model Accuracy Percentage of Respondents0% 10.5%>0% to 5% 10.5%
>5% to 10% 26.3%>10 to 20% 26.3%
>20% to 30% 10.5%>30% to 50% 10.5%>50% to 99% 0.0%
>99% 5.3%

12 EQUIPMENT LEASING & FINANCE FOUNDATION
S U R V E Y R E S U LT S : H O W G O O D I S Y O U R S C O R I N G M O D E L ?
•Use the current recession as an opportunity to ex-amine which factors have the greatest impact onlosses during a downturn the like of which has notbeen experienced since the depression.
•Workout extensions for existing troubled cus-tomers, if possible.
•Aggressively monitor all significant exposures andtake immediate action to protect the value of assets.These measures may vary based on the specific collat-eral and customer relationship.
•The industry should develop true peer group datasimilar to FDIC bank peer data to assist equipment fi-nance firms in monitoring the quality of their portfo-lios, in general.
•Focus and rely more on collection staff efforts andtools to effectively manage portfolios and reducedelinquency/write-off roll rates.
•Change how rating agencies are compensated. Theissuer who seeks a rating is paying their bill. To createa more arms length transaction, the investor or con-duit should be paying this bill, thereby ensuring thatthe rating agencies are working in their best interestand not for the issuers.
New Generic ScoresOnly 23.3% of the companies that responded were
aware of new generic scores that are available orunder development that might be applicable to theequipment leasing industry. Of those companiesthat were aware of new developments, the followingwere mentioned as new capabilities available to theindustry:
•Additional Paynet functionality.
•New products from D&B.
•Oliver Wyman LGD studies.
•Revised lease analysis product suite from PMI.
Product Types
Application Only LeasesA little over 82% of the companies that answered
the question (37 companies) accept application onlyleases where additional financial information beyondthat requested on the application is not required. Themaximum exposure these companies were willing toaccept ranged from $0 to $750,000. The distributionof the 24 companies that provided dollar limits is:
Only 23% of the respondents indicated that therehad been a significant increase in requests for applica-tion only leases over the last year.
Deferred Payment ProgramsA little over 59.0% of the companies that answered
the question (26 companies) provide deferred pay-ment programs. The maximum exposure these com-panies were willing to accept ranged from $5,000 to$20,000,000. One company was willing to accept$5,000,000 and one company was willing to accept$20,000,000. The distribution of the 12 companiesthat provided dollar limits is:
Only 25% of the respondents indicated that therehad been a significant increase in requests for de-ferred payment programs over the last year.
Maximum PortfolioExposure ($)
Percentage ofRespondents
0>0 to 50,000
>50,000 to 100,000
4.2%12.5%41.7%
>100,000 to 250,000 20.8%>250,000 to 500,000 16.7%>500,000 to 750,000 4.2%
100.0%
Maximum PortfolioExposure ($)
Percentage ofRespondents
0>0 to 50,000
>50,000 to 100,000
0.0%16.7%16.7%
>100,000 to 500,000 41.7%
>500,000 to 1,000,000 8.3%
>1,00,000 to 5,000,000 8.3%
>5,000,000 8.3%100.0%
EQUIPMENT LEASING & FINANCE FOUNDATION 13
S U R V E Y R E S U LT S : H O W G O O D I S Y O U R S C O R I N G M O D E L ?
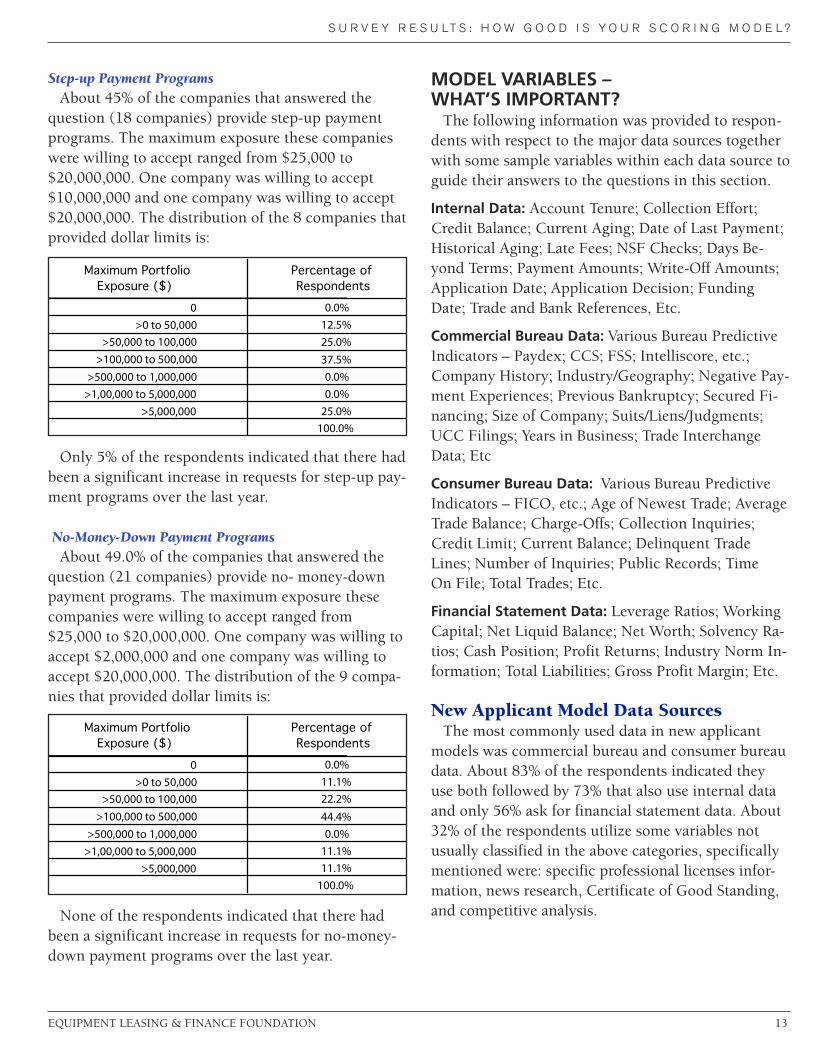
Step-up Payment ProgramsAbout 45% of the companies that answered the
question (18 companies) provide step-up paymentprograms. The maximum exposure these companieswere willing to accept ranged from $25,000 to$20,000,000. One company was willing to accept$10,000,000 and one company was willing to accept$20,000,000. The distribution of the 8 companies thatprovided dollar limits is:
Only 5% of the respondents indicated that there hadbeen a significant increase in requests for step-up pay-ment programs over the last year.
No-Money-Down Payment ProgramsAbout 49.0% of the companies that answered the
question (21 companies) provide no- money-downpayment programs. The maximum exposure thesecompanies were willing to accept ranged from$25,000 to $20,000,000. One company was willing toaccept $2,000,000 and one company was willing toaccept $20,000,000. The distribution of the 9 compa-nies that provided dollar limits is:
None of the respondents indicated that there hadbeen a significant increase in requests for no-money-down payment programs over the last year.
MODEL VARIABLES –WHAT’S IMPORTANT?The following information was provided to respon-
dents with respect to the major data sources togetherwith some sample variables within each data source toguide their answers to the questions in this section.
Internal Data: Account Tenure; Collection Effort;Credit Balance; Current Aging; Date of Last Payment;Historical Aging; Late Fees; NSF Checks; Days Be-yond Terms; Payment Amounts; Write-Off Amounts;Application Date; Application Decision; FundingDate; Trade and Bank References, Etc.
Commercial Bureau Data: Various Bureau PredictiveIndicators – Paydex; CCS; FSS; Intelliscore, etc.;Company History; Industry/Geography; Negative Pay-ment Experiences; Previous Bankruptcy; Secured Fi-nancing; Size of Company; Suits/Liens/Judgments;UCC Filings; Years in Business; Trade InterchangeData; Etc
Consumer Bureau Data: Various Bureau PredictiveIndicators – FICO, etc.; Age of Newest Trade; AverageTrade Balance; Charge-Offs; Collection Inquiries;Credit Limit; Current Balance; Delinquent TradeLines; Number of Inquiries; Public Records; TimeOn File; Total Trades; Etc.
Financial Statement Data: Leverage Ratios; WorkingCapital; Net Liquid Balance; Net Worth; Solvency Ra-tios; Cash Position; Profit Returns; Industry Norm In-formation; Total Liabilities; Gross Profit Margin; Etc.
New Applicant Model Data SourcesThe most commonly used data in new applicant
models was commercial bureau and consumer bureaudata. About 83% of the respondents indicated theyuse both followed by 73% that also use internal dataand only 56% ask for financial statement data. About32% of the respondents utilize some variables notusually classified in the above categories, specificallymentioned were: specific professional licenses infor-mation, news research, Certificate of Good Standing,and competitive analysis.
Maximum PortfolioExposure ($)
Percentage ofRespondents
0>0 to 50,000
>50,000 to 100,000>100,000 to 500,000
>500,000 to 1,000,000>1,00,000 to 5,000,000
>5,000,000
0.0%12.5%25.0%37.5%0.0%0.0%
25.0%100.0%
Maximum PortfolioExposure ($)
Percentage ofRespondents
0>0 to 50,000
>50,000 to 100,000>100,000 to 500,000
>500,000 to 1,000,000>1,00,000 to 5,000,000
>5,000,000
0.0%11.1%22.2%44.4%0.0%
11.1%11.1%
100.0%
Existing Customer Model Data SourcesThe most commonly used data in existing customer
models was internal data, About 90% indicated theyuse it followed by consumer and commercial bureaudata, about 80% for each and only 54% use or ask forfinancial statement data. About 27% of the respondentsutilize some variables not usually classified in theabove categories, specifically mentioned were: news re-search, collateral value and competitive analysis.
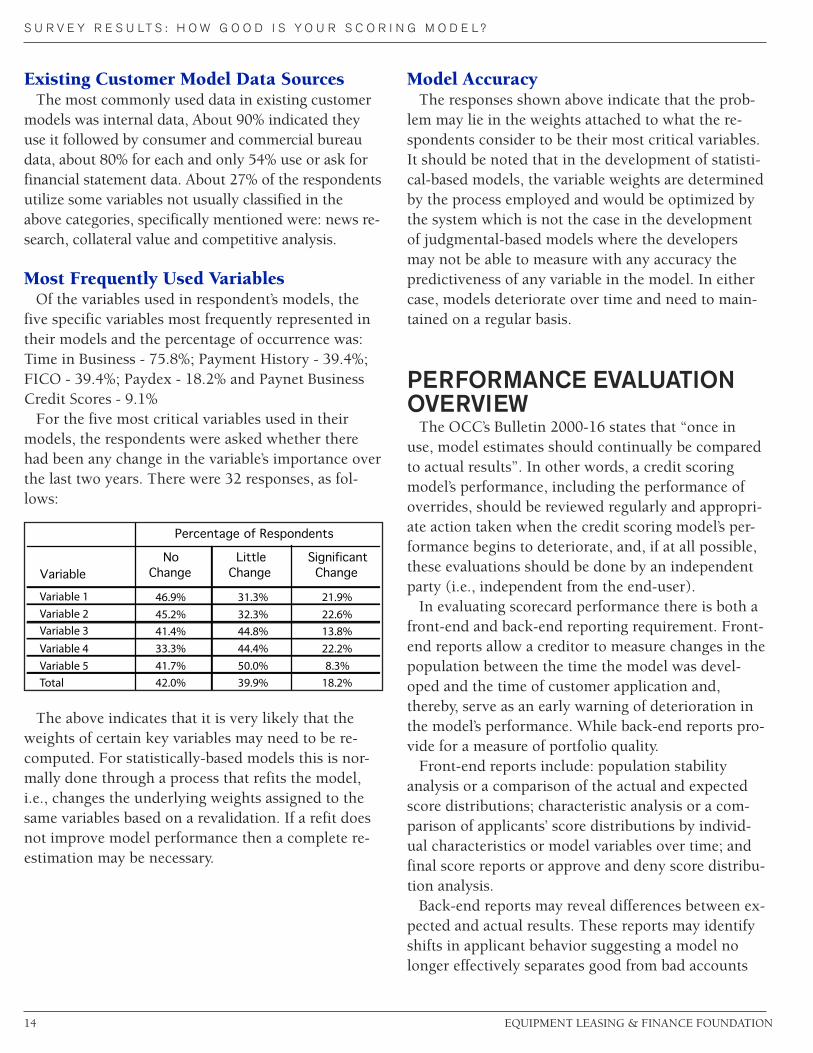
Most Frequently Used VariablesOf the variables used in respondent’s models, the
five specific variables most frequently represented intheir models and the percentage of occurrence was:Time in Business - 75.8%; Payment History - 39.4%;FICO - 39.4%; Paydex - 18.2% and Paynet BusinessCredit Scores - 9.1%For the five most critical variables used in their
models, the respondents were asked whether therehad been any change in the variable’s importance overthe last two years. There were 32 responses, as fol-lows:
The above indicates that it is very likely that theweights of certain key variables may need to be re-computed. For statistically-based models this is nor-mally done through a process that refits the model,i.e., changes the underlying weights assigned to thesame variables based on a revalidation. If a refit doesnot improve model performance then a complete re-estimation may be necessary.
Model AccuracyThe responses shown above indicate that the prob-
lem may lie in the weights attached to what the re-spondents consider to be their most critical variables.It should be noted that in the development of statisti-cal-based models, the variable weights are determinedby the process employed and would be optimized bythe system which is not the case in the developmentof judgmental-based models where the developersmay not be able to measure with any accuracy thepredictiveness of any variable in the model. In eithercase, models deteriorate over time and need to main-tained on a regular basis.
PERFORMANCE EVALUATIONOVERVIEWThe OCC’s Bulletin 2000-16 states that “once in
use, model estimates should continually be comparedto actual results”. In other words, a credit scoringmodel’s performance, including the performance ofoverrides, should be reviewed regularly and appropri-ate action taken when the credit scoring model’s per-formance begins to deteriorate, and, if at all possible,these evaluations should be done by an independentparty (i.e., independent from the end-user).In evaluating scorecard performance there is both a
front-end and back-end reporting requirement. Front-end reports allow a creditor to measure changes in thepopulation between the time the model was devel-oped and the time of customer application and,thereby, serve as an early warning of deterioration inthe model’s performance. While back-end reports pro-vide for a measure of portfolio quality.Front-end reports include: population stability
analysis or a comparison of the actual and expectedscore distributions; characteristic analysis or a com-parison of applicants’ score distributions by individ-ual characteristics or model variables over time; andfinal score reports or approve and deny score distribu-tion analysis.Back-end reports may reveal differences between ex-
pected and actual results. These reports may identifyshifts in applicant behavior suggesting a model nolonger effectively separates good from bad accounts
S U R V E Y R E S U LT S : H O W G O O D I S Y O U R S C O R I N G M O D E L ?
14 EQUIPMENT LEASING & FINANCE FOUNDATION
NoChange
LittleChange
SignificantChange
46.9% 31.3% 21.9%45.2% 32.3% 22.6%41.4% 44.8% 13.8%33.3% 44.4% 22.2%41.7% 50.0% 8.3%
Total 42.0% 39.9% 18.2%
Variable 3Variable 4Variable 5
Percentage of Respondents
VariableVariable 1Variable 2

(see note below) and may identify deterioration in themodel's ability to rank risk performance of the com-pany’s current or future applicant pool.Note: The definition of a bad account is usually
based upon the account becoming severely delinquentor going to loss or bankruptcy over a specified per-formance period. A common form for a Bad Defini-tion might be that: an account is considered bad if morethan 15% of the monthly outstanding balance ages toover 180 days past due, or incident of write-off, or bank-ruptcy occurs within 18 months (the performance pe-riod) of scoring. Accounts that do not reach this stateof delinquency are considered good. The bad rate isthe percentage of the accounts in the total population,for a given period, that meet the Bad Definition.
Frequency of Performance Evaluationand ContentOnly 21 of the respondents stated that they were
performing some type of regularly scheduled perform-ance evaluation. Given the small number of re-sponses, we can not state with any assurance what thenon-respondents are doing to evaluate their models’performance. As this question was answered by only36 of the respondents, the implication is that 74.1%of the total respondents are not regularly evaluatingtheir model’s performance. Again due to the smallnumber of responses we can not infer what the gen-eral population is doing with any degree of certainty.Of the 21 companies doing scheduled performanceevaluation, 71.4% are using personnel to evaluatemodel performance that are independent of model de-velopment.Even among respondents that are doing some type
of model evaluation there was no consistency of re-view. In other words, for the same respondent, somemodels were evaluated every six months and somewere evaluated every 36 months, if at all.If a respondent is doing performance evaluation
then the system always contains back-end reports and90% of the time front-end reports as well.
Model PerformanceIt was hoped that it would be possible to find out
how well scoring models were performing. One wayof determining how well a model is performing is to
compare its development sample bad rate to a valida-tion sample bad rate. Another way is to compare theaverage credit score in the development sample to theaverage credit score in a validation sample. Unfortu-nately too few respondents answered these questions,so, we cannot state with any assurance that the resultsare representative of how models are performing. Theabove procedure is usually only applicable for statisti-cal-based models as the modeling procedure producesthese statistics as a matter of course. It is possible togather similar statistics for judgmental-based models,however, the back testing required is rarely per-formed.Of those that responded, only 50.1% of the models
were evidencing a difference between the develop-ment sample bad rate and the validation sample badrate of between 5% and -5% which might indicate thatthe other 49.9% of the models need to be modified(refitted) with respect to the weights of certain vari-ables, or if the percent difference is very large com-pletely re-estimated.Additionally, about half the models are showing lit-
tle change in the average risk score and half are evi-dencing a measurable difference. Those companiesthat indicated that the validation bad rate or averagerisk score for a model is greater than 5% of the devel-opment sample bad rate or average risk score shouldconsider revalidating those models and, thereby, de-termine whether a model refit or a re-estimate iscalled for. The revalidation process would examinebad capture curves, KS statistics, among other statisti-cal measures.
Alternatives Utilized Instead of a RegularlyScheduled Scoring Performance EvaluationFifteen companies replied that they do not have any
type of formal scoring performance evaluation sys-tem. They indicated that they use the procedureslisted below to determine how well their models areperforming. Most of the procedures identified beloware designed to address portfolio performance, but donot provide information as to how well the model isperforming.
•Perform a static pool analysis. This is a procedurewhere a pool of loans from a specific time period has
S U R V E Y R E S U LT S : H O W G O O D I S Y O U R S C O R I N G M O D E L ?
EQUIPMENT LEASING & FINANCE FOUNDATION 15

16 EQUIPMENT LEASING & FINANCE FOUNDATION
S U R V E Y R E S U LT S : H O W G O O D I S Y O U R S C O R I N G M O D E L ?
ongoing analysis conducted upon it. Analysis wouldexamine such things as delinquency, prepayments andrate of return and, thereby, provide a true return on apool of loans. As an example, for a given time periodthe following might be determined:
o Beginning/ending number of leases in periodstill active
o Amortization during periodo Prepayments during periodo Delinquencies at end of periodo Gross/net losses during period
•Independent portfolio analysis by an outside con-tractor.
•Use of monthly and historical delinquencydata/loss data to monitor applications that were ap-proved under application only guidelines.
•Review samples of non-performing loans and eval-uate various factors such as geographic location, timein business and commercial/personal credit scores todetermine if any of these factors could have predictedthe lease defaulting.
•Utilize a tracking report that measures populationstability and model characteristic analysis that alsochecks that the score, and its component elements,are rank ordering risk.
•Analyze actual vs. predicted loan results over time.
•Perform an analysis each quarter utilizing a systemdeveloped in-house.
•Review delinquencies and repossessions.
•Evaluate each incident of loss to understand whatwent wrong in the underwriting and modify their risktolerance for that specific category of customer orasset category. Additionally, look at portfolio composi-tion quarterly and monitor exposures.
•Perform various types of internal analyses, such asprofit margin and delinquency based on FICO, bal-ance, equipment, and equipment supplier.
•Evaluate portfolio performance within variouscredit score ranges.
Summary and ConclusionsAt the beginning of this report, a number of ques-
tions were listed that this survey was designed to an-swer. These questions were considered to be ofsignificant interest to the industry as specified by theEquipment Leasing and Finance Foundation. The fol-lowing are the answers to the questions, based on theinformation provided by the respondents:
1. Do recent lending institution failures outside theequipment leasing industry underscore the risk ofover-reliance on automated scoring models in placeof human judgment, or are these practices primarilyconfined to other lenders?
The lessors that responded are not placing an over-reliance on automated scoring models. In excess of80% of the respondents perform manual reviews ofboth judgmental-based and statistical-based model re-sults. In addition many of the respondents indicatedthat the manual review may change the model’s deci-sion regardless of whether it was an accept or a de-cline.
PredictiveMetrics’ Observation:To a great extent the lending institution failures out-
side of the equipment leasing industry were consumerbased - the so called sub-prime crisis. These failureswere triggered by a lack of any type of credit evalua-tion - sometimes called “liars loans” by the press. Inother words, there was no reliance on automated scor-ing models as they weren’t used or if they were theirjudgment was ignored. The leasing industry did notutilize these practices, but was affected because of thealmost complete collapse of our financial system andits effect on many of the industries that are majorleasers. These companies found the demand for boththeir products and services significantly reduced andthis caused them to significantly reduce their demandfor leasing services.
2. What is the incidence of models designed for aspecific application being used for an application forwhich they were not designed?
Models are used by 21.1% of the respondents fortransactions and/or lines of business for which theywere not designed. Only 20% of the respondents indi-

EQUIPMENT LEASING & FINANCE FOUNDATION 17
S U R V E Y R E S U LT S : H O W G O O D I S Y O U R S C O R I N G M O D E L ?
cated that the results were a little worse than usual,and none of the respondents indicated that the resultswere a lot worse than usual.
PredictiveMetrics’ Observation:It is PMI’s opinion that using a model designed for
one population to evaluate a different population is arisky practice and, furthermore, the amount of riskbeing taken is unknown. Only if a validation is per-formed for the population not originally included in amodel’s development where the risk is determinedcan the user have an understanding of the risk theyare actually taking.An analogous situation is that only 32.4% of the
model users indicated that they used different modelsfor “new applicants” than for “existing customers”. Asnoted previously, the payment behavior of existingcustomers is at the granular level (detailed paymenthistory and monthly aged accounts receivable bal-ances) - data which has been proven to be the mostpredictive for risk management purposes. This is datathat is not used by 67.6% of the respondents for eval-uating existing customers requesting additionalcredit.It is PMI’s judgment that if you are trying to esti-
mate the risk inherent risk in a customer’s paymentsover time, not using the actual payment data availablewill very likely provide far less than the optimum re-sult.
3. What is the impact of the current economicdownturn on the predictive capacity of scoring mod-els? Specifically, do factors such as the mortgage in-dustry crisis or fuel prices affect scorecard results?
A significant majority of the respondents (65.9%)indicated that the current economic conditions haveaffected their models predictiveness. And, 96.3% ofthose indicated that their models were less accurate inpredicting delinquency or loss. One company indi-cated it had experienced a 50% negative increase andone company experienced a 100% negative increasein loss prediction or estimated bad rate. The balanceof the responses ranged from negative increases of 2%to 25% and averaged about 15% in increased esti-mated bad rate. There was no indication of the spe-cific factors that might have affected model accuracy.
PredictiveMetrics’ Observation:Based on PMI’s experience, the decrease in model
accuracy may not necessarily have been caused by thecurrent economic downturn. A model measures creditworthiness, and in an economic downturn a modelmay evidence a decrease in credit worthiness throughan increase in applicant bad rates over the throughthe door population (new applicants) or a decrease inthe average applicant credit score indicating highercredit risk. Both of which would affect model results,but does not necessarily mean that the model is notworking if the applicant population has becomeriskier. Furthermore, the use of Behavior Score tech-nology (portfolio scoring models) would help tomake a current assessment of any change in risk sinceorigination. Additionally, models deteriorate overtime, and if a model has not been revalidated withinthe last 12 to 18 months, it is possible that the modelis no longer measuring credit risk accurately. There-fore, it may not be the economy that is the problem,but just a lack of proper model maintenance.
4. Are there specific trends, practices and industrycontrols that exist which will affect the nature of po-tential exposures that exist within the equipmentleasing and finance industry?
Approximately 50% of the respondents answeredthis question affirmatively. Most frequently men-tioned was that credit requirements are tightening andlenders are demanding more favorable transactionstructures, and reduced exposure limits. Additionally:
•Companies have increased the percentage of man-ual reviews
•Certain marginal markets are not being servicedany more.
•Revalidation and adjustment of models is occur-ring on a more frequent basis.
PredictiveMetrics’ Observation:Our recent experience indicates that many of our
clients are using two basic strategies to reduce theirpotential exposure to future loss:
•They are raising their auto-approval cut-off levels,thereby making it more difficult for riskier applicantsto get credit without a manual review. This is very

18 EQUIPMENT LEASING & FINANCE FOUNDATION
S U R V E Y R E S U LT S : H O W G O O D I S Y O U R S C O R I N G M O D E L ?
likely evidenced by the fact that 35% of the respon-dents who used statistical-based models indicatedthat auto-decline decisions were changed over 50% ofthe time by a manual review.
•A higher percentage of our clients are requestingthat we perform model revalidations on a more fre-quent basis. Many of which result in either a modelrefit or a model re-estimation.
5. What are specific recommendations for remedialaction in areas where such problems exist?
Respondents provided the following suggested ac-tions to address critical problem areas:
•Increased use of business rules to ensure manualreview of applications from businesses in stressed sec-tors.
•Require additional underwriting data (financialstatements, credit references) for applications frombusinesses in stressed sectors.
•Redline industries at a more granular level. For ex-ample, 4-digit SIC rather than 2-digit industry seg-ments at the filter level (i.e. 65xx - Real Estatewhereas 4-digits distinguish between commercial andconsumer real estate segments).
•For consumer models, rely less on off-the-shelfconsumer-type scores.
•Develop new models using more current data, i.e.,from this significant downturn as part of the basis.However, do not overly weight the history from therecession, as the future may not look like the recentpast and that profitable lending opportunities in thefuture are not unnecessarily restricted.
•Additionally, use this as an opportunity to examinewhich factors have the greatest impact on losses dur-ing a downturn.
•Workout extensions for existing troubled cus-tomers, if possible.
•Aggressively monitor all significant exposures andtake immediate action to protect the value of assets.These measures should vary based on the specific col-lateral and customer relationship.
•The industry should develop true peer group data
similar to FDIC bank peer data to assist equipment fi-nance firms in monitoring the quality of their portfo-lios, in general.
•More focus and reliance on collection staff effortsand tools to effectively manage portfolios and reducedelinquency/write-off roll rates.
•Change how rating agencies are compensated. Theissuer who seeks a rating is paying the rating agencybill. The investor or conduit should be paying this billthereby creating a more arms length transaction andensuring that rating agencies are truly independent.
PredictiveMetrics’ Observation:If you are not doing proper credit model perform-
ance evaluation and you are not sure if a model isproducing the desired results, you are going to haveto revalidate it, and thereby determine whether or notyou have a problem, and if so fix it by either a refit ora re-estimation.For clarification purposes the refit process entails
deriving new coefficients from the original model’sspecifications. This simply changes the underlyingweights assigned to the same variables and is the mostefficient way to restore a model's predictiveness andalso minimizes a company’s need for extensivechanges to its credit underwriting systems. The refit isconducted using validation data provided by the com-pany as specified in the original model specifications.Unfortunately, the refit process is not always success-ful and may not materially increase a model’s predic-tiveness.If a refit is not successful then a complete re-estima-
tion is necessary. A re-estimation involves a completenew modeling effort beginning with using the valida-tion sample to perform updated bivariate analysis andmultivariate model estimation. The re-estimation willmost likely result in both new variables and newweights being introduced into the model. This will re-quire extensive re-programming on the part of thecompany and may lead to additional external cost forthe purchase of archived bureau data. Therefore, un-less re-estimation is required due to sufficient deterio-ration of overall predictiveness, the refit is the fastestand most economical method to restore predictive-ness.

EQUIPMENT LEASING & FINANCE FOUNDATION 19
S U R V E Y R E S U LT S : H O W G O O D I S Y O U R S C O R I N G M O D E L ?
If a company is using judgmental-based models therefit/re-estimate process described above is not appli-cable. The least expensive way to control model re-sults, in the case of judgmental-based models, wouldbe to expand the use of manual reviews to all but theleast risky applicants. Alternatively, a complete judg-mental-based remodeling effort is required.
6. With respect to the future of credit models arethere other factors, not usually included as modelvariables that should be considered for inclusion infuture models?
Respondents did not provide much additional infor-mation. Specifically:
•Professional license information.
•News research. (Google and Hoover for example,would be good sources).
•Certificate of good standing.
•Competitive analysis
PredictiveMetrics’ Observation:In many of our models, we utilize various types of
econometric and demographic data which are evalu-ated for applicability during the model developmentprocess. Many of these are leading indicators of eco-nomic behavior and can provide some additional pre-dictiveness, particularly in times of rapid economicchange.
7. What are the prevalent technologies utilized indeveloping credit models? And is any one technologysuperior and if so how?
Only 22.2% of the respondents indicated that theydo not use any type of scoring model. For the otherrespondents the percentage using statistical-based vs.judgmental-based was roughly the same.With respect to the use of statistical-based technolo-
gies: 51.5% are using logistic regression; 33.3% areusing discriminant analysis; 9.1% are using othertypes of regression analysis and 9.1% are using ge-netic algorithms. Neural network technology was notmentioned by any of the respondents.
PredictiveMetrics’ Observation:As to which technology is superior, you can find
professional statisticians that will line up behind eachof them. In general, based on PMI’s experience, if thetechnology is producing predicted results and you arecomfortable with it, you’ll probably not want tochange.And finally, the question that is the title of the re-
port and the underlying reason for this survey:
8. How good is your scoring model?
As noted previously, only 36 of the respondents an-swered the question; “Does your company utilizesome type of scheduled scoring performance evalua-tion system or methodology?” and only 21 indicatedthat they were performing some type of scheduledcredit scoring performance evaluation. The implica-tion of these responses is that 74.1% of the respon-dents are not evaluating their models’ predictivenesson a regular basis.
PredictiveMetrics’ Observation:Given the above; it is possible that a significant
majority of the survey respondents do not know howwell their credit scoring models are performing.Furthermore, it is very likely that many industrymembers are not able to accurately measure thevalue- at-risk inherent in their portfolios. Addition-ally, it is not apparent that the respondents appreciatehow regularly scheduled credit scoring performanceevaluation can be used to improve model results.Based on the assumption that this survey is an accu-
rate depiction of the leasing industry, PMI believesthat it would be to the industry’s benefit for its mem-bers to be educated on the value of scheduled creditscoring performance evaluation. Whether the lessor isresponsible to the OCC or not, the OCC recommen-dations, as briefly described in the introduction toPerformance Evaluation Overview, should be consid-ered for applicability by every lessor. If this practice isfollowed it will ensure that a company’s’ models areworking properly and will provide significant addi-tional confidence in model estimates. If the practice isnot considered applicable than some other consistentperformance evaluation process should be imple-mented that produces similar results.

20 EQUIPMENT LEASING & FINANCE FOUNDATION
S U R V E Y R E S U LT S : H O W G O O D I S Y O U R S C O R I N G M O D E L ?
If the OCC recommendations or similar systems arefollowed, the lessors will know exactly how goodtheir models are, and be able to determine more accu-rately what the inherent risk is in their portfolios. Itshould be noted that to utilize a scoring performanceevaluation system, it does not matter whether the les-sor is using judgmental-based or statistical-basedmodels as long as the models are applied consistentlyover time.It is PMI’s experience, however, that judgmental-
based models are rarely evaluated because validationrequires a significant background in statistics whichthe developers of judgmental models rarely possess.
It is PMI’s judgment that credit scoring models shouldbe evaluated every 12 to 18 months as a reasonableway to ensure that a company’s models are producingthe desired results.Additionally, many portfolios are evaluated by ap-
plying a company’s credit model to its existing leasesand developing current credit scores as the basis fordetermining the inherent risk in its portfolio. Itshould be noted, that if the model has not been prop-erly validated and maintained, it is problematic as tohow useful it is for directly evaluating current portfo-lio risk as the risk inherent in using the model maynot be known.

EQUIPMENT LEASING & FINANCE FOUNDATION 21
S U R V E Y R E S U LT S : H O W G O O D I S Y O U R S C O R I N G M O D E L ?
Founded in 1995, PredictiveMetrics was estab-lished to provide higher-quality analytics and predic-tive scoring models in a customer orientedenvironment. Our customer focus is to work with youto create a strategic relationship ensuring your com-pany’s resources are optimally utilized to make auto-mated, knowledge-based, profitable decisions that areproven accurate through statistical validation. We de-liver you cost-effective solutions, on time, to specifi-cations, requiring limited IT resources, with provenresults. We are there before, during, and after the ana-lytical process begins. PredictiveMetrics offers customand/or industry specific statistical decision models forcollections, debt buying, portfolio management, andunderwriting. Our analytical staff, which is comprisedof Ph.D. and masters level statisticians and econome-tricians, apply their data and statistical modeling ex-pertise and combine it with advanced technology
enabling our customers to continually improve theirprofit margins. We leverage internal performancedata, data which is free and is proven to be the mostpowerful predictor of risk and collections, and blendsit with external data when economically justified.PredictiveMetrics has proprietary software systemsand state-of-the-art hardware designed specifically toconduct vigorous and sophisticated analytics. Weoffer our clients seamless implementation through se-cure FTP Internet or our web-hosted report and querysystem, ScoreMiner(SM), for portfolio management.Armed with the scientific knowledge, data expertise,technical qualifications, and systems capabilities, Pre-dictiveMetrics provides the most unsurpassed predic-tive analytics in the market today!
Appendix A: About Predictivemetrics

22 EQUIPMENT LEASING & FINANCE FOUNDATION
S U R V E Y R E S U LT S : H O W G O O D I S Y O U R S C O R I N G M O D E L ?
Appendix B: Survey Questions and Responses
SURVEY DEMOGRAPHICS
1. Who Responded?
A total of 124 individuals responded to the survey. Their corporate function was:
2. Where Did the Respondents Come From?
The nature of the companies that responded was:
3. What Was the Market Segment That Most Closely Described the Majority of NewBusiness Volume Represented By the Respondents?
Note: The “majority” of new business volume is not necessarily over 50% of the total new volume. For instance,if the company booked $120,000,000 in new business volume, of which $40,000,000 was in Small-Ticket,$50,000,000 in Middle-Ticket and $30,000,000 in Large-Ticket, the majority of the new business volume wouldbe in the Middle-Ticket segment.
Corporate FunctionPercentage ofRespondents
O�cer 15.3%Other Executive 16.9%Credit 32.3%Collections 5.6%Risk 13.7%Other 16.1%
100.0%
Nature of InstitutonPercentage ofRespondents
BANK 24.3%CAPTIVE 24.3%INDEPENDENT, FINANCIAL SERVICES 51.4%
100.0%
Majority Market SegmentPercentage ofRespondents
MICRO-TICKET 14.9%SMALL-TICKET 50.0%MIDDDLE-TICKET 25.7%LARGE-TICKET 9.5%
100.0%
EQUIPMENT LEASING & FINANCE FOUNDATION 23
S U R V E Y R E S U LT S : H O W G O O D I S Y O U R S C O R I N G M O D E L ?
OVERVIEW OF MODEL USAGE
1. What was the distribution of credit scoring model usage among the respondents?
2. Are different models used for “new credit applicants” then are used for “existingcustomers” applying for additional credit?
3. Are separate models used that are designed to deal specifically with differentlines of business?
4. Are different models used as a function of the transaction size?
5. Are models ever used to evaluate a transaction and/or line of business for whichthe model was not specifically designed?
Model UsagePercentage ofRespondents
16.7%
15.3%
45.8%
22.2%
100.0%
Statistical-based
Judgmental-based
Statistical-based and judgmental-based
No scoring models
ResponsePercentage ofRespondents
32.4%67.6%
100.0%
YesNo
ResponsePercentage ofRespondents
42.3%57.7%
100.0%
YesNo
ResponsePercentage ofRespondents
43.1%56.9%100.0%
YesNo
ResponsePercentage ofRespondents
21.1%78.9%
100.0%
YesNo
24 EQUIPMENT LEASING & FINANCE FOUNDATION
S U R V E Y R E S U LT S : H O W G O O D I S Y O U R S C O R I N G M O D E L ?
6. If you answered yes to the previous question, on average how would you com-pare the model’s results when used for transactions for which it was not specificallydesigned?
7. Is there any benefit or trade off in using generic pooled scorecards such as Pay-dex, FICO, D&B's Commercial Credit Score, etc., versus custom scorecards?
8. Respondents that answered yes to the previous question, provided the followingadditional information:
The following were the most frequently mentioned benefits or reasons for using generic pooled scorecards:
• Provides additional input data in both judgmental and statistical-based custom models.
• Used to valuate smaller deals not covered by models.
• Good starting point, used as the basis for determining whether to submit for detailed financial review.
• Useful in business segments where prior history is not available.
• Used by smaller shops where the economic basis or volume to support the use of custom models doesnot exist.
• Useful as a benchmark to determine whether customer is performing above or below industry norms.
• Provides sufficient predictability for smaller portfolios where the cost of developing a custom model is afactor.
ResponsePercentage ofRespondents
13.3%66.7%20.0%0.0%
100.0%
Better than usualAbout the same as usualA little bit worse than usualA lot worse than usual
ResponsePercentage ofRespondents
65.7%34.3%
100.0%
YesNo

EQUIPMENT LEASING & FINANCE FOUNDATION 25
S U R V E Y R E S U LT S : H O W G O O D I S Y O U R S C O R I N G M O D E L ?
9. Based on the current economy, are you planning any changes to your current scor-ing methodology? Please check all that apply.
10. Those who answered Other above, are planning to take one or more of the fol-lowing actions:
• Raise cut-off score as a means of tightening credit.
• Increase due diligence and apply stricter manual and judgmental evaluation.
• Increase the amount of down payments.
ResponsePercentage ofRespondents
21.9%42.2%50.0%18.8%
Development of new scorecardsRevalidation and adjustment of existing scorecardsIncreased reliance on manual/judgmental decisionsOther

26 EQUIPMENT LEASING & FINANCE FOUNDATION
S U R V E Y R E S U LT S : H O W G O O D I S Y O U R S C O R I N G M O D E L ?
STATISTICAL-BASED MODELS
These questions were answered by companies currently using statistical-based models. There were 38 respon-dents to the questions in this section.
1. What statistical modeling technology is utilized?
2. Those companies that answered Other indicated that they use the followingtechnology:
• 67% use generic scorecards developed by Fair Isaac.
• One company indicated that they use reject inference.
• One company indicated they use another type of statistical-based predictive analysis, but did not want tospecify the underlying technology.
3. For companies that utilized statistical-based models, the models were developedby:
4. If a company utilized statistical-based scoring models, how many different modelswere used for credit decisioning?
One company utilized more than 50 models, two companies utilized between 21 and 50 models and one com-pany utilized between 11 and 20 models. The average number of models utilized by the remaining 34 respon-dents was between 3 and 4.
Technology UsedPercentage ofRespondents
51.5%33.3%9.1%0.0%9.1%
18.2%
Logistic RegressionDiscriminant AnalysisOther Types of Regression AnalysisNeural Network AnalysisGenetic AlgorithmsOther
ResponsePercentage ofRespondents
32.4%37.8%29.7%
100.0%
Internal modeling groupOutside contractorCombination of both
Number of ModelsPercentage ofRespondents
73.7%15.8%2.6%5.3%2.6%
100.0%> 50
1 to 56 to 1011 to 2021 to 50

EQUIPMENT LEASING & FINANCE FOUNDATION 27
S U R V E Y R E S U LT S : H O W G O O D I S Y O U R S C O R I N G M O D E L ?
5. During fiscal year 2008, by transaction size, what percentage of the time were sta-tistical-based models utilized to aid in credit evaluation?
6. Of the companies that use statistical-based models, what percentage utilizesauto-approval, auto-decline or both?
Of the respondents, 89.5% utilize some form of auto-decisioning.
7. By transaction size, if the statistical-based scoring decision was positive, what per-centage of the time was a manual review performed that might change the deci-sion? It was assumed that if there was no manual review, the model’s decisionwould stand, i.e., auto-approval was used.
8. For existing customers, what is the maximum portfolio exposure that a respon-dent was willing to risk based on an auto-approval decision of a statistical-basedmodel?
Transaction SizePercentage Models
Utilized96.6%
100.0%62.5%31.6%
Micro-Ticket -<$25,000Small-Ticket - $25,000 to $250,000Middle-Ticket - $250,000 to $5,000,000Large-Ticket - >$5,000,000
ResponsePercentage ofRespondents
23.7%26.3%39.5%
No auto-decisioning 10.5%100.0%
Auto-approval onlyAuto-decline onlyBoth
0% ofthe Time
>0% to 10%of the Time
>10% to 25% ofthe Time
>25% to 50%of the Time
>50% ofthe Time
13.8% 34.5% 13.8% 3.4% 34.5%
6.1% 30.3% 12.1% 12.1% 39.4%
20.0% 10.0% 5.0% 5.0% 60.0%
38.5% 0.0% 7.7% 7.7% 46.2%
Total 15.8% 23.2% 10.5% 7.4% 43.2%
Percentage of Respondents
Transaction Size
Micro-Ticket - <$25,000
Small-Ticket - $25,000 to $250,000
Middle-Ticket - $250,000 to $5,000,000
Large-Ticket ->$5,000,000
Maximum PortfolioExposure ($)
Percentage ofRespondents
0 37.5%>0 to 50,000 8.3%
>50,000 to 100,000 29.2%>100,000 to 500,000 8.3%
>500,000 to 1,000,000 16.7%100.0%

28 EQUIPMENT LEASING & FINANCE FOUNDATION
S U R V E Y R E S U LT S : H O W G O O D I S Y O U R S C O R I N G M O D E L ?
9. For new applicants, what is the maximum transaction value that a respondentwas willing to risk based on an auto-approval decision of a statistical-based model?
10. By transaction size, if the statistical-based scoring decision was positive, whatpercentage of the time did the manual review change the model’s decision?
11. If a company used statistical-based models and auto-decisioning, have they ad-justed the cut-off upward as a method of tightening credit, during the last twelvemonths?
12. If a company answered yes to the previous question, what percent decrease inpositive auto-decisions has occurred?
The responses were evenly distributed from 5% to 25% decrease in positive auto-approvals with no apparentcentral tendency, that is about the same number were above as were below a 15% decease. There was one outlierof approximately 90%. As expected, increasing the cut-off will definitely have a material impact in that it willsignificantly reduce the amount of credit granted by auto-approvals.
Maximum PortfolioExposure ($)
Percentage ofRespondents
0 37.5%>0 to 50,000 12.5%
>50,000 to 100,000 25.0%>100,000 to 500,000 25.0%
100.0%
0% of theTime
>0% to 10%of theTime
>10% to 25% ofthe Time
>25% to 50% oftheTime
>50% oftheTime
6.9% 55.2% 24.1% 6.9% 6.9%
3.2% 58.1% 22.6% 9.7% 9.7%
25.0% 30.0% 25.0% 10.0% 10.0%
46.2% 15.4% 7.7% 23.1% 23.1%Total 15.1% 45.2% 21.5% 7.5% 10.8%
Micro-Ticket - <$25,000
Small-Ticket - $25,000 to $250,000
Middle-Ticket - $250,000 to $5,000,000Large-Ticket ->$5,000,000
Percentage of Respondents
Transaction Size
ResponsePercentage ofRespondents
37.9%62.1%
100.0%
YesNo
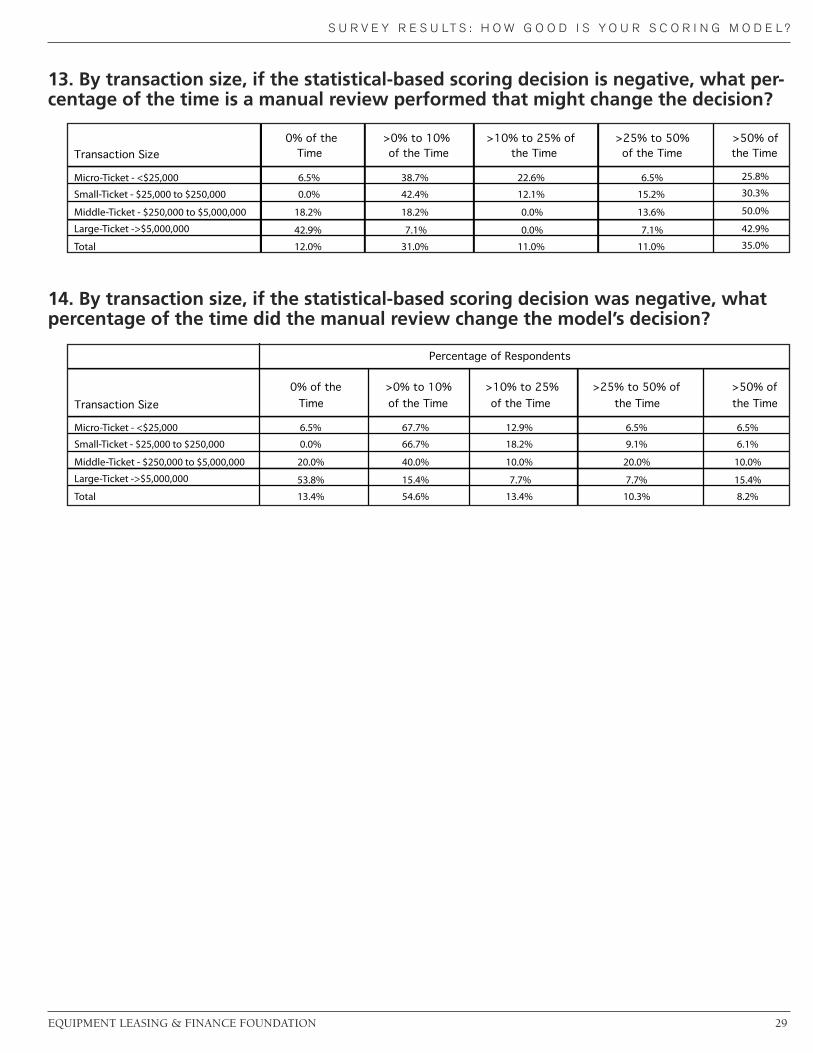
EQUIPMENT LEASING & FINANCE FOUNDATION 29
S U R V E Y R E S U LT S : H O W G O O D I S Y O U R S C O R I N G M O D E L ?
13. By transaction size, if the statistical-based scoring decision is negative, what per-centage of the time is a manual review performed that might change the decision?
14. By transaction size, if the statistical-based scoring decision was negative, whatpercentage of the time did the manual review change the model’s decision?
0% of theTime
>0% to 10%of the Time
>10% to 25% ofthe Time
>25% to 50%of the Time
>50% ofthe Time
6.5% 38.7% 22.6% 6.5% 25.8%
0.0% 42.4% 12.1% 15.2% 30.3%
18.2% 18.2% 0.0% 13.6% 50.0%
42.9% 7.1% 0.0% 7.1% 42.9%
Total 12.0% 31.0% 11.0% 11.0% 35.0%
Transaction Size
Micro-Ticket - <$25,000
Small-Ticket - $25,000 to $250,000
Middle-Ticket - $250,000 to $5,000,000
Large-Ticket ->$5,000,000
0% of theTime
>0% to 10%of the Time
>10% to 25%of the Time
>25% to 50% ofthe Time
>50% ofthe Time
6.5% 67.7% 12.9% 6.5% 6.5%
0.0% 66.7% 18.2% 9.1% 6.1%
20.0% 40.0% 10.0% 20.0% 10.0%
53.8% 15.4% 7.7% 7.7% 15.4%
Total 13.4% 54.6% 13.4% 10.3% 8.2%
Middle-Ticket - $250,000 to $5,000,000
Large-Ticket ->$5,000,000
Percentage of Respondents
Transaction Size
Micro-Ticket - <$25,000
Small-Ticket - $25,000 to $250,000

JUDGMENTAL-BASED MODELSThese questions were answered by companies currently using judgmental-based models. There were 35 respon-dents to the questions in this section.
1. For companies that utilized judgmental-based models, the models were devel-oped by:
2. If a company utilized judgmental-based scoring models, how many differentmodels were used for credit decisioning?
3. During fiscal year 2008, by transaction size, what percentage of the time werejudgmental-based models utilized to aid in credit evaluation?
4. By transaction size, if the judgmental-based scoring decision was positive, whatpercentage of the time was a manual review performed that might change the deci-sion? It was assumed that if there was no manual review, the model’s decisionwould stand, i.e., auto-approval was used.
S U R V E Y R E S U LT S : H O W G O O D I S Y O U R S C O R I N G M O D E L ?
30 EQUIPMENT LEASING & FINANCE FOUNDATION
ResponsePercentage ofRespondents
68.6%
5.7%
25.7%
100.0%
Internal senior risk management/credit sta!
Outside contractor
Combination of both
Number of ModelsPercentage ofRespondents
90.9%3.0%3.0%3.0%0.0%
100.0%> 50
1 to 56 to 1011 to 2021 to 50
Transaction SizePercentage
Models Utilized86.7%
88.2%
62.5%
36.8%
Micro-Ticket -<$25,000
Small-Ticket - $25,000 to $250,000
Middle-Ticket - $250,000 to $5,000,000
Large-Ticket - >$5,000,000
0% of the Time>0% to 10% of
theTime>10% to 25% of
the Time>25% to 50% of
theTime>50% oftheTime
13.8% 34.5% 13.8% 6.9% 31.0%
6.7% 36.7% 3.3% 13.3% 40.0%
17.4% 13.0% 4.3% 17.4% 47.8%
41.2% 11.8% 0.0% 11.8% 35.3%Total 17.2% 26.3% 6.1% 12.1% 38.4%
Middle-Ticket - $250,000 to $5,000,000Large-Ticket ->$5,000,000
Percentage of Respondents
Transaction SizeMicro-Ticket - <$25,000
Small-Ticket - $25,000 to $250,000

5. For existing customers, what is the maximum portfolio exposure that a respon-dent was willing to risk based on an auto-approval decision of a judgmental-basedmodel?
6. For new applicants, what is the maximum portfolio exposure that a respondentwas willing to risk based on an auto-approval decision of a judgmental-basedmodel?
7. By transaction size, if the judgmental-based scoring decision was positive, whatpercentage of the time did the manual review change the model’s decision?
8. If a company used judgmental-based models and auto-decisioning, have they ad-justed the cut-off upward as a method of tightening credit, during the last twelvemonths?
S U R V E Y R E S U LT S : H O W G O O D I S Y O U R S C O R I N G M O D E L ?
EQUIPMENT LEASING & FINANCE FOUNDATION 31
Maximum PortfolioExposure ($)
Percentage ofRespondents
0 47.8%>0 to 50,000 17.4%
>50,000 to 100,000 13.0%>100,000 to 500,000 17.4%
>500,000 to 1,000,000 4.3%100.0%
Maximum PortfolioExposure ($)
Percentage ofRespondents
0 45.5%>0 to 50,000 27.3%
>50,000 to 100,000 4.5%>100,000 to 500,000 22.7%
>500,000 to 1,000,000 0.0%100.0%
0% of theTime
>0% to 10%of the Time
>10% to 25%of the Time
>25% to 50%of the Time
>50% ofthe Time
10.3% 62.1% 17.2% 6.9% 3.4%
6.7% 56.7% 20.0% 13.3% 3.3%
26.1% 30.4% 13.0% 21.7% 8.7%
50.0% 12.5% 12.5% 6.3% 18.8%
Total 19.4% 44.9% 16.3% 12.2% 7.1%
Middle-Ticket - $250,000 to $5,000,000
Large-Ticket ->$5,000,000
Percentage of Respondents
Transaction Size
Micro-Ticket - <$25,000
Small-Ticket - $25,000 to $250,000
ResponsePercentage ofRespondents
30.8%69.2%
100.0%
YesNo

9. If a company answered yes to the previous question, what percent decrease inpositive auto-decisions has occurred?
There were too few responses to this question for us to present a definitive answer. The answers that were re-ceived ranged from a 10% to 25% decrease.
10. By transaction size, if the judgmental-based scoring decision is negative, whatpercentage of the time was a manual review performed that might change thedecision?
11. By transaction size, if the judgmental-based scoring decision was negative, whatpercentage of the time did the manual review change the model’s decision?
S U R V E Y R E S U LT S : H O W G O O D I S Y O U R S C O R I N G M O D E L ?
32 EQUIPMENT LEASING & FINANCE FOUNDATION
0% of theTime
>0% to 10%of the Time
>10% to 25% ofthe Time
>25% to 50% ofthe Time
>50% ofthe Time
13.3% 36.7% 13.3% 10.0% 26.7%
6.3% 34.4% 15.6% 12.5% 31.3%
39.1% 8.7% 8.7% 13.0% 30.4%
55.6% 11.1% 0.0% 11.1% 22.2%
Total 24.3% 25.2% 10.7% 11.7% 28.2%
Middle-Ticket - $250,000 to $5,000,000
Large-Ticket ->$5,000,000
Percentage of Respondents
Transaction Size
Micro-Ticket - <$25,000
Small-Ticket - $25,000 to $250,000
0% of theTime
>0% to 10%of the Time
>10% to 25% ofthe Time
>25% to 50% ofthe Time
>50% ofthe Time
13.3% 53.3% 10.0% 13.3% 10.0%
6.5% 58.1% 16.1% 9.7% 9.7%
36.4% 31.8% 9.1% 13.6% 9.1%
52.9% 17.6% 11.8% 5.9% 11.8%
Total 23.0% 44.0% 12.0% 11.0% 10.0%
Middle-Ticket - $250,000 to $5,000,000
Large-Ticket ->$5,000,000
Percentage of Respondents
Transaction Size
Micro-Ticket - <$25,000
Small-Ticket - $25,000 to $250,000

GENERAL MODEL QUESTIONS
1. Have leasers found, during the last twelve months, that current economic condi-tions have affected their credit scoring models’ predictiveness?
2. Of those companies that answered yes above, have their models been more orless accurate in predicting delinquency or loss?
3. Given that the accuracy of models has been affected, what has been the positiveor negative percent change in predicting delinquency or loss?
The impact of the change in model accuracy ran the entire gamut from one company indicating they had nodiscernable change in accuracy of loss prediction or estimated bad rate to one company indicating they had ex-perienced a 50% negative increase and one company experiencing a 100% negative increase in loss prediction.The balance of the responses ranged from negative increases of 2% to 25% and averaged about 15% in increasedestimated bad rate.
4. Are there are specific trends, practices and industry controls in existence whichwill effect delinquency and loss rates within the equipment leasing and financeindustry?
6. The companies that answered yes to the above question cited the following:
• Most frequently mentioned was that credit requirements are tightening and lenders are demanding morefavorable transaction structures, and reduced exposure limits.
• Some companies noted that additional manual review was occurring.
• Additionally, marginal markets are being exited.
• Revalidation and adjustment of models is more prevalent.
S U R V E Y R E S U LT S : H O W G O O D I S Y O U R S C O R I N G M O D E L ?
EQUIPMENT LEASING & FINANCE FOUNDATION 33
ResponsePercentage ofRespondents
65.9%34.1%
100.0%
YesNo
ResponsePercentage ofRespondents
3.7%96.3%
100.0%
More accurateLess accurate
ResponsePercentage ofRespondents
47.6%52.4%
100.0%
YesNo
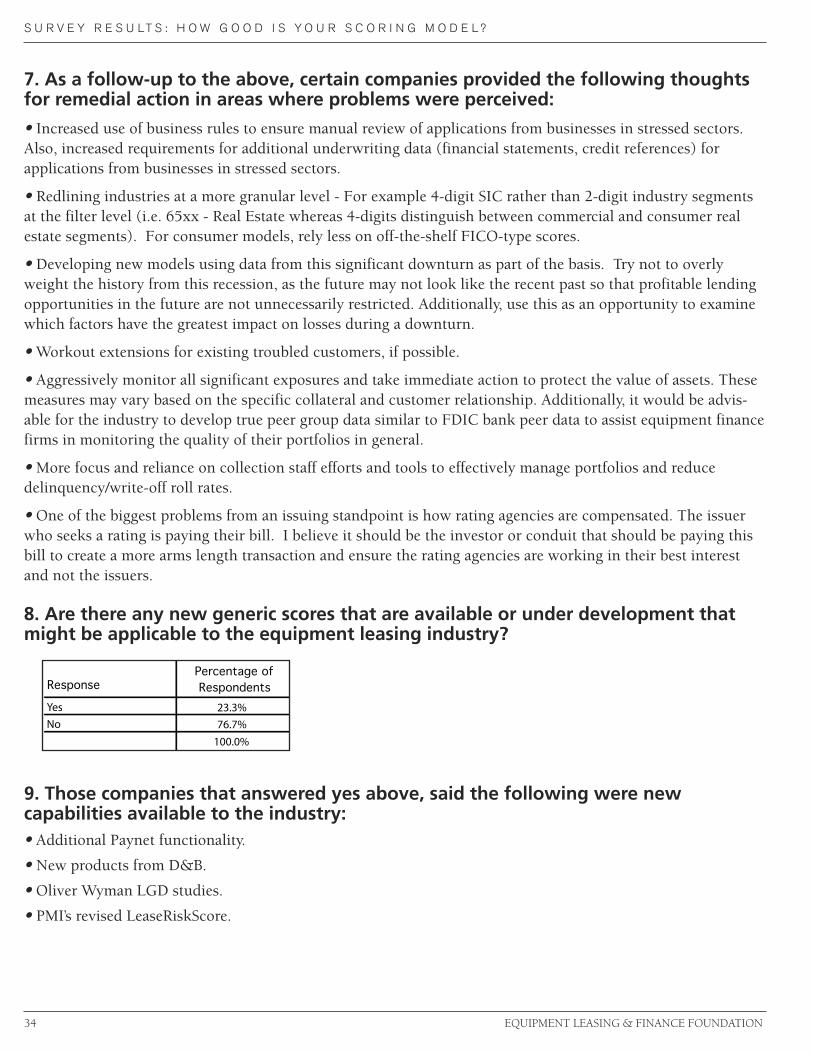
7. As a follow-up to the above, certain companies provided the following thoughtsfor remedial action in areas where problems were perceived:
• Increased use of business rules to ensure manual review of applications from businesses in stressed sectors.Also, increased requirements for additional underwriting data (financial statements, credit references) forapplications from businesses in stressed sectors.
• Redlining industries at a more granular level - For example 4-digit SIC rather than 2-digit industry segmentsat the filter level (i.e. 65xx - Real Estate whereas 4-digits distinguish between commercial and consumer realestate segments). For consumer models, rely less on off-the-shelf FICO-type scores.
• Developing new models using data from this significant downturn as part of the basis. Try not to overlyweight the history from this recession, as the future may not look like the recent past so that profitable lendingopportunities in the future are not unnecessarily restricted. Additionally, use this as an opportunity to examinewhich factors have the greatest impact on losses during a downturn.
• Workout extensions for existing troubled customers, if possible.
• Aggressively monitor all significant exposures and take immediate action to protect the value of assets. Thesemeasures may vary based on the specific collateral and customer relationship. Additionally, it would be advis-able for the industry to develop true peer group data similar to FDIC bank peer data to assist equipment financefirms in monitoring the quality of their portfolios in general.
• More focus and reliance on collection staff efforts and tools to effectively manage portfolios and reducedelinquency/write-off roll rates.
• One of the biggest problems from an issuing standpoint is how rating agencies are compensated. The issuerwho seeks a rating is paying their bill. I believe it should be the investor or conduit that should be paying thisbill to create a more arms length transaction and ensure the rating agencies are working in their best interestand not the issuers.
8. Are there any new generic scores that are available or under development thatmight be applicable to the equipment leasing industry?
9. Those companies that answered yes above, said the following were newcapabilities available to the industry:• Additional Paynet functionality.
• New products from D&B.
• Oliver Wyman LGD studies.
• PMI’s revised LeaseRiskScore.
S U R V E Y R E S U LT S : H O W G O O D I S Y O U R S C O R I N G M O D E L ?
34 EQUIPMENT LEASING & FINANCE FOUNDATION
ResponsePercentage ofRespondents
23.3%76.7%
100.0%
YesNo

10. Of the companies that responded, what percent provide application only leases,i.e., additional financial information is not required?
11. Of those companies that provide application only leases, what is the maximumdollar exposure they will accept?
12. Of those companies that provide application only leases, how has the numberof requests changed over the last year?
13. Of the companies that responded, what percent provide deferred payment programs?
14. Of those companies that provide deferred payment programs, what is themaximum dollar exposure they will accept?
S U R V E Y R E S U LT S : H O W G O O D I S Y O U R S C O R I N G M O D E L ?
EQUIPMENT LEASING & FINANCE FOUNDATION 35
ResponsePercentage ofRespondents
82.2%17.8%
100.0%
YesNo
Maximum PortfolioExposure ($)
Percentage ofRespondents
0 4.2%>0 to 50,000 12.5%
>50,000 to 100,000 41.7%>100,000 to 500,000 37.5%
>500,000 to 1,000,000 4.2%100.0%
ResponsePercentage ofRespondents
22.9%8.6%
68.6%100.1%
Signi!cant increaseSigni!cant decreaseNo signi!cant change
ResponsePercentage ofRespondents
59.1%40.9%
100.0%
YesNo
Maximum PortfolioExposure ($)
Percentage ofRespondents
0 0.0%>0 to 50,000 16.7%
>50,000 to 100,000 16.7%>100,000 to 500,000 41.7%
>500,000 to 1,000,000 8.3%>1,00,000 to 5,000,000 8.3%
>5,000,000 8.3%100.0%

15. Of those companies that provide deferred payment programs, how has thenumber of requests changed over the last year?
16. Of the companies that responded, what percent provide step-up paymentprograms?
17. Of those companies that provide step-up payment programs, what is themaximum dollar exposure they will accept?
18. Of those companies that provide step-up payment programs, how has thenumber of requests changed over the last year?
19. Of the companies that responded, what percent provide no money down pay-ment programs?
S U R V E Y R E S U LT S : H O W G O O D I S Y O U R S C O R I N G M O D E L ?
36 EQUIPMENT LEASING & FINANCE FOUNDATION
ResponsePercentage ofRespondents
25.0%4.2%
70.8%100.0%
Signi!cant increaseSigni!cant decrease
No signi!cant change
ResponsePercentage ofRespondents
45.0%55.0%
100.0%
YesNo
Maximum PortfolioExposure ($)
Percentage ofRespondents
0 0.0%>0 to 50,000 12.5%
>50,000 to 100,000 25.0%>100,000 to 500,000 37.5%
>500,000 to 1,000,000 0.0%>1,00,000 to 5,000,000 0.0%
>5,000,000 25.0%100.0%
ResponsePercentage ofRespondents
5.0%0.0%
95.0%100.0%
Signi!cant increaseSigni!cant decrease
No signi!cant change
ResponsePercentage ofRespondents
48.8%51.2%
100.0%
YesNo
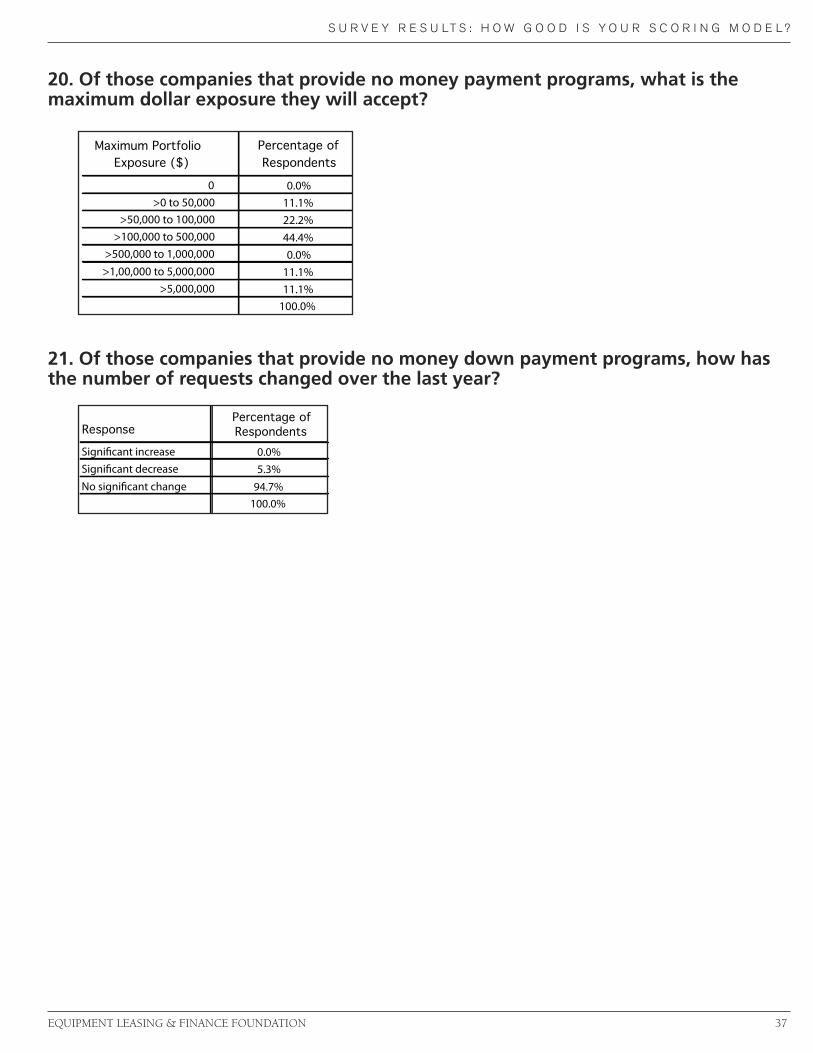
20. Of those companies that provide no money payment programs, what is themaximum dollar exposure they will accept?
21. Of those companies that provide no money down payment programs, how hasthe number of requests changed over the last year?
S U R V E Y R E S U LT S : H O W G O O D I S Y O U R S C O R I N G M O D E L ?
EQUIPMENT LEASING & FINANCE FOUNDATION 37
Maximum PortfolioExposure ($)
Percentage ofRespondents
0 0.0%>0 to 50,000 11.1%
>50,000 to 100,000 22.2%>100,000 to 500,000 44.4%
>500,000 to 1,000,000 0.0%>1,00,000 to 5,000,000 11.1%
>5,000,000 11.1%100.0%
ResponsePercentage ofRespondents
0.0%5.3%
94.7%100.0%
Signi!cant increaseSigni!cant decrease
No signi!cant change

S U R V E Y R E S U LT S : H O W G O O D I S Y O U R S C O R I N G M O D E L ?
38 EQUIPMENT LEASING & FINANCE FOUNDATION
MODEL VARIABLES – WHAT’S IMPORTANT?
1. What data sources do respondents include in New Applicant models?
2. Are other variable sources included in New Applicant models that are not men-tioned in the above classifications?
3. The respondents that answered yes, indicated that these other data sources andtypes of variables are used in their New Applicant credit evaluations:
• Specific professional licenses information.• News research.• Certificate of Good Standing.• Competitive analysis.
4. What data sources do respondents include in Existing Customer models?
5. Are other variable sources included in Existing Customer models that are not men-tioned in the above classifications?
ResponsePercentage ofRespondents
73.2%82.9%
82.9%56.1%
Internal Data
Commercial Bureau DataConsumer Bureau DataFinancial Statement Data
ResponsePercentage ofRespondents
31.7%68.3%
100.0%
YesNo
ResponsePercentage ofRespondents
90.2%78.0%80.5%
53.7%
Internal DataCommercial Bureau Data
Consumer Bureau DataFinancial Statement Data
ResponsePercentage ofRespondents
26.8%73.2%
100.0%
YesNo

6. The respondents that answered yes, indicated that these other data sources andtypes of variables are used in their Existing Customer credit evaluations:
• News research• Collateral value• Competitive analysis
7. Of the variables used in the respondent’s models, these five specific variableswere most frequently represented in their models:
8. Has the importance of the most critical five variables listed by respondentschanged over the last two years?
S U R V E Y R E S U LT S : H O W G O O D I S Y O U R S C O R I N G M O D E L ?
EQUIPMENT LEASING & FINANCE FOUNDATION 39
VariablePercentage ofOccurrence
75.8%Payment History 39.4%FICO 39.4%
18.2%Paynet 9.1%
Time in Business
Paydex
NoChange
LittleChange
SignificantChange
46.9% 31.3% 21.9%45.2% 32.3% 22.6%41.4% 44.8% 13.8%33.3% 44.4% 22.2%41.7% 50.0% 8.3%
Total 42.0% 39.9% 18.2%
Variable 3Variable 4Variable 5
Percentage of Respondents
VariableVariable 1Variable 2

40 EQUIPMENT LEASING & FINANCE FOUNDATION
S U R V E Y R E S U LT S : H O W G O O D I S Y O U R S C O R I N G M O D E L ?
PERFORMANCE EVALUATION
1. Does your company utilize some type of scheduled Performance Evaluationsystem or methodology?
This question was answered by only 36 of the respondents, only 21 of which indicated that they were perform-ing some type of scheduled Performance Evaluation.
2. Is the Performance Evaluation performed by individuals who are independent, inother words not the original model developers?
3. How frequently do the respondents evaluate their models?
4. What reports are contained in the Performance Evaluation system?
ResponsePercentage ofRespondents
58.3%41.7%
100.0%
YesNo
ResponsePercentage ofRespondents
71.4%28.6%
100.0%
YesNo
Evaluation FrequencyPercentage of
Models22.4%28.6%24.5%12.2%12.2%
100.0%
Every 6 months or lessEvery 6 to 12 monthsEvery 12 to 24 monthsEvery 24 to 36 monthsGreater than 36 months or never
ResponsePercentage ofRespondents
0.0%9.5%
90.5%100.0%
Only front-end reports
Only back-end reportsBoth

5. One way of determining how well a model is performing is to compare its devel-opment sample bad rate to its validation sample bad rate. (For example, if the devel-opment sample bad rate was 8.0% and the validation sample bad rate is 10.0%, thechange would be -2.0%/8.0% or -25%).
Unfortunately only 10 respondents answered this question. So, we cannot state with any assurance that theseresults are representative of how models are performing. Here, only 50.1% of the models were evidencing a dif-ference between the development sample bad rate and the validation sample bad rate of between 5% and -5%which might indicate that the other 49.9% of the models need to be modified (refitted) with respect to theweights of certain variables or if the percent difference is very large completely re-estimated.
6. Another way to determine how well a model is performing is to compare theaverage credit score in the development sample to the average credit score in thevalidation samples.
These results are consistent with the previous question in that about half the models are showing little changein the average risk score and half are evidencing a measurable difference. Again, the response was small, only 17respondents, so we can not state with any assurance that this represents a population trend.
S U R V E Y R E S U LT S : H O W G O O D I S Y O U R S C O R I N G M O D E L ?
EQUIPMENT LEASING & FINANCE FOUNDATION 41
Percentage DifferencePercentage of
Models6.3%
18.8%18.8%31.3%18.8%
<-30% 6.3%100.0%
<--5% to -30%
>30%>5 to 30%>0% to 5%0% to -5%
Percentage ofModels
23.1%
30.8%
46.2%
100.0%
Small/No Change in average risk, i.e., neither
an increase or decrease in credit average
score
Nature of Difference
Decrease in average risk, i.e., there was an
increase in the average credit score of
applicants in the validation samples relative to
development samples
Increase in average risk, i.e., there was a
decrease in the average credit score of
applicants in the validation samples relative to
development samples
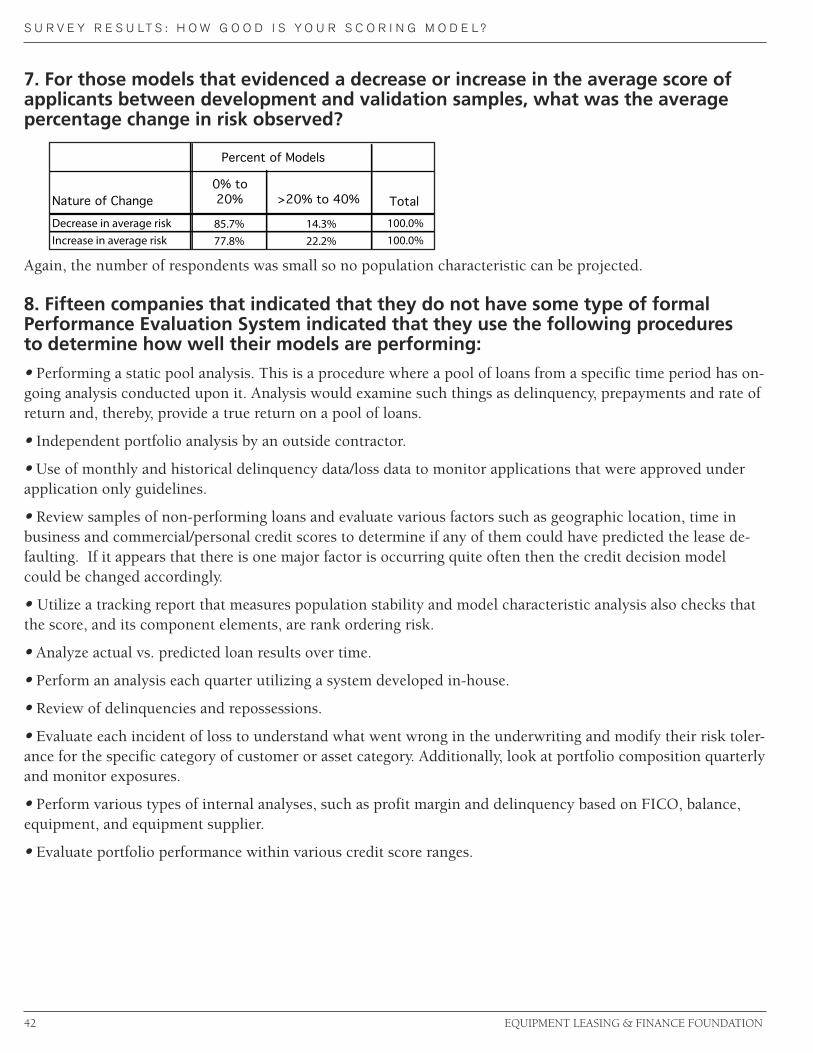
7. For those models that evidenced a decrease or increase in the average score ofapplicants between development and validation samples, what was the averagepercentage change in risk observed?
Again, the number of respondents was small so no population characteristic can be projected.
8. Fifteen companies that indicated that they do not have some type of formalPerformance Evaluation System indicated that they use the following proceduresto determine how well their models are performing:
• Performing a static pool analysis. This is a procedure where a pool of loans from a specific time period has on-going analysis conducted upon it. Analysis would examine such things as delinquency, prepayments and rate ofreturn and, thereby, provide a true return on a pool of loans.
• Independent portfolio analysis by an outside contractor.
• Use of monthly and historical delinquency data/loss data to monitor applications that were approved underapplication only guidelines.
• Review samples of non-performing loans and evaluate various factors such as geographic location, time inbusiness and commercial/personal credit scores to determine if any of them could have predicted the lease de-faulting. If it appears that there is one major factor is occurring quite often then the credit decision modelcould be changed accordingly.
• Utilize a tracking report that measures population stability and model characteristic analysis also checks thatthe score, and its component elements, are rank ordering risk.
• Analyze actual vs. predicted loan results over time.
• Perform an analysis each quarter utilizing a system developed in-house.
• Review of delinquencies and repossessions.
• Evaluate each incident of loss to understand what went wrong in the underwriting and modify their risk toler-ance for the specific category of customer or asset category. Additionally, look at portfolio composition quarterlyand monitor exposures.
• Perform various types of internal analyses, such as profit margin and delinquency based on FICO, balance,equipment, and equipment supplier.
• Evaluate portfolio performance within various credit score ranges.
S U R V E Y R E S U LT S : H O W G O O D I S Y O U R S C O R I N G M O D E L ?
42 EQUIPMENT LEASING & FINANCE FOUNDATION
0% to20% >20% to 40% Total85.7% 14.3% 100.0%
77.8% 22.2% 100.0%
Percent of Models
Nature of ChangeDecrease in average riskIncrease in average risk

2009 Credit Scoring Model Study Steering Committee
S U R V E Y R E S U LT S : H O W G O O D I S Y O U R S C O R I N G M O D E L ?
EQUIPMENT LEASING & FINANCE FOUNDATION 43
David H. EnglishLEAF Financial Corporation
Sandra JonesCaterpillar Financial Services Corporation
Joseph C. LaneSinter Capital
Peg MaloneyKey Equipment Finance
Joe M. NachbinThe Alta Group
Blair NevillePlanitroi, Inc
Tom WarePaynet
David S. Wiener

S U R V E Y R E S U LT S : H O W G O O D I S Y O U R S C O R I N G M O D E L ?
44 EQUIPMENT LEASING & FINANCE FOUNDATION
5The securitization of first-lien mortgage loans gives rise to a special class of ABS known as mortgage backed securities.
6For simplicity we have not specified the relationship between Niece and AAA-SPE. If Niece were one of the larger leasing companies it would both originate and securitize its own leases.Alternatively, Niece might act as a conduit for smaller, regional leasing companies by acquiring their equipment leases and loans and including these assets in its securitized pool.
EQUIPMENT LEASING & FINANCE FOUNDATION 44
The Equipment Leasing & Finance FoundationThe Equipment Leasing & Finance Foundation, establishedin 1989 by the Equipment Leasing Association, is dedicatedto providing future-oriented, in-depth, independent re-search about and for the equipment finance industry. Infor-mation involving the markets, the future of the industryand the methods of successful organizations are researchedto provide studies that include invaluable information fordeveloping strategic direction within your organization.
Your Eye on the FutureThe Foundation partners with corporate and individualsponsors, academic institutions and industry experts todevelop comprehensive empirical research that brings thefuture into focus for industry members. The Foundationprovides academic research, case studies and analyses forindustry leaders, analysts and others interested in theequipment finance industry.
The Foundation’s resources are available electronically orin hard copy, at no cost to Foundation donors and for a feeto non-donors. The Foundation website is updated weekly.For more information, please visit www.leasefoundation.org
Resources available from the Foundation include the fol-lowing research and emerging issues (check the websitefor a complete listing):
Resources: Research Studies and White Papers• US Equipment Finance Market Study• Propensity to Finance Equipment – Characteristics ofthe Finance Decision
• Business Differentiation: What makes Select LeasingCompanies Outperform Their Peers?
• Annual State of the Industry Report• Evolution of the Paperless Transaction and its Impacton the Equipment Finance Industry
• Indicators for Success Study• Credit Risk: Contract Characteristics for Success Study• Study on Leasing Decisions of Small Firms
Resources: Identification of Emerging Issues• Annual Industry Future Council Report
• Identifying Factors For Success In the China• Renewable Energy Trends and the Impact on theEquipment Finance Market
• Long-Term Trends in Health Care and Implications forthe Leasing Industry
• Why Diversity Ensures Success• Forecasting Quality: An Executive Guide to CompanyEvaluation...and so much more!
Journal of Equipment Lease FinancingPublished three times per year and distributed electroni-cally, the Journal of Equipment Lease Financing is the onlypeer-reviewed publication in the equipment finance indus-try. Since its debut in 1980, the Journal features detailedtechnical articles authored by academics and industry ex-perts and includes Foundation-commissioned research andarticles. Journal articles are available for download throughthe Foundation website. Subscriptions are available atwww.leasefoundation.org
Web Based SeminarsMany of the Foundation studies are also presented as webseminars to allow for direct interaction, in-depth conversa-tion and question and answer sessions with the researchersand industry experts involved in the studies. Please visit theFoundation website for details on upcoming webinars atwww.leasefoundation.org
Donor Support and Awards ProgramThe Foundation is funded entirely through corporate andindividual donations. Corporate and individual donationsprovide the funds necessary to develop key resources andtrend analyses necessary to meet daily business challenges.Corporate and individual donors are acknowledged pub-licly and in print. Major giving levels participate in a distin-guished awards presentation. Giving levels range from $100to $50,000+ per year. For information on becominga donor and to see a list of current donors, please visit,www.leasefoundation.org/donors
Your Eye On The FutureOUNDATION
EQUIPMENT LEASING & FINANCE
Future Focused Research for theEquipment Finance Industry
Presented by the Source for Independent, Unbiased and Reliable Study
1825 K Street NW • Suite 900 • Washington, DC 20006 • Phone: 202-238-3400 • Fax: 202-238-3401 • www.leasefoundation.org

1825 K Street NW P 202.238.3400Suite 900 F 202.238.3401Washington, DC 20006www.leasefoundation.org