creating an ever stronger weir - seeking alpha
TRANSCRIPT

Creating an ever stronger Weir
LSE ticker: WEIR.LN
US ADR ticker: WEGRY
Presented by Jon Stanton and John Heasley
Glasgow
31 July 2018

Jon Stanton Chief Executive Officer

Delivering significantly improved profitability
3
Execute
Strong orders1: Record Minerals AM; O&G +35%; FC +34%
Operating Profit1,2 +62%; Continuing margin 15.1%
Full year guidance unchanged
Current market conditions remain encouraging
Long term market fundamentals positive
Good progress on We are Weir strategic initiatives
ESCO acquisition completed in July
Flow Control sale process planned to launch in late Q3
Continued balance sheet deleveraging
Grow
Transform
Confident outlook underlined by return to dividend growth
1. Constant currency 2. Total Group

Execute:
Financial review
John Heasley

37.1 46.3
-4.8
3.1
-5
0
5
10
15
20
25
30
35
40
45
50
2017 H1 2018 H1
p EPS2
104 143
-11
9
-20
0
20
40
60
80
100
120
140
160
2017 H1 2018 H1
£m PBTA2
13.4%
15.1%
10%
12%
14%
16%
2017 H1 2018 H1
% Margin1
Delivering strong profit growth in line with expectations
5
976 1,166
0
200
400
600
800
1,000
1,200
2017 H1 2018 H1
£m Orders1
+20%
865 1,062
0
200
400
600
800
1,000
1,200
2017 H1 2018 H1
£m Revenue1
+170bps +23%
1 Continuing operations at constant currency before exceptional items and intangibles amortisation. 2 Continuing operations as reported before exceptional items and intangibles amortisation. 3 Total Group
+38%
78
139
0
25
50
75
100
125
150
2017 H1 2018 H1
£m Cash from operations3
+78% +25%
Discontinued Operations

Minerals: Early investment delivering strong growth
£m
H1 18 H1 171 YOY +/- H2 171
OE orders 222 205 9% 183
AM orders 506 445 14% 458
Total orders 728 650 12% 641
Mining markets continued positive momentum
Brownfield opportunities dominate
Q2 AM at record levels
Strong greenfield pipeline developing
1 2017 restated at H1 2018 average exchange rates. 6
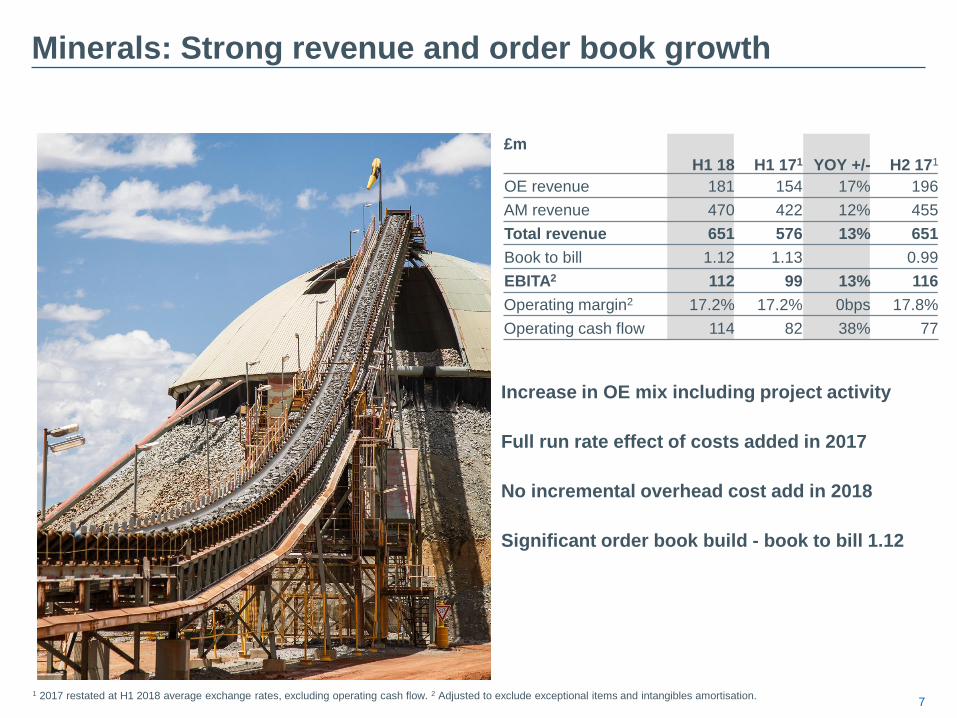
Minerals: Strong revenue and order book growth
1 2017 restated at H1 2018 average exchange rates, excluding operating cash flow. 2 Adjusted to exclude exceptional items and intangibles amortisation.
7
Increase in OE mix including project activity
Full run rate effect of costs added in 2017
No incremental overhead cost add in 2018
Significant order book build - book to bill 1.12
£m
H1 18 H1 171
YOY +/- H2 171
OE revenue 181 154 17% 196
AM revenue 470 422 12% 455
Total revenue 651 576 13% 651
Book to bill 1.12 1.13 0.99
EBITA2 112 99 13% 116
Operating margin2 17.2% 17.2% 0bps 17.8%
Operating cash flow 114 82 38% 77

Oil & Gas: Strong recovery in North America continues
Positive NAM fundamentals
NAM orders ahead of rig count trends
OE includes strong growth in frack pumps
AM driven by completions activity and intensity
International markets remain competitive
£m
H1 18 H1 171 YOY +/- H2 171
OE orders 108 69 58% 81
AM orders 330 257 28% 281
Total orders 438 326 35% 362
8 1 2017 restated at H1 2018 average exchange rates.
Weir RFID tracking system for flow iron

Oil & Gas: Significantly higher profitability
› Strong operational performance
› Profits driven by NAM; flow through of 37%
› Margin in line with mid-teens expectations
› Working capital closely managed
£m
H1 18 H1 171 YOY +/- H2 171
OE revenue 96 57 67% 75
AM revenue 315 232 36% 297
Total revenue 411 289 42% 372
Book to bill 1.07 1.13 0.97
EBITA (incl. JVs)2 63 29 117% 56
Operating margin2 15.3% 10.1% 520bps 15.1%
Operating cash flow 39 -1 5701% 44
9 1 2017 restated at H1 2018 average exchange rates, excluding operating cash flow. 2 Adjusted to exclude exceptional items and intangibles amortisation.

Discontinued operations: Flow Control
Markets continue to recover
Good OE order momentum driven by increased nuclear demand
Fifth straight quarter of YOY AM growth
Significant order book build with book to bill of 1.28
Mid single digit margins in line with expectations
£m
H1 18 H1 171 YOY +/- H2 171
OE orders 105 67 53% 86
AM orders 101 86 19% 67
Total orders 206 153 34% 153
10 1 2017 restated at H1 2018 average exchange rates, excluding operating cash flow. 2 Adjusted to exclude exceptional items and intangibles amortisation.
OE revenue 84 91 -8% 115
AM revenue 77 70 10% 77
Total revenue 161 161 0% 192
Book to bill 1.28 0.95 0.80
EBITA2 9 (11) 176% 8
Operating margin2 5.4% -7.2% 1260bps 4.2%
Operating cash flow 8 7 5% 15

11
Exceptional items and other financial matters
Exceptional costs – H1
›Mainly ESCO acquisition costs
›Initial Flow Control disposal costs
Translational foreign exchange
›Full year operating profit headwind c. £16m based on current
exchange rates
Central costs
›H1 £2m higher than prior year – primarily digital investment
Interest
›H1 £4m lower than prior year reflecting £95m private
placement refinancing, equity placing proceeds and
favourable FX
Effective tax rate in line with expectations at 25.3%
£m
H1 18
ESCO acquisition related costs 24
Other exceptional costs 1
Continuing 25
Discontinued operations 1

Strong growth in operating cash flow
Cash flow statement £m Total operations - as reported
H1 18
H1 17
Operating cash flows – pre working capital 199 144
Working capital outflow (60) (66)
Operating cash flows 139 78
Net interest (18) (21)
Tax (36) (15)
Net capex (32) (37)
Settlement of derivative financial instruments (19) 1
Other cash flows (2) 1
Free cash flow pre dividends 32 7
Dividends paid (39) (57)
Free cash outflow (7) (50)
12
416 491 501
77 80 75
0
50
100
0
200
400
600
2017 H1 2017 H2 2018 H1
Debtor days
£m Debtors1
585 607 663
2.3 2.5 2.5
0
1
2
0
250
500
750
2017 H1 2017 H2 2018 H1
Inventory turns
£m Inventory1
Operating cash flows increased by £61m
Working capital metrics continue to improve
Tax cash flows reflect increase in profits
Derivatives outflow driven by USD:GBP rate movements
Dividends paid reflect £31m vs. £6m scrip take-up in H1 2017
546 601
656
27.6 26.8
26.9
0
10
20
30
0
250
500
750
2017 H1 2017 H2 2018 H1
Working capital as % sales
£m Working Capital1
1 At constant currency.

0
200
400
600
800
1,000
1,200
1,400 US$1,285m
Movement in net debt
13
£m
Net debt at 31 December 2017 843
Free cash outflow 7
Exceptional cash outflow 7
FX 25
ESCO placing (357)
Other 4
Net debt at 30 June 2018 529
ESCO placing 357
Underlying net debt at 30 June 2018 886
£357m proceeds from placing held at 30 June before
being used to fund the ESCO acquisition on 12 July
Underlying net debt increase mainly driven by FX
translation of US$ debt
Weighted average no of shares in H1 230.9m
›Shares in issue now 259.4m after completion of ESCO
acquisition
869 843 886
3.1
2.5 2.1
0
1
2
3
4
0
500
1,000
2017 H1 2017 H2 2018 H1
Net debt / EBITDA
£m
Placing 16.7m shares
Vendor equity 16.8m shares
Equity Value US$1,048m
Debt / pensions US$237m1
Debt
US$m
ESCO transaction funding
Net debt & covenant
1 ESCO debt/pensions estimated.

Grow:
We are Weir
Jon Stanton

Grow: Strategic Progress - H1 2018 Highlights
15
› Safety: TIR of 0.53; significant reduction in severity
› Progressed engagement strategy
› Defined organisational effectiveness KPIs
People Improved sustainable
engagement score and
organisational effectiveness
Customers Increased market share
Technology Increased revenues from new
solutions
Performance Sustainably higher margins through
the cycle
› c. £50m in revenues for Minerals integrated solutions
› ‘Weir Edge’ O&G field services launched
› Major nuclear contract successes for Flow Control
› Revenues from new products +16%
› Synertrex® pilots successful; Q3 commercialisation
› Strong initial uptake of O&G Simplified Frac System
› 80 Value Chain Excellence projects underway
› Sustainability pilots to improve energy efficiency
› Drive towards long term margin improvements

16
Grow: Mining and Infrastructure markets
Current market conditions
›Miners focused on maximising productivity
›Strong brownfield and AM demand
›Significant growth in greenfield quotations pipeline
Long term fundamentals
›Supply shortages anticipated in key commodities
Power infrastructure demand for copper/lithium/cobalt
›Ore grade declines continue despite new developments
›Mining long wavelength upcycle underway
›Infrastructure benefiting from global GDP growth
Why Weir benefits
›Biased to most attractive commodities
›Premium productivity-enhancing technology
›AM based business model; High barriers to entry
1 Deutsche Bank July 2018. 2 CRU February 2018.
10
15
20
25
2017 2018E 2019E
£b
Top 4 miners total capex1
95
100
105
110
115
2017 2018 2019 2020 2021
2016 b
aselin
e =
100
Copper Gold Iron Ore (excl. Oceania)
Mined ore production projections2

Grow: Differentiating through Integrated Solutions
Close customer proximity crucial
Detailed site audit
›Digital analysis of plant flows
›Ability to see solutions before installation
Very quick customer payback
›10% increase in plant capacity
›Initial investment recouped in 3 days
Supports long term relationships
›Additional order for cyclones, pumps and
screens
Cavex® Hydrocyclone Warman® slurry pump Linatex® screen media
17
Digital mapping allows the customer to see the solution before the installation takes
place.

18
Grow: Oil and gas markets
Current market conditions
›US rig count levelled off; Canada still growing
›Increased intensity of operations supporting AM demand
›No impact from Permian issues to date
›International still challenging but improvement expected
Long term fundamentals
›Global oil demand +1.2 mb/d p.a. through to 20231
›Supply side challenges in Iran, Libya and Venezuela
›Underinvestment and depletions costs 3 mb/d p.a.
›IEA: US to provide majority of global supply growth1
Why Weir benefits
›~80% of revenues from attractive NAM markets
›Strong and growing technology leadership
›Unrivalled service coverage includes all major basins
1 IEA, Oil 2018, 2 IHs Markit 3 EIA Annual Energy Outlook 2018
0
5
10
15
15Q1 15Q3 16Q1 16Q3 17Q1 17Q3 18Q1 18Q3F
Completions continue to recover strongly2
Frack demand
0
50
100
150
200
250
1990 2000 2010 2020 2030 2040
petroleum
coal
natural gas
renewables
nuclear
Global energy consumption by fuel type3
(quadrillion BTU)

19
Grow: Differentiating through Technology leadership
First Simplified Frac System
Solution from pump to wellhead
›Integrated Pressure Pumping and Pressure
Control system
›Large bore iron and valves simplify the frac
job
Safer and faster
›88% reduction in leak paths
›Significant improvement in safety
›Reduced rig up and de-rig times
US$10m in orders in H1
A traditional frack site has 100s of connections
The Simplified Frac System is safer and more efficient

20
2018 Outlook
Minerals
›Expectations for strong constant currency profit growth unchanged
›Strong revenue growth and broadly stable margins YoY
Oil & Gas
›Continue to anticipate strong increase in constant currency revenues and profits
›Mid teens H2 operating margins consistent with H1 and prior guidance
ESCO
›Unchanged expectations for 2018; pro forma revenue of $675m and $80m EBITA
›Even phasing of revenue and profit pre and post acquisition
Flow Control
›Broadly stable constant currency revenues
›Mid single-digit operating margins
Group
›Outlook assumes market conditions remain supportive
›Strong constant currency revenue and profit growth
›Further balance sheet deleveraging and strong cash generation

Transform:
Long-term growth
Jon Stanton

2.5x ~2.0x
Weir2017A
Pro forma2018E
2019+
Transform: Creating an ever stronger Weir
22
A portfolio of global leading brands
Focusing on highly abrasive upstream
Exposure to resilient aftermarket
Financial strength to invest in growth1
SPM® Pressure Pumping solutions
Ground Engaging Tools
77%
69%
23%
31%
Pro-FormaIncl. ESCOExcl. Flow
Control
Weir2017A
AM OE
51%
39%
32%
38%
9%
17%
8% Pro-FormaIncl. ESCOExcl. Flow…
Weir2017A
Minerals Oil Industry Industrial & Power Sand & Aggregates Other
Cash generation
Flow Control proceeds
Revenue split
Revenue split
WARMAN® Centrifugal Slurry pumps
1 Pro forma net debt / adjusted EBITDA

23
Transform: A unique mining provider

24
Transform: Strong start to the integration process
Excellent first impressions
Experienced integration team
Revenue synergy work progressing well
US$30m cost synergy targets validated
Operating model to maximise upturn
Welcome to Weir event for the ESCO team

Key takeaways
25
Execute Delivering strong growth in line with expectations
Strategic progress in attractive markets
Grow
Transform
Building a platform for long term growth

Questions

Appendices

Appendix 1: Quarterly order trends Reported growth1 Like for like growth1, 2
Division 2017
Q3
2017
Q4
2018
Q1
2018
Q2
2017
Q3
2017
Q4
2018
Q1
2018
Q2
OE 19% 10% 19% - 19% 10% 19% -
AM 9% 8% 11% 16% 9% 8% 11% 16%
Minerals Total 12% 9% 13% 11% 12% 9% 13% 11%
OE 92% 130% 91% 33% 82% 97% 84% 22%
AM 52% 46% 40% 19% 50% 43% 38% 17%
Oil & Gas Total 59% 60% 50% 22% 56% 52% 47% 18%
OE 34% 32% 36% 9% 32% 26% 34% 6%
AM 23% 20% 21% 17% 22% 19% 20% 17%
Continuing Ops Total 25% 23% 25% 15% 24% 21% 24% 13%
Book to bill 0.99 0.96 1.15 1.05 1.00 0.96 1.15 1.05
OE -8% -1% -3% 110% -8% -1% -3% 110%
AM 7% 17% 6% 28% 7% 17% 6% 28%
Discontinued Ops Total -2% 6% 2% 61% -2% 6% 2% 61%
1 Continuing operations excludes the Flow Control Division which is being reported as discontinued operations after the announcement of the Group’s intention to sell on 19 April 2018. 2 Like for like excludes the impact of acquisitions (KOP Surface Products excluded for 2017).
28

Appendix 2: Orders by end market and geography
Orders by end market Minerals Oil & Gas
H1
Continuing
operations
2018
Total
H1
Continuing
operations
20171
Total
Discontinued
operations
2018
Total
Minerals 75% 0% 47% 48% 1%
Oil & Gas 6% 98% 41% 37% 19%
Power 5% 1% 3% 4% 45%
Sand & Aggregates 3% 0% 2% 4% 0%
General Industrial 10% 1% 7% 7% 13%
Other 1% 0% 0% 0% 22%
Total 100% 100% 100% 100% 100%
1 2017 restated at H1 2018 average exchange rates.
29
Orders by geography Minerals Oil & Gas
H1
Continuing
operations
2018
Total
H1
Continuing
operations
20171
Total
Discontinued
operations
2018
Total
North America 21% 80% 43% 43% 34%
Europe & FSU 12% 5% 9% 9% 33%
Australasia 16% 1% 10% 11% 1%
Middle East & Africa 14% 8% 12% 12% 9%
South America 22% 0% 14% 14% 1%
Asia Pacific 15% 6% 12% 11% 22%
Total 100% 100% 100% 100% 100%

Appendix 3: Foreign exchange by currency
H1 2017 Revenue £m H1 2017 Operating profit1 £m
Currency At 2017
rates FX
At 2018
rates
At 2017
rates FX
At 2018
rates
US Dollar 426 (37) 389 63 (5) 58
Australian Dollar 124 (8) 116 13 (1) 12
Canadian Dollar 78 (4) 74 12 - 12
Euro 29 1 30 8 - 8
Chilean Peso 65 (1) 64 18 (1) 17
United Arab Emirates Dirham 29 (2) 27 3 - 3
South African Rand 56 (1) 55 5 - 5
Brazilian Real 23 (3) 20 2 - 2
Russian Rouble 12 (1) 11 2 - 2
Other 80 (1) 79 (2) (1) (3)
Continuing operations 922 (57) 865 124 (8) 116
Variance (6%) (8%)
Interest (20) 1 (19)
PBTA 104 (7) 97
Variance (7%)
1 Adjusted to exclude exceptional items and intangibles amortisation.
30

Appendix 4: Foreign exchange by division
H1 2017 Revenue £m H1 2017 Operating profit1 £m
Division At 2017
rates FX FX %
At 2018
rates
At 2017
rates FX FX %
At 2018
rates
Minerals 608 (32) (5%) 576 105 (5) (5%) 100
Oil & Gas 314 (25) (8%) 289 32 (3) (8%) 29
Central costs - - - - (13) - (1%) (13)
Continuing operations 922 (57) (6%) 865 124 (8) 7% 116
Discontinued operations 165 (4) (3%) 161 (11) 0 5% (11)
1 Adjusted to exclude exceptional items and intangibles amortisation.
31

Appendix 5:Foreign exchange headwind expected in 2018
FY 2017 Revenue £m FY 2017 Operating profit1 £m
Currency At 2017
rates FX
At 20182
rates
At 2017
rates FX
At 20182
rates
US Dollar 923 (60) 863 168 (11) 157
Australian Dollar 264 (16) 248 29 (2) 27
Euro 60 - 60 16 - 16
Canadian Dollar 161 (8) 153 28 (1) 27
Chilean Peso 141 (1) 140 38 (1) 37
South African Rand 112 1 113 9 - 9
United Arab Emirates Dirham 58 (4) 54 4 - 4
Brazilian Real 45 (5) 40 5 (1) 4
Russian Rouble 32 (2) 30 5 - 5
Other 187 - 187 (10) - (10)
Continuing operations 1,983 (95) 1,888 292 (16) 276
Variance (5%) (5%)
Interest (42) 1 (41)
PBTA 250
(15) 235
Variance (6%)
1 Adjusted to exclude exceptional items and intangibles amortisation.
2 2018 FX rates reflect June 2018 average
32

33
Appendix 6: Exchange rates
H1 2018
Average
H1 2018
Closing
H1 2017
Average
H1 2017
Closing
US Dollar 1.38 1.32 1.26 1.30
Australian Dollar 1.78 1.78 1.67 1.69
Euro 1.14 1.13 1.16 1.14
Canadian Dollar 1.76 1.73 1.68 1.69
United Arab Emirates Dirham 5.06 4.85 4.62 4.78
Chilean Peso 842.00 861.70 830.80 863.50
South African Rand 16.92 18.15 16.63 16.98
Brazilian Real 4.71 5.10 4.00 4.30
Russian Rouble 81.73 82.78 73.00 76.92

Disclaimer
This information includes ‘forward-looking statements’. All statements other than statements of
historical fact included in this presentation, including, without limitation, those regarding The Weir
Group’s (“the Company”) financial position, business strategy, plans (including development plans
and objectives relating to the Company’s products and services) and objectives of management for
future operations, are forward-looking statements. These statements contain the words “anticipate”,
“believe”, “intend”, “estimate”, “expect” and words of similar meaning. Such forward-looking
statements involve known and unknown risks, uncertainties and other important factors that could
cause the actual results, performance or achievements of the Company to be materially different
from future results, performance or achievements expressed or implied by such forward-looking
statements. Such forward-looking statements are based on numerous assumptions regarding the
Company’s present and future business strategies and the environment in which the Company will
operate in the future. These forward-looking statements speak only as at the date of this document.
The Company expressly disclaims any obligation or undertaking to disseminate any updates or
revisions to any forward-looking statements contained herein to reflect any change in the
Company’s expectations with regard thereto or any change in events, conditions or circumstances
on which any such statement is based. Past business and financial performance cannot be relied
on as an indication of future performance.