coupled effects on the transport and deposition of … › items › 97037601-ab51-4415...the...
TRANSCRIPT

Coupled effects on the transport and deposition of biocolloidal
particles in saturated porous media
by
Huixin Zhang
A thesis submitted in partial fulfillment of the requirements for the degree of
Doctor of Philosophy
in
Environmental Engineering
Department of Civil and Environmental Engineering
University of Alberta
© Huixin Zhang, 2015
II
Abstract
The transport and deposition of biocolloidal particles in porous media is a crucial
phenomenon in understanding environmental challenges from pathogen contamination to
bioremediation of soil and water. The fate and transport of biocolloidal particles in
porous media is influenced by many factors ranging from the bulk solution condition (e.g.
ionic strength and oxygen tension), microbial particle’s surface property (e.g. surface
charge and extracellular polymeric substances (EPS)) to porous media property (e.g.
surface charge). This dissertation is focused on exploring the role anaerobic conditions
have on microbial cell transport in packed bed columns and the mechanisms involved in
the transport process. In addition, this dissertation evaluated the filtration of a recently
developed surrogate for pathogenic Cryptosporidium and elucidated the mechanisms
affecting its removal.
The body of work was constructed in three individual parts.
In the first part, experiments were performed in glass bead packed bed columns under
strictly anaerobic conditions to examine the effects of solution ionic strength (1, 10 and
100 mM) on the transport of three microbial species (Dehalococcoides, Geobacter, and
Methanomethylovorans) in an enriched anaerobic trichloroethene (TCE) dechlorinating
mixed culture. Experimental results interestingly indicated that regardless of the
microorganisms’ distinct surface properties, they showed similar travel ability with
normalized breakthrough concentrations (C/C0) of 0.95, 0.84, and 0.56 at 1, 10 and 100
mM, respectively. The microorganisms also exhibited almost equal sensitivity to solution
ionic strength changes, possibly due to interactions and the heterogeneity among different

III
microbial species in the culture. When using this culture for in situ bioremediation of
TCE contaminated sites, success can be readily achieved when the microbial species in
the culture travel in a similar fashion.
In the second part, experiments were performed in glass bead packed bed columns
under aerobic and strictly anaerobic conditions to examine the effects of solution ionic
strength (1, 10 and 100 mM) and oxygen tension on the fate of the facultative
Pseudomonas aeruginosa. Experimental results indicated that growth under aerobic or
anaerobic conditions altered the surface properties of P. aeruginosa through bacterial
surface substrates (e.g. 1.19 and 1.23 times higher protein and polysaccharides content
under anaerobic conditions than under aerobic conditions). This significantly influenced
the transport and deposition of P. aeruginosa in the saturated porous media as lower
normalized breakthrough concentrations were observed under aerobic conditions (C/C0 =
0.89, 0.61 and 0.44 at 1, 10 and 100 mM, respectively) as compared to anaerobic
conditions (C/C0 = 0.90, 0.74, 0.54 at 1, 10 and 100 mM, respectively). When predicting
the travel trajectory of P. aeruginosa through natural aquifers, practitioners need to be
aware that deposition rates obtained under aerobic conditions are not the same under
anaerobic conditions. As such, research exploring the transport ability of a broad range of
species under anaerobic conditions needs to be further developed.
In the third part, experiments were performed in quartz sand packed bed columns
under aerobic conditions to examine how a Cryptosporidium surrogate (glycoprotein
modified microspheres) transport is affected by variables such as flow velocity, alum
addition and humic acid (HA) adsorption. Experimental results showed increased
normalized breakthrough concentrations of the glycoprotein modified microspheres with

IV
increased flow rate (C/C0 of 0.006, 0.017 and 0.030 at 4.6, 10.9 and 21.8 m/day,
respectively), possibly due to increased hydrodynamic forces. Addition of 5 mg/L alum
significantly increased the removal of the modified microspheres (C/C0 of 0.003, 0.003
and 0.010 at 4.6, 10.9 and 21.8 m/day, respectively), while the adsorption of 1 mg/L HA
on the sand collector induced the opposite effect (C/C0 of 0.062 and 0.015 as compared to
0.017 and 0.003 at 10.9 m/day). The combined effects of alum and HA for
Cryptosporidium surrogate removal seemingly eliminated the effects of alum in filtration.
The utilization of this surrogate can satisfy the need for studying the filtration of
Cryposporidium as their surface properties and structures resembled well to those of the
viable Cryptosporidium, while eliminating personnel health hazards.

V
Preface
This thesis is an original work by Huixin Zhang under the supervision of Dr. Yang Liu
and Dr. Ania Ulrich. Chapter 3 of this thesis has been published as Zhang, H., Ulrich,
A.C., Liu, Y., 2015. Retention and transport of an anaerobic trichloroethene
dechlorinating microbial culture in anaerobic porous media. Colloids and Surfaces B:
Biointerfaces, 130, 110-118.
The surrogates used in Chapter 5 of this thesis were prepared in the lab of Dr. Ravin
Narain in the Department of Chemical and Materials Engineering at University of Alberta.

VI
Acknowledgement
Completing the PhD program is probably the most challenging part of my life in the
past years. It has been a great privilege to study and research in the Department of Civil
and Environmental Engineering at University of Alberta. I would like to take this
opportunity to thank all the persons who helped me making it possible to complete my
PhD program.
First and foremost, I am extremely grateful to my supervisors, Dr. Yang Liu and Dr.
Ania Ulrich, for their continuous support, motivation, and patience throughout my
research. They have been great mentors for me, and they are great examples to follow. I
would not have come to today without their invaluable guidance, inspiration and
suggestion. It truly was one of the greatest experiences in my life. Words cannot express
my gratefulness for their contribution to my personal and professional growth.
I would like to thank Dr. Hongbo Zeng in the Department of Chemical and Materials
Engineering for the measurement of zeta potential. Kind collaboration of Dr. Ravin
Narain for preparing the surrogates used in Chapter 5 is appreciated. In addition, I thank a
number of technicians and research assistants for their advice and support: Elena
Dlusskaya, Emily Cao, Jela Burkas, Chen Liang, and Maria Demeter in the Department
of Civil and Environmental Engineering at University of Alberta. Thank you to all my
colleagues from both labs. I would especially like to thank Lisa, Xiaohui, Zhiya, Jiaming,
Weibing, Jeff, Yinan, Christina, Melissa, Simmon and Dena for helping and teaching me
everything.

VII
I also would like to thank Dr. Ian Buchanan at the Department of Civil and
Environmental Engineering and Dr. Ravin Narain at the Department of Chemical and
Materials Engineering from University of Alberta for serving as my examination
committee members and their valuable suggestions on my dissertation. Special thanks to
Dr. Gordon Chua at the Department of Biological Sciences from University of Calgary
for being the external examiner for my final defense and his valuable comments on my
work.
I would like to thank the Natural Sciences and Engineering Research Council of
Canada (NSERC), the Helmholtz Alberta Initiative (HAI) and EPCOR Water Services
Inc. for providing generous funding for my research.
I have had great support from many friends and family through the years. Last and
most importantly, I would like to thank my parents and my sister, for their steadfast
encouragement and unconditional love over the years. I can never fully express how
lucky I feel to have them in my life.

VIII
Table of Contents
Abstract ........................................................................................................................... II
Preface..............................................................................................................................V
Acknowledgement ...................................................................................................... VI
Table of Contents .....................................................................................................VIII
List of Tables ............................................................................................................ XIV
List of Figures............................................................................................................. XV
List of Symbols and Abbreviation .................................................................... XIX
Chapter 1. Introduction ......................................................................................... - 1 -
1.1 The transport of colloidal particles in porous media ...................................... - 2 -
1.2 Objectives ............................................................................................................ - 7 -
1.3 Organization of thesis ......................................................................................... - 9 -
Chapter 2. Theoretical Background and Literature Review ................. - 17 -
2.1 Theoretical background .................................................................................. - 18 -
2.1.1 Transport phenomena of microbial particles in porous media ..................... - 18 -
2.1.2 Classic colloid filtration theory (CFT) ........................................................ - 20 -
2.1.2.1 What is CFT? ........................................................................................ - 20 -
2.1.2.2 Deviations from CFT prediction ........................................................... - 22 -

IX
2.1.3 Derjaguin-Landau-Verwey-Overbeek (DLVO) theory of colloid stability ..... 27
2.1.3.1 What is the DLVO theory? ........................................................................ 27
2.1.3.2 Representations of the DLVO interaction energy profiles ........................ 30
2.1.3.3 Factors affecting the interaction energies ................................................ 31
2.1.3.4 Non-DLVO interactions ............................................................................ 33
2.2 Literature review .................................................................................................. 33
2.2.1 Factors affecting the transport and retention of colloidal particles ................. 33
2.2.2 Introduction to the particles used in this dissertation ...................................... 38
2.2.2.1 The dechlorination culture – KB-1®
......................................................... 38
2.2.2.2 Pseudomonas aeruginosa ......................................................................... 43
2.2.2.3 Cryptosporidium and its surrogate ........................................................... 45
Chapter 3. Retention and Transport of an Anaerobic Trichloroethene
Dechlorinating Microbial Culture in Anaerobic Porous Media* ............. 62
3.1 Introduction ........................................................................................................... 63
3.2 Materials and methods ........................................................................................ 67
3.2.1 Anaerobic microbial culture maintenance and preparation ............................. 67
3.2.2 Electrokinetic potential measurements and DLVO interaction energy
calculations ............................................................................................................... 69
3.2.3 Porous media preparation and transport experiments in packed-bed columns 71
3.2.4 DNA extraction and cell enumeration ............................................................. 73

X
3.2.5 Statistical analysis ............................................................................................ 74
3.3 Results and discussion ........................................................................................... 74
3.3.1 Electrokinetic potentials of microbial cells ...................................................... 74
3.3.2 Column transport experiments ......................................................................... 76
3.3.3 Profiles of retained microbial cells .................................................................. 79
3.3.4 Modeling using DLVO theory-interaction energy profiles ............................. 81
3.3.5 Deviations from DLVO predictions ................................................................. 86
3.4 Conclusions ............................................................................................................ 90
Chapter 4. Comparison of the Transport and Deposition of
Pseudomonas aeruginosa under Aerobic and Anaerobic Conditions* .. 103
4.1 Introduction ......................................................................................................... 104
4.2 Materials and methods ....................................................................................... 106
4.2.1 Bacterial cultivation and cell preparation ...................................................... 106
4.2.2 Electrokinetic potential measurements .......................................................... 107
4.2.3 Bacterial cell size ........................................................................................... 108
4.2.4 EPS composition analysis .............................................................................. 109
4.2.5 XPS analysis of bacterial cells ....................................................................... 110
4.2.6 Granular porous medium preparation ............................................................ 111
4.2.7 Transport experiments in packed-bed columns ............................................. 111
4.2.8 Bacterial enumeration procedures .................................................................. 113

XI
4.2.9 Statistical analysis .......................................................................................... 113
4.3 Results and discussion ........................................................................................ 114
4.3.1 Electrokinetic potential of bacterial cells ....................................................... 114
4.3.2 Column transport experiments ....................................................................... 115
4.3.3 Profiles of retained bacterial cells .................................................................. 118
4.3.4 Extracted EPS compositions .......................................................................... 121
4.3.5 Bacterial surface elements ............................................................................. 122
4.3.6 Interpretation using DLVO theory ................................................................. 124
4.4 Conclusions .......................................................................................................... 127
Chapter 5. Filtration of Cryptosporidium Oocysts Surrogates in Porous
Media: Effects of Flow Rate, Alum, and Humic Acid* .............................. 138
5.1 Introduction ......................................................................................................... 139
5.2 Materials and methods ....................................................................................... 143
5.2.1 Microspheres and conjugation of biomolecules with microspheres .............. 143
5.2.2 Humic acid solution preparation .................................................................... 144
5.2.3 Determination of zeta potentials and particle size ......................................... 144
5.2.4 Porous media .................................................................................................. 145
5.2.5 Experimental conditions ................................................................................ 145
5.2.6 Sample collection and analysis ...................................................................... 147
5.3 Results and discussion ........................................................................................ 148

XII
5.3.1 Electrokinetic properties of microspheres and DLVO interaction energy
calculations ............................................................................................................. 148
5.3.2 Observed transport and retention behaviors of modified microspheres ........ 151
5.3.2.1 Influence of flow rate .............................................................................. 151
5.3.2.2 Influence of alum .................................................................................... 156
5.3.2.3 Influence of HA ...................................................................................... 158
5.3.2.4 Influence of particle size ......................................................................... 164
5.4 Conclusions .......................................................................................................... 165
Chapter 6. Conclusions .......................................................................................... 176
6.1 Summary of findings ........................................................................................... 177
6.1.1. Chapter 3. Retention and transport of an anaerobic trichloroethene
dechlorinating microbial culture in porous media .................................................. 177
6.1.2. Chapter 4. Comparison of the transport and deposition of Pseudomonas
aeruginosa under aerobic and anaerobic conditions ............................................... 178
6.1.3. Chapter 5. Filtration of Cryptosporidium oocysts surrogates in porous media:
Effects of flow rate, alum, and humic acid ............................................................. 179
6.2 Recommendations .............................................................................................. 180
References ................................................................................................................... 182
Appendices ................................................................................................................. 212
Appendix A. Defined Mineral Medium (Chapter 3).............................................. 213

XIII
Appendix B. Detailed Procedure for DNA Isolation (Chapter 3) ......................... 215
Appendix C. Sequences of Targeted Genes from qPCR (Chapter 3) .................. 217
Appendix D. Parameter Values used in DLVO Calculations ............................... 219

XIV
List of Tables
Table 2.1 Review of several laboratory column studies with nonexponential deposition of
colloidal particles (adapted from Bradford and Bettahar 2005, Tufenkji et al. 2003). ..... 24
Table 2.2 Operational taxonomic unit (OTU) detected in the KB-1® clone libraries
(adapted from Duhamel and Edwards 2006) .................................................................... 40
Table 3.1 Targeting microorganims and primer sequences ............................................. 74
Table 3.2 Cell recovery percentage from column experiments. ...................................... 81
Table 3.3 Calculated DLVO interaction parameters. ....................................................... 85
Table 4.1 Cell recovery percentage from column experiments. .................................... 120
Table 4.2 The percentage elemental composition (atomic concentration %), ratio of N/C
and O/C, proportion of carbon associated with three classes of molecular constituents
(proteins, polysaccharides, and hydrocarbon-like products), and the weight fractions of
each constituent for the bacterial cell surface. ................................................................ 123
Table 5.1 Porous media experimental conditions (1 mM KCl) and mass recovery ....... 147
Table 5.2 Zeta potentials of microspheres in 1 mM KCl and sands .............................. 149
Table 5.3. DLVO interaction energy calculations .......................................................... 150

XV
List of Figures
Figure 2.1 Schematic representation of removal efficiency to particle size distribution
(adapted from Yao et al. 1971). .................................................................................... - 20 -
Figure 2.2 Schematic representations of total DLVO interaction energy profiles as a
function of separation distance: (a) quantitative example for equal spherical particles of 1
µm diameter in 100 mM NaCl electrolyte, zeta potential (ζ) = -25 mV, A = 8.3 × 10⁻²¹
J;
and (b) three patterns of the interaction energy profiles (adapted from Elimelech 1998). 29
Figure 3.1 Surface zeta potential of three microbial species in KB-1® culture
(Dehalococcoides, Geobacter, Methanomethylovorans), and glass beads. Ionic strengths:
1 mM, 10 mM, 100 mM NaCl. Error bars represent standard deviations of three
measurements. ................................................................................................................... 75
Figure 3.2 Breakthrough curves of three microbial species in KB-1® culture
(Dehalococcoides, Geobacter, Methanomethylovorans) under three solution ionic
strengths: 1 (A), 10 (B), and 100 mM (C) NaCl. Cells injection started at pore volume 0
and ended at pore volume 4. Experimental conditions were as follows: approach velocity
= 0.0042 cm/s, porosity = 0.4, and pH = 6.3 – 6.6. Error bars represent standard
deviations of three measurements. .................................................................................... 77
Figure 3.3 Microbial deposition rate coefficient (kd) determined from the breakthrough
curves (Figure 3.2) using equation 3.3. Ionic strengths: 1 mM, 10 mM, 100 mM NaCl.
Error bars represent standard deviations of three measurements. ..................................... 78

XVI
Figure 3.4 Measured retained cell concentration profiles in single 14 cm column
(symbols in A1-A3, B1-B3, C1-C3). The microbial species are: Dehalococcoides (A1, B1,
and C1); Geobacter (A2, B2, and C2); and Methanomethylovorans (A3, B3, and C3). The
ionic strengths for the carrying solutions are as follows: 1 mM NaCl (A1-A3); 10 mM
NaCl (B1-B3); and 100 mM NaCl (C1-C3). Dashed lines represent predictions based on
the classic colloid filtration theory (CFT) using deposition rate coefficient (kd). Data were
presented in a semilog format. Error bars represent standard deviations of three
measurements. ................................................................................................................... 80
Figure 3.5 Calculated DLVO interaction energy plotted as a function of separation
distance for different solution ionic strengths: 1 mM (A), 10 mM (B), and 100 mM (C);
and (insets) the expanded drawing to highlight the secondary energy minimum.
Experimentally measured zeta potentials (Figure 3.1) and a Hamaker constant of 4.16 ×
10-21
J were used to calculate interaction energies. ........................................................... 83
Figure 4.1 Surface zeta potentials of P. aeruginosa PAO1, and glass beads as a function
of solution chemistry. Ionic strengths: 1 mM, 10 mM, 100 mM NaCl solution. Error bars
represent standard deviations of three measurements. .................................................... 114
Figure 4.2 Breakthrough curves of P. aeruginosa PAO1 under three solution ionic
strengths: 1 mM, 10 mM, and 100 mM NaCl, under aerobic (A) and anaerobic (B)
conditions. Error bars represent standard deviations of three measurements. ................ 116
Figure 4.3 Comparison of deposition rate coefficient (kd) under aerobic and anaerobic
conditions determined from the breakthrough under various solution chemistry. Error
bars represent standard deviations of three measurements. ............................................ 117
XVII
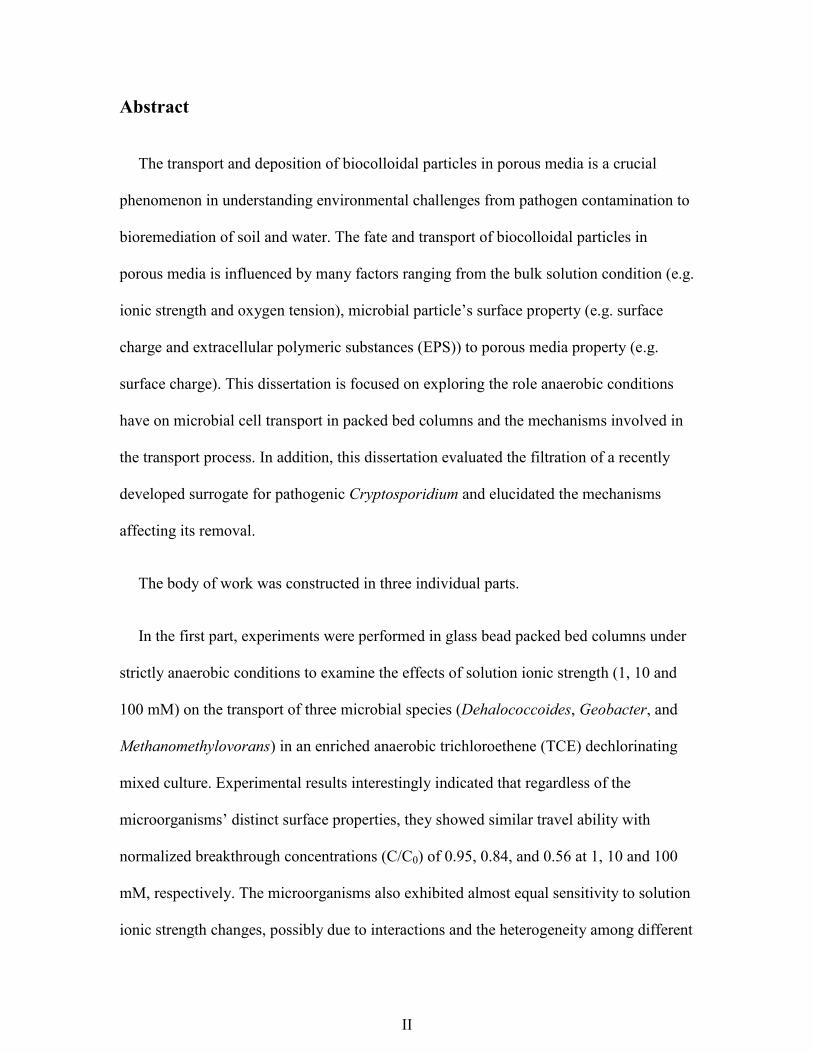
Figure 4.4. Measured retained PAO1 cell concentration profiles in single 14 cm column
under aerobic (A1-A3), and anaerobic (B1-B3) conditions. The ionic strengths for the
carrying solutions are as follows: 1 mM NaCl (A1, B1); 10 mM NaCl (A2, B2); and 100
mM NaCl (A3, B3). Dashed lines represent predictions based on the classic colloid
filtration theory (CFT) using deposition rate coefficient (kd). Data were presented in a
semilog format. Error bars represent standard deviations of three measurements. ........ 118
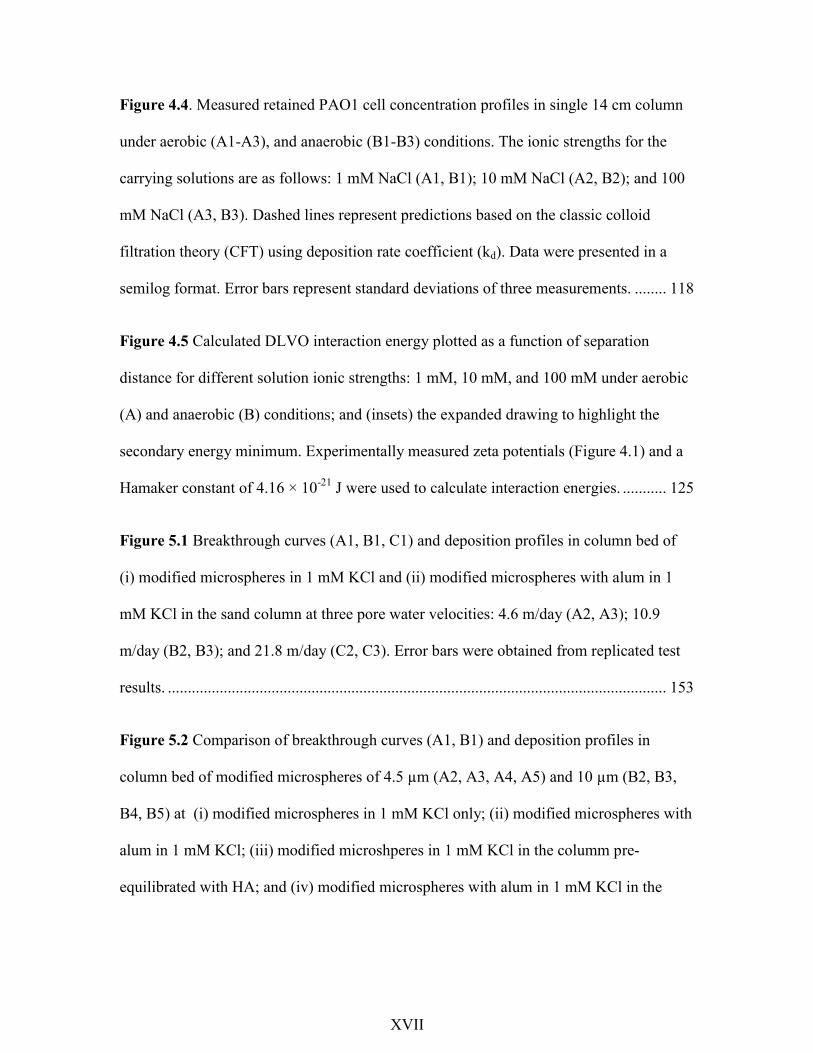
Figure 4.5 Calculated DLVO interaction energy plotted as a function of separation
distance for different solution ionic strengths: 1 mM, 10 mM, and 100 mM under aerobic
(A) and anaerobic (B) conditions; and (insets) the expanded drawing to highlight the
secondary energy minimum. Experimentally measured zeta potentials (Figure 4.1) and a
Hamaker constant of 4.16 × 10⁻²¹
J were used to calculate interaction energies. ........... 125
Figure 5.1 Breakthrough curves (A1, B1, C1) and deposition profiles in column bed of
(i) modified microspheres in 1 mM KCl and (ii) modified microspheres with alum in 1
mM KCl in the sand column at three pore water velocities: 4.6 m/day (A2, A3); 10.9
m/day (B2, B3); and 21.8 m/day (C2, C3). Error bars were obtained from replicated test
results. ............................................................................................................................. 153
Figure 5.2 Comparison of breakthrough curves (A1, B1) and deposition profiles in
column bed of modified microspheres of 4.5 µm (A2, A3, A4, A5) and 10 µm (B2, B3,
B4, B5) at (i) modified microspheres in 1 mM KCl only; (ii) modified microspheres with
alum in 1 mM KCl; (iii) modified microshperes in 1 mM KCl in the columm pre-
equilibrated with HA; and (iv) modified microspheres with alum in 1 mM KCl in the

XVIII
sand column pre-equilibrated with HA. Pore water velocity = 10.9 m/day. Error bars were
obtained from replicated test results. .............................................................................. 161

XIX
List of Symbols and Abbreviation
α Collision efficiency
ε0 Dielectric permittivity in a vacuum
εr Relative dielectric permittivity of water
ζ Zeta potential
η Single collector efficiency
κ Inverse Debye length
λ Characteristic wavelength of the dielectric
ρb Porous medium bulk density
ψc Surface potential of collector
ψp Surface potential of particle
ap Colloidal particle radius
A Hamaker constant
C/C0 Normalized column breakthrough concentration
f Porosity
h Separation distance from approaching particle to collector surface
kd Deposition rate coefficient
L Length of column
S(X) Particle deposition concentration in column bed
t0 Duration of continuous particle injection
U Approach (superficial) velocity
VA Energy of van der Waals attraction
VR Energy of electrical double layer interaction
VT Total interaction energy
X Column depth
AGW Artificial Groundwater
AGP Alpha-1-acid Glycoprotein
ANOVA Analysis of Variance
CFT Colloid Filtration Theory
CFU Colony Forming Units

XX
CV Coefficient Variation
DCE Dichloroethene
DGGE Denaturing Gradient Gel Electrophoresis
DLVO Derjaguin-Landau-Verwey-Overbeek
DNA Deoxyribonucleic Acid
DNAPL Dense nonaqueous phase liquid
DO Dissolved Oxygen
EB Energy Barrier
EDL Electrical Double Layer
EPS Extracellular Polymeric Substances
HA Humic Acid
HC Hydrocarbon
IP Isoelectric Point
IS Ionic Strength
LB Luria-Bertani
LPS Lipopolysaccharides
NOM Natural Organic Matter
OTU Operational Taxonomic Unit
PAH Polycyclic Aromatic Hydrocarbons
PCE Tetrachloroethene
PM Primary Minimum
PR Protein
PS Polysaccharides
qPCR Quantitative Polymerase Chain Reaction
SEM Scanning Electron Microscopy
SM Secondary Minimum
TCE Trichloroethene
TOC Total Organic Carbon
UV Ultraviolet
VC Vinyl Chloride
XPS X-ray Photoelectron Spectroscopy

- 1 -
Chapter 1. Introduction

- 2 -
1.1 The transport of colloidal particles in porous media
Clean drinking water is one of the most pressing global environmental and health
problems of our time. About 30% of fresh water comes from groundwater (Gleick 1993),
therefore, groundwater contamination often leads to serious drinking water outbreaks. For
example, an outbreak of Cryptosporidium in Brush Creek, Texas, USA occurred when
untreated groundwater was consumed, which affected 1,300 to 1,500 people in July 1998
(Bergmire-Sweat et al. 1999). In May 2000, an outbreak of Escherichia coli O157:H7
occurred in a groundwater supply in Walkerton, Ontario, Canada, which led to seven
deaths and over two thousand local residents became ill (Mclaughlin 2000). It was
estimated that this outbreak in Walkerton caused them an economic impact of around
$155 million including fixing the water supply system, lost business revenues, and
spending on household and corporate bottled water and disinfection equipment, according
to a CBC News report (2010). But these are just a few examples. From 1971 to 2006,
54% of reported drinking water outbreaks were caused by the consumption of untreated
groundwater (31%) or deficiencies in groundwater treatment (23%) (Craun et al. 2010).
These groundwater outbreaks were commonly caused by the transport of parasites
(Cryptosporidium sp., Giardia intestinalis), bacteria (E. coli O157:H7, Salmonella spp.)
and viruses (norovirus, Hepatitis A) to the water supply systems (CDC 2013, Craun et al.
2010).
Chemical contamination of groundwater systems through inappropriate waste disposal
is also a large contributor to the problem. Residential consumption of trichloroethene
contaminated water in Woburn, Massachusetts has led to an unusually high incidence of
childhood leukemia and other illnesses during the mid to late 1970s (Costas et al. 2002).
- 3 -
Even today, trichloroethene is still listed as a possible human carcinogen by the US
Environmental Protection Agency (EPA). In situ bioremediation is generally accepted as
the least expensive remediation option based on a review performed by McDade et al. in
2005. They reported that bioremediation had the lowest cost per treatment volume of
$29/yd3, as compared to thermal ($88/yd
3), chemical oxidation ($125/yd
3) and
surfactant/cosolvent ($385/yd3) when treating dense nonaqueous phase liquid (DNAPL)
sites (McDade et al. 2005). To improve bioremediation efforts an understanding of
microbial transport in subsurface environments will only help.
As outlined above, an understanding of the transport and deposition behaviors of
colloidal particles in saturated porous media is of considerable interest in natural and
engineered systems. A thorough grasp of particle filtration is essential for predicting the
fate and transport of microbial particles, such as bacteria, viruses and protozoa in a
subsurface environment (Liu et al. 2007, Tufenkji and Elimelech 2004a, Tufenkji et al.
2002). Particle transport and retention is also the basis of the granular filtration process in
water and wastewater treatment (Yao et al. 1971).
Transport of colloidal particles from the bulk fluid to the vicinity of a filter grain is
typically governed by three mechanisms: interception, gravity sedimentation, and
Brownian diffusion. Interception occurs when a particle moving along the flow
streamline comes into contact with the collector grain due to its finite size. Gravity
sedimentation refers to the settling of particles that are heavier than the surrounding fluid
onto the collector surface. Brownian diffusion happens when particle movement is caused
due to the random bombardment of molecules in the solution. These mechanisms were

- 4 -
described by Yao et al. in 1971 when they presented a conceptual model for water and
wastewater filtration processes (Yao et al. 1971).
Yao et al. (1971) developed the classic colloid filtration theory, which predicts that
particle concentration in the fluid phase is represented by first order kinetics with a
spatially and temporally constant colloid deposition rate coefficient. Based on this, the
concentration of suspended and retained particles in porous media is considered to
decrease exponentially with travel distance. Yao’s theory, can determine the deposition
rate coefficient from the fraction of colloids recovered from the effluent of packed bed
columns or aquifers and can evaluate the deposited particle concentrations in the packed
bed column (Tufenkji and Elimelech 2004a, Tufenkji et al. 2003).
However, a growing number of studies have demonstrated deviations between retained
particle profiles in packed bed column experimental data and the log-linear decrease
pattern as anticipated from Yao’s theory, thus, implying that Yao’s theory failed to
adequately predict transport behaviors under certain conditions. More recently, the
predicted log-linear exponential decrease, the hyperexponential and power law decreases
became the most commonly observed patterns (Tong and Johnson 2007, Tufenkji et al.
2003). Studies have revealed that various factors can cause the observed discrepancy,
including but not limited to heterogeneity in the microbial population and on collector
surfaces, straining, block and release of previously attached particles, and unfavorable
conditions for deposition calculated from the classical Derjaguin-Landau-Verwey-
Overbeek (DLVO) theory (Baygents et al. 1998, Bradford et al. 2002, Silliman et al. 2001,
Tufenkji et al. 2003).

- 5 -
For efficient removal or deposition, particles transported to the collector surfaces in
porous media should have effective contacts with the collector grains through irreversible
initial attachment, i.e. have a favorable condition for deposition. In order to explain the
effects of electrolyte concentrations on the initial adhesion of bacterial cells onto solid
surfaces in aquatic systems, the DLVO theory has been used as a qualitative model, but
also in quantitative ways to calculate adhesion free energy changes involved in initial
microbial adhesion. The use of DLVO theory for explaining bacterial adhesion was first
suggested by Marshall et al. (1971). Specifically, DLVO theory states that the total
interaction energies existing between a colloidal particle and a collector surface can be
expressed as the sum of the attractive van der Waals and electrostatic double layer
interactions, which can be either attractive or repulsive. However, it fails to yield a
universal application (Hermansson 1999).
As discussed above, the interactions between particles and collectors in the porous
media were found to be affected by various factors. Therefore, the factors affecting the
transport and deposition behaviors of particles in porous media can be roughly divided
into these three components: (1) For biotic and abiotic particles, their size, shape, motility,
concentration, surface properties (e.g. zeta potential and hydrophobicity) and surface
structures (e.g. lipopolysaccharides and extracellular polymeric substances) (Camesano
and Logan 1998, Liu et al. 2007, Seymour et al. 2013, Walker et al. 2004) can lead to
distinct transport ability; (2) Change of solution chemistry (ionic strength, chemical
composition) and bulk flow rate can also change the retention of particles in packed bed
columns (Camesano and Logan 1998, Chen and Walker 2012); and (3) Lastly, different
porous media characteristics, such as grain size, surface roughness, and saturation of

- 6 -
porous media also differentiate the transport of particles from others (Bradford et al. 2007,
Chen et al. 2010a, Chen and Walker 2012). Aside from all the work previously reported,
understanding microbial transport is still an essential task because of the varying nature
of particles in different systems. For example, changes in the environment, such as bulk
solution ionic strength, dissolved oxygen concentration, and bulk flow rate may cause
different travel behaviors for the same colloidal particles. This becomes further
complicated when looking at different colloidal particles. Our understanding of transport
and deposition of colloidal particles in these environments needs to be elucidated.
The research described in this dissertation will help close this gap in understanding. As
such, this thesis primarily focused on evaluating the fate and transport of different
microorganisms under anaerobic conditions and their response to changes in solution
ionic strength. Anaerobic conditions of natural aquifers are rarely considered in past
research yet are commonly encountered when microorganisms travel in the subsurface.
Considering the subsurface redox environment requires special attention since bacteria
may respond differently to various dissolved oxygen concentrations and alter their travel
habits. To elucidate this effect an anaerobic dechlorinating culture containing mixed
microbial species and a pathogenic facultative Pseudomonas aeruginosa were utilized to
respectively represent colloidal particle transport during in situ bioremediation of
trichloroethene and pathogenic transport in a natural aquifer. In addition, this dissertation
evaluated the filtration of glycoprotein modified microspheres as surrogates for
Cryptosporidium under various effects.

- 7 -
1.2 Objectives
The overall objective of this body of work was to evaluate the transport and deposition
of microbial particles under various coupled conditions (redox condition, solution ionic
strength, etc.) that broadly represent natural and engineered environments, and elucidate
the DLVO interactions involved in the transport process. Three individual projects were
constructed and the specific objectives, research questions, hypothesis, and the novelty of
this work follow:
1. Explored the transport of an enriched trichloroethene (TCE) dechlorinating culture
under strictly anaerobic conditions and compared the motility of Dehalococcloids,
Geobacter, and Methanomethylovorans under different ionic strengths.
Research questions: (1) In what way will the three microbial species in the mixed
microbial consortium transport and deposit in anaerobic porous media? (2) Are they
equally sensitive to changes of solution ionic strength?
We hypothesized that the three species would have different travel abilities in the
packed bed columns under the same condition, because of their different cell
surface zeta potentials. Cells with high zeta potentials (absolute values) are prone to
travel longer distance and deposit less on collector surfaces (Chen and Walker 2012,
McEldowney and Fletcher 1986). In addition, we hypothesized that increasing
solution ionic strengths would lead to more cell deposition in the columns because
higher ionic strengths have been shown to retard the transport (Chen and Walker
2012). For the first time, the transport of a mixed, strictly anaerobic TCE
degrading culture in a flow-through porous media was assessed.

- 8 -
2. Compared the fate and transport of facultative P. aeruginosa under aerobic and
anaerobic conditions and explored the effects of aerobic and anaerobic growth,
together with ionic strength on the mobility of P. aeruginoas in packed bed
columns.
Research questions: (1) How will P. aeruginosa transport in porous media under
aerobic and anaerobic conditions? (2) Does P. aeruginosa respond the same to
changes in solution ionic strength under aerobic and anaerobic conditions? (3)
What differences will be induced when P. aeruginosa grows under different oxygen
tension?
We hypothesized that growth of P. aeruginosa under aerobic and anaerobic
conditions would introduce different surface properties of P. aeruginosa. It has
been shown that P. aeruginosa grown under anaerobic conditions reduces the
formation of the B-band polysaccharides and adheres less on hydrophilic glass
surfaces (Sabra et al. 2003, Schobert and Jahn 2010, Singh et al. 2000). The
reduced ability to adhere was hypothesized to increase the transport of P.
aeruginosa in glass bead packed columns under anaerobic conditions as compared
to aerobic conditions. And higher ionic strengths were hypothesized to reduce the
transport (Chen and Walker 2012). For the first time, the role of oxygen tension on
the transport of P. aeruginoas in a packed bed column was assessed.
3. Evaluated the glycoprotein coated microspheres as surrogates for the filtration of
viable Cryptosporidium under conditions broadly encountered during water

- 9 -
treatment processes by exploring the effects of flow rate, alum addition and humic
acid (HA) adsorption on quartz sand filter.
Research questions: (1) How well will the modified microsphere represent viable
Cryptosporidium? (2) What are the effects of increased flow rate, addition of alum,
and adsorption of humic acid on collector surfaces on the filtration of the surrogates
in sand?
We hypothesized that modifying microspheres with glycoprotein would provide
fine surrogates for viable Cyptosporidium that could be used in filtration studies
because the glycoprotein had a similar isoelectric point value as that of the
Cyptosporidium (Pang et al. 2012). By doing the filtration studies, we hoped to
achieve the best removal rate when operated at a relatively low flow rate and in the
presence of alum with no adsorption of humic acid on the collector surfaces, i.e.
under favorable conditions (mainly hydrodynamic and chemical) for deposition
(Dai and Hozalski 2003, Kim et al. 2010). The glycoprotein modified microspheres
were characterized and utilized for the first time to examine the removal through a
sand bed under coupled factors mimicking the filtration in water treatment process.
1.3 Organization of thesis
This thesis includes six chapters, as follows:
Chapter 1 provides a brief introduction to the research topic. Chapter 2 offers a
description of the theoretical background and reviews the relevant literature on the
transport and deposition of colloidal particles in porous media, and provides a

- 10 -
background introduction to the particles used in this work. Chapter 3 concentrates on
evaluating the transport and retention of an anaerobic dechlorinating mixed culture in
anaerobic porous media under the impact of solution ionic strength. Chapter 4 focuses
on comparing the transport and deposition of P. aeruginosa under aerobic and anaerobic
conditions. Chapter 5 investigates the filtration of glycoprotein coated microspheres as
surrogates for Cryptosporidium under conditions encountered during water treatment
processes. Chapter 6 summarizes the conclusions from this thesis, and provides
recommendations for further investigation.

- 11 -
References
CBC News (2010) Inside Walkerton: Canada's worst-ever E. coli contamination. The
shock, the investigation and the aftermath. URL
http://www.cbc.ca/news/canada/inside-walkerton-canada-s-worst-ever-e-coli-
contamination-1.887200 (last accessed 2015/09/28).
Baygents, J.C., Glynn, J.R., Albinger, O., Biesemeyer, B.K., Ogden, K.L. and Arnold,
R.G. (1998) Variation of surface charge density in monoclonal bacterial
populations: Implications for transport through porous media. Environmental
Science & Technology 32(11), 1596-1603.
Bergmire-Sweat, D., Morgan, J., Wilson, K., Von Alt, K., Marengo, L., Bennett, T., Lee,
Y., Tsang, V., MacKenzie, W. and Furness, B. (1999) Cryptosporidiosis at Brushy
Creek: Describing the epidemiology and causes of a large outbreak in Texas, 1998.
In Proceedings, International Conference on Emerging Infectious Diseases,
Milwaukee, WI. American Water Works Association, Denver, CO.
Bradford, S.A., Torkzaban, S. and Walker, S.L. (2007) Coupling of physical and
chemical mechanisms of colloid straining in saturated porous media. Water
Research 41(13), 3012-3024.
Bradford, S.A., Yates, S.R., Bettahar, M. and Simunek, J. (2002) Physical factors
affecting the transport and fate of colloids in saturated porous media. Water
Resources Research 38(12), 63-(1-12).
- 12 -
Camesano, T.A. and Logan, B.E. (1998) Influence of fluid velocity and cell concentration
on the transport of motile and nonmotile bacteria in porous media. Environmental
Science & Technology 32(11), 1699-1708.
CDC (2013) Surveillance for waterborne disease outbreaks associated with drinking
water and other nonrecreational water-United States, 2009-2010., pp. 714-720.
Chen, G., Bedi, R.S., Yan, Y.S. and Walker, S.L. (2010a) Initial colloid deposition on
bare and zeolite-coated stainless steel and aluminum: Influence of surface
roughness. Langmuir 26(15), 12605-12613.
Chen, G. and Walker, S.L. (2012) Fecal indicator bacteria transport and deposition in
saturated and unsaturated porous media. Environmental Science & Technology
46(16), 8782-8790.
Costas, K., Knorr, R.S. and Condon, S.K. (2002) A case–control study of childhood
leukemia in Woburn, Massachusetts: The relationship between leukemia incidence
and exposure to public drinking water. Science of The Total Environment 300(1),
23-35.
Craun, G.F., Brunkard, J.M., Yoder, J.S., Roberts, V.A., Carpenter, J., Wade, T.,
Calderon, R.L., Roberts, J.M., Beach, M.J. and Roy, S.L. (2010) Causes of
outbreaks associated with drinking water in the United States from 1971 to 2006.
Clinical Microbiology Reviews 23(3), 507-528.

- 13 -
Dai, X. and Hozalski, R.M. (2003) Evaluation of microspheres as surrogates for
Cryptosporidium parvum oocysts in filtration experiments. Environmental Science
& Technology 37(5), 1037-1042.
Gleick, P.H. (ed) (1993) Water in crisis: A Guide to the World's Fresh Water Resources,
Oxford University Press, New York.
Hermansson, M. (1999) The DLVO theory in microbial adhesion. Colloids and Surfaces
B-Biointerfaces 14(1-4), 105-119.
Kim, H.N., Walker, S.L. and Bradford, S.A. (2010) Coupled factors influencing the
transport and retention of Cryptosporidium parvum oocysts in saturated porous
media. Water Research 44(4), 1213-1223.
Liu, Y., Yang, C.-H. and Li, J. (2007) Influence of extracellular polymeric substances on
Pseudomonas aeruginosa transport and deposition profiles in porous media.
Environmental Science & Technology 41(1), 198-205.
Marshall, K., Stout, R. and Mitchell, R. (1971) Mechanism of the initial events in the
sorption of marine bacteria to surfaces. Journal of General Microbiology 68(3),
337-348.
McDade, J.M., McGuire, T.M. and Newell, C.J. (2005) Analysis of DNAPL source-
depletion costs at 36 field sites. Remediation Journal 15(2), 9-18.

- 14 -
McEldowney, S. and Fletcher, M. (1986) Effect of growth-conditions and surface
characteristics of aquatic bacteria on their attachment to solid-surfaces. Journal of
General Microbiology 132, 513-523.
Mclaughlin, T. (2000) Walkerton E. coli outbreak declared over. The Globe and Mail.
URL http://www.theglobeandmail.com/news/national/walkerton-e-coli-outbreak-
declared-over/article1041067/ (last accessed 2015/09/28).
Pang, L., Nowostawska, U., Weaver, L., Hoffman, G., Karmacharya, A., Skinner, A. and
Karki, N. (2012) Biotin- and glycoprotein-coated microspheres: Potential
surrogates for studying filtration of Cryptosporidium parvum in porous media.
Environmental Science & Technology 46(21), 11779-11787.
Sabra, W., Lunsdorf, H. and Zeng, A.P. (2003) Alterations in the formation of
lipopolysaccharide and membrane vesicles on the surface of Pseudomonas
aeruginosa PAO1 under oxygen stress conditions. Microbiology-Sgm 149, 2789-
2795.
Schobert, M. and Jahn, D. (2010) Anaerobic physiology of Pseudomonas aeruginosa in
the cystic fibrosis lung. International Journal of Medical Microbiology 300(8), 549-
556.
Seymour, M.B., Chen, G.X., Su, C.M. and Li, Y.S. (2013) Transport and retention of
colloids in porous media: Does shape really matter? Environmental Science &
Technology 47(15), 8391-8398.

- 15 -
Silliman, S.E., Dunlap, R., Fletcher, M. and Schneegurt, M.A. (2001) Bacterial transport
in heterogeneous porous media: Observations from laboratory experiments. Water
Resources Research 37(11), 2699-2707.
Singh, P.K., Schaefer, A.L., Parsek, M.R., Moninger, T.O., Welsh, M.J. and Greenberg,
E.P. (2000) Quorum-sensing signals indicate that cystic fibrosis lungs are infected
with bacterial biofilms. Nature 407(6805), 762-764.
Tong, M. and Johnson, W.P. (2007) Colloid population heterogeneity drives
hyperexponential deviation from classic filtration theory. Environmental Science &
Technology 41(2), 493-499.
Tufenkji, N. and Elimelech, M. (2004a) Correlation equation for predicting single-
collector efficiency in physicochemical filtration in saturated porous media.
Environmental Science & Technology 38(2), 529-536.
Tufenkji, N., Redman, J.A. and Elimelech, M. (2003) Interpreting deposition patterns of
microbial particles in laboratory-scale column experiments. Environmental Science
& Technology 37(3), 616-623.
Tufenkji, N., Ryan, J.N. and Elimelech, M. (2002) The promise of bank filtration.
Environmental Science & Technology 36(21), 422A-428A.
Walker, S.L., Redman, J.A. and Elimelech, M. (2004) Role of cell surface
lipopolysaccharides in Escherichia coli K12 adhesion and transport. Langmuir
20(18), 7736-7746.

- 16 -
Yao, K.M., Habibian, M.T. and O'Melia, C.R. (1971) Water and wastewater filtration:
Concepts and applications. Environmental Science & Technology 5, 1105-1112.

- 17 -
Chapter 2. Theoretical Background and Literature Review

- 18 -
2.1 Theoretical background
2.1.1 Transport phenomena of microbial particles in porous media
The transport and retention of microbial particles in porous media have drawn
increasing attention from researchers due to its critical impact in a variety of
environmental contexts, such as bioremediation in contaminated soil and groundwater,
pathogen transport in groundwater environments, and granular filtration processes for
water and wastewater treatment (Costerton et al. 1995, Parsek and Fuqua 2004).
The transport processes of these microbial particles in the subsurface are often
controlled by several mechanisms. Among these, physical mechanisms of interception,
gravitational sedimentation, Brownian diffusion, straining, hydrodynamic retardation, and
surface interaction forces, often affect the transport and attachment of microbial particles
(Gollnitz et al. 1997, Tufenkji et al. 2002). Grazing of these microbial particles by
microorganisms at higher trophic levels can also influence their transport processes
(Gollnitz et al. 1997). Finally, the addition of chemicals can affect the surface chemical
interactions, hydration, and hydrophobic interactions, which result in the attachment of
biocolloidal particles to the grain surface (Yao et al. 1971). Worth noting, detachment of
loosely attached microbial particles from sediment grains may occur during the transport
process. However, this is not a dominant process because the detachment rate is much
smaller than the deposition rate (Tufenkji et al. 2002).
Among the physical mechanisms described above, interception, gravitational
sedimentation, and Brownian diffusion often influence the transfer of particles from the
bulk solution to the collector surfaces (Crittenden et al. 2012). These three mechanisms
- 19 -
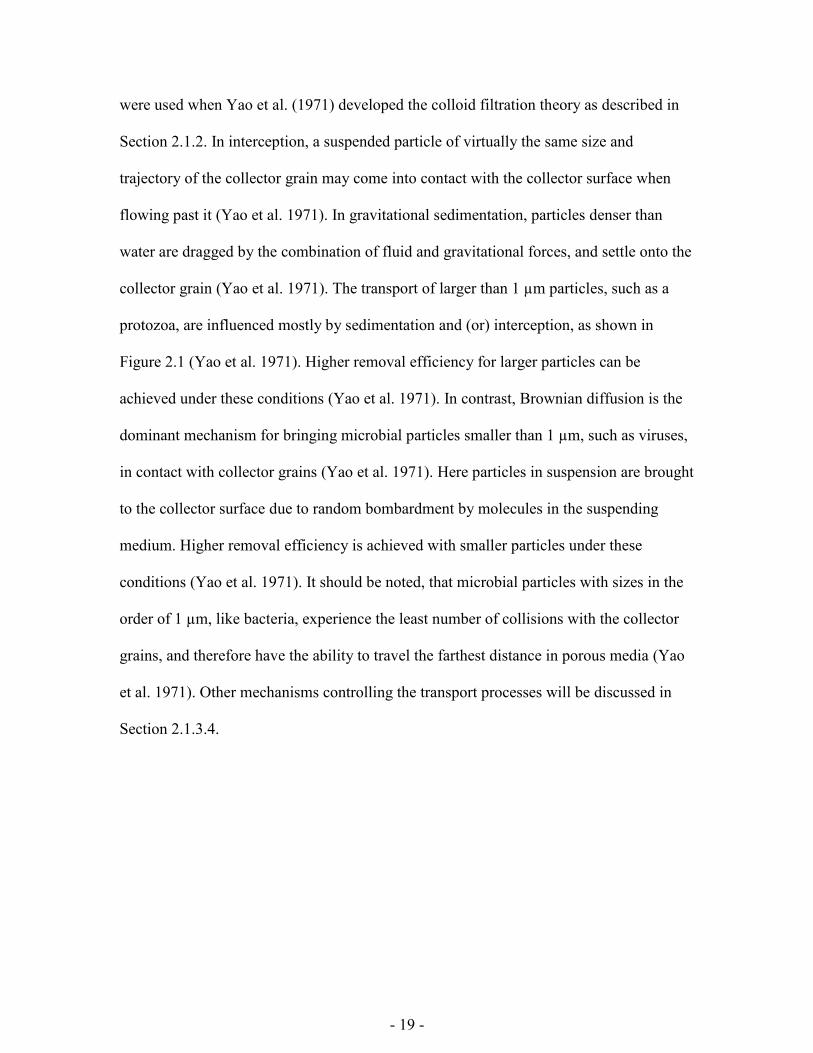
were used when Yao et al. (1971) developed the colloid filtration theory as described in
Section 2.1.2. In interception, a suspended particle of virtually the same size and
trajectory of the collector grain may come into contact with the collector surface when
flowing past it (Yao et al. 1971). In gravitational sedimentation, particles denser than
water are dragged by the combination of fluid and gravitational forces, and settle onto the
collector grain (Yao et al. 1971). The transport of larger than 1 µm particles, such as a
protozoa, are influenced mostly by sedimentation and (or) interception, as shown in
Figure 2.1 (Yao et al. 1971). Higher removal efficiency for larger particles can be
achieved under these conditions (Yao et al. 1971). In contrast, Brownian diffusion is the
dominant mechanism for bringing microbial particles smaller than 1 µm, such as viruses,
in contact with collector grains (Yao et al. 1971). Here particles in suspension are brought
to the collector surface due to random bombardment by molecules in the suspending
medium. Higher removal efficiency is achieved with smaller particles under these
conditions (Yao et al. 1971). It should be noted, that microbial particles with sizes in the
order of 1 µm, like bacteria, experience the least number of collisions with the collector
grains, and therefore have the ability to travel the farthest distance in porous media (Yao
et al. 1971). Other mechanisms controlling the transport processes will be discussed in
Section 2.1.3.4.
- 20 -
Figure 2.1 Schematic representation of removal efficiency to particle size distribution
(adapted from Yao et al. 1971).
2.1.2 Classic colloid filtration theory (CFT)
2.1.2.1 What is CFT?
The colloid filtration theory (CFT) developed by Yao et al. (1971) is the most
commonly used model for describing particle filtration. The removal of particles is
controlled by the mass transfer of suspended particles from the bulk flow to the grain
surface or particles previously attached and the attachment of particles to this solid
surface as a result of colloid-surface interaction. Based on this approach, the performance
of a packed bed for particle removal is expressed as a single collector efficiency η, and a
collision (or attachment) efficiency α, as described by the equation (Yao et al. 1971):
(2.1)

- 21 -
where C is the local particle concentration, f is the bed porosity, L is bed depth, d is
grain diameter, α and η are represented as follow (Crittenden et al. 2012):
(2.2)
(2.3)
The parameter η represents the frequency at which the particles flowing toward the
collector by diffusion, interception and sedimentation would strike the collector grain.
And it depends on many factors such as filtration velocity, grain size, water temperature,
and particle size and density (Yao et al. 1971). While α represents the probability that
such collisions occurring between suspended particles and filter media would result in
adhesion. α is equal to one in an ideal system where the suspended particles are
completely destabilized (Yao et al. 1971).
Integration of Equation 2.1 yields the basis for Yao’s filtration model, as follows (Yao
et al. 1971):
(2.4)
where C and C0 are the effluent and influent concentrations for a packed bed.
As shown by Equation 2.4, in Yao’s filtration model, the removal of suspended
particles is presented by first-order kinetics with a spatially and temporally invariant
colloid deposition rate coefficient. Therefore, the concentrations of suspended and
retained particles are predicted to decrease exponentially with travel distance (Liu et al.
2007). Based on this assumption, the portion of particles recovered from the packed

- 22 -
column effluent is often used to estimate the physicochemical filtration rate, i.e. the
overall deposition rate coefficient (kd) as shown in the following equation (Tufenkji and
Elimelech 2004a).
(2.5)
where U is the approach (superficial) velocity, L is the length of the column, and C/C0
is the normalized breakthrough concentration relevant to “clean bed” conditions. The
retained concentrations of particle S(X) in the column bed for a continuous injection of
particles can be determined by the following equation (Liu et al. 2007, Tufenkji et al.
2003).
(2.6)
Here, X is column depth, ρb is the porous medium bulk density, and t0 is the duration
of continuous particle injection.
2.1.2.2 Deviations from CFT prediction
Yao’s theory has been widely recognized for predicting particle filtration in packed
bed columns. However, recent research suggests that the filtration of microbial particles
may not be consistent with the filtration model, since experimental data from laboratory-
scale column experiments has shown evidence of nonexponential decay in the deposition
profiles. In the majority of the column experiments, deposition rates were found to
decline with travel distance in a monotonic fashion (Bradford and Bettahar 2005,
Bradford et al. 2005, Bradford et al. 2002, Kim and Tobiason 2004, Liu et al. 2007).
Other patterns of nonexponential deposition, such as a power law distribution and
- 23 -
hyperexponential were also reported (Tong et al. 2005, Tufenkji et al. 2003). Table 2.1
summarizes several studies involving colloidal particles where a clear nonexponential
deposition was observed.

24
Table 2.1 Review of several laboratory column studies with nonexponential deposition of colloidal particles (adapted from Bradford
and Bettahar 2005, Tufenkji et al. 2003).
Colloidal Particle Sediment Grain Column
Length (cm)
Solution
Chemistry
Observed Deposition
Pattern Ref.
Carboxyl latex colloids (a) Ottawa sand
(b) glass bead
(a) 13
(b) 10
IS 1 mM, NaCl, ,
pH 6.98 monotonic
(Bradford et al.
2002)
Cryptosporidium parvum
oocysts Ottawa sand 13
IS 1 mM, NaCl,
pH 6.98 monotonic
(Bradford and
Bettahar 2005)
recombinant Norwalk
virus quartz sand 29
IS 10 mM, NaCl,
pH 6.9,
power law (i.e. linear on a
log-log plot, R2 = 0.95,
0.99)
(Redman et al.
2001a)
motile, Gram-negative
bacteria designated
A1264
borosilicate glass 1, 2 MOPS
b buffer,
pH 7.7 power law (R
2 = 0.97)
(Albinger et al.
1994)
bacteria A1264 and
nonmotile
Gram-negative bacteria
designated CD1
borosilicate glass 1
IS 10 mM,
MOPS buffer, pH
7.0
power law (R2 = 0.99)
(Baygents et al.
1998)
Pseudomonas fluorescens Southern AZ soil 7 IS 4 mM, AGWa power law pattern in (Camesano and

25
P17 and Burkholderia
cepacia G4
several experiments (R2 =
0.83 - 0.99)
Logan 1998)
Pseudomonas fluorescens
P17 quartz sand 1 - 10.5
(a) IS 3.6 mM,
AGWd, pH 8.0
(b) IS 60 mM,
CaCl2,
pH 6.8
(a) power law (R2 = 0.98)
at low IS
(b) exponential (R2 =
0.90) at high IS
(Martin et al.
1996)
nonmotile Gram-negative
bacteria
designated W31
Oyster, VA
sediment 15, 43, 45 AGW
c, pH 6.2
nonexponential in longer
columns
(Bolster et al.
1999)
Comamonas DA001 quartz sand 20
IS 3.8, 20, and 50
mM, NaCl, pH
6.72
hyperexponential (Tong et al. 2005)
a artificial groundwater (AGW) solution prepared as described by Camesano and Logan (1998).
b 3-[N-morpholino] propanesulfonic buffer.
c AGW consists of (per liter of DI water): 0.06g MgSO4·7H2O, 0.036 g NaHCO3, 0.036 g CaCl2, 0.035 g Ca(NO3)2, 0.025 g
CaSO4·2H2O, and 0.02 g KNO3.
d AGW consists of (per liter of DI water): 0.069 g MgSO4·7H2O, 0.050 g NaHCO3, 0.00145 g CaCl2·2H2O, 0.064 g Ca(NO3)2·4H2O,
and 0.002 g KF.

26
To explain the observed experimental deviation from CFT’s theoretical prediction,
various studies have been performed. The factors that may explain this deviation include
heterogeneity in the microbial population (Baygents et al. 1998, Simoni et al. 1998) and
on the collector surface (Silliman et al. 2001), straining in some cases (Bradford et al.
2002) and unfavorable conditions for deposition (Tufenkji and Elimelech 2004b). Some
of the asymmetric distributions of the deposition rate coefficient reflecting the inherent
heterogeneity of the microbial particles were found to give rise to nonexponential
deposition patterns (Baygents et al. 1998). Specifically, Baygents et al. (1998) observed
reduced affinity of bacteria for the glass beads with distance travelled through the
columns due to intropopulational differences in the surface charge density of isolated
ellipsoidal bacteria under conditions of the transport experiment. They believed that these
variations in surface charge density could influence the colloidal interaction potentials,
and the affinity of bacteria for negatively charged collectors (Baygents et al. 1998).
Distributions in the surface properties among the microbial particles likely contributed to
the deviation of deposition in the column. Individual microbial particles more prone to
adhesion deposited near the column inlet and those less prone to adhesion travelled
further then deposited, if at all (Tong et al. 2005). It should be noted that system
conditions, such as porous media also affect the level of variations in deposition rate
coefficient from CFT. When conducting transport experiments of Pseudomonas
fluorescens strain M1 in a tank filled with heterogeneous sand media, Silliman et al.
(2001) found great spatial variability in the attached bacteria with a particularly high
number of bacteria cells retained in the fine-grained sand sediments. In addition, particle
27
deposition dynamics (blocking) and release of microbial particles from collector grains
were considered as potential sources of deviations from CFT (Tufenkji et al. 2003).
2.1.3 Derjaguin-Landau-Verwey-Overbeek (DLVO) theory of colloid stability
2.1.3.1 What is the DLVO theory?
The use of the DLVO theory to explain the effects of electrolyte concentration on
initial bacterial adhesion was first reported by Marshall et al. when they interpreted the
initial sorption of two marine bacteria on glass surface (Marshall et al. 1971). It has since
been used by many as a qualitative approach, but in some cases as a quantitative way to
calculate the adhesion free energy changes to explain microbial adhesion (Hermansson
1999). Microbial adhesion refers to the transfer of a cell from a free state in the bulk
solution to a more or less firm attached state at an interface (Hermansson 1999). Briefly,
the DLVO theory (Derjaguin and Landau 1941, Verwey 1948) is assumed to be additive
and describes the combined interaction energies of van der Waals attraction and electrical
double layer (EDL) repulsion between particles or particle-substratum (a flat surface) as a
function of separation distance (h) as shown in Figure 2.2 (a). The total interaction, which
is usually expressed as potential energy (VT), is calculated as the sum of van der Waals
attraction (VA) and the EDL interaction (VR) (Hermansson 1999):
VT = VA + VR (2.7)
VR can be calculated using the following expression (Hogg et al. 1966):
(2.8)

28
where ε0 is the dielectric permittivity in a vacuum, εr is the relative dielectric
permittivity of water, ap is the colloidal particle radius, κ is the inverse Debye length, h is
the separation distance between the colloidal particle and the collector surface, and ψp
and ψc are the surface potentials of the colloidal particle and collector, respectively. In
this expression, the surface potentials (ψp and ψc) are assumed to be constant (Redman et
al. 2004).
VA can be calculated based on the following equation (Elimelech and Omelia 1990,
Gregory 1981):
(2.9)
where A represents the Hamaker constant of the interacting media (colloidal particles
– water – collector), and λ is the characteristic wavelength of the dielectric (usually
assumed to be 100 nm).

29
Figure 2.2 Schematic representations of total DLVO interaction energy profiles as a
function of separation distance: (a) quantitative example for equal spherical particles of 1
µm diameter in 100 mM NaCl electrolyte, zeta potential (ζ) = -25 mV, A = 8.3 × 10⁻²¹
J;
and (b) three patterns of the interaction energy profiles (EB: energy barrier; PM: primary
minimum; SM: secondary minimum; h: separation distance; VT: total potential energy;
VR: electrical double layer interaction; VA: van der Waals attraction) (adapted from
-200
-150
-100
-50
0
50
100
150
200
0 3 6 9 12 15
Inte
ract
ion
en
ergy
(k
T)
Separation distance (nm)
VR
PM
SM
EB
VA
VT
a
b

30
Elimelech 1998).
2.1.3.2 Representations of the DLVO interaction energy profiles
Depending on the relative contributions of the two interactions, the energy profiles
with separation distance can display one of three patterns as shown in Figure 2.2 (b)
(Elimelech 1998):
(1) An infinitely deep minimum, the primary minimum (PM), at close separation
distance, followed by a maximum, the energy barrier (EB), and another minimum,
the secondary minimum (SM), at a larger distance;
(2) A primary minimum only;
(3) A primary minimum, and an energy barrier, but no significant secondary minimum.
Because of the different distance dependence of VA (power law) and VR (exponential)
(Equations 2.8 and 2.9), VA is usually greater than VR at larger separation distances,
which forms the secondary energy minimum as shown in Figure 2.2 (Elimelech 1998).
The effects of secondary energy minima are considered to be more obvious on larger
particles (greater than 1 µm in diameter), and at moderately high solution ionic strength,
under which interacting particles are closer and facing greater attraction due to the
reduced range of electrical repulsion (Elimelech 1998). Previous studies showed that
when solution ionic strength increased from 1 mM to 31.6 mM, the depth of the
secondary energy minima increased from 0.09 kT to 8.1 kT, resulting in more bacterial
cell deposition (Redman et al. 2004). However, it should be noted that the deposition in
the secondary minimum is reversible (Redman et al. 2004).

31
Additionally, the sole presence of a primary energy minimum is physically impossible
in practice, because the short-range effects, such as those caused by ion hydration, can
keep particles from coming into true physical contact (Elimelech 1998).
2.1.3.3 Factors affecting the interaction energies
Since the DLVO theory explores the effects of electrolyte concentrations on initial
adhesion, the total interaction energies change with solution ionic strengths and zeta
potentials. Zeta potential refers to the charge at the shear plane of particles, and is
typically used as a relative measure of particle surface charge. Empirically, when the
absolute value of a particle’s zeta potential is below 20 mV, the particles in suspension
are prone to aggregate (Crittenden et al. 2012). When the zeta potential and electrolyte
ionic strength is at such that the repulsion outweighs the attraction, particles approaching
the substratum encounters an energy barrier, which tends to inhibit the contact between
the particle and substratum (Elimelech 1998). In the presence of an energy barrier,
colliding particles must overcome this barrier in order to come into true contact. In
Brownian diffusion, particles rarely have energy of more than a few of kT (unit of the
interaction energy); therefore an energy barrier of 20 kT or more usually represents a
very stable system, where only a minimum fraction of particles have sufficient energy to
overcome the barrier (Elimelech 1998). As the zeta potential is reduced and/or ionic
strength is increased, the energy barrier gets lower making contact easier. Eventually, the
energy barrier disappears, leading to favorable conditions for adhesion, i.e. attractive
interaction in primary minimum, under which condition, in principle, particles can adhere
each time when they collide (i.e. α = 1). Such adhesion is most likely irreversible
(Elimelech 1998).

32
In addition to solution ionic strength and zeta potential, the interaction profiles are also
affected by the following physicochemical parameters (Elimelech 1998, Hermansson
1999).
(1) Particle size and surface structures/molecules. Adhesion is facilitated by the
reduction of the contacting region (Weiss and Harlos 1972). Decreasing the radius
of the contact region generally reduces both VR and VA, and consequently the total
interaction energy, or conversely as discussed in the previous section (Weiss and
Harlos 1972). Polymers on the surface of particles trapped in the secondary
minimum well can also contribute to adhesion through bridging. Surface structures,
such as fimbriae, lipopolysaccharides (LPS), capsule material and flagella of
bacteria are not accounted for in the DLVO theory (Hermansson 1999). However,
their presence can alter the overall properties of bacterial cells, such as cell surface
hydrophobicity, and surface charge. In such cases, the measured overall cell
properties do not fully represent the adhesion ability of the cells (Hermansson
1999).
(2) Substratum roughness. In DLVO prediction, the surface of the collector was
assumed to be perfectly smooth, which does not exist in practice. When two
particles come into contact, the roughness may also affect the effective contacting
area and restrict the minimum separation distance attainable (Elimelech 1998). If
the rough layer is thick in comparison to the separation distance, the unretarded
interaction can be substantially reduced due to attenuation of van der Waals
interaction (Hermansson 1999).

33
(3) The Hamaker constant (A). The Hamaker constant represents a material property
that describes the strength of the interaction between a surface and the medium and
the interaction between two interacting bodies in the medium, and determines the
van der Waals interaction (Norde and Lyklema 1989). In aqueous media, A is
usually positive for the substratum-media-colloidal particles, and varies between
different substrata, media and colloidal particles (Norde and Lyklema 1989).
2.1.3.4 Non-DLVO interactions
Recently, DLVO theory was found unable to adequately describe biotic and abiotic
particle adhesion. Several non-DLVO forces, such as steric repulsion, polymer bridging,
hydrophobic interaction and hydration were found to contribute to the colloidal
interactions (Elimelech 1998, Hermansson 1999). Polymers on a particle surface can
either enhance the colloidal stability through the effect of steric repulsion, or promote
aggregation of particles and/or attachment to macroscopic surfaces through polymer
bridging, depending on the amount and chain-size of the surface polymers (Elimelech
1998). The presence of an adsorbed layer of solvent, surfactant, and macromolecules can
sometimes influence the stability of colloidal suspension, through repulsive hydration
interaction, and attractive hydrophobic interaction (Elimelech 1998).
2.2 Literature review
2.2.1 Factors affecting the transport and retention of colloidal particles
The transport and retention of particles in a natural environment is a complex process
and can be affected by many factors. Therefore, studies evaluating the impacts of these

34
factors on the fate and transport of particles in porous media have been intensively
explored using laboratory scale columns. These factors and their effects are discussed
below.
(1) Solution ionic strength and composition. Solution ionic strength and composition
are the most readily controlled conditions for transport experiments. Research has
shown that electrolyte with higher ionic strength and/or composed of divalent ions
rather than monovalent ions enhanced the aggregation or the deposition of
suspended particles due to reduced absolute values of zeta potentials (Chen and
Walker 2012, Lerner et al. 2012). A decreased zeta potential is usually caused by
the compression of the electrical double layer, indicating a less stable colloidal
suspension (Chen and Walker 2007, 2012, Saleh et al. 2008, Zhao et al. 2014).
(2) Porous media saturation. Chen and Walker (2012) compared deposition of two
model fecal indicators E. faecalis and E. coli in saturated and unsaturated quartz
sand bed and observed increased retention of the two bacterial species in
unsaturated rather than saturated porous media. They further showed a preferred
affinity of the E. faecalis at the air/water interface for attachment rather than the
sand surface (Chen and Walker 2012). This accumulation at the air/water interface
is likely controlled by a combined effect of the DLVO and hydrophobic
interactions between approaching cells and air/water interface (Bradford and
Torkzaban 2008, Schäfer et al. 1998). Other possible mechanisms such as film
straining and air/water interfacial capture were also proposed to contribute to the
increased retention in unsaturated porous media (Zhuang et al. 2005).

35
(3) Colloidal particle size and shape. As discussed in Section 2.1.1, the removal of a
spherical particle is proportional to its size when it is larger than 1 µm and
counter-proportional when it is smaller than 1 µm. However, in practice, perfect
spheres are not always present, especially for bacteria, which are sometimes rod-
shaped for example. When interpreting the transport of bacteria, normally it is
assumed they are spheres. However, it has been shown that particles with higher
aspect ratios in terms of shape are believed to exhibit preferential retention during
the transport process since they minimize the interaction energy when
approaching collector surfaces (Seymour et al. 2013, Wang et al. 2008, Weiss et
al. 1995). Salerno et al. (2006) observed that rod-shaped particles with aspect
ratios of 2:1 and 4:1 displayed higher retention than spherical particles with an
aspect ratio of 1:1. Liu et al. (2010) also reported that rod-shaped particles
displayed higher retention than spherical particles.
(4) Flow velocity. Higher flow velocity was generally reported to reduce retention and
facilitate the transport of colloidal particles with an exception as discussed in
point (5) (Camesano and Logan 1998, Kim et al. 2010). Hydrodynamically
favorable conditions for retention generated in low velocity regions in porous
media was believed to play a role in enhancing the motility of flow-through
particles (Torkzaban et al. 2007, Torkzaban et al. 2008).
(5) Motility of microbial cells. When brought near collector surfaces, motile cells can
swim along the surfaces at various orientations by either tracing out circles around
the surfaces, or moving in parallel or perpendicular to the surfaces (Frymier et al.
1995, Vigeant and Ford 1997). Previous studies have shown that cell motility can

36
either increase or inhibit cell attachment (Jenneman et al. 1985, Korber et al.
1994). Camesano and Logan (1998) discovered that swimming cells were able to
avoid adhering to a solid surface leading to reduced cell adhesion at lower flow
velocity (0.56 m/day), which was opposite to the prediction of increased cell
retention at decreased bulk fluid rate based on the colloid filtration theory
(Camesano and Logan 1998) . At higher fluid velocities, cell motility
corresponded to a clear reduction in cell adhesion due to increased hydrodynamic
force. Therefore, the variation of deposition between motile and nonmotile cells
was most obvious at low fluid velocities (Camesano and Logan 1998, McCaulou
et al. 1995)
(6) Natural organic matter (NOM). NOM usually refers to those naturally occurring
molecules and macromolecules (i.e. anionic, organic) that are ubiquitous in water
supplies. Its presence was broadly found to facilitate the transport of bacteria
(Yang et al. 2012a, Zhao et al. 2014), nanoparticles (Wang et al. 2012, Xie et al.
2008), and protozoa such as Cryptosporidium (Abudalo et al. 2010). However,
increased removal was also reported in rare occasion when Cryptosporidium
parvum oocysts travelled through organic matter-coated silica surfaces under the
combined effects of surface charge heterogeneity and presence of positively-
charged area on the organic matter-coated surface (Liu et al. 2009). In general, the
adsorption of negatively charge NOM on to a sand surface can either reversely
alter the positively charged collector surfaces (Abudalo et al. 2010) or increase the
negativity of similarly charged collectors (Dai and Hozalski 2003) and compete
with approaching particles for effective site of deposition.

37
(7) Extracellular polymeric substances (EPS). The EPS matrix generally consists of a
mixture of macromolecules such as proteins, polysaccharides, nucleic acids, lipids,
and other polymeric compounds. It usually functions as an initial adhesive,
however the extent of this function was unclear because of the various
compositions among different organisms (Hwang et al. 2012, Liu et al. 2007).
Therefore, EPS can either promote (Liu et al. 2007) or hinder (Hwang et al. 2012)
cell adhesion depending specifically on the components of the EPS and
experimental systems.
(8) Grain size and roughness. In general, coarse sized collectors were reported to
filter more particles than fine sized collectors (Bradford et al. 2007). In Yao’s
theory, the collector was assumed to be perfectly smooth spheres, which is
hardly achievable in practice. The presence of uneven surfaces of the collector
grains can provide valleys with lower interaction energy wells, which are
favorable for attachment (Elimelech 1998, Hoek et al. 2003).
(9) Bacterial cell type. When comparing the transport behaviors of the Gram-
positive E. faecalis and Gram-negative E. coli in quartz sand bed, Chen and
Walker (2012) observed much more reduced motility of the E. faecalis to
increased solution ionic strength and decreased porous media saturation level.
The distinct surface characteristics of the Gram-positive E. faecalis (i.e. much
more negatively charged zeta potential and higher cell surface acidity)
distinguished it from the Gram-negative E. coli in response to increased ionic
strength and presence of air/water interface. Other surface properties including
EPS content (protein and polysaccharides) and surface hydrophobicity that also

38
differed between Gram-positive and Gram-negative were also found to be
involved in cell transport (Yang et al. 2012b, Zhao et al. 2014).
(10) Colloidal particle concentration. Although the clean bed theory predicts that cell
retention in porous media is independent of cell concentration (Yao et al. 1971),
high cell concentrations are known to affect the overall retention of cells either
positively by providing more favorable surfaces for adhesion (ripening) or
negatively by providing less favorable surfaces (blocking) (Camesano and
Logan 1998, Camesano et al. 1999).
2.2.2 Introduction to the particles used in this dissertation
This section provided information about the microorganisms and the glycoprotein
modified microspheres utilized in this dissertation.
2.2.2.1 The dechlorination culture – KB-1®
The KB-1® culture is a strictly anaerobic enrichment culture that is capable of
complete degradation of tetrachloroethene (PCE), trichloroethene (TCE), dichloroethene
(DCE) and vinyl chloride (VC) to non-toxic ethene. It was mainly used for in situ
dechlorination of chlorinated ethenes contaminated sites by injecting the enriched culture
into the contaminated plume (http://www.siremlab.com/products/kb-1).
The culture was initially constructed with soil and groundwater samples obtained from
a TCE-contaminated site in Southern Ontario, Canada, which contained high
concentrations of TCE and daughter products including high levels of ethene in the
groundwater. The coexistence of TCE and its daughter products suggested the in situ

39
presence of active organisms capable of complete dechlorination of TCE. Further
incubation and enrichment with selective electron acceptors (e.g. TCE or VC) and
electron donor (methanol) in the laboratory produced this stable culture exhibiting
promising dechlorination ability (Duhamel et al. 2002).
The microbial composition of the enrichment culture was carefully explored using
combined techniques of polymerase chain reaction-denaturing gradient gel
electrophoresis (PCR-DGGE) and cloning to identify the phylotype in the culture, and
quantitative PCR (qPCR) estimate their relative abundances based on the 16S rRNA
sequence (Duhamel and Edwards 2006, Duhamel et al. 2004), as shown in Table 2.2.

40
Table 2.2 Operational taxonomic unit (OTU) detected in the KB-1® clone libraries (adapted from Duhamel and Edwards 2006)
Sequence name Closest GenBank match (as of 1
st
February, 2006) Accession no. % identity
a
Number of
clones
Bacterial OTUs
Bacteroidetes KB-1
(AY780552)
Uncultured bacterium clone
060B03_B_SD_P93 from a municipal
anaerobic sludge digester
CR933316 99
2/37
(closest isolate) Bacteroides uniformis
strain S13 AB247146 81
Dehalococcoides
KB-1/VC (AY146779) and
KB-1/PCE (AY146780)
Dehalococcoides strain CBDB1 AF230641
100
15/37
b
Dehalococcoides strain FL2 AF357918 100
Dehalococcoides strain BAV1 AF165308 100
‘Desulfo’ KB-1
(AY780555)
Uncultured bacterium clone SJA-173 from
a trichlorobenzene-degrading culture
AJ009503
99
1/37 (closest isolates) Desulfotomaculum
Auripigmentum AJ493051 94
Desulfosporosinus sp. S8 AF076247 94
Geobacter KB-1 Geobacter lovleyi strain SZ AY914177 99 11/37

41
(AY780563)
Spirochaetes KB-1
(AY780558) Spirochaetes bacterium SA-8 AY695839 99 4/37
Sulfurospirillum KB-1
(AY780560)
Uncultured bacterium clone DS155 from
mangrove bacterioplankton DQ234237 99
1/37
(closest isolate) Sulfurospirillum
multivorans X82931 98
Syntrophobacter KB-1
(AY780561)
Syntrophobacter sulfatireducens strain
TB8106 AY651787 96 1/37
Syntrophus KB-1
(AY780562)
Uncultured bacterium clone R4b9 from
granular sludge AF482443 99
2/37 (closest isolates) Syntrophus sp. LYP AF126282 91
Syntrophus gentianae X85132 93
Archaeal OTUs
Methanosarcina KB-1
(AY780570)
Uncultured archaeon clone 221 from
landfill leachate AJ831161 99
12/20 (closest isolate) Methanosarcina barkeri
strain Sar AF028692 99
Methanomethylovorans KB-1 1 Methanomethylovorans hollandica strain AY260433 100 1/20

42
(AY780564) ZB
Methanomethylovorans KB-1 2
(AY780565)
Uncultured archaeon clone SHB-143 from
a 1,2-dichloropropanedechlorinating culture AJ312013 99
4/20
(closest isolate) M. hollandica strain ZB AY260433 98
Methanomicrobiales KB-1 1
(AY780566)
Uncultured archaeon clone CBd-364F from
acidic peatlands DQ301905 97
1/20
(closest isolate) Methanoculleus
palmolei Y16382 91
Methanomicrobiales KB-1 2
(AY780567)
Uncultured archaeon clone 244 from
landfill leachate AJ831168 99 1/20
(closest isolate) Methanogenic
archaeon NOBI-1 AB162774 94
Methanosaeta KB-1 (AY780568)
Uncultured archaeon clone PL-39A4 from a
biodegraded oil reservoir AY570685 99
1/20
(closest isolate) Methanosaeta Concilii X51423 99
a in the TCE-methanol culture
b sum of Dehalococcoides clones. Because the clones were not sequenced in the region that differentiates between the two phylotypes.

43
As shown, Dehalococcoides and Geobacter were the most abundant phylotypes in the
enrichment culture. They are the TCE dechlorinators in the mixed culture. In terms of
TCE dechlorination, Geobacter and several strains of Dehalococcides were reported to
quickly degrade TCE to DCE, however further reduction was inhibited due to the
inability to derive energy from DCE and VC (Duhamel and Edwards 2007). Only limited
strains of Dehalococcoides were found to further degrade DCE and VC to nontoxic
ethene (He et al. 2003b, Sung et al. 2006). Complete degradation of TCE to nontoxic
ethene can be achieved most efficiently when Geobacter and Dehalococcoides are both
present. Other nondechlorinating microorganisms are also believed to contribute to
dechlorination as trace nutrient and electron donor providers (Duhamel and Edwards
2006). The dechlorination process cannot effectively proceed without the cooperation
among these microorganisms. Based on this, Dehalococcoides, Geobacter and
Methanomethylovorans were selected as the model microorganisms to track in this study.
Therefore, successful in situ biodegradation of chlorinated ethenes contaminated sites
depends on equal or similar motility of the microorganisms in KB-1® to arrive at the
contaminated plume together.
2.2.2.2 Pseudomonas aeruginosa
Pseudomonas aeruginosa is a facultative Gram-negative bacterium that is noted for its
environmental metabolic versatility, ability to cause disease in particular susceptible
individuals, and its resistance to antibiotics. Being able to grow using a large variety of
carbon sources under either aerobic or anaerobic conditions, P. aeruginosa can adapt to
and colonize in various environmental niches such as soil and marine habitats, plants, and

44
animals (Palmer et al. 2007, Williams et al. 1978, Yoon et al. 2002). In humans, P.
aeruginosa are predominant in chronic lung infections of cystic fibrosis patients (de
Kievit and Iglewski 2000). P. aeruginosa can produce a number of toxic proteins which
can cause extensive tissue damage, and interfere with the human immune system. These
proteins include potent toxins that enter and kill host cells at or near the site of
colonization and degradative enzymes that permanently disrupt the cell membranes and
connective tissues in various organs (Pier et al. 1996).
In addition, though more widely recognized as an opportunistic pathogen in humans
and animals, P. aeruginosa’s degradative abilities are apparent in soil (Alonso et al.
1999). Isolates of P. aeruginosa have shown an ability to degrade various petroleum
products such as gasoline, kerosene, diesel oil, and crude oil, and pollutants such as n-
alkanes and polycyclic aromatic hydrocarbons (PAH) despite their origins (clinic or
environment) (Alonso et al. 1999, Karamalidis et al. 2010).
This versatility allows P.aeruginosa to exist and migrate in a wide range of
environments. Therefore, understanding the transport and deposition of P. aeruginosa is
important with respect to increasing knowledge of pathogenic transport, and in some
cases, biodegradation of hydrocarbons.
When travelling in the subsurface, various dissolved oxygen (DO) concentrations are
always encountered due to different geologic conditions (Castro and Tufenkji 2008).
Different oxygen concentrations have been shown to affect the growth of P. aeruginosa
and induce physiological change (Sabra et al. 2003). An anaerobic environment was
reported to promote the production of the viscous exopolysaccharide alginate, and

45
introduce alterations in the outer membrane of P. aeruginosa, e.g., loss of O-specific
antigens (previously known as B-band polysaccharides), which eventually influenced the
adhesion of P. aeruginosa on various surfaces (Schobert and Jahn 2010, Singh et al.
2000).
Therefore, to evaluate the fate and transport of pathogenic P. aeruginosa in porous
media, the role of oxygen tension requires equal attention as other factors, such as
solution chemistry, and flow rate, etc.
2.2.2.3 Cryptosporidium and its surrogate
Cryptosporidium parvum is a disease-causing microbial contaminant frequently found
in surface waters. It is usually released into the environment via feces of infected host
organisms, posing great challenges in health risk management for drinking water supplies.
Ingestion of a small number of viable oocysts can lead to cryptosporidiosis, a severe
gastrointestinal disease that can prove fatal for immune-compromised individuals (Dai
and Hozalski 2003). Outbreaks of cryptosporidiosis disease are often caused by the
penetration of C. parvum oocysts through drinking water treatment systems (Gitis 2008).
The C. parvum oocysts are unusually resistant to traditional disinfectants such as free
chlorine and chloramines due to their thick cell walls (Finch et al. 1993). As a result,
water utilities are showing increased interest in oocyst removal in porous media such as
riverbank filtration, deep-bed (granular) filtration, and slow sand filtration to control
drinking water quality (Gottinger et al. 2013, Huck et al. 2002, Tufenkji et al. 2004).
In consideration of Cryptosporidium’s impact on experimental personnel health, a
growing number of studies, have been conducted using microspheres of similar size

46
instead of viable Cryptosporidium (Amburgey 2011, Amburgey et al. 2005, Chung 2012,
Dai and Hozalski 2003, Emelko and Huck 2004, Harvey et al. 2009, Muhammad et al.
2008). However, the use of these types of microspheres can potentially neglect the impact
of Cryptosporidium surface properties, such as zeta potential and surface structure,
therefore rendering the microspheres useless in predicting the filtration removal
efficiency satisfactorily. Even when the size and shape of microspheres are the same, the
micro-heterogeneity on the surface of viable Cryptosporidium can also alter the adhesion
behaviors (Pang et al. 2012).
Very recently, efforts have been made to explore a more suitable surrogate that can
satisfy the need for closely mimicking viable Cryptosporidium, while eliminating
personnel health hazards. Pang et al. modified the surfaces of oocyst-sized carboxylated
polystyrene microspheres with biotin (free and containing amine, NH2) and glycoprotein
and compared their filtration in porous media (sand) with viable Cryptosporidium and
unmodified microspheres, and found that the glycoprotein modified microspheres with
similar zeta potential and size resembled the viable Cryptosporidium the best, indicating
the significant role of surface protein, which is lacking on unmodified microspheres, in
particle attachment to solid surfaces (Pang et al. 2012).
Therefore, the use of the glycoprotein modified microspheres can be a more cost-
effective alternative for viable Cryptosporidium and unmodified microspheres for
assessing Cryptosporidium filtration in porous media. These modified microspheres can
be used for evaluating sand filter performance in water and wastewater treatment
processes with sufficient validation in various environmental conditions.

47
References
Abudalo, R.A., Ryan, J.N., Harvey, R.W., Metge, D.W. and Landkamer, L. (2010)
Influence of organic matter on the transport of Cryptosporidium parvum oocysts in
a ferric oxyhydroxide-coated quartz sand saturated porous medium. Water Research
44(4), 1104-1113.
Albinger, O., Biesemeyer, B.K., Arnold, R.G. and Logan, B.E. (1994) Effect of bacterial
heterogeneity on adhesion to uniform collectors by monoclonal populations. FEMS
Microbiology Letters 124(3), 321-326.
Alonso, A., Rojo, F. and Martinez, J.L. (1999) Environmental and clinical isolates of
Pseudomonas aeruginosa show pathogenic and biodegradative properties
irrespective of their origin. Environmental Microbiology 1(5), 421-430.
Amburgey, J.E. (2011) Removal of Cryptosporidium-sized polystyrene microspheres
from swimming pool water with a sand filter with and without added perlite filter
media. Journal of Environmental Engineering-Asce 137(12), 1205-1208.
Amburgey, J.E., Amirtharajah, A., York, M.T., Brouckaert, B.M., Spivey, N.C. and
Arrowood, M.J. (2005) Comparison of conventional and biological filter
performance for Cryptosporidium and microsphere removals. Journal American
Water Works Association 97(12), 77-91.
Baygents, J.C., Glynn, J.R., Albinger, O., Biesemeyer, B.K., Ogden, K.L. and Arnold,
R.G. (1998) Variation of surface charge density in monoclonal bacterial

48
populations: Implications for transport through porous media. Environmental
Science & Technology 32(11), 1596-1603.
Bolster, C.H., Mills, A.L., Hornberger, G.M. and Herman, J.S. (1999) Spatial distribution
of deposited bacteria following miscible displacement experiments in intact cores.
Water Resources Research 35(6), 1797-1807.
Bradford, S.A. and Bettahar, M. (2005) Straining, attachment, and detachment of
Cryptosporidium oocysts in saturated porous media. Journal of Environmental
Quality 34(2), 469-478.
Bradford, S.A., Simunek, J., Bettahar, M., Tadassa, Y.F., van Genuchten, M.T. and Yates,
S.R. (2005) Straining of colloids at textural interfaces. Water Resources Research
41(10).
Bradford, S.A. and Torkzaban, S. (2008) Colloid transport and retention in unsaturated
porous media: A review of interface-, collector-, and pore-scale processes and
models. Vadose Zone Journal 7(2), 667-681.
Bradford, S.A., Torkzaban, S. and Walker, S.L. (2007) Coupling of physical and
chemical mechanisms of colloid straining in saturated porous media. Water
Research 41(13), 3012-3024.
Bradford, S.A., Yates, S.R., Bettahar, M. and Simunek, J. (2002) Physical factors
affecting the transport and fate of colloids in saturated porous media. Water
Resources Research 38(12), 63-61-63-12.

49
Camesano, T.A. and Logan, B.E. (1998) Influence of fluid velocity and cell concentration
on the transport of motile and nonmotile bacteria in porous media. Environmental
Science & Technology 32(11), 1699-1708.
Camesano, T.A., Unice, K.M. and Logan, B.E. (1999) Blocking and ripening of colloids
in porous media and their implications for bacterial transport. Colloids and Surfaces
A-Physicochemical and Engineering Aspects 160(3), 291-308.
Castro, F.D. and Tufenkji, N. (2008) Role of oxygen tension on the transport and
retention of two pathogenic bacteria in saturated porous media. Environmental
Science & Technology 42(24), 9178-9183.
Chen, G. and Walker, S.L. (2007) Role of solution chemistry and ion valence on the
adhesion kinetics of groundwater and marine bacteria. Langmuir 23(13), 7162-7169.
Chen, G. and Walker, S.L. (2012) Fecal indicator bacteria transport and deposition in
saturated and unsaturated porous media. Environmental Science & Technology
46(16), 8782-8790.
Chung, J. (2012) Development of fluorescently labelled Cryptosporidium oocyst
surrogates to test the efficacy of sand filtration processes, Ph.D theis, University of
New South Wales.
Costerton, J.W., Lewandowski, Z., Caldwell, D.E., Korber, D.R. and Lappin-Scott, H.M.
(1995) Microbial biofilms. Annual Reviews in Microbiology 49(1), 711-745.

50
Crittenden, J.C., Trussell, R.R., Hand, D.W., Howe, K.J. and Tchobanoglous, G. (2012)
MWH's Water Treatment: Principles and Design, John Wiley & Sons.
Dai, X. and Hozalski, R.M. (2003) Evaluation of microspheres as surrogates for
Cryptosporidium parvum oocysts in filtration experiments. Environmental Science
& Technology 37(5), 1037-1042.
de Kievit, T.R. and Iglewski, B.H. (2000) Bacterial quorum sensing in pathogenic
relationships. Infection and Immunity 68(9), 4839-4849.
Derjaguin, B. and Landau, L. (1941) Theory of the stability of strongly charged
lyophobic sols and of the adhesion of strongly charged-particles in solutions of
electrolytes. Progress in Surface Science 43(1-4), 30-59.
Duhamel, M. and Edwards, E.A. (2006) Microbial composition of chlorinated ethene-
degrading cultures dominated by Dehalococcoides. FEMS Microbiology Ecology
58(3), 538-549.
Duhamel, M. and Edwards, E.A. (2007) Growth and yields of dechlorinators, acetogens,
and methanogens during reductive dechlorination of chlorinated ethenes and
dihaloelimination of 1,2-dichloroethane. Environmental Science & Technology
41(7), 2303-2310.
Duhamel, M., Mo, K. and Edwards, E.A. (2004) Characterization of a highly enriched
Dehalococcoides-containing culture that grows on vinyl chloride and
trichloroethene. Applied and Environmental Microbiology 70(9), 5538-5545.
51
Duhamel, M., Wehr, S.D., Yu, L., Rizvi, H., Seepersad, D., Dworatzek, S., Cox, E.E. and
Edwards, E.A. (2002) Comparison of anaerobic dechlorinating enrichment cultures
maintained on tetrachloroethene, trichloroethene, cis-dichloroethene and vinyl
chloride. Water Research 36(17), 4193-4202.
Elimelech, M. (1998) Particle Deposition and Aggregation : Measurement, Modelling,
and Simulation, Butterworth-Heinemann, Oxford, England.
Elimelech, M. and Omelia, C.R. (1990) Effect of particle-size on collision efficiency in
the deposition of brownian particles with electrostatic energy barriers. Langmuir
6(6), 1153-1163.
Emelko, M.B. and Huck, P.M. (2004) Microspheres as surrogates for Cryptosporidium
filtration. Journal American Water Works Association 96(3), 94-105.
Finch, G., Black, E., Gyürék, L. and Belosevic, M. (1993) Ozone inactivation of
Cryptosporidium parvum in demand-free phosphate buffer determined by in vitro
excystation and animal infectivity. Applied and Environmental Microbiology
59(12), 4203-4210.
Frymier, P.D., Ford, R.M., Berg, H.C. and Cummings, P.T. (1995) 3-Dimensional
tracking of motile bacteria near a solid planar surface. Proceedings of the National
Academy of Sciences of the United States of America 92(13), 6195-6199.
Gitis, V. (2008) Rapid sand filtration of Cryptosporidium parvum: effects of media depth
and coagulation. Water Science & Technology: Water Supply 8(2), 129-134.

52
Gollnitz, W.D., Clancy, J.L. and Garner, S.C. (1997) Reduction of microscopic
particulates by aquifers. American Water Works Association Journal 89(11), 84-93.
Gottinger, A.M., Bhat, S.V., McMartin, D.W. and Dahms, T.E.S. (2013) Fluorescent
microspheres as surrogates to assess oocyst removal efficacy from a modified slow
sand biofiltration water treatment system. Journal of Water Supply: Research and
Technology -- AQUA 62(3), 129-137.
Gregory, J. (1981) Approximate expressions for retarded vanderwaals interaction. Journal
of Colloid and Interface Science 83(1), 138-145.
Harvey, R., Metge, D., Sheets, R. and Jasperse, J. (2009) Fluorescent microspheres as
surrogates in evaluating the efficacy of riverbank filtration for removing
Cryptosporidium parvum oocysts and other pathogens. In Riverbank Filtration for
Water Security in Desert Countries. Ray, C. and Shamrukh, M. (eds), pp. 81-96.
He, J.Z., Ritalahti, K.M., Yang, K.L., Koenigsberg, S.S. and Loffler, F.E. (2003)
Detoxification of vinyl chloride to ethene coupled to growth of an anaerobic
bacterium. Nature 424(6944), 62-65.
Hermansson, M. (1999) The DLVO theory in microbial adhesion. Colloids and Surfaces
B-Biointerfaces 14(1-4), 105-119.
Hoek, E.M., Bhattacharjee, S. and Elimelech, M. (2003) Effect of membrane surface
roughness on colloid-membrane DLVO interactions. Langmuir 19(11), 4836-4847.

53
Hogg, R., Healy, T.W. and Fuersten.Dw (1966) Mutual coagulation of colloidal
dispersions. Transactions of the Faraday Society 62(522P), 1638-1651.
Huck, P.M., Coffey, B.M., Emelko, M.B., Maurizio, D.D., Slawson, R.M., Anderson,
W.B., Van Den Oever, J., Douglas, I.P. and O'Melia, C.R. (2002) Effects of filter
operation on Cryptosporidium removal. Journal of American Water Works
Association 94(6), 97-111.
Hwang, G., Kang, S., El-Din, M.G. and Liu, Y. (2012) Impact of an extracellular
polymeric substance (EPS) precoating on the initial adhesion of Burkholderia
cepacia and Pseudomonas aeruginosa. Biofouling 28(6), 525-538.
Jenneman, G.E., McInerney, M.J. and Knapp, R.M. (1985) Microbial penetration through
nutrient-saturated berea sandstone. Applied and Environmental Microbiology 50(2),
383-391.
Karamalidis, A., Evangelou, A., Karabika, E., Koukkou, A., Drainas, C. and Voudrias, E.
(2010) Laboratory scale bioremediation of petroleum-contaminated soil by
indigenous microorganisms and added Pseudomonas aeruginosa strain Spet.
Bioresource Technology 101(16), 6545-6552.
Kim, H.N., Walker, S.L. and Bradford, S.A. (2010) Coupled factors influencing the
transport and retention of Cryptosporidium parvum oocysts in saturated porous
media. Water Research 44(4), 1213-1223.
Kim, J. and Tobiason, J.E. (2004) Particles in filter effluent: The roles of deposition and
detachment. Environmental Science & Technology 38(22), 6132-6138.

54
Korber, D.R., Lawrence, J.R. and Caldwell, D.E. (1994) Effect of motility on surface
colonization and reproductive success of Pseudomonas-fluorescens in dual-dilution
continuous-culture and batch culture systems. Applied and Environmental
Microbiology 60(5), 1421-1429.
Lerner, R.N., Lu, Q., Zeng, H. and Liu, Y. (2012) The effects of biofilm on the transport
of stabilized zerovalent iron nanoparticles in saturated porous media. Water
Research 46(4), 975-985.
Liu, Q., Lazouskaya, V., He, Q. and Jin, Y. (2010) Effect of particle shape on colloid
retention and release in saturated porous media. Journal of Environmental Quality
39(2), 500-508.
Liu, Y., Janjaroen, D., Kuhlenschmidt, M.S., Kuhlenschmidt, T.B. and Nguyen, T.H.
(2009) Deposition of Cryptosporidium parvum oocysts on natural organic matter
surfaces: Microscopic evidence for secondary minimum deposition in a radial
stagnation point flow cell. Langmuir 25(3), 1594-1605.
Liu, Y., Yang, C.-H. and Li, J. (2007) Influence of extracellular polymeric substances on
Pseudomonas aeruginosa transport and deposition profiles in porous media.
Environmental Science & Technology 41(1), 198-205.
Marshall, K., Stout, R. and Mitchell, R. (1971) Mechanism of the initial events in the
sorption of marine bacteria to surfaces. Journal of General Microbiology 68(3),
337-348.
55
Martin, M.J., Logan, B.E., Johnson, W.P., Jewett, D.G. and Arnold, R.G. (1996) Scaling
bacterial filtration rates in different sized porous media. Journal of Environmental
Engineering 122(5), 407-415.
McCaulou, D.R., Bales, R.C. and Arnold, R.G. (1995) Effect of temperature-controlled
motility on transport of bacteria and microspheres through saturated sediment.
Water Resources Research 31(2), 271-280.
Muhammad, N., Sinha, R., Krishnan, E.R., Piao, H., Patterson, C.L., Cotruvo, J.,
Cumberland, S.L., Nero, V.P. and Delandra, C. (2008) Evaluating surrogates for
Cryptosporidium removal in point-of-use systems. Journal of American Water
Works Association 100(12), 98-107.
Norde, W. and Lyklema, J. (1989) Protein adsorption and bacterial adhesion to solid
surfaces: A colloid-chemical approach. Colloids and Surfaces 38(1), 1-13.
Palmer, K.L., Brown, S.A. and Whiteley, M. (2007) Membrane-bound nitrate reductase is
required for anaerobic growth in cystic fibrosis sputum. Journal of Bacteriology
189(12), 4449-4455.
Pang, L., Nowostawska, U., Weaver, L., Hoffman, G., Karmacharya, A., Skinner, A. and
Karki, N. (2012) Biotin- and glycoprotein-coated microspheres: Potential
surrogates for studying filtration of Cryptosporidium parvum in porous media.
Environmental Science & Technology 46(21), 11779-11787.

56
Parsek, M.R. and Fuqua, C. (2004) Biofilms 2003: Emerging themes and challenges in
studies of surface-associated microbial life. Journal of Bacteriology 186(14), 4427-
4440.
Pier, G.B., Grout, M., Zaidi, T.S., Olsen, J.C., Johnson, L.G., Yankaskas, J.R. and
Goldberg, J.B. (1996) Role of mutant CFTR in hypersusceptibility of cystic fibrosis
patients to lung infections. Science 271(5245), 64-67.
Redman, J.A., Estes, M.K. and Grant, S.B. (2001a) Resolving macroscale and microscale
heterogeneity in virus filtration. Colloids and Surfaces A: Physicochemical and
Engineering Aspects 191(1–2), 57-70.
Redman, J.A., Walker, S.L. and Elimelech, M. (2004) Bacterial adhesion and transport in
porous media: Role of the secondary energy minimum. Environmental Science &
Technology 38(6), 1777-1785.
Sabra, W., Lunsdorf, H. and Zeng, A.P. (2003) Alterations in the formation of
lipopolysaccharide and membrane vesicles on the surface of Pseudomonas
aeruginosa PAO1 under oxygen stress conditions. Microbiology-Sgm 149, 2789-
2795.
Saleh, N., Kim, H.-J., Phenrat, T., Matyjaszewski, K., Tilton, R.D. and Lowry, G.V.
(2008) Ionic strength and composition affect the mobility of surface-modified FeO
nanoparticles in water-saturated sand columns. Environmental Science &
Technology 42(9), 3349-3355.

57
Salerno, M.B., Flamm, M., Logan, B.E. and Velegol, D. (2006) Transport of rodlike
colloids through packed beds. Environmental Science & Technology 40(20), 6336-
6340.
Schäfer, A., Harms, H. and Zehnder, A.J. (1998) Bacterial accumulation at the air-water
interface. Environmental Science & Technology 32(23), 3704-3712.
Schobert, M. and Jahn, D. (2010) Anaerobic physiology of Pseudomonas aeruginosa in
the cystic fibrosis lung. International Journal of Medical Microbiology 300(8), 549-
556.
Seymour, M.B., Chen, G.X., Su, C.M. and Li, Y.S. (2013) Transport and retention of
colloids in porous media: Does shape really matter? Environmental Science &
Technology 47(15), 8391-8398.
Silliman, S.E., Dunlap, R., Fletcher, M. and Schneegurt, M.A. (2001) Bacterial transport
in heterogeneous porous media: Observations from laboratory experiments. Water
Resources Research 37(11), 2699-2707.
Simoni, S.F., Harms, H., Bosma, T.N.P. and Zehnder, A.J.B. (1998) Population
heterogeneity affects transport of bacteria through sand columns at low flow rates.
Environmental Science & Technology 32(14), 2100-2105.
Singh, P.K., Schaefer, A.L., Parsek, M.R., Moninger, T.O., Welsh, M.J. and Greenberg,
E.P. (2000) Quorum-sensing signals indicate that cystic fibrosis lungs are infected
with bacterial biofilms. Nature 407(6805), 762-764.

58
Sung, Y., Fletcher, K.F., Ritalaliti, K.M., Apkarian, R.P., Ramos-Hernandez, N., Sanford,
R.A., Mesbah, N.M. and Loffler, F.E. (2006) Geobacter lovleyi sp. nov. strain SZ, a
novel metal-reducing and tetrachloroethene-dechlorinating bacterium. Applied and
Environmental Microbiology 72(4), 2775-2782.
Tong, M.P., Camesano, T.A. and Johnson, W.P. (2005) Spatial variation in deposition
rate coefficients of an adhesion-deficient bacterial strain in quartz sand.
Environmental Science & Technology 39(10), 3679-3687.
Torkzaban, S., Bradford, S.A. and Walker, S.L. (2007) Resolving the coupled effects of
hydrodynamics and DLVO forces on colloid attachment in porous media. Langmuir
23(19), 9652-9660.
Torkzaban, S., Tazehkand, S.S., Walker, S.L. and Bradford, S.A. (2008) Transport and
fate of bacteria in porous media: Coupled effects of chemical conditions and pore
space geometry. Water Resources Research 44(4).
Tufenkji, N. and Elimelech, M. (2004a) Correlation equation for predicting single-
collector efficiency in physicochemical filtration in saturated porous media.
Environmental Science & Technology 38(2), 529-536.
Tufenkji, N. and Elimelech, M. (2004b) Deviation from the classical colloid filtration
theory in the presence of repulsive DLVO interactions. Langmuir 20(25), 10818-
10828.
Tufenkji, N., Miller, G.F., Ryan, J.N., Harvey, R.W. and Elimelech, M. (2004) Transport
of Cryptosporidium oocysts in porous media: Role of straining and

59
physicochemical filtration. Environmental Science & Technology 38(22), 5932-
5938.
Tufenkji, N., Redman, J.A. and Elimelech, M. (2003) Interpreting deposition patterns of
microbial particles in laboratory-scale column experiments. Environmental Science
& Technology 37(3), 616-623.
Tufenkji, N., Ryan, J.N. and Elimelech, M. (2002) The promise of bank filtration.
Environmental Science & Technology 36(21), 422A-428A.
Verwey, E.J.W. (1948) Theory of the stability of lyophobic colloids. Journal of Physical
and Colloid Chemistry 51(3), 631-636.
Vigeant, M.A.S. and Ford, R.M. (1997) Interactions between motile Escherichia coli and
glass in media with various ionic strengths, as observed with a three-dimensional-
tracking microscope. Applied and Environmental Microbiology 63(9), 3474-3479.
Wang, D., Bradford, S.A., Harvey, R.W., Gao, B., Cang, L. and Zhou, D. (2012) Humic
acid facilitates the transport of ARS-labeled hydroxyapatite nanoparticles in iron
oxyhydroxide-coated sand. Environmental Science & Technology 46(5), 2738-
2745.
Wang, Y., Hammes, F., Dueggelin, M. and Egli, T. (2008) Influence of size, shape, and
flexibility on bacterial passage through micropore membrane filters. Environmental
Science & Technology 42(17), 6749-6754.

60
Weiss, L. and Harlos, J.P. (1972) Short-term interactions between cell surfaces. Progress
in Surface Science 1, Part 4, 355-405.
Weiss, T.H., Mills, A.L., Hornberger, G.M. and Herman, J.S. (1995) effect of bacterial-
cell shape on transport of bacteria in porous-media. Environmental Science &
Technology 29(7), 1737-1740.
Williams, D.R., Rowe, J.J., Romero, P. and Eagon, R.G. (1978) Denitrifying
Pseudomonas aeruginosa: some parameters of growth and active transport. Applied
and Environmental Microbiology 36(2), 257-263.
Xie, B., Xu, Z., Guo, W. and Li, Q. (2008) Impact of natural organic matter on the
physicochemical properties of aqueous C60 nanoparticles. Environmental Science
& Technology 42(8), 2853-2859.
Yang, H., Kim, H. and Tong, M. (2012a) Influence of humic acid on the transport
behavior of bacteria in quartz sand. Colloids and Surfaces B-Biointerfaces 91, 122-
129.
Yang, H., Tong, M. and Kim, H. (2012b) Influence of bentonite particles on
representative gram negative and gram positive bacterial deposition in porous
media. Environmental Science & Technology 46(21), 11627-11634.
Yao, K.M., Habibian, M.T. and O'Melia, C.R. (1971) Water and wastewater filtration:
Concepts and applications. Environmental Science & Technology 5, 1105-1112.
61
Yoon, S.S., Hennigan, R.F., Hilliard, G.M., Ochsner, U.A., Parvatiyar, K., Kamani, M.C.,
Allen, H.L., DeKievit, T.R., Gardner, P.R., Schwab, U., Rowe, J.J., Iglewski, B.H.,
McDermott, T.R., Mason, R.P., Wozniak, D.J., Hancock, R.E.W., Parsek, M.R.,
Noah, T.L., Boucher, R.C. and Hassett, D.J. (2002) Pseudomonas aeruginosa
anaerobic respiration in biofilms: Relationships to cystic fibrosis pathogenesis.
Developmental Cell 3(4), 593-603.
Zhao, W., Walker, S.L., Huang, Q. and Cai, P. (2014) Adhesion of bacterial pathogens to
soil colloidal particles: Influences of cell type, natural organic matter, and solution
chemistry. Water Research 53, 35-46.
Zhuang, J., Qi, J. and Jin, Y. (2005) Retention and transport of amphiphilic colloids under
unsaturated flow conditions: Effect of particle size and surface property.
Environmental Science & Technology 39(20), 7853-7859.

62
Chapter 3. Retention and Transport of an Anaerobic Trichloroethene
Dechlorinating Microbial Culture in Anaerobic Porous Media*
*A version of this chapter has been published.
Zhang, H., Ulrich, A.C., and Liu, Y. (2015). Colloids and surfaces B: Biointerfaces, 130,
110-118.

63
3.1 Introduction
Chlorinated ethenes such as trichloroethene (TCE) and tetrachloroethene (PCE) are
toxic environmental contaminants that are introduced into soil and groundwater systems
through their extensive usage in industry (Lemming et al. 2010, Mundle et al. 2012).
Remediation strategies mainly focus on biological and chemical transformations that
replace chlorine atoms with hydrogen atoms, producing the more toxic incomplete
degradation products dichloroethene (DCE) and vinyl chloride (VC), and eventually
producing the nontoxic complete degradation product ethene (Duhamel et al. 2004, Friis
et al. 2007, Mundle et al. 2012). Strains of the anaerobic Dehalococcoides species are
currently the only bacteria that can completely degrade chlorinated ethenes to ethene
(Duhamel and Edwards 2006, Haggblom and Bossert 2003, He et al. 2003a, He et al.
2003b, Loffler and Edwards 2006). Bioremediation of TCE using the Dehalococcoides
bacteria has been shown to be a cost-effective way to decontaminate polluted sites
(Duhamel and Edwards 2006, Friis et al. 2007, Lemming et al. 2010, Mundle et al. 2012).
The population of indigenous Dehalococcoides species in contaminated sites is
generally low or absent. To successfully apply bioremediation strategies,
bioaugmentation is required to introduce TCE degradation microorganisms to the
contaminated subsurface (Camesano and Logan 1998). A major problem with the
application of bioaugmentation is the limited transfer distance of bacteria injected into
contaminated sites due to their strong adhesion to solid surfaces. Bacteria tend to remain
localized at the injection well head, causing serious biofouling of injection wells and
insufficient dispersion of degradative organisms. Consequently, the successful transport
of degrading bacteria away from injection sites and into contaminated zones is the

64
determining element of in situ bioremediation (DeFlaun and Condee 1997). Reduced
adhesion and enhanced transport of the bacterial strains can minimize bioclogging at the
injection well head (Gross and Logan 1995, Redman et al. 2004). The distance TCE
degradation microorganisms must travel to perform TCE degradation is an important
factor in successful remediation of contaminated waters.
Previous studies on the retention and transport of bacteria showed that grain size and
shape (Bradford et al. 2007, Syngouna and Chrysikopoulos 2011), saturation of porous
media (Chen and Walker 2012, Schafer et al. 1998), chemical treatments (Gross and
Logan 1995), solution ionic strength and composition (Chen and Walker 2012, Kim et al.
2009, Wang et al. 2011), natural organic matter (Foppen et al. 2008, Yang et al. 2012a),
bacteria growth phase (Walker et al. 2005), bacterial cell type and concentration
(Haznedaroglu et al. 2009, Yang et al. 2012b), cell motility (Camesano and Logan 1998,
De Kerchove and Elimelech 2008), cell surface lipopolysaccharides (LPS) (Walker et al.
2004), extracellular polymeric substances (EPS) (Liu et al. 2007), and the presence of
biofilm (Liu and Li 2008, Liu et al. 2008) played important roles in controlling bacterial
transport behaviors. Research on the transport and adhesion behaviors of dechlorinators is
limited (Camesano and Logan 1998, Chen et al. 2010b, Chen and Walker 2007, DeFlaun
and Condee 1997, DeFlaun et al. 1999, Nelson et al. 1986, Salerno et al. 2007). Most
studies have focused on aerobic and pure cultured conditions, and no study has evaluated
the retention and transport of commonly used bioaugmentation cultures in anaerobic
environments, which are representative of groundwater conditions; also many
contaminated subsurface environments are under oxygen depletion conditions (He et al.
2003a).

65
Previous studies showed that the presence of oxygen significantly impacted bacterial
adhesion. van Schie and Fletcher (van Schie and Fletcher 1999) studied the adhesion to
coverslips of a hypothetical PCE- and TCE-dechlorinating consortium comprised of four
strictly anaerobic pure cultures (Desulfomonile tiedjei, Syntrophomonas wolfei,
Syntrophobacter wolinii, and Desulfovibrio sp. strain G11) under anaerobic and aerobic
conditions by merging the coverslips in cell suspensions. They found that exposure to air
reduced the adhesion ability of S. wolfei and Desulfovibrio sp. strain G11 but not the
adhesion ability of Desulfomonile tiedjei and S. wolinii, thus it is possible that the
influence of dissolved oxygen on bacterial retention is organism dependent (Castro and
Tufenkji 2008). Their work also suggested that individual species exhibited different
adhesion characteristics and abilities. Subsequent work from this group (Cutter et al.
2003) confirmed that the attachment of one bacterial species could considerably affect the
adhesion of other bacteria species, either positively or negatively, and that the
dechlorinator (D. tiedjei) had the strongest attachment when solid surfaces were exposed
to the premixed community, demonstrating that interspecies interactions could affect
bacterial adhesion properties. Their work provided insight into the community biofilm
formation of dechlorinating bacteria in an anaerobic condition but the retention and
transport of complex anaerobic microbial communities in porous media was not
evaluated.
In the present study the retention and transport of the TCE-bioaugmentation culture
KB-1®, which has been shown to be effective in TCE remediation (Peale et al. 2008,
Scheutz et al. 2010), was investigated. The KB-1®
culture includes more than fourteen
defined species, of which eight are bacterial and six are archaeal (Duhamel and Edwards

66
2006, 2007, Duhamel et al. 2004). Of the three major functional microorganisms—
Dehalococcoides, Geobacter, and Methanomethylovorans—in KB-1®, Geobacter and
several strains of Dehalococcides could degrade TCE to DCE, but were unable to derive
energy from DCE and VC. Only limited strains of Dehalococcoides were found be able
to further degrade DCE and VC to nontoxic ethene (He et al. 2003b, Sung et al. 2006).
Without the presence of Dehalococcoides strains that could degrade DCE and VC, it is
possible that complete TCE degradation would stop beyond DCE, leading to the
accumulation of more toxic daughter products, DCE and VC (Duhamel et al. 2002).
Therefore, complete biodegradation of TCE to nontoxic ethene requires the presence of
both species. As the most frequently detected putative methanogen in methanol-amended
cultures, Methanomethylovorans converts methanol to methane (Duhamel and Edwards
2006). Other microorganisms detected in the culture were Spirochaetes (identified to
taxonomic class), Sulfurospirillum, Syntrophobacter, Syntrophus, and
Methanomicrobiales (identified to taxonomic class). The abundant presence of these
nondechlorinators are believed to contribute to dechlorination by generating electron
donors and trace nutrients to dechlorinators (Duhamel and Edwards 2006).
Microbial cell retention of the three major functional microorganisms
Dehalococcoides, Geobacter, and Methanomethylovorans in KB-1® culture was
evaluated in porous media in a well controlled anaerobic condition. Cell quantification
was accomplished using a quantitative polymerase chain reaction (qPCR). Cell surface
electrokinetic potentials were characterized to estimate the DLVO interaction forces
between microorganisms and the collector surfaces. To our knowledge this is the first

67
study to investigate the retention and transport of a mixed TCE-bioaugmentation culture
in porous media under strictly anaerobic conditions.
3.2 Materials and methods
3.2.1 Anaerobic microbial culture maintenance and preparation
A strictly anaerobic dechlorinating enrichment culture KB-1® (SiREM, Guelph,
Ontario) was used in this study. The detailed microbial composition and characteristics of
the culture are described elsewhere (Duhamel and Edwards 2006, 2007, Duhamel et al.
2004). The three major functional microorganisms, Dehalococcoides, Geobacter, and
Methanomethylovorans, were chosen as the targeting microorganisms.
KB-1® was cultured in a sterile defined anaerobic mineral medium (Edwards and
Grbicgalic 1994) statically in an anaerobic chamber (Coy Laboratory Products Inc., MI)
and fed with TCE (150 μM aqueous concentration) and methanol (1.5 mM) every two
weeks as described previously (Duhamel et al. 2002). Minor modifications were made
when preparing the mineral medium by reducing the KH2PO4 concentration to 20.96 g/L
and increasing the K2HPO4 concentration to 42.85 g/L. A redox indicator, resazurin, was
included in the preparation of defined mineral medium. Under anaerobic conditions,
resazurin remains colorless in the media solution. The anaerobic chamber was regularly
flushed with a gas mixture containing 5% H2, 5% CO2, and 90% N2 (Praxair Inc., CA) to
maintain a strictly anaerobic condition.
In each experiment, approximately 40 mL of KB-1® culture during exponential phase
was transferred into 50 mL sterile polystyrene tubes in the anaerobic chamber and

68
harvested by centrifugation at 3000 g and 4 °C for 10 min. The supernatant was decanted
and the pellets were resuspended in appropriate anaerobic electrolyte (1, 10, and 100 mM
NaCl). The pH of the NaCl solutions ranged from 6.3 to 6.6. The NaCl solution was
prepared by dissolving an appropriate amount of NaCl in ultrapure water (Milli-Q water,
Millipore Corp., MA). The NaCl solution was autoclaved and purged with ultrapure N2
(Praxair Inc., CA) and stored in an anaerobic chamber for at least 1 week prior to use to
remove all traces of residual oxygen (van Schie and Fletcher 1999). Due to the high
sensitivity of the cells to oxygen, recentrifugation and resuspension was performed once
to minimize possible cell damage and loss. The cell suspension was mixed using a stir bar
throughout the experiment to maintain uniform cell distribution. To maintain anaerobic
conditions, culture bottles and centrifuge tubes were opened only inside the anaerobic
chamber. To prevent oxygen intake during centrifugation, centrifuge tubes were sealed
with vinyl tape (Coy Laboratory Products Inc., MI) in the chamber. Plastic centrifuge
tubes were stored inside the chamber for at least one week before use to ensure sufficient
desorption of oxygen. To ensure the anaerobic condition of samples before, during, and
after centrifugation, a redox indicator, resazurin, was added in the defined mineral
medium. Only samples remained colorless after the centrifugation were used for
following transport experiments. Concentrations of the targeting microorganisms in the
KB-1® cell suspensions were determined to be 10
6 – 10
7 cells/mL for Dehalococcoides,
103 – 10
4 cells/mL for Geobacter, and 10
4 – 10
5 cells/mL for Methanomethylovorans
using a qPCR.

69
3.2.2 Electrokinetic potential measurements and DLVO interaction energy calculations
The electrokinetic potentials of the three targeting microbial species were determined
by a Malvern Zetasizer Nano-ZS Analyzer (Malvern Instruments Ltd., UK). Pure
cultured Dehalococcoides strain BAV1 (ATCC BAA-2100), Geobacter lovleyi strain SZ
(ATCC BAA-1151), and Methanomethylovorans hollandica strain DMS 1(DSMZ 15978)
were prepared as model microorganisms, and were obtained from ATCC (American Type
Culture Collection, Rockville, MD) and DSMZ (Leibniz Institute DSMZ-German
Collection of Microorganisms and Cell Cultures, Braunschweig). The microorganisms
were grown in a defined anaerobic mineral medium and fed with representative carbon
sources as described previously (He et al. 2003b, Lomans et al. 1999, Sung et al. 2006).
The microorganisms for zeta potential measurements were prepared under anaerobic
condition. Approximately 30 mL of actively growing pure cultures were collected by
centrifugation at 3000 g and 4 °C for 10 min. The freshly harvested cells were
resuspended in 1, 10, and 100 mM anaerobic NaCl solutions to yield a final cell
concentration of 107 cell/mL, and divided into several sterile 2 mL microcentrifuge tubes.
The microcentrifuge tubes were taken out of the anaerobic chamber only when measuring
zeta potentials. To guarantee the anaerobic conditions of the cell suspension, each tube
was used for one measurement only. All measurements were performed at least three
times using freshly prepared cell suspensions. The zeta potential of crushed glass beads
was determined in the three ionic strengths at 22 ± 1 °C. The results were averaged over
at least three measurements.
To better understand the mechanism controlling the observed microorganisms
transport and deposition behaviors in column experiments, the DLVO theory was used to

70
estimate the total interaction energy as a microbial cell approaching a glass bead for each
condition. The total interaction energy, including the sum of attractive van der Waals, and
the repulsive electrostatic double layer interactions, was determined by modeling the
microbial cell-glass bead system as a sphere-plate interaction (Redman et al. 2004,
Tufenkji and Elimelech 2004b).
The repulsive electrostatic double layer interaction energies were calculated using the
expression berived by Hogg et al.(1966):
(3.1)
where ε0 is the dielectric permittivity in a vacuum, εr is the relative dielectric
permittivity of water, ap is the microbial radius, κ is the inverse Debye length, h is the
separation distance between the microorganism and the collector surface, and ψp and ψc
are the surface potentials of the microbial cell and bead collector, respectively. The
retarded van der Waals attractive interaction energy was calculated based on (Elimelech
and Omelia 1990, Gregory 1981):
(3.2)
where A is the Hamaker constant of the interacting media (microorganism – water –
glass bead), and λ is the characteristic wavelength of the dielectric (assumed to be 100
nm). A value of 4.16 × 10⁻²¹
J was used for the Hamaker constant implying attractive van
der Waals interaction as a microbial cell approaching a glass bead-water interface (Chen
and Walker 2012, Israelachvili 2011, Lerner et al. 2012).

71
3.2.3 Porous media preparation and transport experiments in packed-bed columns
The packing material was spherical glass beads (MO-SCI Specialty Products, LLC.,
MO) with an average diameter of 550 μm and a specific gravity of 2.45 g/cm3. Prior to
column assemblage, glass beads were thoroughly cleaned following a method reported
previously (Li et al. 2006), oven-dried at 80 °C, and autoclaved.
Cell filtration was performed in acrylic columns with an internal diameter of 3.175 cm
and a length of 14 cm. Columns were uniformly dry-packed to a height of 14 cm with
vibration in the anaerobic chamber. The column porosity was estimated to be 0.4 using a
standard gravimetric method. Once packed, the column was stored in an anaerobic
chamber for at least one week (van Schie and Fletcher 1999) to remove all traces of
oxygen before performing column experiments.
A peristaltic pump (Cole Parmer, IL) was used to pump the solutions in an up flow
mode. Prior to each experiment, the filter was equilibrated by pumping at least 6 pore
volumes of cell free NaCl solution (1, 10, or 100 mM) through the column at a constant
velocity of 0.0042 cm/s. Approximately 4 pore volumes of cell suspension were
immediately injected into the column after switching the influent from the NaCl solution
to a cell suspension. Following cell injection, columns were eluted with 4 pore volumes
of background NaCl solution. The column effluent was collected in 50 mL sterile
polystyrene tubes. Following each transport experiment, the column media were equally
extruded and dissected into five segments of 2.8 cm length. Approximately 42 g of glass
beads were obtained from each segment. Column effluent and segment samples were
immediately used for DNA extraction. All experiments were performed in triplicate at

72
room temperature (22 ± 1 °C) in a well-controlled anaerobic condition. The solution pH
of the influent and effluent were measured and remained in the range of 6.5 ± 0.1
throughout the experimental process.
To quantitatively compare the overall deposition of the three species of anaerobic
organisms at different ionic strengths, the deposition rate coefficient kd was determined
using the steady state breakthrough cell concentrations according to the following
equation (Walker et al. 2004):
(3.3)
where f is the bed porosity, U is the approach (superficial) velocity, and L is the length
of the column. C/C0 is the normalized breakthrough cell concentration related to “clean
bed” conditions; C/C0 was obtained by averaging the breakthrough concentrations
between 3 and 4 pore volumes from each breakthrough curve. Based on classic colloid
filtration theory, the theoretical particle deposition pattern in the packed column can be
determined using the following equation (Tufenkji et al. 2003):
(3.4)
where S(X) is the particle deposition pattern, i.e., the number of deposited cells per
mass of the granular collector, X is the column depth, ρb is the porous media bulk density,
and t0 is the duration of the continuous particle injection.

73
3.2.4 DNA extraction and cell enumeration
A PowerSoil® DNA Isolation Kit (Mo Bio Laboratories, Inc.) was used to extract
DNA from the effluent and the segments, with the following modifications to the
manufacturer’s instructions. For the effluents and initial cell suspension, an aliquot of 300
μL was transferred into the PowerBead Tubes provided. For the segments, duplicate glass
beads samples with approximately 0.3 grams were extracted following the manufacturer’s
protocol and were gathered during the separation step using the spin filter.
A qPCR was used to enumerate the cells in the samples. Dehalococcoides, Geobacter,
and Methanomethylovorans were targeted in this study. Primer pairs (Duhamel and
Edwards 2006, Duhamel et al. 2004) (Table 3.1) were used in a CFX 96 real-time PCR
system with a C1000 Thermal Cycler (Bio-Rad Laboratories, Inc.). Each 20 μL reaction
contained 10 μL of SsoFast EvaGreen Supermix (Bio-Rad Laboratories, Inc.), 6 μL of
sterile water, 10 pmol of each primer, and 2 μL of DNA template. The thermocycling
program was as follows: initial denaturation for 3 min at 95 °C; two-step cycles of 95 °C
for 10 s, and 58 °C annealing for 30 s for a total of 40 cycles; a final melting curve from
65–95 °C was analyzed by measuring fluorescence every 0.5 °C. Calibration was
performed with serial dilutions of a known quantity of identical 16S rRNA gene, which
contained a targeting sequence generated using the PCR. Triplicate reactions of each
standard dilution were run alongside triplicate reactions of all samples analyzed. The
reaction conditions for the PCR were as follows: initial denaturation for 5 min at 95 °C;
35 cycles of 95 °C for 30 s, 58 °C for 1 min, and 72 °C for 1 min; and a final 10 min
extension at 72 °C. Each 25 uL of PCR mixture contained 5 PCR buffer, 37.5 nmol
MgCl2, 5 nmol deoxynucleoside triphosphate, 25 pmol each primer, 1.25 U GoTaq®

74
DNA polymerase (Promega Corporation), and 1 uL DNA template. Melting curves
showed reproducible single peaks without smaller peaks that would indicate primer dimer
formation or nonspecific amplification.
Table 3.1 Targeting microorganims and primer sequences
Microorganism Primer Sequence
Dehalococcoides 1f 5’-GGA TGA ACG CTA GCG GCG-3’
259r 5’-CAG ACC AGC TAC CGA TCG AA-3’
Geobacter Geo 73f 5’-CTT GCT CTT TCA TTT AGT GG-3’
Geo 485r 5’-AAG AAA ACC GGG TAT TAA CC-3’
Methanomethylovorans Mvorans 166f 5’-AAA GCT TTT GTG CCT AAG GA-3’
Mvorans 413r 5’-ATG GAC AGC CAA CAT AGG AT-3’
3.2.5 Statistical analysis
Electrokinetic potentials and breakthrough concentrations were analyzed with a single
factor analysis of variance (ANOVA) and reported as p-values. ANOVA was performed
using Microsoft Excel software; a p-value smaller than 0.05 suggests that the difference
is statistically significant.
3.3 Results and discussion
3.3.1 Electrokinetic potentials of microbial cells
The zeta potentials of the Dehalococcoides, Geobacter, Methanomethylovorans cells,
and glass beads are shown in Figure 3.1. The results suggest that the three
microorganisms and the glass beads were negatively charged over the range of ionic
strengths (1, 10, 100 mM) and pH (6.3–6.6) tested. The zeta potentials of the three
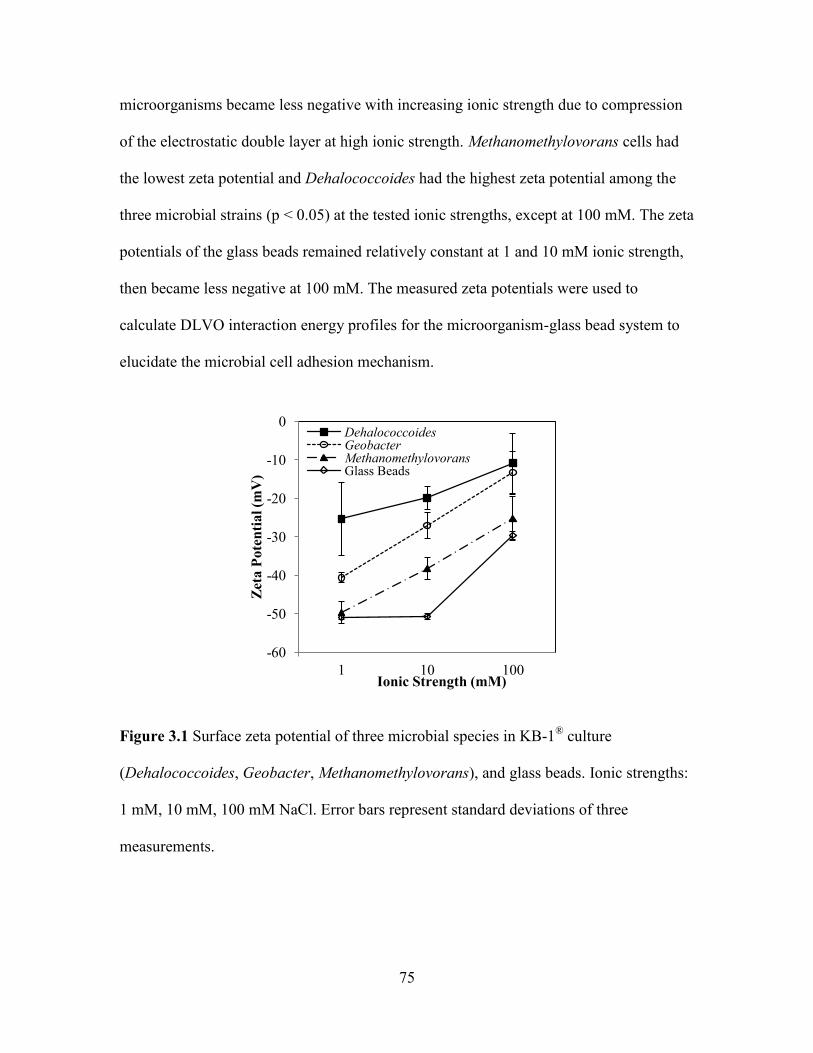
75
microorganisms became less negative with increasing ionic strength due to compression
of the electrostatic double layer at high ionic strength. Methanomethylovorans cells had
the lowest zeta potential and Dehalococcoides had the highest zeta potential among the
three microbial strains (p < 0.05) at the tested ionic strengths, except at 100 mM. The zeta
potentials of the glass beads remained relatively constant at 1 and 10 mM ionic strength,
then became less negative at 100 mM. The measured zeta potentials were used to
calculate DLVO interaction energy profiles for the microorganism-glass bead system to
elucidate the microbial cell adhesion mechanism.
Figure 3.1 Surface zeta potential of three microbial species in KB-1
® culture
(Dehalococcoides, Geobacter, Methanomethylovorans), and glass beads. Ionic strengths:
1 mM, 10 mM, 100 mM NaCl. Error bars represent standard deviations of three
measurements.
-60
-50
-40
-30
-20
-10
0
1 10 100
Zet
a P
ote
nti
al (m
V)
Ionic Strength (mM)
Dehalococcoides Geobacter Methanomethylovorans Glass Beads

76
3.3.2 Column transport experiments
Microbial breakthrough curves were constructed by plotting normalized cell
concentrations (C/C0) in the column outflow against the number of pore volumes passed
through the packed bed (Figure 3.2). Injected bacteria were detected in the column
effluent within one pore volume upon switching from the cell free NaCl solution to the
cell suspension. Similar breakthrough patterns were observed for all three species of
bacteria over the range of ionic strengths tested. The injected cells broke through the
packed bed after approximately 2 pore volumes, and the breakthrough concentrations
appeared to be constant for all three species. After 4 pore volumes, the columns were
flushed with cell free solutions of identical chemical composition; microorganism
concentrations in the effluent decreased continuously, eventually reaching zero, except
for Geobacter at 1 mM ionic strength. During flushing, a certain degree of tailing was
observed during the washout, indicating cell detachment.

77
Figure 3.2 Breakthrough curves of three microbial species in KB-1® culture
(Dehalococcoides, Geobacter, Methanomethylovorans) under three solution ionic
strengths: 1 (A), 10 (B), and 100 mM (C) NaCl. Cells injection started at pore volume 0
and ended at pore volume 4. Experimental conditions were as follows: approach velocity
= 0.0042 cm/s, porosity = 0.4, and pH = 6.3 – 6.6. Error bars represent standard
deviations of three measurements.
The breakthrough cell concentration decreased significantly with an increase in ionic
strength (p < 0.05), indicating increased cell retention. The increased cell removal
observed was in qualitative agreement with colloidal stability predictions of DLVO
0
0.2
0.4
0.6
0.8
1
1.2
0 2 4 6 8
C/C
0
Pore Volume
Dehalococcoides Geobacter Methanomethylovorans
0
0.2
0.4
0.6
0.8
1
1.2
0 2 4 6 8
C/C
0
Pore Volume
Dehalococcoides Geobacter Methanomethylovorans
0
0.2
0.4
0.6
0.8
1
1.2
0 2 4 6 8
C/C
0
Pore Volume
Dehalococcoides Geobacter Methanomethylovorans
A
1 mM
B
10 mM
C
100 mM

78
theory, which state that the diffuse double layers are compressed with increasing ionic
strength, causing a reduction in repulsive electrostatic double layer forces and an increase
in particle deposition rate.
Figure 3.3 Microbial deposition rate coefficient (kd) determined from the breakthrough
curves (Figure 3.2) using equation 3.3. Ionic strengths: 1 mM, 10 mM, 100 mM NaCl.
Error bars represent standard deviations of three measurements.
Generally, an increase in ionic strength leads to a higher deposition rate coefficient. As
shown in Figure 3.3, the deposition rate increased approximately 20 times over the range
of examined ionic strengths tested for all three microorganisms. Specifically, from 1 to 10
and 100 mM, the kd increased from 2.43E-05 to 1.14E-04 and 4.28E-04 s-1
for
Dehalococcoides, from 3.52E-05, to 1.30E-04 and 4.27E-04 s-1
for Geobacter, and from
4.60E-05 to 1.41E-04 and 4.53E-04 s-1
for Methanomethylovorans. Trends in the
deposition rates of the three species were consistent with respect to their zeta potentials
0
0.0001
0.0002
0.0003
0.0004
0.0005
0.0006
1 10 100
Kd (
1/s
)
Ionic Strength (mM)
Dehalococcoides Geobactor Methanomethylovorans

79
(Figure 3.1) as predicted by DLVO theory. However, it was noted that under the same
solution chemistry conditions, the deposition rate coefficients were similar among the
three bacterial species, although the measured zeta potentials were distinct. That is, the
least negatively charged microbial species (Dehalococcoides) exhibited deposition
behavior similar to the most negatively charged microbial species
(Methanomethylovorans). One possible reason is that previously attached particles may
have provided favorable sites for approaching particles to deposit. This may be because
the measured electrokinetic potentials of microbial cells were less negative than those of
the glass beads. Therefore, particle-particle interactions may become more favorable than
particle-collector surface interactions. It is also suspected that the power of theoretical
DLVO theory to predict microbial deposition behavior in this experimental system was
limited.
3.3.3 Profiles of retained microbial cells
Figures 3.4A, B, and C were obtained by plotting the number of microbial cells
recovered from the glass beads as a function of the distance travelled and the number of
microbial cells actually recovered with the number of microbial cells expected to be
recovered according to colloid filtration theory (CFT). The magnitudes of the retained
cell profiles for all three microbial species under three examined conditions varied
contrarily to the breakthrough plateaus, based on the mass balance consideration. That is,
an increase in ionic strength induced greater cell retention in the porous media.

80
Figure 3.4 Measured retained cell concentration profiles in single 14 cm column
(symbols in A1-A3, B1-B3, C1-C3). The microbial species are: Dehalococcoides (A1,
B1, and C1); Geobacter (A2, B2, and C2); and Methanomethylovorans (A3, B3, and C3).
The ionic strengths for the carrying solutions are as follows: 1 mM NaCl (A1-A3); 10
mM NaCl (B1-B3); and 100 mM NaCl (C1-C3). Dashed lines represent predictions based
on the classic colloid filtration theory (CFT) using deposition rate coefficient (kd). Data
0.001
0.01
0.1
1
10
0 2.8 5.6 8.4 11.2 14
S(X
)/C
0 (
cm
3/g
bead
s)
X (cm)
Dehalococcoides
0.001
0.01
0.1
1
10
0 2.8 5.6 8.4 11.2 14
S(X
)/C
0 (
cm
3/g
bead
s)
X (cm)
Geobacter
0.001
0.01
0.1
1
10
0 2.8 5.6 8.4 11.2 14
S(X
)/C
0 (
cm
3/g
bead
s)
X (cm)
Methanomethylovorans
0.001
0.01
0.1
1
10
0 2.8 5.6 8.4 11.2 14
S(X
)/C
0 (
cm
3/g
bead
s)
X (cm)
Dehalococcoides
0.001
0.01
0.1
1
10
0 2.8 5.6 8.4 11.2 14
S(X
)/C
0 (
cm
3/g
bead
s)
X (cm)
Geobacter
0.001
0.01
0.1
1
10
0 2.8 5.6 8.4 11.2 14
S(X
)/C
0 (
cm
3/g
bead
s)
X (cm)
Methanomethylovorans
0.001
0.01
0.1
1
10
0 2.8 5.6 8.4 11.2 14
S(X
)/C
0 (
cm
3/g
bea
ds)
X (cm)
Dehalococcoides
0.001
0.01
0.1
1
10
0 2.8 5.6 8.4 11.2 14
S(X
)/C
0 (
cm
3/g
bea
ds)
X (cm)
Geobacter
0.001
0.01
0.1
1
10
0 2.8 5.6 8.4 11.2 14
S(X
)/C
0 (
cm
3/g
bea
ds)
X (cm)
Methanomethylovorans
A1 A2 A3
B1 B2 B3
C1 C2 C3

81
were presented in a semilog format. Error bars represent standard deviations of three
measurements.
Log-linear retained profiles were observed for Methanomethylovorans,
Dehalococcoides, and Geobactor under the three ionic strengths examined, suggested
that the microbial removal in the porous media decreased exponentially with travel
distance, indicating spatially constant deposition rate coefficients. A reasonable mass
balance was generally achieved in the column experiments (77–118%) (Table 3.2).
Table 3.2 Cell recovery percentage from column experiments
Ionic
Strength Microorganism
Dehalococcoides Geobacter Methanomethylovorans
Effluenta Total
b Effluent
a Total
b Effluent
a Total
b
1 mM 91.9% 95.0% 96.0% 98.4% 83.9% 84.6%
10 mM 73.0% 79.6% 74.2% 82.6% 74.0% 77.3%
100 mM 54.7% 118.1% 57.2% 118.5% 53.0% 113.6%
aThe percentage of injected cells that were recovered by integration of the breakthrough
curves in Figure 3.2 during the transport stage. bThe combined percentage of cells
retained in the columns and cells that broke through the columns based on the cell mass
balance.
3.3.4 Modeling using DLVO theory-interaction energy profiles
Under all ionic strengths analyzed, microbial cells and glass beads had a negative zeta
potential. Repulsive electrostatic interactions should inhibit cell attachment. However, a
clear trend of increasing deposition rate coefficient was observed with an increase in

82
ionic strength. To better understand the mechanism controlling the observed
microorganism transport and deposition behaviors in column experiments, the DLVO
interaction energy profiles were determined for cells interacting with glass beads upon
close approach. The average equivalent spherical radius of a spheroid having the same
average volume as a disc-shaped Dehalococcoides bacterium was assumed to be 0.27 µm
(He et al. 2003b). The average equivalent spherical radius of a rod-shaped Geobacter
bacterium was determined to be 0.33 µm (Sung et al. 2006). Methanomethylovorans cells
were considered to be spheres with an average spherical radius of 0.63 μm (Lomans et al.
1999). Additionally, the zeta potentials of the microorganisms and glass beads were used
in place of the respective surface potentials (Tufenkji and Elimelech 2004b). DLVO
interaction energy versus separation distance for the microorganism-glass bead system in
the three conditions used in the deposition experiments is presented in Figure 3.5. The
calculations revealed the presence of a significant repulsive energy barrier to deposition
at all ionic strengths for all three bacterial species. The repulsive energy barriers
exhibited marked decreases with increases in ionic strength; specifically, the energy
barrier decreased from 337 kT at 1 mM to 9.92 kT at 100 mM, from 883 kT at 1 mM to
29.5 kT at 100 mM, and from 2140 kT at 1 mM to 270 kT at 100 mM for
Dehalococcoides, Geobacter, and Methanomethylovorans, respectively, as listed in Table
3.3. Therefore, DLVO interaction energy calculations predicted that the microbial cells
would be unlikely to deposit onto the glass bead surfaces (i.e., overcome the repulsive
energy barrier) under these conditions. However, cell deposition was observed in the
presence of a significant repulsive energy barrier even at the lowest ionic strength
examined (e.g., C0/C ≈ 0.95 for all three species at 1 mM).

83
Figure 3.5 Calculated DLVO interaction energy plotted as a function of separation
distance for different solution ionic strengths: 1 mM (A), 10 mM (B), and 100 mM (C);
and (insets) the expanded drawing to highlight the secondary energy minimum.
Experimentally measured zeta potentials (Figure 3.1) and a Hamaker constant of 4.16 ×
10-21
J were used to calculate interaction energies.
Replots of the DLVO interaction energy profiles on a different scale (insets in Figure
3.5) showed the presence of a secondary energy minimum at a greater separation distance
than that of the repulsive energy barrier. A secondary energy minimum exists as a
consequence of different dependencies of the van der Waals and electrostatic double
-500
200
900
1600
2300
0 10 20 30 40 50
Inte
ract
ion
En
erg
y (
kT
)
Separation Distance (nm)
Dehalococcoides
Geobacter
Methanomethylovorans
-500
200
900
1600
2300
0 10 20 30 40 50
Inte
ract
ion
En
erg
y (
kT
)
Separation Distance (nm)
Dehalococcoides
Geobacter
Methanomethylovorans
-500
200
900
1600
2300
0 10 20 30 40 50
Inte
ract
ion
En
erg
y (
kT
)
Separation Distance (nm)
Dehalococcoides Geobacter Methanomethylovorans
-9
-7
-5
-3
-1
1
0 30 60 90 120
A
-9
-7
-5
-3
-1
1
0 30 60 90 120
C
-9
-7
-5
-3
-1
1
0 30 60 90 120
B

84
layer on the separation distance (power-law and exponential, respectively).
Microorganisms approaching a bead collector would experience an attractive force before
encountering a repulsive energy barrier. Cells would remain associated with the bead
collector within the secondary energy minimum unless they had sufficient energy to
escape the well (Redman et al. 2004). As shown in Figure 3.5, the magnitude of the
secondary energy minimum increased with increasing ionic strength for all three species
over the range of ionic strengths tested. In particular, the depth of the secondary energy
minimum increased from 0.0187 kT at 1 mM to 4.61 kT at 100 mM, from 0.0208 kT at 1
mM to 5.15 kT at 100 mM, and from 0.0381 kT at 1 mM to 7.77 kT at 100 mM with
respect to corresponding separation distances of 70–4.25 nm, 122.5–4.75 nm, and 126–
5.75 nm for Dehalococcoides, Geobacter, and Methanomethylovorans, respectively
(Table 3.2).
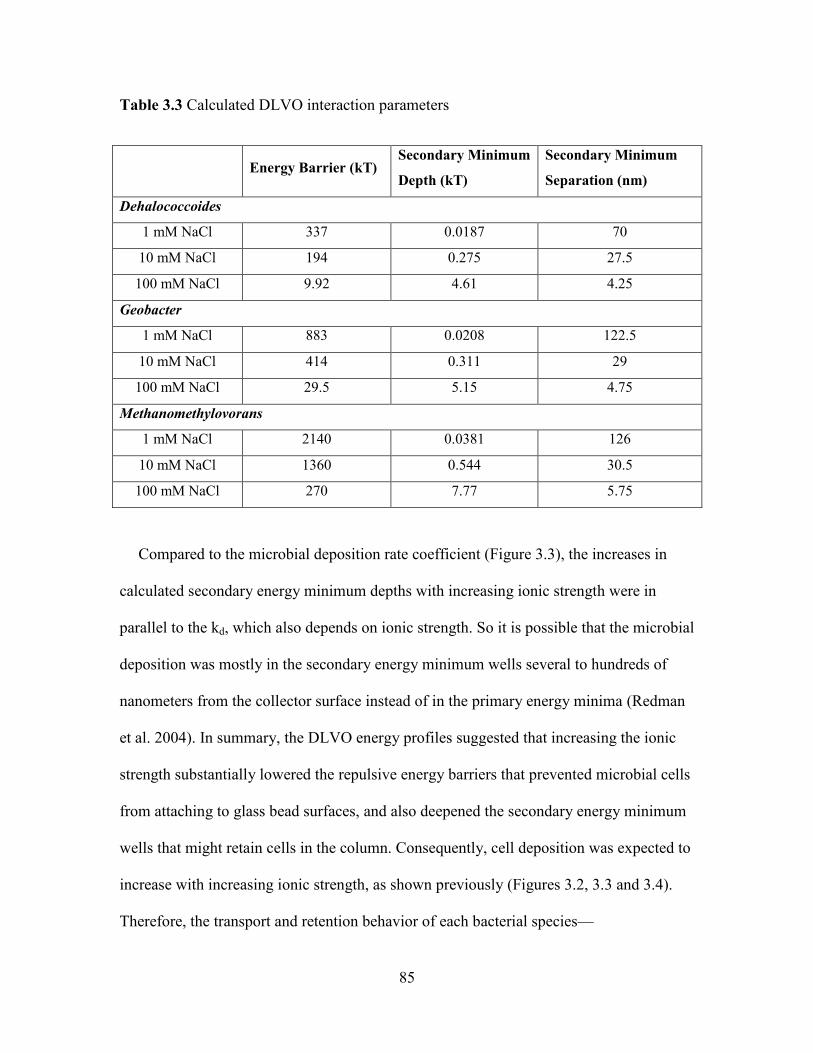
85
Table 3.3 Calculated DLVO interaction parameters
Energy Barrier (kT) Secondary Minimum
Depth (kT)
Secondary Minimum
Separation (nm)
Dehalococcoides
1 mM NaCl 337 0.0187 70
10 mM NaCl 194 0.275 27.5
100 mM NaCl 9.92 4.61 4.25
Geobacter
1 mM NaCl 883 0.0208 122.5
10 mM NaCl 414 0.311 29
100 mM NaCl 29.5 5.15 4.75
Methanomethylovorans
1 mM NaCl 2140 0.0381 126
10 mM NaCl 1360 0.544 30.5
100 mM NaCl 270 7.77 5.75
Compared to the microbial deposition rate coefficient (Figure 3.3), the increases in
calculated secondary energy minimum depths with increasing ionic strength were in
parallel to the kd, which also depends on ionic strength. So it is possible that the microbial
deposition was mostly in the secondary energy minimum wells several to hundreds of
nanometers from the collector surface instead of in the primary energy minima (Redman
et al. 2004). In summary, the DLVO energy profiles suggested that increasing the ionic
strength substantially lowered the repulsive energy barriers that prevented microbial cells
from attaching to glass bead surfaces, and also deepened the secondary energy minimum
wells that might retain cells in the column. Consequently, cell deposition was expected to
increase with increasing ionic strength, as shown previously (Figures 3.2, 3.3 and 3.4).
Therefore, the transport and retention behavior of each bacterial species—

86
Dehalococcoides, Geobacter, and Methanomethylovorans—was in qualitative agreement
with the DLVO interaction energy profiles presented in Figure 3.5.
3.3.5 Deviations from DLVO predictions
Even though the transport and retention behavior of each of the individual microbial
species (i.e., Dehalococcoides, Geobacter, and Methanomethylovorans) was in
qualitative agreement with the DLVO prediction, limitations of the theoretical DLVO
predictions in the experimental system are worth noting. Although each individual
species exhibited a distinct DLVO interaction energy profile consisting of a repulsive
energy barrier and a secondary energy minimum, the transport and retention behaviors of
all species were virtually the same. It is possible that the population heterogeneity in the
KB-1® culture might have contributed to the deviant transport and retention behaviors
observed among the different species (Tong and Johnson 2006, 2007, Tufenkji and
Elimelech 2005a). To evaluate factors that could cause deviation between experimental
deposition behavior and behavior predicted by DLVO theory, several aspects of
population heterogeneity in the KB-1® culture are considered.
(1) Cell size and shape
Previous studies (Tong and Johnson 2006, Yao et al. 1971) suggest that particles with
about 1.0 μm diameter exhibit minimal particle deposition efficiency. According to Yao
(Yao et al. 1971), sedimentation and interception are the predominant removal
mechanisms of particles larger than 1 μm, for which removal efficiency increases with
increasing particle size; particles smaller than 1 μm are effectively removed by diffusion
due to their Brownian movement, and their deposition efficiency decreases with an

87
increase in particle size (Yao et al. 1971). In our study, the equivalent spherical diameters
of Dehalococcoides were estimated to be approximately 0.54 μm. As the cell diameters
of Geobacter were 0.62–0.70 μm, respectively, it is likely that both strains undergo
diffusion, and the smaller sized Dehalococcoides would have higher attachment
efficiency than the larger Geobacter. Methanomethtlovorans, with the largest cell size
(diameter = 1–1.5 µm), would be more likely removed by sedimentation and interception.
Bacterial cell shape is reported to play a role in the filterability of bacterial cells, and
cells with higher aspect ratios are believed to exhibit preferential retention during the
transport process (Wang et al. 2008, Weiss et al. 1995). Salerno et al. (2006) observed
that rod-shaped particles with aspect ratios of 2:1 and 4:1 displayed higher retention than
spherical particles with an aspect ratio of 1:1. Liu et al. (2010) also reported that rod-
shaped particles displayed higher retention than spherical particles. Rod-shaped particles
would adopt a preferred orientation (end-on position) to minimize the interaction energy
when approaching collector surfaces (Seymour et al. 2013). It is possible that the rod-
shaped Geobacter cells oriented themselves to an end-on position when approaching to
the glass bead surfaces, rendering the collector surfaces additional roughness, which may
enhance subsequent attachment (Chen et al. 2010a). As described by He et al. (2003b),
the suspended disc-shaped cells of Dehalococcoides would tumble end over end in
solutions (He et al. 2003b). It is suspected that the disc-shaped Dehalococcoides cells
would adopt a similar end-on position as Geobacter cells when approaching to surfaces.
However, further experiments using single strains are needed to examine the suspension.
Despite the coccoid shapes of Methanomethylovorans cells, their minor difference from

88
the other two species in retention behavior might have contributed to the available
favorable sites provided by previously attached cells.
(2) Cell concentration
Although the clean bed theory predicts that cell retention in porous media is
independent of cell concentration, high cell concentrations are known to affect the overall
retention of cells either positively by providing more favorable surfaces for adhesion
(ripening) or negatively by providing less favorable surfaces (blocking) (Camesano and
Logan 1998, Camesano et al. 1999). Blocking was shown in a previous study where cell
concentrations of 108 cell/mL increased the breakthrough concentrations, however, no
obvious decrease in retention was observed at concentrations of 107 cell/mL and lower,
indicating that blocking is not predominant when cell concentrations are below the tested
108 cell/mL level (Haznedaroglu et al. 2009).
In our study, initial injected concentrations of Dehalococcoides were around 106–10
7
cells/mL, approximately 1000 times higher than that of Geobacter, and 100 times higher
than that of Methanomethylovorans. It is possible that previously attached
Dehalococcides cells provided a more favorable site of adhesion, and promoted further
cell attachment, resulting in multilayer coverage. Ripening is potentially involved in cell
adhesion and could have provided favorable adhesion sites.
(3) Cell motility
Bacterial motility is known to affect adhesion behavior. When brought near collector
surfaces, motile cells can swim along the surfaces at various orientations by either tracing

89
out circles around the surfaces, or moving in parallel or perpendicular to the surfaces
(Frymier et al. 1995, Vigeant and Ford 1997). Previous studies have shown that cell
motility can either increase or inhibit cell attachment (Jenneman et al. 1985, Korber et al.
1994). Camesano and Logan (1998) discovered that as fluid velocities decreased from
120 to 0.56 m/day, unlike nonmotile cells, swimming cells were able to avoid adhering to
a solid surface leading to reduced cell adhesion. At higher fluid velocities, cell motility
corresponded to a clear reduction in cell adhesion. They concluded that the variation
between motile and nonmotile cells at lower fluid velocities could potentially cause a
difference in the degree of cell retention from the colloid filtration theory prediction,
which predicts that a decrease in bulk fluid rate results in increased cell retention
(Camesano and Logan 1998, McCaulou et al. 1995). Under the experimental flow rate
(3.63 m/day), the motile Geobacter cells might have exhibited less attachment to the
collector surfaces than the nonmotile Dehalococcides and Methanomethylovorans cells.
(4) Microbial interactions
Cutter et al. (2003) indicated that one bacterial species adhering to a solid surface
could either positively or negatively affect the adhesion of other bacteria.
Macromolecules such as polymers, proteins, surfactants, and metabolites secreted by
bacteria were shown to either increase or decrease the attachment of other bacteria
(Pringle et al. 1983, Sutherland 1983, Tosteson et al. 1985). Previously attached bacteria
could also impact subsequent bacterial attachment by producing polymers and surfactants
on the collector surface (Pringle and Fletcher 1986); such surface alterations could
influence the subsequent adhesion of other microorganisms. In the present study it is
possible that the adhesions of Dehalococcoides, Geobacter, and Methanomethylovorans

90
were to some extent affected competitively or cooperatively by each other and by other
cells in the KB-1® culture.
The above discussion regarding different aspects of population heterogeneity is
heavily dependent on the three microorganisms targeted. However, other bacterial and
archaeal species present in the culture are believed to have contributed to the observed
transport and deposition behaviors of the three species examined in present study. In
addition, surface properties of Dehalococcoiddes, Geobacter, and Methanomethylovornas
were characterized solely based on the chosen model microorganisms and could not fully
represent the overall cell surface characterizations in the mixed culture, and hence might
not reflect predicted DLVO interactions. A change in model microorganisms could
potentially change the calculated DLVO interaction energy profiles.
3.4 Conclusions
Transport and retention trends of Dehalococcoides, Geobacter, and
Methanomethylovorans in KB-1® culture were investigated with a focus on the influence
of solution chemistry. Both experimental results and theoretical calculations were
employed to predict interactions and transport behaviors of the three species in
representative groundwater conditions. Cell surface characterizations were investigated
and classic DLVO theory interaction energy profiles were estimated. The influence of
mixed species interactions on the deposition behaviors of targeted bacteria was discussed.
Electrokinetic potential analysis revealed that Methanomethylovorans was the most
negatively charged species followed by Geobacter. Column experiment results showed
that all three species travelled similar distances, and were almost equally retained. Size,

91
shape, motility, and initial concentration of the microorganisms were found to impact
transport and deposition behaviors by balancing the effects caused by differences in
electrokinetic potentials; the result of transfer and deposition rate coefficients for
Dehalococcoides, Geobacter, and Methanomethylovorans was similar. A similarity in
cell transport behavior is greatly preferred for the TCE-bioargumentation process because
the coexistence of two major TCE dechlorinators - Dehalococcoides and Geobacter - is
crucial to complete dechlorination of TCE contaminated sites, with the presence of other
nondechlorinators. In our study, the three functional species travelled the same distance,
which is desirable. Future studies could track Dehalococcoides, Geobacter, and
Methanomethylovorans on a longer trajectory, and perhaps investigate the retention and
transport of other species in the KB-1® culture in porous media.
The results of the study suggest that bioaugmentation of KB-1® would be most
successful in low ionic strength water. Other factors, such as flow velocity, cell loading,
solution composition, grain size and shape, and saturation of porous media (not examined
in the present study) could also impact the retention and transport of the culture and could
be optimized with further testing. This study is the first to document the comparative
retention and transport behaviors of Dehalococcoides, Geobacter, and
Methanemethylovorans in the mixed TCE - bioaugmentation culture KB-1® in a range of
anaerobic groundwater conditions.

92
References
Bradford, S.A., Torkzaban, S. and Walker, S.L. (2007) Coupling of physical and
chemical mechanisms of colloid straining in saturated porous media. Water
Research 41(13), 3012-3024.
Camesano, T.A. and Logan, B.E. (1998) Influence of fluid velocity and cell concentration
on the transport of motile and nonmotile bacteria in porous media. Environmental
Science & Technology 32(11), 1699-1708.
Camesano, T.A., Unice, K.M. and Logan, B.E. (1999) Blocking and ripening of colloids
in porous media and their implications for bacterial transport. Colloids and Surfaces
A-Physicochemical and Engineering Aspects 160(3), 291-308.
Castro, F.D. and Tufenkji, N. (2008) Role of oxygen tension on the transport and
retention of two pathogenic bacteria in saturated porous media. Environmental
Science & Technology 42(24), 9178-9183.
Chen, G., Bedi, R.S., Yan, Y.S. and Walker, S.L. (2010a) Initial colloid deposition on
bare and zeolite-coated stainless steel and aluminum: Influence of surface
roughness. Langmuir 26(15), 12605-12613.
Chen, G., Hong, Y. and Walker, S.L. (2010b) Colloidal and bacterial deposition: Role of
gravity. Langmuir 26(1), 314-319.
Chen, G. and Walker, S.L. (2007) Role of solution chemistry and ion valence on the
adhesion kinetics of groundwater and marine bacteria. Langmuir 23(13), 7162-7169.

93
Chen, G. and Walker, S.L. (2012) Fecal indicator bacteria transport and deposition in
saturated and unsaturated porous media. Environmental Science & Technology
46(16), 8782-8790.
Cutter, L.A., van Schie, P.M. and Fletcher, M. (2003) Adhesion of anaerobic
microorganisms to solid surfaces and the effect of sequential attachment on
adhesion characteristics. Biofouling 19(1), 9-18.
De Kerchove, A.J. and Elimelech, M. (2008) Bacterial swimming motility enhances cell
deposition and surface coverage. Environmental Science & Technology 42(12),
4371-4377.
DeFlaun, M.F. and Condee, C.W. (1997) Electrokinetic transport of bacteria. Journal of
Hazardous Materials 55(1-3), 263-277.
DeFlaun, M.F., Oppenheimer, S.R., Streger, S., Condee, C.W. and Fletcher, M. (1999)
Alterations in adhesion, transport, and membrane characteristics in an adhesion-
deficient pseudomonad. Applied and Environmental Microbiology 65(2), 759-765.
Duhamel, M. and Edwards, E.A. (2006) Microbial composition of chlorinated ethene-
degrading cultures dominated by Dehalococcoides. FEMS Microbiology Ecology
58(3), 538-549.
Duhamel, M. and Edwards, E.A. (2007) Growth and yields of dechlorinators, acetogens,
and methanogens during reductive dechlorination of chlorinated ethenes and
dihaloelimination of 1,2-dichloroethane. Environmental Science & Technology
41(7), 2303-2310.

94
Duhamel, M., Mo, K. and Edwards, E.A. (2004) Characterization of a highly enriched
Dehalococcoides-containing culture that grows on vinyl chloride and
trichloroethene. Applied and Environmental Microbiology 70(9), 5538-5545.
Duhamel, M., Wehr, S.D., Yu, L., Rizvi, H., Seepersad, D., Dworatzek, S., Cox, E.E. and
Edwards, E.A. (2002) Comparison of anaerobic dechlorinating enrichment cultures
maintained on tetrachloroethene, trichloroethene, cis-dichloroethene and vinyl
chloride. Water Research 36(17), 4193-4202.
Edwards, E.A. and Grbicgalic, D. (1994) Anaerobic degradation of toluene and o-xylene
by a methanogenic consortium. Applied and Environmental Microbiology 60(1),
313-322.
Elimelech, M. and Omelia, C.R. (1990) Effect of particle-size on collision efficiency in
the deposition of brownian particles with electrostatic energy barriers. Langmuir
6(6), 1153-1163.
Foppen, J.W., Liem, Y. and Schijven, J. (2008) Effect of humic acid on the attachment of
Escherichia coli in columns of goethite-coated sand. Water Research 42(1-2), 211-
219.
Friis, A.K., Heimann, A.C., Jakobsen, R., Albrechtsen, H.-J., Cox, E. and Bjerg, P.L.
(2007) Temperature dependence of anaerobic TCE-dechlorination in a highly
enriched Dehalococcoides-containing culture. Water Research 41(2), 355-364.

95
Frymier, P.D., Ford, R.M., Berg, H.C. and Cummings, P.T. (1995) 3-Dimensional
tracking of motile bacteria near a solid planar surface. Proceedings of the National
Academy of Sciences of the United States of America 92(13), 6195-6199.
Gregory, J. (1981) Approximate expressions for retarded vanderwaals interaction. Journal
of Colloid and Interface Science 83(1), 138-145.
Gross, M.J. and Logan, B.E. (1995) Influence of different chemical treatments on
transport of Alcaligenes paradoxus in porous-media. Applied and Environmental
Microbiology 61(5), 1750-1756.
Haggblom, M.M. and Bossert, I.D. (2003) Dehalogenation: Microbial Processes and
Environmental Applications, Springer.
Haznedaroglu, B.Z., Kim, H.N., Bradford, S.A. and Walker, S.L. (2009) Relative
transport behavior of Escherichia coli O157:H7 and Salmonella enterica serovar
pullorum in packed bed column systems: Influence of solution chemistry and cell
concentration. Environmental Science & Technology 43(6), 1838-1844.
He, J.Z., Ritalahti, K.M., Aiello, M.R. and Loffler, F.E. (2003a) Complete detoxification
of vinyl chloride by an anaerobic enrichment culture and identification of the
reductively dechlorinating population as a Dehalococcoides species. Applied and
Environmental Microbiology 69(2), 996-1003.
He, J.Z., Ritalahti, K.M., Yang, K.L., Koenigsberg, S.S. and Loffler, F.E. (2003b)
Detoxification of vinyl chloride to ethene coupled to growth of an anaerobic
bacterium. Nature 424(6944), 62-65.

96
Hogg, R., Healy, T.W. and Fuersten.Dw (1966) Mutual coagulation of colloidal
dispersions. Transactions of the Faraday Society 62(522P), 1638-1651.
Israelachvili, J.N. (2011) Intermolecular and Surface Forces, 3rd ed, Academic Press,
Burlington, MA.
Jenneman, G.E., McInerney, M.J. and Knapp, R.M. (1985) Microbial penetration through
nutrient-saturated berea sandstone. Applied and Environmental Microbiology 50(2),
383-391.
Kim, H.N., Bradford, S.A. and Walker, S.L. (2009) Escherichia coli O157:H7 transport
in saturated porous media: Role of solution chemistry and surface macromolecules.
Environmental Science & Technology 43(12), 4340-4347.
Korber, D.R., Lawrence, J.R. and Caldwell, D.E. (1994) Effect of motility on surface
colonization and reproductive success of Pseudomonas-fluorescens in dual-dilution
continuous-culture and batch culture systems. Applied and Environmental
Microbiology 60(5), 1421-1429.
Lemming, G., Hauschild, M.Z., Chambon, J., Binning, P.J., Bulle, C., Margni, M. and
Bjerg, P.L. (2010) Environmental impacts of remediation of a trichloroethene-
contaminated site: Life cycle assessment of remediation alternatives.
Environmental Science & Technology 44(23), 9163-9169.
Lerner, R.N., Lu, Q., Zeng, H. and Liu, Y. (2012) The effects of biofilm on the transport
of stabilized zerovalent iron nanoparticles in saturated porous media. Water
Research 46(4), 975-985.

97
Li, J., McLellan, S. and Ogawa, S. (2006) Accumulation and fate of green fluorescent
labeled Escherichia coli in laboratory-scale drinking water biofilters. Water
Research 40(16), 3023-3028.
Liu, Q., Lazouskaya, V., He, Q. and Jin, Y. (2010) Effect of particle shape on colloid
retention and release in saturated porous media. Journal of Environmental Quality
39(2), 500-508.
Liu, Y. and Li, J. (2008) Role of Pseudomonas aeruginosa biofilm in the initial adhesion,
growth and detachment of Escherichia coli in porous media. Environmental
Science & Technology 42(2), 443-449.
Liu, Y., Yang, C.-H. and Li, J. (2007) Influence of extracellular polymeric substances on
Pseudomonas aeruginosa transport and deposition profiles in porous media.
Environmental Science & Technology 41(1), 198-205.
Liu, Y., Yang, C.-H. and Li, J. (2008) Adhesion and retention of a bacterial
phytopathogen Erwinia chrysanthemi in biofilm-coated porous media.
Environmental Science & Technology 42(1), 159-165.
Loffler, F.E. and Edwards, E.A. (2006) Harnessing microbial activities for environmental
cleanup. Current Opinion in Biotechnology 17(3), 274-284.
Lomans, B.P., Maas, R., Luderer, R., den Camp, H., Pol, A., van der Drift, C. and Vogels,
G.D. (1999) Isolation and characterization of Methanomethylovorans hollandica
gen. nov., sp nov., isolated from freshwater sediment, a methylotrophic methanogen

98
able to grow on dimethyl sulfide and methanethiol. Applied and Environmental
Microbiology 65(8), 3641-3650.
McCaulou, D.R., Bales, R.C. and Arnold, R.G. (1995) effect of temperature-controlled
motility on transport of bacteria and microspheres through saturated sediment.
Water Resources Research 31(2), 271-280.
Mundle, S.O.C., Johnson, T., Lacrampe-Couloume, G., Perez-de-Mora, A., Duhamel, M.,
Edwards, E.A., McMaster, M.L., Cox, E., Revesz, K. and Lollar, B.S. (2012)
Monitoring biodegradation of ethene and bioremediation of chlorinated ethenes at a
contaminated site using compound-specific isotope analysis (CSIA). Environmental
Science & Technology 46(3), 1731-1738.
Nelson, M.J.K., Montgomery, S.O., Oneill, E.J. and Pritchard, P.H. (1986) Aerobic
metabolism of trichloroethylene by a bacterial isolate. Applied and Environmental
Microbiology 52(2), 383-384.
Peale, J.G.D., Bakkom, E., Lakhwala, F., Mueller, J. and Molin, J. (2008) TCE plume
remediation via ISCR-enhanced bioremediation utilizing EHC® and KB-1
®.
Remediation Journal 18(4), 19-31.
Pringle, J.H. and Fletcher, M. (1986) Influence of substratum hydration and adsorbed
macromolecules on bacterial attachment to surfaces. Applied and Environmental
Microbiology 51(6), 1321-1325.
Pringle, J.H., Fletcher, M. and Ellwood, D.C. (1983) Selection of attachment mutants
during the continuous culture of Pseudomonas-fluorescens and relationship
99
between attachment ability and surface-composition. Journal of General
Microbiology 129(AUG), 2557-2569.
Redman, J.A., Walker, S.L. and Elimelech, M. (2004) Bacterial adhesion and transport in
porous media: Role of the secondary energy minimum. Environmental Science &
Technology 38(6), 1777-1785.
Salerno, M.B., Flamm, M., Logan, B.E. and Velegol, D. (2006) Transport of rodlike
colloids through packed beds. Environmental Science & Technology 40(20), 6336-
6340.
Salerno, M.B., Li, X. and Logan, B.E. (2007) Adhesion characteristics of two
Burkholderia cepacia strains examined using colloid probe microscopy and
gradient force analysis. Colloids and Surfaces B-Biointerfaces 59(1), 46-51.
Schafer, A., Ustohal, P., Harms, H., Stauffer, F., Dracos, T. and Zehnder, A.J.B. (1998)
Transport of bacteria in unsaturated porous media. Journal of Contaminant
Hydrology 33(1-2), 149-169.
Scheutz, C., Broholm, M.M., Durant, N.D., Weeth, E.B., Jorgensen, T.H., Dennis, P.,
Jacobsen, C.S., Cox, E.E., Chambon, J.C. and Bjerg, P.L. (2010) Field evaluation
of biological enhanced reductive dechlorination of chloroethenes in clayey till.
Environmental Science & Technology 44(13), 5134-5141.
Seymour, M.B., Chen, G.X., Su, C.M. and Li, Y.S. (2013) Transport and retention of
colloids in porous media: Does shape really matter? Environmental Science &
Technology 47(15), 8391-8398.

100
Sung, Y., Fletcher, K.F., Ritalaliti, K.M., Apkarian, R.P., Ramos-Hernandez, N., Sanford,
R.A., Mesbah, N.M. and Loffler, F.E. (2006) Geobacter lovleyi sp. Nov. strain SZ,
a novel metal-reducing and tetrachloroethene-dechlorinating bacterium. Applied
and Environmental Microbiology 72(4), 2775-2782.
Sutherland, I.W. (1983) Microbial exopolysaccharides - their role in microbial adhesion
in aqueous systems. CRC Critical Reviews in Microbiology 10(2), 173-201.
Syngouna, V.I. and Chrysikopoulos, C.V. (2011) Transport of biocolloids in water
saturated columns packed with sand: Effect of grain size and pore water velocity.
Journal of Contaminant Hydrology 126(3–4), 301-314.
Tong, M. and Johnson, W.P. (2006) Excess colloid retention in porous media as a
function of colloid size, fluid velocity, and grain angularity. Environmental Science
& Technology 40(24), 7725-7731.
Tong, M. and Johnson, W.P. (2007) Colloid population heterogeneity drives
hyperexponential deviation from classic filtration theory. Environmental Science &
Technology 41(2), 493-499.
Tosteson, T.R., Revuelta, R., Zaidi, B.R., Imam, S.H. and Bard, R.F. (1985) Aggregation
adhesion enhancing macromolecules and the specificity of marine microbial surface
interactions. Journal of Colloid and Interface Science 104(1), 60-71.
Tufenkji, N. and Elimelech, M. (2004b) Deviation from the classical colloid filtration
theory in the presence of repulsive DLVO interactions. Langmuir 20(25), 10818-
10828.

101
Tufenkji, N. and Elimelech, M. (2005) Breakdown of colloid filtration theory: Role of the
secondary energy minimum and surface charge heterogeneities. Langmuir 21(3),
841-852.
van Schie, P.M. and Fletcher, M. (1999) Adhesion of biodegradative anaerobic bacteria
to solid surfaces. Applied and Environmental Microbiology 65(11), 5082-5088.
Vigeant, M.A.S. and Ford, R.M. (1997) Interactions between motile Escherichia coli and
glass in media with various ionic strengths, as observed with a three-dimensional-
tracking microscope. Applied and Environmental Microbiology 63(9), 3474-3479.
Walker, S.L., Redman, J.A. and Elimelech, M. (2004) Role of cell surface
lipopolysaccharides in Escherichia coli K12 adhesion and transport. Langmuir
20(18), 7736-7746.
Walker, S.L., Redman, J.A. and Elimelech, M. (2005) Influence of growth phase on
bacterial deposition: Interaction mechanisms in packed-bed column and radial
stagnation point flow systems. Environmental Science & Technology 39(17), 6405-
6411.
Wang, L., Xu, S. and Li, J. (2011) Effects of phosphate on the transport of Escherichia
coli O157:H7 in saturated quartz sand. Environmental Science & Technology
45(22), 9566-9573.
Wang, Y., Hammes, F., Dueggelin, M. and Egli, T. (2008) Influence of size, shape, and
flexibility on bacterial passage through micropore membrane filters. Environmental
Science & Technology 42(17), 6749-6754.

102
Weiss, T.H., Mills, A.L., Hornberger, G.M. and Herman, J.S. (1995) Effect of bacterial-
cell shape on transport of bacteria in porous-media. Environmental Science &
Technology 29(7), 1737-1740.
Yang, H., Kim, H. and Tong, M. (2012a) Influence of humic acid on the transport
behavior of bacteria in quartz sand. Colloids and Surfaces B-Biointerfaces 91, 122-
129.
Yang, H., Tong, M. and Kim, H. (2012b) Influence of bentonite particles on
representative gram negative and gram positive bacterial deposition in porous
media. Environmental Science & Technology 46(21), 11627-11634.
Yao, K.M., Habibian, M.T. and O'Melia, C.R. (1971) Water and wastewater filtration:
Concepts and applications. Environmental Science & Technology 5, 1105-1112.

103
Chapter 4. Comparison of the Transport and Deposition of
Pseudomonas aeruginosa under Aerobic and Anaerobic Conditions*
*A version of this chapter has been submitted for journal publication.

104
4.1 Introduction
Bacterial transport and retention in granular porous media affects environmental
applications such as in-situ bioremediation, water and wastewater filtration, and pathogen
transport in subsurface (Parsek and Fuqua 2004, Steffan et al. 1999, Tufenkji et al. 2002).
To evaluate the fate and transport of organisms in groundwater and other subsurfaces,
numerous studies have been conducted to determine mechanisms governing microbial
migration and retention, particularly those toxigenic and degradative bacterial strains
(Camesano and Logan 1998, Haznedaroglu et al. 2009, Kim et al. 2009, Li et al. 2006,
Liu and Li 2008, Liu et al. 2007).
P. aeruginosa are facultative, functioning aerobically and anaerobically, and are
capable of growing using a large variety of carbon sources (Palmer et al. 2007, Williams
et al. 1978, Yoon et al. 2002). Metabolically versatile, P. aeruginosa can adapt to and
colonize in various environmental niches such as soil and marine habitats, plants, and
animals. In humans, P. aeruginosa are predominant in the chronic lung infections of
cystic fibrosis patients (de Kievit and Iglewski 2000). Though more widely recognized as
an opportunistic pathogen in humans and animals, P. aeruginosa’s degradative abilities
are apparent in soil (Alonso et al. 1999). Isolates of P. aeruginosa had shown efficient
ability to degrade various petroleum products such as gasoline, kerosene, diesel oil, and
crude oil, and pollutants such as n-alkanes and polycyclic aromatic hydrocarbons (PAH)
despite their origins (clinic or environment) (Alonso et al. 1999, Karamalidis et al. 2010).
Although factors that affect the fate and transport of P. aeruginosa under aerobic
conditions are well documented, including solution ionic strength (Martin et al. 1992),

105
hydrophobicity (Marcus et al. 2012), presence of divalent cations (Simoni et al. 2000),
extracellular polymeric substances (EPS) (Liu et al. 2007), cell motility (de Kerchove and
Elimelech 2007, 2008), little information is available on their transport under anaerobic
conditions.
Bacteria travelling in the subsurface may face various dissolved oxygen (DO)
concentrations. Variation in oxygen concentration has been shown to affect the growth of
P. aeruginosa and induce physiological change (Sabra et al. 2003). An anaerobic
environment was found to promote the production of the viscous exopolysaccharide
alginate, and introduce alterations in the outer membrane of P. aeruginosa, e.g., loss of
O-specific antigens (previously known as B-band polysaccharides) (Schobert and Jahn
2010, Singh et al. 2000).
Studies on the impact of oxygen levels on E. coli deposition in porous media (Castro
and Tufenkji 2008, Landini and Zehnder 2002, McCaulou et al. 1995, Yang et al. 2006)
are scarce. Landini and Zehnder (2002) found that anoxia reduces E. coli adhesion to a
sand column, and proposed that the reduced adhesion was a result of increased
transcription of the fliC gene, encoding the major flagellar subunit, and increased
production of lipopolysaccharides (LPS). Yang et al. ( 2006) observed that environmental
E. coli isolates showed the least transport and most adhesion to various granular materials
when growing under aerobic condition compared to intestinal growth. Castro and
Tufenkji (2008) performed laboratory scale filtration experiments in electrolyte solution
with low or high DO using E. coli and Yersinia enterocolitica grown in either aerobic or
anaerobic condition. It was observed that the effect of DO on bacterial transport and

106
retention depended on microbial growth conditions and microorganism types. Studies on
different organisms are needed to determine whether these general principles apply.
To our knowledge, the effects of oxygen tension on the transport of P. aeruginosa
PAO1 in granular porous media have not been previously reported. This study
investigates the effects of oxygen on the growth and transport of P. aeruginosa PAO1.
Experiments were carried out in oxygen-depleted and oxygen-rich electrolytes to
examine bacterial transport and deposition behaviors. The results obtained from packed
column experiments were further supported by the measurements of electrokinetic
potentials and characterization of cell surfaces.
4.2 Materials and methods
4.2.1 Bacterial cultivation and cell preparation
Gram negative, rod-shaped Pseudomonas aeruginosa, wild-type PAO1, was stored at -
80 °C until utilized in the study. For each aerobic experiment, P. aeruginosa PAO1 was
streaked onto a Luria-Bertani (LB) agar plate and incubated at 37 °C overnight. A single
colony was transferred into 15 mL of LB broth and grown in a shaker incubator (New
Brunswick Scientific Co., NJ) at 200 rpm and 37 °C for 18 h. Early stationary-phase
bacterial cells were harvested by centrifugation at 3000 g and 4 °C for 10 min using 50
mL sterile polystyrene tubes. After the supernatant was decanted, the pellets were
resuspended in appropriate electrolytes (1, 10, and 100 mM NaCl). The centrifugation
and resuspension procedure was repeated twice to remove possible traces of growth
media. A final cell density of approximately 106 colony-forming units (CFU)/mL was
obtained. Cell suspensions were kept on ice before the filtration experiment to minimize

107
bacterial growth. The pH of the electrolytes ranged from 6.3-6.6. Cell suspensions were
mixed using a stir bar throughout the experiment to maintain uniform cell distribution.
For each anaerobic experiment, a single colony was transferred into 15 mL of
anaerobic LB broth amended with 5 mM NaNO3 and cells were grown in an anaerobic
chamber (Coy laboratory Products Inc., MI) at room temperature for 38-40 h to reach
early stationary growth phase. For anaerobic experiments, cell suspensions of 106
CFU/mL using anaerobic 0.9% NaCl were prepared in the manner described for aerobic
experiments. To maintain the anaerobic condition of the cell suspension, the 50 mL tubes
were taken out of the anaerobic chamber only for centrifugation and were opened only in
the anaerobic chamber. To minimize oxygen intake during centrifugation, centrifuge
tubes were sealed with vinyl tape (Coy laboratory Products Inc., MI) before being taken
out of the anaerobic chamber. Anaerobic LB broth and 0.9% NaCl solution were prepared
by purging with ultrahigh purity N2 (Praxair Inc., CA) for at least 30 min per liter of
liquid immediately after autoclaving. All liquids and plastic tubes used for anaerobic
transport experiments were stored in the anaerobic chamber for at least one week prior to
use (van Schie and Fletcher 1999). To control the anaerobic condition, the anaerobic
chamber was routinely flushed with a gas mixture containing 5% H2, 5% CO2, and 90%
N2 (Praxair Inc., CA).
4.2.2 Electrokinetic potential measurements
A Malvern Zetasizer Nano-ZS Analyzer (Malvern Instruments Ltd., UK) was used to
measure the zeta potentials of both aerobic and anaerobic PAO1 cells. Cell suspensions
were prepared from aerobic and anaerobic cultures as described in section 4.2.1.

108
Approximately 10 mL of stationary phase PAO1 cells were collected by centrifugation at
3000 g and 4 °C for 10 min. The rinsed stock cell suspensions were diluted in 1, 10, and
100 mM NaCl (aerobic or anaerobic) to a final cell density of 107 CFU/mL. The
anaerobic bacteria cell suspension was divided into several sterile 2 mL microcentrifuge
tubes, and kept in the anaerobic chamber until zeta potentials were measured. To
maintain the anaerobic condition of the cell suspension, each microcentrifuge tube was
used for only one measurement. Anaerobic NaCl solutions (1 mM, 10 mM, and 100 mM)
were prepared by purging with ultrapure N2 (Praxair Inc., CA) for at least 30 min per liter
immediately after autoclaving. All measurements were performed at least three times
using freshly prepared cell suspensions. The zeta potential of crushed glass beads was
determined under the three ionic strengths at 22 ± 1 °C. The results were averaged over at
least three measurements. The measured zeta potentials were used to calculate the
Derjaguin-Landau-Verwey-Overbeek (DLVO) interaction energy.
4.2.3 Bacterial cell size
To measure the dimensions of PAO1 in aerobic and anaerobic conditions, scanning
electron microscopy (SEM) images were taken using a scanning auger microprobe
spectrometer (JAMP9500F, Oxford Instruments). Freshly harvested stationary bacteria
were suspended in 10 mM NaCl, and fixed with 2.5% glutaraldehyde for 30 min.
Bacterial suspensions were then washed three times with 10 mM NaCl and fixed again
using 1% OsO4 for 30 min. Bacteria were then dehydrated in a series of 50%, 70%, 90%,
and 100% ethanol, followed by critical point drying at 31 °C for 30 min. The samples
were sputter-coated with gold (Edwards, Model S150B, UK) and examined with SEM.
Individual cell lengths and widths were determined. Measured values were used to
109
calculate the effective cell radius and corresponding bacterial cell surface area. The
average lengths were found to be 1.95 ± 0.15 µm and 1.55 ± 0.05 µm for aerobic and
anaerobic PAO1, respectively, while the widths (0.55 ± 0.05 µm) were similar. The
resulting equivalent spherical radii were 0.48 µm and 0.44 µm for aerobic and anaerobic
PAO1, respectively.
4.2.4 EPS composition analysis
Components of extracellular polymeric substances (EPS) were extracted from the
bacterial surfaces with a heating method. Briefly, freshly harvested bacterial cells in early
stationary phase were washed twice using 0.9% NaCl before proceeding to EPS
extraction. After being washed, the bacterial cell pellet was resuspended in ultrapure
water and heated at 80 °C for 10 min (Zhang et al. 1999). The heated bacterial suspension
was centrifuged at 15,000 g, 4 °C for 15 min. Supernatants were filtered (0.22 µm pore)
and filtrate was collected as EPS extracts and stored at -20 °C (Hwang et al. 2012).
Colorimetric methods were employed to determine the composition of the EPS
extracts using a UV-Visible spectrophotometer (Varian Inc., CA). Protein and
polysaccharides concentrations were estimated by the bicinchoninic acid assay (Frolund
et al. 1995, Lowry et al. 1951) and the phenol-sulfuric acid assay (Dubois et al. 1956),
respectively. Bovine serum albumin (BSA) (Fisher Scientific Inc., USA), and glucose
(Fisher Scientific Inc., USA) were used as standards for measuring protein and
polysaccharides, respectively. Spectrophotometer readings of absorbance at 595 nm and
480 nm were taken to determine protein and polysaccharides concentrations, respectively
(Hwang et al. 2012).
110
4.2.5 XPS analysis of bacterial cells
Cryo-X-ray photoelectron spectroscopy (Cryo-XPS) (Axis 165, Kratos Analytical,
Japan) was used to determine the surface composition of both aerobic and anaerobic
PAO1 cells. Bacteria aerobically grown to early stationary phase were harvested and
washed twice with 0.9% NaCl. After the final washing, cell pellets were dissolved in 1
mL 0.9% NaCl, yielding a final cell density of 109 CFU/mL. Bacteria grown in the
anaerobic condition were prepared in the same manner using anaerobic 0.9% NaCl in a
well controlled anaerobic chamber. To maintain an anaerobic condition in bacterial cell
suspensions during centrifugation, centrifuge tubes were sealed with vinyl tape and
opened only in the anaerobic chamber. Cell suspensions were quickly cooled and frozen
in liquid nitrogen, and placed in the instrument for XPS analysis. CasaXPS instrument
software was used for data processing. The sum of atomic concentrations of O, C, and N
for each sample was scaled to 100%.
The concentrations of the three major bacterial surface constituents-proteins (PR),
polysaccharides (PS), and hydrocarbon-like products (HC) were determined using the
following equations (Shapiro and Dworkin 1997).
O/C = 0.325(CPR/C) + 0.833(CPS/C) (4.1)
N/C = 0.279(CPR/C) (4.2)
1 = (CPR/C) + (CPS/C) + (CHC/C) (4.3)
where O/C and N/C are the atomic concentration ratios of oxygen/carbon and
nitrogen/carbon, respectively, in the sample surface. CPS, CPR, and CHC are the atomic

111
concentrations of carbon present in polysaccharides, proteins, and hydrocarbon-like
products, respectively.
4.2.6 Granular porous medium preparation
The filtration system consisted of acrylic columns with an internal diameter of 3.175
cm, and a length of 14 cm. The packing material was spherical glass beads (MO-SCI
Specialty Products, LLC., MO) with an average diameter of 550 μm and a specific
gravity of 2.45 g/cm3. Columns were uniformly dry-packed to the height of 14 cm with
vibration. The column porosity was estimated to be 0.4 using the standard gravimetric
method. Prior to column assemblage, glass beads were thoroughly cleaned following a
method reported previously (Li et al. 2006). Specifically, the glass beads were first
washed with ultrapure water (Milli-Q water, Millipore Corp., MA), then ultrasonicated in
0.01 M NaOH for 15 min followed by repeating ultrasonication in ultrapure water until
rinsed solution become transparent, then were ultrasonicated in 1 M HNO3 for 20 min,
with final rinse with ultrapure water. The cleaned glass beads were then autoclaved and
oven-dried at 80 °C. For the anaerobic experiments, the columns were packed in the
anaerobic chamber, and stored in the anaerobic chamber for at least 1 week after
assemblage to remove all traces of oxygen before performing column experiments.
4.2.7 Transport experiments in packed-bed columns
A peristaltic pump (Cole Parmer, IL) was used to pump the solutions in an up-flow
direction. Prior to each experiment, the columns were equilibrated by injecting at least 6
pore volumes of background NaCl solution. After reaching equilibrium, approximately 4
pore volumes of cell suspension were injected into the column, followed by 5 pore
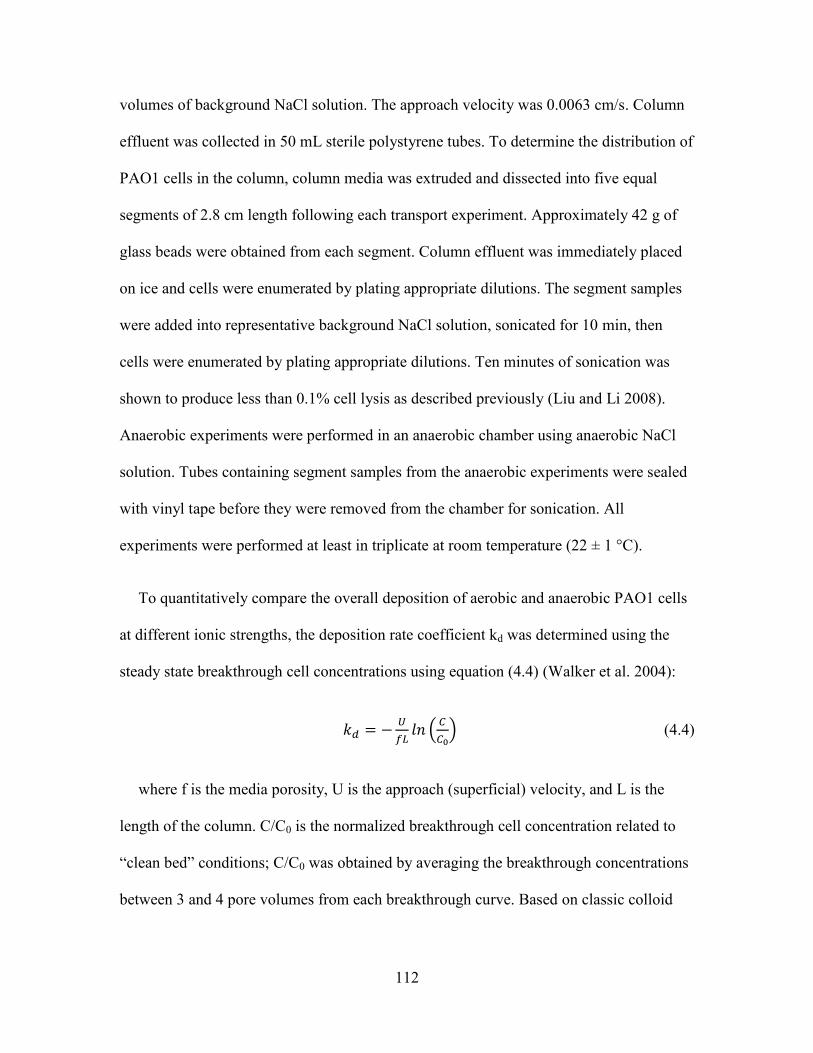
112
volumes of background NaCl solution. The approach velocity was 0.0063 cm/s. Column
effluent was collected in 50 mL sterile polystyrene tubes. To determine the distribution of
PAO1 cells in the column, column media was extruded and dissected into five equal
segments of 2.8 cm length following each transport experiment. Approximately 42 g of
glass beads were obtained from each segment. Column effluent was immediately placed
on ice and cells were enumerated by plating appropriate dilutions. The segment samples
were added into representative background NaCl solution, sonicated for 10 min, then
cells were enumerated by plating appropriate dilutions. Ten minutes of sonication was
shown to produce less than 0.1% cell lysis as described previously (Liu and Li 2008).
Anaerobic experiments were performed in an anaerobic chamber using anaerobic NaCl
solution. Tubes containing segment samples from the anaerobic experiments were sealed
with vinyl tape before they were removed from the chamber for sonication. All
experiments were performed at least in triplicate at room temperature (22 ± 1 °C).
To quantitatively compare the overall deposition of aerobic and anaerobic PAO1 cells
at different ionic strengths, the deposition rate coefficient kd was determined using the
steady state breakthrough cell concentrations using equation (4.4) (Walker et al. 2004):
(4.4)
where f is the media porosity, U is the approach (superficial) velocity, and L is the
length of the column. C/C0 is the normalized breakthrough cell concentration related to
“clean bed” conditions; C/C0 was obtained by averaging the breakthrough concentrations
between 3 and 4 pore volumes from each breakthrough curve. Based on classic colloid

113
filtration theory, the theoretical particle deposition pattern S(X) in the packed column can
be determined using equation (4.5) (Tufenkji et al. 2003):
(4.5)
where S(X) is the particle deposition pattern, i.e., the number of deposited cells per
mass of the granular collector, X is the column depth, ρb is the porous media bulk density,
and t0 is the duration of the continuous particle injection.
4.2.8 Bacterial enumeration procedures
Viable bacterial cell counts were obtained using the drop plate method (Ellery and
Schleyer 1984). A series of 10-fold dilutions was performed and 10 μL of each dilution
was plated on LB agar plates (aerobic) or LB agar plates amended with 5 mM NaNO3
(anaerobic) in triplicate. In aerobic experiments, plates were incubated at 37 °C for 20 h
before counting. In anaerobic experiments, cells were plated and stored in the anaerobic
chamber at room temperature for 2 days (early stationary phase, data not shown) before
counting. The lower limit of this detection method is 102 CFU/mL. To guarantee the
sterile condition, anaerobic LB agar plates were prepared in the sterile biosafety hood and
stored in the anaerobic chamber for at least one week before use (Borriello et al. 2004).
4.2.9 Statistical analysis
Electrokinetic potentials and breakthrough concentrations were analyzed with a single
factor analysis of variance (ANOVA) and reported as p-values. ANOVA was performed
using Microsoft Excel software; a p-value smaller than 0.05 suggests that the difference
was statistically significant.

114
4.3 Results and discussion
4.3.1 Electrokinetic potential of bacterial cells
The zeta potentials of P. aeruginosa PAO1 are presented in Figure 4.1. The results
indicated that under both aerobic and anaerobic conditions, PAO1 bacteria were
negatively charged over the range of ionic strengths (1, 10, and 100 mM) and pH
conditions (6.3-6.6) tested. Under both conditions, the absolute magnitude of the cell zeta
potentials decreased with an increase in NaCl concentration, as expected from
compression of the electrostatic double layer. Differences in the bacterial zeta potential
between aerobic and anaerobic conditions were not significant (p > 0.05). The zeta
potentials of the glass beads indicated that the glass beads were more negatively charged
than the PAO1 cells under all ionic strengths tested.
Figure 4.1 Surface zeta potentials of P. aeruginosa PAO1, and glass beads as a function
of solution chemistry. Ionic strengths: 1 mM, 10 mM, 100 mM NaCl solution. Error bars
represent standard deviations of three measurements.
-70
-60
-50
-40
-30
-20
-10
0
1 10 100
Zet
a P
ote
nti
al
(mV
)
Ionic Strength (mM)
PAO1 (Aerobic)
PAO1 (Anaerobic)
Glass Beads (Aerobic)
Glass Beads (Anaerobic)

115
4.3.2 Column transport experiments
Figure 4.2 presents the bacterial breakthrough curves showing the normalized effluent
concentration, C/C0, during the injection and elution of P. aeruginosa cells under aerobic
(A) and anaerobic (B) conditions. Under both conditions, the injected bacteria were
detected in the column effluent within one pore volume. Effluent concentrations of PAO1
cells increased gradually with the injection of cell suspension. Relatively constant
breakthrough plateaus were reached after three pore volumes’ injection and remained
relatively steady until switching to cell-free solutions after injecting four pore volumes at
all three ionic strengths. The magnitude of the steady-state breakthrough plateau was
highest at 1 mM ionic strength, and decreased with an increase in salt concentration. At
10 and 100 mM ionic strength, PAO1 anaerobic breakthrough concentrations were
significantly higher than aerobic breakthrough concentrations (p < 0.05), indicating that
fewer PAO1 cells were retained in the columns under the anaerobic condition. However,
at the lowest ionic strength (1 mM), anaerobic and aerobic breakthrough concentrations
were the same (C/C0 ≈ 0.9) (p > 0.05). The fact that the change in magnitude of the
breakthrough concentrations of anaerobic PAO1 cells among different ionic strength was
less than that of aerobic PAO1 cells suggested that aerobic PAO1 cells were more
sensitive than anaerobic PAO1 cells to solution ionic strength changes.

116
Figure 4.2 Breakthrough curves of P. aeruginosa PAO1 under three solution ionic
strengths: 1 mM, 10 mM, and 100 mM NaCl, under aerobic (A) and anaerobic (B)
conditions. Error bars represent standard deviations of three measurements.
During elution, PAO1 tailings were observed in the aerobic columns over the three
ionic strengths. The magnitude of PAO1 tailings increased with an increase in ionic
strength, with the most significant tailings observed at 100 mM ionic strength. However,
PAO1 tailings in anaerobic columns were not obvious. It is likely that tailings were
caused by the detachment of previously attached bacteria (Zhang et al. 2001). The
solution pH of the influent and effluent were measured and remained in the range of 6.3-
6.6 throughout the experimental process.
0
0.2
0.4
0.6
0.8
1
0 3 6 9
C/C
0
Pore Volume
1 mM 10 mM 100 mM
0
0.2
0.4
0.6
0.8
1
0 3 6 9
C/C
0
Pove Volume
1mM 10 mM 100 mM
A B
117
Figure 4.3 Comparison of deposition rate coefficient (kd) under aerobic and anaerobic
conditions determined from the breakthrough under various solution chemistry. Error
bars represent standard deviations of three measurements.
As shown in Figure 4.3, the deposition rate coefficients increased at higher ionic
strengths under both aerobic and anaerobic conditions. This is in qualitative agreement
with the prediction of DLVO theory, which posits that increasing the ionic strength
reduces the electrostatic double layer repulsion between negatively charged cells and
glass beads. PAO1 cells in aerobic and anaerobic conditions showed different deposition
rate coefficients when ionic strengths were 10 mM and 100 mM (p < 0.05), with the
aerobic PAO1 having higher deposition rates. However, deposition rate coefficients of
aerobic and anaerobic PAO1 cells at 1 mM were not statistically different (p > 0.05). The
deposition rate coefficients results were consistent with the breakthrough concentrations
analysis.
0
0.0002
0.0004
0.0006
0.0008
0.001
1 10 100
Kd (
1/s
)
Ionic Strength (mM)
PAO1 (Aerobic)
PAO1 (Anaerobic)

118
4.3.3 Profiles of retained bacterial cells
Figure 4.4. Measured retained PAO1 cell concentration profiles in single 14 cm column
under aerobic (A1-A3), and anaerobic (B1-B3) conditions. The ionic strengths for the
carrying solutions are as follows: 1 mM NaCl (A1, B1); 10 mM NaCl (A2, B2); and 100
mM NaCl (A3, B3). Dashed lines represent predictions based on the classic colloid
filtration theory (CFT) using deposition rate coefficient (kd). Data were presented in a
semilog format. Error bars represent standard deviations of three measurements.
0.001
0.01
0.1
1
10
0 2.8 5.6 8.4 11.2 14
S(X
)/C
0 (
cm
3/g
bea
ds)
X (cm)
1mM (Aerobic)
0.001
0.01
0.1
1
10
0 2.8 5.6 8.4 11.2 14
S(X
)/C
0 (
cm
3/g
bea
ds)
X (cm)
1mM (Anaerobic)
0.001
0.01
0.1
1
10
0 2.8 5.6 8.4 11.2 14
S(X
)/C
0 (
cm
3/g
bea
ds)
X (cm)
10mM (Aerobic)
0.001
0.01
0.1
1
10
0 2.8 5.6 8.4 11.2 14
S(X
)/C
0 (
cm
3/g
bea
ds)
X (cm)
10 mM (Anaerobic)
0.001
0.01
0.1
1
10
0 2.8 5.6 8.4 11.2 14
S(X
)/C
0 (
cm
3/g
bea
ds)
X (cm)
100mM (Aerobic)
0.001
0.01
0.1
1
10
0 2.8 5.6 8.4 11.2 14
S(X
)/C
0 (
cm
3/g
bea
ds)
X (cm)
100mM (Anaerobic)
A1 B1
A2 B2
A3 B3

119
Figure 4.4 compares the retained bacterial profiles obtained by plotting the number of
bacteria recovered from glass beads as a function of travelled distance and those to be
recovered from the classic colloid filtration theory. The magnitudes of retained profiles
for anaerobic and aerobic PAO1 cells under three examined ionic strengths varied
contrarily with the breakthrough plateaus, in agreement with the mass balance
consideration, which indicated that the increase of ionic strength introduced greater cell
retention in the porous media. Further inspection of Figure 4.4 indicated that the retained
bacterial concentrations decreased hyperexponentially, indicating that the deposition rate
coefficients decreased with increasing travel distance in both aerobic and anaerobic
conditions. Since a spatially constant deposition rate coefficient could yield a log-linear
retained bacterial profile, the hyperexponential profiles were demonstrated by
comparison to log-linear profiles developed using the deposition rate coefficients
calculated from equation 4.4. However, the discrepancy was less distinct at 100 mM for
both aerobic and anaerobic experiments. This observation was consistent with what Li et
al. (Li et al. 2004) had reported previously. According to Li et al. (2004), the observed
colloidal deposition profiles were much steeper than the expected profiles based on a
constant deposition rate coefficient in porous media with travel distance were greatest at
highly unfavorable conditions (low ionic strength). This indicated that the deposition rate
coefficient decreased with travel distance, as shown in our deposition profiles at lower
ionic strength. They further concluded that when solution ionic strength increased, this
deviation in the deposition profile from log-linear decreases with distance was reduced
and eventually eliminated under favorable conditions as the deposition profiles fell into
the expected log-linear profiles based on a constant rate. Furthermore, the

120
hyperexponential decreases were also possibly driven by the biocolloid population
heterogeneity (Tong and Johnson 2007) and steric repulsion due to surface polymers
(Tong et al. 2005). Tong and Johnson (2007) demonstrated that colloid surface
heterogeneity, such as variations in electrophoretic mobilities among individuals within a
population, may lead to a distribution of deposition rate coefficients among the colloid
population. They observed that the fast-depositing (sticky) fraction of the colloid
population with less electrophoretic mobilities was removed in the up-gradient column
and further concluded that this hyperexponential deposition in the inlet did not happen
preferentially due to deposition in the secondary energy minimum. Therefore, it was
possible that the stickier PAO1 cells were mostly retained in the up-gradient column
where less deposition happened in the down-gradient column, leading to a
hyperexponential deposition profile. Additionally, a reasonable mass balance (76–97%)
was achieved in the column experiments (Table 4.1).
Table 4.1 Cell recovery percentage from column experiments
Ionic strength (mM)
1 10 100
Aerobic 84.8±1.0% 79.8±4.2% 74.8±1.9%
Anaerobic 93.6±6.2 97.4±6.9% 92.5±2.1%
Consider the PAO1 retention profiles and the breakthrough curves, it can be concluded
that PAO1 showed higher deposition concentrations on glass bead surfaces in the aerobic
condition than in the anaerobic condition. Our results were consistent with those of Sabra
et al. (2003) who studied bacterial adhesion on glass tubes. They showed that PAO1

121
statically grown at higher oxygen concentrations had an increased capacity to adhere to
hydrophilic glass tube surfaces, and concluded that the increased adhesion was mainly
caused by the oxygen-dependent alterations in cell-surface components (B-band
lipopolysaccharides). B-band lipopolysaccharides, which are considered necessary for
initial bacterial attachment to hydrophilic surfaces, are high molecular weight serotype-
specific lipopolysaccharides produced by P. aeruginosa; they consist of two uronic acid
deviates and one N-acetylfucosamine residue, and are barely expressed in cells grown in
a dissolved oxygen tension lower than 3% of air saturation (Makin and Beveridge 1996,
Sabra et al. 2003). Under the experimental anaerobic condition, PAO1 likely diminished
the expression of B-band LPS, which consequently led to reduced adhesion.
4.3.4 Extracted EPS compositions
The composition of the extracted aerobic PAO1 EPS was significantly different from
that of the anaerobic EPS. Both protein and polysaccharides contents were much higher
in PAO1 cultivated anaerobically (14.96 ± 0.27 µg/109 cells and 53.46 ± 4.05 µg/10
9 cells,
respectively) than in PAO1 cultivated aerobically (12.48 ± 0.08 µg/109 cells and 43.28 ±
2.10 µg/109 cells, respectively) (p < 0.05). In general, polysaccharides concentrations
were higher than protein concentrations. Although it was reported previously that
polysaccharides and proteins enhanced cell deposition (Gomez-Suarez et al. 2002), it is
not likely applicable in our experiments for the following reason, discussed below.
The impact of EPS on cell adhesion depends on the specific components of the EPS
and the experimental system (Liu et al. 2007). The EPS matrix generally consists of a
mixture of macromolecules such as proteins, polysaccharides, nucleic acids, lipids, and

122
other polymeric compounds. Even though the EPS functions as an initial adhesive, the
extent of this function was still unclear due to the various compositions among organisms
(Hwang et al. 2012, Liu et al. 2007). Liu et al. (2007) discovered that the presence of EPS
significantly increased the PAO1 adhesion in comparison to an EPS deficient PAO1
strain over a wide range of ionic strength (1.65–165 mM phosphate buffered saline).
However, Hwang et al. (2012) examined the adhesion of P. aeruginosa and B. cepacia on
glass slides coated with EPS extracted from the two bacteria, and observed a general
trend of hindered adhesion of B. cepacia onto glass slides coated with both types of EPS
throughout the ionic strengths tested (1, 10, 100 mM KCl); but a reduced adhesion of P.
aeruginosa on the coated glass slides was only observed at high ionic strength (100 mM
KCl). In our attempt to discover the EPS composition in aerobic and anaerobic PAO1,
bovine serum albumin and glucose were selected as the standards for protein and
polysaccharides, respectively, and only concentrations of protein and polysaccharides
were measured. Even though the colorimetric methods are well established and widely
used (Haznedaroglu et al. 2009, Hwang et al. 2012, Liu et al. 2007), limitations exist
(Dubois et al. 1956, Lowry et al. 1951). The protein and polysaccharides content might
not be a comprehensive representation of the complex EPS matrix. It is possible that
other macromolecules in the EPS matrix also interacted with the glass bead surfaces,
leading to a reduced deposition of anaerobic PAO1 in the column porous media.
4.3.5 Bacterial surface elements
Table 4.2 shows the elemental composition of the bacterial surface that resulted from
integrating C1s, O1s, and N1s peaks from the XPS scan of the spectrum and the ratios of
N/C and O/C (spectra not shown). The N/C and O/C ratios were 0.14 and 0.37,

123
respectively under anaerobic conditions, while under aerobic conditions, the N/C and O/C
ratios were 0.10 and 0.36, respectively. The variations may be caused by the fact that the
anaerobic PAO1 were grown in a 5% H2, 5% CO2, 90% N2 atmosphere instead of in
ambient air (~ 20% O2, 80% N2). Denyer et al. (1990) observed similar results when
growing Staphylococcus epidermidis. The N/C and O/C ratios (0.190 and 0.428) of
Staphylococcus epidermidis strains grown in 5% CO2/95% air atmosphere were higher
than N/C and O/C ratios (0.161 and 0.359) of Staphylococcus epidermidis grown in air,
and they noticed reduced bacterial colonization on polystyrene surfaces in the presence of
higher N/C and O/C ratios (Denyer et al. 1990, van der Mei et al. 2000). This was
consistent with our results, as fewer PAO1 cells were retained in the column under the
anaerobic condition (Figure 2). Additionally, the N/C ratio is also related to the amount
of protein presented on the cell surface (Hwang et al. 2012). The higher N/C ratio in the
anaerobic PAO1 cells coincided with the higher protein concentration in anaerobic PAO1
EPS extract.
Table 4.2 The percentage elemental composition (atomic concentration %), ratio of N/C
and O/C, proportion of carbon associated with three classes of molecular constituents
(proteins, polysaccharides, and hydrocarbon-like products), and the weight fractions of
each constituent for the bacterial cell surface
Proportion Weight fraction
%C %N %O N/C O/C CPR/C CPS/C CHC/C CPR CPS CHC
Aerobic 68.41 7.07 24.52 0.10 0.36 0.37 0.29 0.34 0.40 0.37 0.23
Anaerobic 66.10 9.45 24.45 0.14 0.37 0.51 0.23 0.26 0.54 0.29 0.17
Note: The sum of atomic concentrations of O, C, and N for each sample was scaled to 100%.

124
Table 4.2 also shows the proportion of carbon associated with the three classes of
molecular constituents (proteins, polysaccharides, and hydrocarbon-like products) on
bacterial surfaces. Hydrocarbon-like products include phospholipids, glycolipids, and
other lipid compounds. Phospholipids and glycolipids are the major components of
membrane lipids and extracellular lipids, respectively (Haferburg et al. 1986). Solving
equations (4.1-4.3) gave the proportions of carbon in each of the molecular constituents.
Dividing this proportion by the carbon concentration in the constituent gave the weight
fraction of the constituent in the total concentration of carbon in the sample. In this case,
the carbon concentrations were 43.5, 37.0, and 71.4 mmol/g for proteins, polysaccharides,
and hydrocarbon-like products, respectively (Shapiro and Dworkin 1997). As shown in
Table 4.2, the anaerobic PAO1 cells had a higher protein weight fraction, and lower
weight fractions of polysaccharides and hydrocarbon-like products than aerobic PAO1
cells. The predominant constituent of PAO1 under both conditions was protein, followed
by polysaccharides, and hydrocarbon-like products. These results complement the EPS
analysis. The EPS analysis measured the protein and polysaccharides of the extractable
bacterial surface polymer, whereas the XPS analysis provides information on the overall
cell surface characteristics. In addition to the EPS, other cell surface components such as
LPS are analyzed by the XPS measurement. Therefore, the XPS results provide a more
detailed analysis of the overall cell surface properties.
4.3.6 Interpretation using DLVO theory
Theoretical interaction energy profiles predicted using the DLVO theory for the
bacterium-glass bead system are presented in Figure 4.5 at the different solution
conditions tested in the transport experiments under both aerobic and anaerobic

125
conditions. The calculations revealed the presence of a significant repulsive energy
barrier for deposition at all ionic strengths, ranging from 1440 kT at 1 mM to 755 and
109 kT at 10 and 100 mM, respectively, in the aerobic condition, and 1110 kT at 1 mM to
692 and 60.4 kT at 10 and 100 mM, respectively, in the anaerobic condition. The
theoretical predictions that PAO1 experienced the highest energy barriers to attachment at
1 mM ionic strength in aerobic and anaerobic conditions coincide with the experimental
results that much higher breakthrough concentrations (C/C0 ≈ 0.90) were observed at 1
mM ionic strength than at 10 mM and 100 mM ionic strength, where relatively smaller
energy barriers were predicted. Therefore, at 1 mM ionic strength, PAO1 travelled the
longest distance and the pathogen had the most negative zeta potential.
Figure 4.5 Calculated DLVO interaction energy plotted as a function of separation
distance for different solution ionic strengths: 1 mM, 10 mM, and 100 mM under aerobic
(A) and anaerobic (B) conditions; and (insets) the expanded drawing to highlight the
secondary energy minimum. Experimentally measured zeta potentials (Figure 4.1) and a
Hamaker constant of 4.16 × 10⁻²¹
J were used to calculate interaction energies.
-500
0
500
1000
1500
0 20 40 60 80
Inte
ract
ion
En
erg
y (
kT
)
Separation Distance (nm)
1 mM 10 mM 100 mM
-500
0
500
1000
1500
0 20 40 60 80
Inte
ract
ion
En
erg
y (
kT
)
Separation Distance (nm)
1 mM 10 mM 100 mM
-8
-6
-4
-2
0
2
0 20 40 60 80 100 120 140
-8
-6
-4
-2
0
2
0 20 40 60 80 100 120 140
A B

126
A replot of the DLVO interaction energy profiles on a different scale presented a
secondary energy well at a greater separation distance from the collector grain surface
than that of the repulsive energy barrier. The depths of the secondary minimum for the
PAO1 bacterium-glass bead interaction increased from 0.0294 kT at 1 mM to 0.43 kT
and 6.55 kT at 10 mM and 100 mM (aerobic), respectively, and 0.0283 kT at 1 mM to
0.407 kT and 6.58 kT at 10 mM and 100 mM (anaerobic), respectively. The location of
the secondary energy wells got closer to the collector surface with respect to a
corresponding separation distance of 128.5-5.25 nm, and 125.5-5 nm in aerobic and
anaerobic conditions, respectively. It was noticed that despite different growth and
experiment conditions, the PAO1 cells had similar profiles of secondary energy wells
under aerobic and anaerobic conditions. The increased secondary energy minimum might
be responsible for the increased retention at higher ionic strength in the column porous
media, because more PAO1 cells could be trapped in the deeper secondary energy wells
when approaching the collector surfaces at higher ionic strength (100 mM). When
comparing the experimental deposition profiles, it was clear that in the aerobic condition,
PAO1 had a significantly higher deposited concentration in the porous media at 10 and
100 mM than in the anaerobic condition. The higher energy barrier and slightly higher/or
similar secondary minimum in the aerobic condition however suggested that it would
have less deposition concentration in the porous media than that in the anaerobic
condition, which do not agree with the experimental results. The above discussion
suggested that DLVO forces might not be the only interaction that play a role in the
attachment of bacterial to collector beads at relatively high ionic strength (10 and 100
mM). Particularly, at 10 and 100 mM, the electrical double layer repulsion has been

127
significantly compressed (Chen and Walker 2012). Possible contributions to the cell
attachment include the surface heterogeneity as recently reported by Pazmino et al.
(2014). In addition, the attachment would be due to some specific interaction between
cell surface polymers such as EPS and LPS, and glass beads. The surface composition
characterization suggested that the cells in the aerobic condition was slightly less
hydrophilic (with less N/C and O/C), suggesting that it might have weaker steric
interactions between the hydrophilic surface polymers and the beads than those in the
anaerobic condition (Liu 2013, Lu et al. 2011, Pradier et al. 2005).
4.4 Conclusions
We have studied the deposition behavior of P. aeruginosa PAO1 in granular porous
media and analyzed PAO1 cell surface properties under aerobic and anaerobic conditions.
To our knowledge, the effects of oxygen tension during growth and transport of P.
aeruginosa PAO1 in granular porous media have not been previously reported. PAO1
showed distinctly different transport and deposition behaviors when grown and travelling
in respective anaerobic and aerobic conditions. Specifically, at higher solution ionic
strengths (10 and 100 mM), aerobic PAO1 showed significantly higher retention in the
porous media and travelled less distance than anaerobic PAO1. However, at low solution
ionic strength (1 mM), differences in retention and travel distance were not observed.
Significant variation in cell surface electrokinetic potentials was not observed in
PAO1 between anaerobic and aerobic conditions. DLVO theory predicted higher energy
barrier and slightly higher/or similar secondary minimum in the aerobic condition than in
the anaerobic condition, suggested a less deposition in the porous media in aerobic
condition, which did not agree with the experimental results. Analysis of cell surface

128
composition using XPS revealed variations in constituents, as presented in the form of
N/C and O/C ratios of the bacterial cell surface when cells were grown at different DO
levels. Cell surface variations in the N/C and O/C ratios were believed have contributed
to the different levels of deposition, as higher disposition was observed in anaerobic
condition with higher N/C and O/C ratios. It was believed that DLVO forces might not be
the only interaction that played a role in the attachment of bacteria to collector beads,
interactions between cell surface polymers and glass bead surfaces were most likely
involved. The increase in PAO1 deposition with increasing ionic strength under both
aerobic and anaerobic conditions is thought to be due to compression of the electrostatic
double layer.
129
References
Alonso, A., Rojo, F. and Martinez, J.L. (1999) Environmental and clinical isolates of
Pseudomonas aeruginosa show pathogenic and biodegradative properties
irrespective of their origin. Environmental Microbiology 1(5), 421-430.
Borriello, G., Werner, E., Roe, F., Kim, A.M., Ehrlich, G.D. and Stewart, P.S. (2004)
Oxygen limitation contributes to antibiotic tolerance of Pseudomonas aeruginosa in
biofilms. Antimicrobial Agents and Chemotherapy 48(7), 2659-2664.
Camesano, T.A. and Logan, B.E. (1998) Influence of fluid velocity and cell concentration
on the transport of motile and nonmotile bacteria in porous media. Environmental
Science & Technology 32(11), 1699-1708.
Castro, F.D. and Tufenkji, N. (2008) Role of oxygen tension on the transport and
retention of two pathogenic bacteria in saturated porous media. Environmental
Science & Technology 42(24), 9178-9183.
Chen, G. and Walker, S.L. (2012) Fecal indicator bacteria transport and deposition in
saturated and unsaturated porous media. Environmental Science & Technology
46(16), 8782-8790.
de Kerchove, A.J. and Elimelech, M. (2007) Impact of alginate conditioning film on
deposition kinetics of motile and nonmotile Pseudomonas aeruginosa strains.
Applied and Environmental Microbiology 73(16), 5227-5234.

130
De Kerchove, A.J. and Elimelech, M. (2008) Bacterial swimming motility enhances cell
deposition and surface coverage. Environmental Science & Technology 42(12),
4371-4377.
de Kievit, T.R. and Iglewski, B.H. (2000) Bacterial quorum sensing in pathogenic
relationships. Infection and Immunity 68(9), 4839-4849.
Denyer, S.P., Davies, M.C., Evans, J.A., Finch, R.G., Smith, D.G.E., Wilcox, M.H. and
Williams, P. (1990) Influence of carbon-dioxide on the surface characteristics and
adherence potential of coagulase-negative staphylococci. Journal of Clinical
Microbiology 28(8), 1813-1817.
Dubois, M., Gilles, K.A., Hamilton, J.K., Rebers, P.A. and Smith, F. (1956) Colorimetric
method for determination of sugars and related substances. Analytical Chemistry
28(3), 350-356.
Ellery, W.N. and Schleyer, M.H. (1984) Comparison of homogenization and
ultrasonication as techniques in extracting attached sedimentary bacteria. Marine
Ecology Progress Series 15(3), 247-250.
Frolund, B., Griebe, T. and Nielsen, P.H. (1995) Enzymatic-activity in the activated-
sludge floc matrix. Applied Microbiology and Biotechnology 43(4), 755-761.
Gomez-Suarez, C., Pasma, J., van der Borden, A.J., Wingender, J., Flemming, H.C.,
Busscher, H.J. and van der Mei, H.C. (2002) Influence of extracellular polymeric
substances on deposition and redeposition of Pseudomonas aeruginosa to surfaces.
Microbiology-Sgm 148, 1161-1169.

131
Haferburg, D., Hommel, R., Claus, R. and Kleber, H.P. (1986) Extracellular microbial
lipids as biosurfactants. In Bioproducts, Fiechter, A. (ed), pp. 53-93.
Haznedaroglu, B.Z., Kim, H.N., Bradford, S.A. and Walker, S.L. (2009) Relative
transport behavior of Escherichia coli O157:H7 and Salmonella enterica serovar
pullorum in packed bed column systems: Influence of solution chemistry and cell
concentration. Environmental Science & Technology 43(6), 1838-1844.
Hwang, G., Kang, S., El-Din, M.G. and Liu, Y. (2012) Impact of an extracellular
polymeric substance (EPS) precoating on the initial adhesion of Burkholderia
cepacia and Pseudomonas aeruginosa. Biofouling 28(6), 525-538.
Karamalidis, A., Evangelou, A., Karabika, E., Koukkou, A., Drainas, C. and Voudrias, E.
(2010) Laboratory scale bioremediation of petroleum-contaminated soil by
indigenous microorganisms and added Pseudomonas aeruginosa strain Spet.
Bioresource Technology 101(16), 6545-6552.
Kim, H.N., Bradford, S.A. and Walker, S.L. (2009) Escherichia coli O157:H7 transport
in saturated porous Media: Role of solution chemistry and surface macromolecules.
Environmental Science & Technology 43(12), 4340-4347.
Landini, P. and Zehnder, A.J. (2002) The global regulatory hns gene negatively affects
adhesion to solid surfaces by anaerobically grown Escherichia coli by modulating
expression of flagellar genes and lipopolysaccharide production. Journal of
Bacteriology 184(6), 1522-1529.

132
Li, J., McLellan, S. and Ogawa, S. (2006) Accumulation and fate of green fluorescent
labeled Escherichia coli in laboratory-scale drinking water biofilters. Water
Research 40(16), 3023-3028.
Li, X.Q., Scheibe, T.D. and Johnson, W.P. (2004) Apparent decreases in colloid
deposition rate coefficients with distance of transport under unfavorable deposition
conditions: A general phenomenon. Environmental Science & Technology 38(21),
5616-5625.
Liu, Y. (2013) Polymer Adhesion, Friction, and Lubrication, pp. 575-616, John Wiley &
Sons, Inc.
Liu, Y. and Li, J. (2008) Role of Pseudomonas aeruginosa biofilm in the initial adhesion,
growth and detachment of Escherichia coli in porous media. Environmental
Science & Technology 42(2), 443-449.
Liu, Y., Yang, C.-H. and Li, J. (2007) Influence of extracellular polymeric substances on
Pseudomonas aeruginosa transport and deposition profiles in porous media.
Environmental Science & Technology 41(1), 198-205.
Lowry, O.H., Rosebrough, N.J., Farr, A.L. and Randall, R.J. (1951) Protein measurement
with the folin phenol reagent. Journal of Biological Chemistry 193(1), 265-275.
Lu, Q., Wang, J., Faghihnejad, A., Zeng, H. and Liu, Y. (2011) Understanding the
molecular interactions of lipopolysaccharides during E. coli initial adhesion with a
surface forces apparatus. Soft Matter 7(19), 9366-9379.

133
Makin, S.A. and Beveridge, A.J. (1996) Pseudomonas aeruginosa PAO1 ceases to
express serotype-specific lipopolysaccharide at 45 degrees oC. Journal of
Bacteriology 178(11), 3350-3352.
Marcus, I.M., Herzberg, M., Walker, S.L. and Freger, V. (2012) Pseudomonas
aeruginosa attachment on QCM-D sensors: The role of cell and surface
hydrophobicities. Langmuir 28(15), 6396-6402.
Martin, R.E., Bouwer, E.J. and Hanna, L.M. (1992) Application of clean-bed filtration
theory to bacterial deposition in porous-media. Environmental Science &
Technology 26(5), 1053-1058.
McCaulou, D.R., Bales, R.C. and Arnold, R.G. (1995) Effect of temperature-controlled
motility on transport of bacteria and microspheres through saturated sediment.
Water Resources Research 31(2), 271-280.
Palmer, K.L., Brown, S.A. and Whiteley, M. (2007) Membrane-bound nitrate reductase is
required for anaerobic growth in cystic fibrosis sputum. Journal of Bacteriology
189(12), 4449-4455.
Parsek, M.R. and Fuqua, C. (2004) Biofilms 2003: Emerging themes and challenges in
studies of surface-associated microbial life. Journal of Bacteriology 186(14), 4427-
4440.
Pazmino, E., Trauscht, J., Dame, B. and Johnson, W.P. (2014) Power law size-distributed
heterogeneity explains colloid retention on soda lime glass in the presence of
energy barriers. Langmuir 30(19), 5412-5421.
134
Pradier, C.M., Rubio, C., Poleunis, C., Bertrand, P., Marcus, P. and Compere, C. (2005)
Surface characterization of three marine bacterial strains by Fourier transform IR,
X-ray photoelectron spectroscopy, and time-of-flight secondary-ion mass
spectrometry, correlation with adhesion on stainless steel surfaces. Journal of
Physical Chemistry B 109(19), 9540-9549.
Sabra, W., Lunsdorf, H. and Zeng, A.P. (2003) Alterations in the formation of
lipopolysaccharide and membrane vesicles on the surface of Pseudomonas
aeruginosa PAO1 under oxygen stress conditions. Microbiology-Sgm 149, 2789-
2795.
Schobert, M. and Jahn, D. (2010) Anaerobic physiology of Pseudomonas aeruginosa in
the cystic fibrosis lung. International Journal of Medical Microbiology 300(8), 549-
556.
Shapiro, J.A. and Dworkin, M. (1997) Bacteria as Multicellular Organisms, Oxford
University Press Oxford, UK.
Simoni, S.F., Bosma, T.N.P., Harms, H. and Zehnder, A.J.B. (2000) Bivalent cations
increase both the subpopulation of adhering bacteria and their adhesion efficiency
in sand columns. Environmental Science & Technology 34(6), 1011-1017.
Singh, P.K., Schaefer, A.L., Parsek, M.R., Moninger, T.O., Welsh, M.J. and Greenberg,
E.P. (2000) Quorum-sensing signals indicate that cystic fibrosis lungs are infected
with bacterial biofilms. Nature 407(6805), 762-764.
135
Steffan, R.J., Sperry, K.L., Walsh, M.T., Vainberg, S. and Condee, C.W. (1999) Field-
scale evaluation of in situ bioaugmentation for remediation of chlorinated solvents
in groundwater. Environmental Science & Technology 33(16), 2771-2781.
Tong, M. and Johnson, W.P. (2007) Colloid population heterogeneity drives
hyperexponential deviation from classic filtration theory. Environmental Science &
Technology 41(2), 493-499.
Tong, M.P., Camesano, T.A. and Johnson, W.P. (2005) Spatial variation in deposition
rate coefficients of an adhesion-deficient bacterial strain in quartz sand.
Environmental Science & Technology 39(10), 3679-3687.
Tufenkji, N., Redman, J.A. and Elimelech, M. (2003) Interpreting deposition patterns of
microbial particles in laboratory-scale column experiments. Environmental Science
& Technology 37(3), 616-623.
Tufenkji, N., Ryan, J.N. and Elimelech, M. (2002) The promise of bank filtration.
Environmental Science & Technology 36(21), 422A-428A.
van der Mei, H.C., de Vries, J. and Busscher, H.J. (2000) X-ray photoelectron
spectroscopy for the study of microbial cell surfaces. Surface Science Reports
39(1), 1-24.
van Schie, P.M. and Fletcher, M. (1999) Adhesion of biodegradative anaerobic bacteria
to solid surfaces. Applied and Environmental Microbiology 65(11), 5082-5088.

136
Walker, S.L., Redman, J.A. and Elimelech, M. (2004) Role of cell surface
lipopolysaccharides in Escherichia coli K12 adhesion and transport. Langmuir
20(18), 7736-7746.
Williams, D.R., Rowe, J.J., Romero, P. and Eagon, R.G. (1978) Denitrifying
Pseudomonas aeruginosa: Some parameters of growth and active transport.
Applied and Environmental Microbiology 36(2), 257-263.
Yang, H.-H., Morrow, J.B., Grasso, D., Vinopal, R.T. and Smets, B.F. (2006) Intestinal
versus external growth conditions change the surficial properties in a collection of
environmental Escherichia coli isolates. Environmental Science & Technology
40(22), 6976-6982.
Yoon, S.S., Hennigan, R.F., Hilliard, G.M., Ochsner, U.A., Parvatiyar, K., Kamani, M.C.,
Allen, H.L., DeKievit, T.R., Gardner, P.R., Schwab, U., Rowe, J.J., Iglewski, B.H.,
McDermott, T.R., Mason, R.P., Wozniak, D.J., Hancock, R.E.W., Parsek, M.R.,
Noah, T.L., Boucher, R.C. and Hassett, D.J. (2002) Pseudomonas aeruginosa
anaerobic respiration in biofilms: Relationships to cystic fibrosis pathogenesis.
Developmental Cell 3(4), 593-603.
Zhang, P.F., Johnson, W.P., Scheibe, T.D., Choi, K.H., Dobbs, F.C. and Mailloux, B.J.
(2001) Extended tailing of bacteria following breakthrough at the narrow channel
focus area, Oyster, Virginia. Water Resources Research 37(11), 2687-2698.

137
Zhang, X.Q., Bishop, P.L. and Kinkle, B.K. (1999) Comparison of extraction methods for
quantifying extracellular polymers in biofilms. Water Science and Technology
39(7), 211-218.

138
Chapter 5. Filtration of Cryptosporidium Oocysts Surrogates in Porous
Media: Effects of Flow Rate, Alum, and Humic Acid*
*A version of this chapter has been submitted for journal publication.

139
5.1 Introduction
Cryptosporidium parvum is one of the disease-causing microbial contaminants
frequently found in surface waters, posing great health risk management challenges for
drinking water supplies. Outbreaks of cryptosporidiosis disease, a severe gastrointestinal
illness are often caused by the penetration of C. parvum oocysts through drinking water
treatment systems and are potentially fatal for people with compromised immune systems
(Gitis 2008). They are usually released into the environment via feces of infected host
organisms, and have unusual resistance to traditional disinfectants such as free chlorine
and chloramines due to their thick cell walls (Finch et al. 1993). The typical disinfectant
dosages and contact times used in practice are not as effective at inactivating C. parvum
oocysts (Dai and Hozalski 2003). Ozone is found to be a much more effective
disinfectant, but the formation of disinfection by-products bromate compounds is also a
great concern for bromide contaminated water. The widespread use of ultraviolet light
irradiation (UV), however, is limited due to the high operation price. Although the UV
irradiation is quite effective (Clancy et al. 2000).
The high resistance of Cryptosporidium to disinfection has led to a growing emphasis
on oocyst removal by filtration (Dai and Hozalski 2003). The filtration is considered as
the most critical barrier for Cryptosporidium removal in drinking water treatment plant.
Some of the reported filtration systems include granular filtration, riverbank filtration,
and slow sand filtration (Gottinger et al. 2013, Huck et al. 2002, Tufenkji et al. 2004).
However, utilization of Cryptosporidium has its own limitations. Firstly, the cultivation
and maintenance is not easy and the biohazard disposal requires very careful attention
(http://www.phac-aspc.gc.ca/lab-bio/res/psds-ftss/msds48e-eng.php). Secondly, viable

140
Cryptosporidium often poses high health concerns on research personnel and has
restricted access in some areas, which makes research using Cryptosporidium difficult.
For example, according to Public Health Agency of Canada, Cryptosporidium parvum is
classified as a Risk Group 2 pathogen and should be handled in facilities no lower than
Containment Level 2 (http://www.phac-aspc.gc.ca/lab-bio/res/psds-ftss/msds48e-
eng.php). Lastly, the surface characteristic of inactivated oocysts is often less well
defined and may not be representative of live oocysts (Pang et al. 2012).
Therefore, surrogates with well defined properties to mimic live Cryptosporidium
have been explored. The commonly used surrogates are microspheres (Dai and Hozalski
2003, Harvey et al. 2008, Tufenkji and Elimelech 2005a). Dai and Hozalski (2003)
compared the filtration of 5 µm carboxylated latex microspheres and oocysts through 550
µm spherical glass beads packed polycarbonate plastic column and obtained similar
removal efficiencies. They suggested that microspheres could be used as a conservative
surrogate of C. parvum oocysts in filters containing hydrophilic negatively charged filter
media. However, microspheres can potentially either over- or under-predict the transport
of C. parvum oocysts in aquifer due to the various surface properties of oocysts and
diverse characteristics of aquifers from site to site (Harvey et al. 2010). For example,
Tufenkji and Elimelech observed underestimated removal of microspheres in silica beads
(Tufenkji and Elimelech 2005a), but overestimated removal of the oocyst-sized
carboxylated polystyrene microspheres was observed by Harvey et al. in columns packed
with intact limestone cores (Harvey et al. 2008).
Since surface charge has the greatest effect on particle transport and retention (Harvey
et al. 1989), Pang et al. (2009) proposed that mimicking the surface charges of

141
microorganisms by modifying microspheres using protein that had similar surface charge
to Cryptosporidium could potentially provide better defined surrogates and more accurate
results (Pang et al. 2009). Later they showed that glycoprotein-coated microspheres best
resembled the filtration of oocysts in sand media in 1 mM NaCl solution in terms of
surface charge (Pang et al. 2012). However, further validation of these surrogates in
various environmental conditions is needed, and mechanisms involved in the fate and
transport process need to be explored. In addition, since these surrogates were prepared
only to mimic the surface charges of viable Cryptosporidium, limitations of these
surrogates such as surface hydrophobicity, still exist.
Besides surface charge, many factors can affect the particle removal in porous media,
such as grain size and shape (Bradford et al. 2007, Syngouna and Chrysikopoulos 2011),
flow velocity (Syngouna and Chrysikopoulos 2011), chemical treatment (Gross and
Logan 1995), natural organic matter (NOM) such as humic acid (HA) (Yang et al. 2012a),
particle size (Tufenkji and Elimelech 2005a). In water treatment, the varied flow rate is
perhaps one of the most often encountered situations during filtration process. Higher
flow velocity is shown to reduce the retardant and increase the transport of colloidal
particles in porous media through increased hydrodynamic force (Kim et al. 2010),
therefore leads to reduced removal of Cryptosporidium in the filter bed. Serving as the
most commonly used coagulant in water treatment, alum can effectively remove
suspended particles (58.1%) for the water purification, and increase the size of colloidal
particles to be settled by decreasing the stability of suspended particles and promoting the
formation of flocs (Karanis and Kimura 2002), which additionally increases the removal
in porous media (Yao et al. 1971).

142
Further, the raw water quality does not remain unchanged. In particular, natural
organic matter such as humic acid is ubiquitous in water supplies. When Cryptosporidium
enters the natural water systems, its surface properties can be altered by the adsorption of
negatively charged HA, and these changes could reduce the removal of Cryptosporidium
in filters (Hsu et al. 2001, Yang et al. 2012a). Additionally, HA in water can absorb onto
solid surfaces and hereby change the solid surface properties. It was found that HA
ubiquitous in water interacted with the divalent ion (Ca2+
) in a more complicated fashion
than when either of HA or Ca2+
is present and could either enhance or reduce particle
stability depending on the surface properties of particles and the relative concentrations
of divalent ions and humic acid (Chen and Elimelech 2007, Dong and Lo 2013, Liu et al.
2011). Therefore, it is hypothesized that the HA presenting in water would also interact
with alum and influence the removal of Cryptosporidium. However, experimental
validation for this hypothesis is required to examine if, how and to what extent HA could
affect the removal efficiency.
Therefore, it is important to examine the effects of flow rate, alum addition and HA
adsorption on collector surfaces on the fate and transport of Cryptosporidium in porous
media and explore the mechanisms involved in the deposition progress. The objective of
this study was to evaluate the filtration of the Cryptosporidium surrogates and verify the
applicability of the surrogates under effects commonly encountered in water treatment,
and explore the mechanisms involved in the transport and deposition process. The surface
properties of the surrogates were tested, and filtration experiments were performed in
different solution and hydrodynamic conditions broadly representing water treatment
conditions. The microsphere breakthrough curves and deposition profiles were

143
constructed. DLVO interaction energy was calculated to interpreting the deposition
behavior.
5.2 Materials and methods
5.2.1 Microspheres and conjugation of biomolecules with microspheres
The carboxylated polystyrene microspheres from Polysciences, Inc. (Warrington, PA)
were used in this study. To mimic the size and shape of C. parvum oocysts, microspheres
with an average diameter of 4.5 µm (diameter coefficient variation (CV) = 7%) were
chosen. Based on the manufacturer’s description, the microspheres had yellow green
(excitation 441 nm, emission 486 nm) fluorescence. Per milliliter of the 2.5% aqueous
suspension had approximately 4.99 × 10⁸ particles. Additional 10 µm microspheres (CV
= 10%, 4.55 × 10⁷ particles/mL 2.5 % aqueous suspension) were also obtained to
examine the effect of increases particle size on the filtration efficiency. The microsphere
suspension was stored in dark at 4 °C.
To mimic the surface charge of the oocysts, an alpha-1-acid glycoprotein (AGP)
(Sigma-Aldrich, Oakville, ON) with isoelectric point (IP) value (indicating surface
charge) similar to that of oocysts was selected and stored at 4 °C for conjugation.
According to the manufacturer product information, the AGP has a molecular weight of
33,000 to 40,800 g/mol, an IP of 2.7 in phosphate buffer, and a water solubility of 10
mg/mL. Details of the sequence of the polypeptide portion of AGP have been described
elsewhere (Pang et al. 2012, Schmid et al. 1973).

144
5.2.2 Humic acid solution preparation
The influence of humic acid on the transport behavior of modified microspheres was
also examined in this study. The Suwannee River Humic Acid standard II purchased from
International Humic Substances Society was selected as model natural organic matter in
this study. HA solution was prepared following the method described previously (Yang et
al. 2012a). The total organic carbon (TOC) content of the HA stock solution was 47.2
mg/L as determined by a TOC analyzer (Mandel, ON, Canada).
5.2.3 Determination of zeta potentials and particle size
The zeta potentials of the unmodified and modified microspheres (4.5 and 10 µm)
with or without 5 mg/L alum addition were determined using a Brookhaven Zetaplus
(Brookhaven Instruments Co., Holtsville, NY) at 25 °C. Prior to the zeta potential
measurement, each sample was sonicated in a cold water bath for 1 min. The zeta
potentials (ζ) were measured in a background electrolyte of 1 mM KCl at the
experimental pH values. To measure the zeta potentials of sands coated with or without
HA, the sand samples were oven-dried, crushed to fine powders using a bench-scale
grinder, and measured in the same background electrolyte. The obtained zeta potential
values were used in place of the surface potentials of microspheres to determine the
interaction energies between sand and the 4.5 µm microspheres using the DLVO theory
as described previously (Zhang et al. 2015). A value of 6.5 × 10⁻²¹
J was used as the
Hamaker constant for the quartz-microsphere-water system (Kuznar and Elimelech 2006).
The average diameter (n ≥ 30) of the modified microspheres was obtained from the
microscope observation.

145
5.2.4 Porous media
The sands with an effective size of 0.35 mm, and a uniformity coefficient of 1.5 were
used for microsphere deposition experiments in porous media. The sand particles are
often used by water treatment utilities as rapid sand filter media (Crittenden et al. 2012).
The procedure used for cleaning the sands was described previously (Xu et al. 2008).
Briefly, the sands were cleaned with boiling nitric acid (70%) for 24 h, followed by
alternating rinse with 0.1 M NaOH solutions and deionized water. The cleaned sands
were oven-dried at 80 °C and then used in the column experiments. The acid-base
washing procedure was adopted to remove surface impurities, such as iron hydroxide,
organic coatings, and very fine particles that could promote favorable deposition of the
colloids.
5.2.5 Experimental conditions
The filtration system consisted of acrylic columns with an internal diameter of 3.175
cm, and a length of 14 cm. The porosity of the packed columns was approximately 0.46.
Columns were dry-packed with mild vibration to ensure uniformity. Pre-equilibration was
performed by introducing at least 6 pore volumes of microsphere-free 1 mM KCl solution
into the columns in an up-flow mode using a peristaltic pump (Cole Parmer, IL). For
experiments examining the effects of HA, pre-equilibration was done by firstly
introducing 3 pore volumes of 1 mg/L HA in 1 mM KCl solution, and then rinsing with 2
pore volumes of microsphere-free 1 mM KCl solution (Yang et al. 2012a). The remaining
HA in column was found to be approximately 3×10⁻⁴
mg/g sand.

146
Following pre-equilibration, 4 pore volumes of modified microspheres (4.5 µm or 10
µm) with or without 5 mg/L alum in solutions were injected into the column, followed by
elution with 2 pore volumes of microsphere-free 1 mM KCl solution. The transport
experiments were conducted in 1 mM KCl solutions at pH = 6.0 ± 0.1 without pre-
adjustment of the saline solution. Experimental conditions tested in this study are listed in
Table 5.1. It should be noted that for experiments that considered the effects of alum, a
reduced pH of 5.7 ± 0.1 was observed due to the addition of alum. Three pore water
velocities, 4.6 m/day (2.5 mL/min), 10.9 m/day (6 mL/min), and 21.8 m/day (12 mL/min),
were selected to broadly represent fluid velocities in various environments, such as coarse
aquifer sediments, forced-gradient conditions, and engineered water filtration units (Yang
et al. 2012a).

147
Table 5.1 Porous media experimental conditions (1 mM KCl) and mass recovery
Modified
microspheres
Flow rate
(m/day)
Alum in
solution
HA coated
sand
Recovery
(%)
4.5 µm
4.6 No No 82.0
Yes No 90.4
10.9
No No 86.4
Yes No 86.0
No Yes 95.0
Yes Yes 98.0
21.8 No No 99.7
Yes No 97.8
10 µm 10.9
No No 87.6
Yes No 76.9
No Yes 93.0
Yes Yes 99.4
5.2.6 Sample collection and analysis
Samples from the column effluent were collected in 50 mL polystyrene tubes for every
half pore volume (PV). Following the experiments, the column media were equally
extruded and dissected into five segments of 2.8 cm length. Approximately 39 g of sands
were obtained from each segment. Retained microspheres were recovered by placing
sands from each segment into specified volumes of 1 mM KCl solution and sonicating for
10 min, followed by vigorous vortexing for 1 min. Aqueous effluent samples and
supernatant samples from the recovered retained microspheres were analyzed using a
flow cytometry (BD FACScan, Beckton Dickinson & Co., FranklinLakes, NJ) at a flow
rate of 1 µL/s and were counted for 1.5 min. Conversion of counts on the flow cytometer

148
to microspheres concentration was achieved by calibrating using a BD TrucountTM
Absolute Counting Tube with known bead count in each tube.
5.3 Results and discussion
5.3.1 Electrokinetic properties of microspheres and DLVO interaction energy calculations
Table 5.2 represented the measured zeta potentials of modified and unmodified
microspheres (4.5 and 10 µm) in 1 mM KCl. The zeta potentials of the unmodified
microspheres were negative for both sizes, and the absolute values were close, indicating
similar surface properties. After surface coating with AGP, the zeta potential of the 4.5
µm microspheres became less negative, and the absolute value decreased from the
original 33.9 mV to 19.9 mV (pH = 6.0). Our measured zeta potential of the 4.5 µm
modified microspheres was close to what was reported previously by Pang et al. (2012)
where they obtained a value of approximately -25 mV of glycoprotein coated
microspheres at the pH of 6. To better interpret the surface electrokinetic potential of the
modified microspheres, zeta potentials of viable and irradiated Cryptosporidium in the
same background solution were also measured as shown in Table 5.2. The irradiated
Cryptosporidium (-28.7 mV) was more negatively charged than the viable ones (-14.2
mV), indicating altered surface properties after irradiation. Upon introducing 5 mg/L
alum, the zeta potentials of the modified 4.5 µm microspheres in 1 mM KCl became
positive (34.4 mV) due to charge neutralization. Similar results were also reported by
Bustamante et al. (2001), they observed a reversal of zeta potential to positive values for
oocysts with increased alum dosage. The free aluminum and aluminum hydroxide species

149
in solution were able to form complexes with or to neutralize the negative charges on the
particle and collector surfaces (Dai and Hozalski 2003).
Table 5.2 Zeta potentials of microspheres in 1 mM KCl and sands
Zeta potential (mV)
Microspheres (µm) Sand Cryptosporidium
4.5 10 Clean HAb Alum
c Alum
c+HA
b Viable Irradiated
Unmodified -
33.9
-
30.7
-35.3 -
46.4 26.2 20.6 -14.2 -28.7 Modified
-
19.9
-
17.5
Modified+
aluma
34.4 9.88
a modified microsphere supplied with 5 mg/L alum in solution
b sand pre-coated with 1 mg/L HA
c sand in solution containing 5 mg/L alum
The zeta potentials of sand and sand pre-soaped in HA in our study were -35.3 and -
46.4 mV, respectively, possibly due to the adsorption of humic acid onto the negatively
charged sand surfaces (Dai and Hozalski 2003). Dai and Hozalski (2003) observed a
consistent more negative charge of oocyst and microspheres in the present of NOM, and
pointed out that NOM could adsorbed onto negatively charged surfaces regardless of
electrostatic repulsion inducing more negative surface. It appeared that HA adsorption
onto negatively charged surfaces was likely attributed to hydrophobic interactions (Fein
et al. 1999) and polyvalent cations generating complexes with negatively charged groups
on both the sand surface and HA (Busch and Stumm 1968). However, after introducing
alum into columns, the same reversal of the zeta potential of sand and HA coated sand to

150
positive values of 26.2 mV, and 20.6 mV, respectively, were again observed likely due to
reasons discussed before.
Table 5.3 DLVO interaction energy calculations
Depth of
secondary energy
minimuma (kT)
Separation
distance to
secondary energy
well (nm)
Energy
barrier
(kT)
Sand Modified i 0.332 106 1730
Modified + alum ii NAb NA NB
c
Sand + HA Modified iii 0.314 109 1930
Modified + alum iv NA NA NB
a values calculated within the separation distance of 150 nm
b not applicable
c no energy barrier
The DLVO interaction energy between the approaching 4.5 µm modified
microspheres and sand surfaces were calculated using the measured zeta potential values
in four different experimental systems: (i) modified microspheres approaching clean
sand; (ii) modified microspheres with alum approaching clean sand; (iii) modified
microspheres approaching sand coated with HA; and (iv) modified microspheres with
alum approaching sand coated with HA, and the results were presented in Table 5.3. It
was noticed that continuously injecting solution containing alum could change the zeta
potentials of sand (from -35.3 to 26.2 mV) and HA-coated sand (-46.4 to 20.6 mV)
(Table 5.2). Since the zeta potentials of collectors kept changing during the period of
experiments, it was difficult to determine the average values that can better represent the
zeta potentials during the experiments. Therefore, initial zeta potentials of sand (-35.3

151
mV) and HA-coated sand (-46.4 mV) were used for the calculation of DLVO interaction
energies.
As shown in Table 5.3, an insurmountable energy barrier to attachment was observed
when alum is not present in the system (i.e., systems i and iii). System iii showed a higher
level of energy barrier (1930 kT) when HA was present than system i (1730 kT) when no
HA was present. Closer inspection indicated the present of shallow secondary energy
minimum wells for both systems (-0.332 and -0.314 kT for system i and iii at separation
distance of 106 and 109 nm, respectively). No energy barrier was observed when the
modified microspheres were approaching both clean and HA pre-coated sands when alum
was added in the feeding solution (i.e., systems ii and iv), indicating favorable condition
for adhesion. But it was possible that with the injection of solution containing alum, the
interaction energies would change to less favorable due to the reduced negativity to
collector surfaces.
5.3.2 Observed transport and retention behaviors of modified microspheres
5.3.2.1 Influence of flow rate
The influence of different flow rate on the transport and deposition of modified
microspheres in clean sand bed column was examined using the modified 4.5 µm
microspheres, as the size and zeta potential better mimic the viable Cryptosporidium.
The breakthrough curves in clean sand as a function of flow rate and the surrogate
deposition profiles are shown in Figure 5.1. The relative effluent concentrations (C/C0)
were plotted as a function of ½ pore volume (PV). The normalized concentration of
microspheres retained in the clean sand (S(X)/C0 mL/g sand; where S(X) and C0 were the

152
number of retained microspheres per gram of sand and the initial concentration of
injected microspheres, respectively) were plotted as a function of equal distance from the
column inlet. Bradford et al. (2003) reported that Yao’s classic colloid filtration theory
(CFT) can no longer adequately describe the measured deposition profiles when the ratio
of particle diameter to collector grain diameter is greater than around 0.005, and under
such conditions, colloid transport in heterogeneous systems was mainly controlled by
straining (Bradford et al. 2004). In our study, the ratio is averaged at 0.014 for the
modified 4.5 µm microspheres. Therefore, straining likely occurred under all test
conditions because the heterogeneity of the sands used in the experiments. However,
attachment and the flow bypassing of the finer-textured sands are also important during
the transport processes (Bradford et al. 2004). Theoretical prediction based the CFT was
not included for all the column experiments. Error bars were obtained from replicate test
results.

153
4.6 m/day 10.9 m/day 21.8 m/day
Figure 5.1 Breakthrough curves (A1, B1, C1) and deposition profiles in column bed of
(i) modified microspheres in 1 mM KCl and (ii) modified microspheres with alum in 1
mM KCl in the sand column at three pore water velocities: 4.6 m/day (A2, A3); 10.9
m/day (B2, B3); and 21.8 m/day (C2, C3). Error bars were obtained from replicated test
results.
0
0.02
0.04
0.06
0.08
0.1
0 1 2 3 4 5 6
C/C
0
Pore Volume
Modified Modified+Alum
0
0.02
0.04
0.06
0.08
0.1
0 1 2 3 4 5 6
C/C
0
Pore Volume
Modified
Modified+alum
0
0.02
0.04
0.06
0.08
0.1
0 1 2 3 4 5 6
C/C
0
Pore Volume
Modified Modified+Alum
0.01
0.1
1
10
0 2.8 5.6 8.4 11.2 14
S(X
)/C
0 (
mL
/g s
an
d)
X (cm)
Modified 0.01
0.1
1
10
0 2.8 5.6 8.4 11.2 14
S(X
)/C
0 (
mL
/g s
an
d)
X (cm)
Modified 0.01
0.1
1
10
0 2.8 5.6 8.4 11.2 14
S(X
)/C
0 (
mL
/g s
an
d)
X (cm)
Modified
0.01
0.1
1
10
0 2.8 5.6 8.4 11.2 14
S(X
)/C
0 (
mL
/g s
an
d)
X (cm)
Modified+Alum 0.01
0.1
1
10
0 2.8 5.6 8.4 11.2 14
S(X
)/C
0 (
mL
/g s
an
d)
X (cm)
Modified+Alum 0.01
0.1
1
10
0 2.8 5.6 8.4 11.2 14
S(X
)/C
0 (
mL
/g s
an
d)
X (cm)
Modified+Alum
A1 B1 C1
A2 B2 C2
A3 B3 C3

154
As the water velocity increased, the magnitudes of the drag and lift forces that act on
particles near collector surfaces would increase accordingly (Li et al. 2005), and the
volume of low velocity regions was expected to decrease (Bradford et al. 2007).
Enhanced transport of microspheres is usually expected at higher flow rate. The increased
hydrodynamic forces may inhibit the retention of particles in the smallest regions of the
soil pore space, which is usually described as straining, and induce the shape change of
the deposition profile (Bradford et al. 2007). Research has demonstrated that straining of
oocysts primarily occurred at the sand surface and at textural interfaces when water flows
from a coarser to a finer medium (Bradford and Bettahar 2005). Figure 5.1(A1, B1 and
C1) showed that increasing flow rate led to greater transport of the modified
microspheres in the sand bed regardless of the addition of alum. Similar trend of flow rate
influence was observed by Kim et al. (2010), where they observed greater transport of C.
parvum oocyst at increased velocity in quartz and Ottawa sands (Kim et al. 2010). Longer
travel distance was observed when microspheres were moving without the addition of
alum. The addition of alum greatly hindered the motility of microspheres at all levels of
flow rate, as agreed by the DLVO interaction energies where favorable condition for
adhesion was predicted. The effect of alum was further discussed in Section 5.3.2.2.
The deposition profiles showed less microsphere retention with higher flow rate,
consistent with information presented in the breakthrough curves. The shape of the
profiles did not seem to have changed greatly, especially for conditions with alum
addition. Based on this observation, increase of flow rates seemed have little effect on the
shape of the deposition profiles of retained microspheres at the tested range of flow rate.
Review on the literature revealed that high velocity (6.48 m/day) could generate fluid

155
drag forces sufficient enough to inhibit particle retention in pore spaces that readily
occurred at lower velocity, eventually produce a less hyperexponential deposition
(Bradford et al. 2007). For conditions where no alum was added, the deposited
microspheres were found to decline hyperexponentially at 10.9 and 21.8 m/day, while
slower than the hyperexponential decrease at 4.6 m/day. In addition, good recovery rates
were obtained from the experiments (Table 5.1).
Despite the predicted unfavorable conditions for deposition by the DLVO theory for
system i, the majority of microspheres were still retained in the packed sand bed with
only rather small amount successfully travelled through the column. As shown in Table
5.3, when approaching to the sand surfaces, the modified microspheres faced a significant
energy barrier inhibiting attachment (1730 kT for system i). However, a shallow
secondary energy minimum (0.332 kT) existed between the microspheres and sand before
encountering the energy barrier. Since larger particles (greater than 1 µm in diameter) are
more influenced by the secondary minimum well (Elimelech 1998), it was possible that
besides straining, secondary energy minimum well retained a portion of the microspheres.
DLVO predictions were calculated based on the assumption that the overall zeta potential
represented the surface potential, and the collector had a smooth surface. However, in this
study, the surface roughness and heterogeneity of the sand collector cannot be neglected.
Hoek et al. (2003) reported that the presence of rough surface produced lower energy
barrier for attachment and created valleys with lower interaction energy wells favoring
colloidal particle deposition (Hoek et al. 2003). It was possible that in this experiment the
pore structure and pore spaces formed by grain-grain contact provided preferred location
for particles that were weakly associated with the solid surface under secondary energy
156
minimum to retain due to reduced hydrodynamic force, pore size limitation, and
enhanced DLVO interaction (Hoek and Agarwal 2006). Nanoscale chemical
heterogeneity might enhance adhesion between two surfaces as well (Kozlova and
Santore 2006).
5.3.2.2 Influence of alum
The effect of alum addition on the filtration of modified microspheres was also
examined because alum is a commonly used coagulant in drinking water treatment. The
influence of alum on the transport and deposition of modified microspheres in clean sand
bed column was examined using 4.5 µm microspheres. Results were shown in Figure 5.1
as well. From the breakthrough curves in Figure 5.1 (A1, B1, C1), it was noticed that the
addition of alum greatly reduced the breakthrough concentrations of microspheres
comparing to the condition when alum was absent, except at low flow velocity (4.6
m/day). Specifically, at 4.6 m/day, the difference in breakthrough curves between
conditions with and without alum was quite minimum; at 10.9 m/day, breakthrough
concentration of microspheres without alum started to increase while the one with alum
addition remained relatively steady; at the highest 21.8 m/day, microspheres were able to
travel the farthest distance under both conditions, and the difference of the breakthrough
concentrations between two conditions was most obvious (i.e. C/C0(microspheres) -
C/C0(microspheres + alum) = 0.07, 0.017 and 0.003 for 21.8, 10.9, and 4.6 m/day, respectively).
It was reported previously that low velocity regions in porous media are
hydrodynamically favorable for retention (Torkzaban et al. 2007, Torkzaban et al. 2008).
At the low flow rate condition, the microspheres weakly associated with the collector
surface could be transported along the grain surface by hydrodynamic shear to regions

157
that are more favorable for deposition and remain attached (Bradford et al. 2007). As
mentioned in Section 5.3.2.1, the addition of alum introduced very minimal change of the
shape of the deposition profile. Deposited particle concentration declined monotonically
at a rather constant rate (i.e. relatively constant slope). It should be noted that within the
experimental duration (< 50 min), no aggregation of the modified 4.5 µm microspheres
was observed based on a preliminary size distribution determination (details provided in
section 5.3.2.4). Therefore, the effect of size change on the transport of microspheres was
not observed under this condition.
Favorable interaction for deposition was obtained under this condition (system ii in
Table 5.3). This favorable condition for adhesion well explained the observed less
transport and more deposition of microspheres in system ii as compared to the
unfavorable condition in system i. Another possible reason for the observed higher
deposition was the reduced pH (from 6.0±0.1 to 5.7±0.1) due to the addition of alum.
Reducing pH from 8 to 6 was found to reduce the electrophoretic motility and eventually
led to greater aggregation and deposition of the negatively charged zero valent iron nano-
particles (Kim et al. 2012). The increased acidity in this study might also increased the
deposition of the negatively charged microspheres, however the effect could be minimal
since the change of pH was not significant. However, very low amount of microspheres
still transported through the column bed and were detected in the column effluent as
shown by the breakthrough curves. One thing need to mention was that the zeta potential
of sand surface used for DLVO calculation was the initial value before alum was supplied,
however, with the continuous addition of alum, the collector surfaces might become less
negative (as shown in Table 5.2), resulting to a less favorable condition for deposition as

158
compared to the beginning of the experiments. Less deposition could possible happen
towards the end of the experiment period, leading to the low breakthrough concentrations.
In addition to that, the steric repulsion between the sand and microsphere surfaces
(Kuznar and Elimelech 2006) and blocking (Camesano et al. 1999) were also possible
reasons for the observed breakthroughs under the DLVO favorable condition.
Microspheres weakly attached to the collectors under the force of steric repulsion may get
detached from collector surface and travel along with the flow under hydrodynamic drag
force (Kim et al. 2010).
5.3.2.3 Influence of HA
The dissolved HA in solution was reported to hinder the aggregation of colloidal
particles and enhance transport in porous media through several mechanisms, including
inducing changes in the surface properties of colloidal particles, altering the surface
charge of the collector, increasing repulsive electrostatic force between particle and
collector, and competing with the particles for deposition site (Dai and Hozalski 2003,
Dong and Lo 2013, Liu et al. 2011, Yang et al. 2012a). In our study, to examine the effect
of HA on the filtration efficiency of modified microspheres, 3 pore volumes of HA
solution (1 mg/L) were injected into the column bed prior to microsphere injection. The
zeta potential of sand pre-coated with HA was more negative (-46.4 mV) than that of the
clean sand (-35.3 mV). The 4.5 µm modified microspheres and a flow rate of 10.9 m/day
were chosen, results were shown in Figure 5.2.
From Figure 5.2 (A1), it was noticed that in the presence of HA solely (system iii),
modified microspheres were able to travel the farthest in comparison to the other test
159
condition (i.e. system i). Previous studies have demonstrated that the site-blocking caused
by pre-equilibrating the porous media with HA could inhibit the colloid deposition
mostly likely through steric repulsion and perhaps increased electrical repulsion (Foppen
et al. 2008, Foppen et al. 2006). Same results were reported by Yang et al. (2012a), as
they observed that regardless of solution chemistry, cell types, motility, and EPS, HA
enhanced bacterial cell transport. According to them, a site competition by a portion of
HA and the repelling deposition (potential steric repulsion) caused by suspended HA in
solution seemed to contribute to the reduced cell deposition (Yang et al. 2012a). What
should be noticed though, was that in their observation, zeta potential of sand in the
presence of HA was similar to that of clean sand. But a more negatively charged zeta
potential of sand with HA was obtained in our study, indicating change in the surface
charge of the sand. Therefore, it seemed that surface charge alteration resulting in an
increased electrostatic repulsion was also a mechanism enhancing the transport of
microspheres.

160
4.5 µm 10 µm
0
0.02
0.04
0.06
0.08
0.1
0 1 2 3 4 5 6
C/C
0
Pore Volume
Modified
Modified+alum
Modified+HA
Modified+HA+Alum
0
0.02
0.04
0.06
0.08
0.1
0 1 2 3 4 5 6
C/C
0
Pore Volume
Modified Modified+alum Modified+HA Modified+HA+Alum
0.01
0.1
1
10
0 2.8 5.6 8.4 11.2 14
S(X
)/C
0 (
mL
/g s
an
d)
X (cm)
Modified 0.01
0.1
1
10
0 2.8 5.6 8.4 11.2 14
S(X
)/C
0 (
mL
/g s
an
d)
X (cm)
Modified
0.01
0.1
1
10
0 2.8 5.6 8.4 11.2 14
S(X
)/C
0 (
mL
/g s
an
d)
X (cm)
Modified+Alum 0.01
0.1
1
10
0 2.8 5.6 8.4 11.2 14
S(X
)/C
0 (
mL
/g s
an
d)
X (cm)
Modified+Alum
A3
A2
A1
B3
B2
B1

161
Figure 5.2 Comparison of breakthrough curves (A1, B1) and deposition profiles in
column bed of modified microspheres of 4.5 µm (A2, A3, A4, A5) and 10 µm (B2, B3,
B4, B5) at (i) modified microspheres in 1 mM KCl only; (ii) modified microspheres with
alum in 1 mM KCl; (iii) modified microshperes in 1 mM KCl in the columm pre-
equilibrated with HA; and (iv) modified microspheres with alum in 1 mM KCl in the
sand column pre-equilibrated with HA. Pore water velocity = 10.9 m/day. Error bars were
obtained from replicated test results.
Interestingly when alum was present in solution, the microspheres were not able to
travel the similar distance in HA-coated porous media, as the breakthrough plateau of
microspheres in the presence of alum and HA (system iv) was much lower than that when
only HA (system iii) was present, and it almost overlapped with the breakthrough curves
when only microspheres (system i) were present. Specifically, the breakthrough
0.01
0.1
1
10
0 2.8 5.6 8.4 11.2 14
S(X
)/C
0 (
mL
/g s
an
d)
X (cm)
Modified+HA 0.01
0.1
1
10
0 2.8 5.6 8.4 11.2 14
S(X
)/C
0 (
mL
/g s
an
d)
X (cm)
Modified+HA
0.01
0.1
1
10
0 2.8 5.6 8.4 11.2 14
S(X
)/C
0 (
mL
/g s
an
d)
X (cm)
Modified+HA+Alum 0.01
0.1
1
10
0 2.8 5.6 8.4 11.2 14
S(X
)/C
0 (
mL
/g s
an
d)
X (cm)
Modified+HA+Alum
A4
A5 B5
B4

162
concentrations of microspheres were in the order of (from high to low): systems iii > i >
iv > ii. Compared to conditions where only HA (system iii) was present, the addition of
alum also reduced the breakthrough concentrations of microspheres in the presence of
HA (system iv). Dai and Hozalski (2003) observed similar results where increased
removal of oocyst and unmodified microspheres was obtained in the presence of NOM
when alum was supplied as coagulant for particle destabilization as compared to
conditions when no alum was added. In their study, the highest collision efficiency was
obtained when alum was supported as coagulant in the presence of NOM, possibly due to
particle flocculation prior to entering filter bed under such condition. Yao et al. (1971)
suggested that flocculation within the pores of filter bed could also increase the filtration
efficiency of particles larger than 1 µm. It was possible that flocculation promoted the
deposition of microspheres when alum was added in the condition where sands were
coated with HA. Another noteworthy observation was the reduced pH (from 6.0 ± 0.1 to
5.7 ± 0.1) when alum was supplied as coagulant, as discussed in Section 5.3.2.2. In
addition, studies showed that in the presence of HA, when divalent ions (such as Ca2+
)
was supplied, nanoparticles had greater aggregation due to bridging interaction of humic
acid and Ca2+
(Chen and Elimelech 2007, Dong and Lo 2013, Liu et al. 2011). It seemed
that instead of steric repulsion, humic acid likely aggregated through intermolecular
briding with alum complexation (Dai and Hozalski 2003) to form humic acid aggregates,
which then bridged the microspheres and aggregated together, forming bigger size of
aggregates that could be more easily removed by filtration (Chen and Elimelech 2007).
Deposition profiles of the microspheres in the HA-coated porous media with or without
alum addition showed similar pattern. The deposited concentrations first increased

163
slightly then gradually decreased, mostly likely due to the interactions between the
microspheres and HA adsorbed on the sand surface, indicating that the deposition rate
changed non-monotonically through travel distance. Giving that the sand was pre-
equilibrated, HA adsorbed on the sand surface likely contributed to this pattern of
deposition as discussed by Redman et al. (2001a, 2001b), where they attributed the
increase-then-decrease deposition pattern with distance across the column to the
adsorption of organic matter. According to them (Redman et al. 2001a, 2001b), the
adsorbed organic matter near the column inlet could decrease colloid attachment through
increased electrostatic repulsion between the colloids and the collector surfaces, leading
to the down-gradient movement of maximum concentrations of retained microspheres in
the column bed.
By looking at the DLVO interaction energy profiles, a bigger energy barrier (1930 kT)
and a shallower secondary energy minimum (0.314 kT) was observed when microspheres
and HA were together (system iii), indicating more unfavorable condition for deposition
in comparison to system i. Evidence was the higher breakthrough concentration of system
iii as compared to system i as shown in Figure 5.2 (A1). The DLVO interaction profiles
of system iv showed favorable conditions for deposition as well, which also explained the
higher deposition of microspheres in system iv as compared to system iii. Compared to
system ii, which was also favorable for deposition, microspheres in system iv had higher
breakthrough concentrations. This may be attributed to blocking of previously attached
microspheres (Camesano et al. 1999) and electrostatic repulsion between the
micropsheres and sands (Redman et al. 2001a, Redman et al. 2001b).

164
5.3.2.4 Influence of particle size
With the consideration of potential size increase due to aggregation of oocyst-sized
microspheres, additional experiments using modified 10 µm particles were perform at
flow velocity of 10.9 m/day under conditions with or without alum/HA (Table 5.1).
Preliminary size distribution results with modified 4.5 µm microspheres showed that 100
min after alum addition, clusters of two to three microspheres began to form, resulting in
equal spheres with an approximate maximum diameter of 9.6 µm (data not shown). Since
the particle injection duration within the experimental period was less than 50 min, it was
safe to say that microsphere aggregation was almost unlikely to occur and 10 µm was the
maximum size that could be encountered during the experiment if any.
Inspection of the breakthrough curves of the modified 10 µm particles showed an
overall significantly lower breakthrough concentration of all conditions tested (Figure 5.2,
B1). According to Yao’s theory (Yao et al. 1971), removals of particles larger than 1 µm
are enhanced by increased particle sizes. Larger ratios of the colloid to the median grain
diameter were reported to cause greater deposition via straining (Bradford et al. 2007).
The hindered transport of the 10 µm microspheres were most likely caused by the
increased particle size when comparing to the breakthrough of 4.5 µm microspheres.
Straining likely predominately retained the modified 10 µm particles. Microspheres were
more readily retained physically in the pore spaces generated through grain-grain contact,
instead of being affected by the chemical factors (alum and/or HA). Unlike those of the
modified 4.5 µm microspheres, the deposition profiles of the modified 10 µm
microspheres showed very concentrated retention close to the column bed inlet (Figure
5.2, B2-5). It was observed that a steeper slope of decreased experimental deposition

165
results (dots) occurred within the first half of the column bed. As the microspheres were
travelling further towards the outlet of filter media, a reduced rate of deposition was
observed, as the concentration of the deposited microspheres remained relatively the
same (i.e. shallow slopes). Similar retention pattern was reported by Tufenkji and
Elimelech (2004b, 2005b) where they observed a reduced slope close to the column
outlet in the deposition profile using fluorescent polystyrene latex particles and C.
parvum oocysts and found that this reduction of slope was most pronounced at low salt
concentration (3 mM).It was reported that in the presence of repulsive DLVO interactions,
the concurrent existence of favorable and unfavorable particle-collector interactions due
to surface heterogeneity could induce different rate for deposition (Tufenkji and
Elimelech 2004b). Lastly, the impact of secondary energy minimum was more
pronounced for larger particles (Elimelech 1998). Therefore, in complementary to the
physical straining, the modified 10 µm microspheres were also likely to deposit in the
secondary energy well under conditions unfavorable for deposition, and get retained
through polymer bridging.
5.4 Conclusions
In this study, we modified the surface properties of carboxylated polystyrene
microspheres with similar diameter as of Cryptosporidium, and evaluated the filtration of
the surrogates under effects of flow rate, alum addition and HA-coating on collector
surface. The surfaces of the selected microspheres were modified using an alpha-1-acid
glycoprotein with similar surface charges characteristics to C. parvum oocysts, and
examined the size and surface electrokinetic potentials of the modified surrogates.
Filtration experiments were performed in bench-scale columns filled with sand media

166
often used by water treatment utilities. Obtained sands were thoroughly cleaned
following procedure previously reported in order to eliminate impurities that could affect
the experiment. Three flow velocities were chosen to broadly represent the flow rates in
natural aquifers and water treatment utilities. Selected experiments were performed in the
presence of alum or HA coating or both to investigate the impact of chemical factors.
DLVO interaction energy was calculated based on the modified 4.5 µm microspheres and
the retention mechanisms were discussed.
The zeta potentials of modified 4.5 µm microspheres were more negative than the
unmodified ones. But the size and zeta potential of modified microspheres were found to
be similar to that of the viable Cryptosporidium measured in our study. This excellent
resemblance indicated that the modified microspheres could be utilized as very suitable
surrogates for Cryptosporidium. DLVO calculations predicted the presence of a shallow
secondary minimum well and a huge energy barrier for experimental conditions where no
alum was present. Our filtration results showed that flow rate increased the transport of
microspheres regardless of solution chemistry (i.e. presence of alum) under increased
hydrodynamic forces. When only alum was supplied as coagulant, the microspheres
showed hindered travel ability. When microspheres were moving in the HA-coated
porous media bed, enhanced transport was observed in comparison to when HA was
absent, possibly due to site competition and increased repulsion (steric and electrostatic).
When alum and HA were both affecting the fate of microspheres, their coupled effects
were minimal as the fate of microspheres under such condition was almost the same to
the condition when alum and HA were absent.

167
Lastly, the surrogates used in this study can be used as a cost-effective tool for
understanding Cryptosporidium removal in porous media without having to pose extra
stress on health risk management. However, limitations of these glycoprotein modified
microspheres still exist. As such, the surface hydrophobicity and softness might be
different from the viable Cryptosporidium. Therefore, further validation and development
of these surrogates suitable for various conditions is also needed.

168
References
Bradford, S.A. and Bettahar, M. (2005) Straining, attachment, and detachment of
Cryptosporidium oocysts in saturated porous media. Journal of Environmental
Quality 34(2), 469-478.
Bradford, S.A., Bettahar, M., Simunek, J. and van Genuchten, M.T. (2004) Straining and
attachment of colloids in physically heterogeneous porous media. Vadose Zone
Journal 3(2), 384-394.
Bradford, S.A., Simunek, J., Bettahar, M., van Genuchten, M.T. and Yates, S.R. (2003)
Modeling colloid attachment, straining, and exclusion in saturated porous media.
Environmental Science & Technology 37(10), 2242-2250.
Bradford, S.A., Torkzaban, S. and Walker, S.L. (2007) Coupling of physical and
chemical mechanisms of colloid straining in saturated porous media. Water
Research 41(13), 3012-3024.
Busch, P.L. and Stumm, W. (1968) Chemical interactions in the aggregation of bacteria
bioflocculation in waste treatment. Environmental Science & Technology 2(1), 49-
53.
Bustamante, H.A., Shanker, S.R., Pashley, R.M. and Karaman, M.E. (2001) Interaction
between Cryptosporidium oocysts and water treatment coagulants. Water Research
35(13), 3179-3189.

169
Camesano, T.A., Unice, K.M. and Logan, B.E. (1999) Blocking and ripening of colloids
in porous media and their implications for bacterial transport. Colloids and Surfaces
A-Physicochemical and Engineering Aspects 160(3), 291-308.
Chen, K.L. and Elimelech, M. (2007) Influence of humic acid on the aggregation kinetics
of fullerene (C 60) nanoparticles in monovalent and divalent electrolyte solutions.
Journal of Colloid and Interface Science 309(1), 126-134.
Clancy, J.L., Bukhari, Z., Hargy, T.M., Bolton, J.R., Dussert, B.W. and Marshall, M.M.
(2000) Using UV to inactivate Cryptosporidium. Journal American Water Works
Association 92(9), 97-104.
Crittenden, J.C., Trussell, R.R., Hand, D.W., Howe, K.J. and Tchobanoglous, G. (2012)
MWH's Water Treatment: Principles and Design, John Wiley & Sons.
Dai, X. and Hozalski, R.M. (2003) Evaluation of microspheres as surrogates for
Cryptosporidium parvum oocysts in filtration experiments. Environmental Science
& Technology 37(5), 1037-1042.
Dong, H. and Lo, I.M.C. (2013) Influence of calcium ions on the colloidal stability of
surface-modified nano zero-valent iron in the absence or presence of humic acid.
Water Research 47(7), 2489-2496.
Elimelech, M. (1998) Particle Deposition and Aggregation : Measurement, Modelling,
and Simulation, Butterworth-Heinemann, Oxford, England.

170
Fein, J.B., Boily, J.-F., Güçlü, K. and Kaulbach, E. (1999) Experimental study of humic
acid adsorption onto bacteria and Al-oxide mineral surfaces. Chemical Geology
162(1), 33-45.
Finch, G., Black, E., Gyürék, L. and Belosevic, M. (1993) Ozone inactivation of
Cryptosporidium parvum in demand-free phosphate buffer determined by in vitro
excystation and animal infectivity. Applied and Environmental Microbiology
59(12), 4203-4210.
Foppen, J.W., Liem, Y. and Schijven, J. (2008) Effect of humic acid on the attachment of
Escherichia coli in columns of goethite-coated sand. Water Research 42(1-2), 211-
219.
Foppen, J.W.A., Okletey, S. and Schijven, J.F. (2006) Effect of goethite coating and
humic acid on the transport of bacteriophage PRD1 in columns of saturated sand.
Journal of Contaminant Hydrology 85(3–4), 287-301.
Gitis, V. (2008) Rapid sand filtration of Cryptosporidium parvum: Effects of media depth
and coagulation. Water Science & Technology: Water Supply 8(2).
Gottinger, A.M., Bhat, S.V., McMartin, D.W. and Dahms, T.E.S. (2013) Fluorescent
microspheres as surrogates to assess oocyst removal efficacy from a modified slow
sand biofiltration water treatment system. Journal of Water Supply: Research and
Technology -- AQUA 62(3), 129-137.

171
Gross, M.J. and Logan, B.E. (1995) Influence of different chemical treatments on
transport of Alcaligenes paradoxus in porous-media. Applied and Environmental
Microbiology 61(5), 1750-1756.
Harvey, R.W., George, L.H., Smith, R.L. and LeBlanc, D.R. (1989) Transport of
microspheres and indigenous bacteria through a sandy aquifer: Results of natural-
and forced-gradient tracer experiments. Environmental Science & Technology
23(1), 51-56.
Harvey, R.W., Metge, D.W., Barber, L. and Aiken, G.R. (2010) Effects of altered
groundwater chemistry upon the pH-dependency and magnitude of bacterial
attachment during transport within an organically contaminated sandy aquifer.
Water Research 44(4), 1062-1071.
Harvey, R.W., Metge, D.W., Shapiro, A.M., Renken, R.A., Osborn, C.L., Ryan, J.N.,
Cunningham, K.J. and Landkamer, L. (2008) Pathogen and chemical transport in
the karst limestone of the Biscayne aquifer: 3. Use of microspheres to estimate the
transport potential of Cryptosporidium parvum oocysts. Water Resources Research
44(8).
Hoek, E.M., Bhattacharjee, S. and Elimelech, M. (2003) Effect of membrane surface
roughness on colloid-membrane DLVO interactions. Langmuir 19(11), 4836-4847.
Hoek, E.M.V. and Agarwal, G.K. (2006) Extended DLVO interactions between spherical
particles and rough surfaces. Journal of Colloid and Interface Science 298(1), 50-58.
172
Hsu, B.-M., Huang, C. and Pan, J.R. (2001) Filtration behaviors of Giardia and
Cryptosporidium—ionic strength and pH effects. Water Research 35(16), 3777-
3782.
Huck, P.M., Coffey, B.M., Emelko, M.B., Maurizio, D.D., Slawson, R.M., Anderson,
W.B., Van Den Oever, J., Douglas, I.P. and O'Melia, C.R. (2002) Effects of filter
operation on Cryptosporidium removal. Journal-American Water Works
Association 94(6), 97-111.
Karanis, P. and Kimura, A. (2002) Evaluation of three flocculation methods for the
purification of Cryptosporidium parvum oocysts from water samples. Letters in
Applied Microbiology 34(6), 444-449.
Kim, H.-J., Phenrat, T., Tilton, R.D. and Lowry, G.V. (2012) Effect of kaolinite, silica
fines and pH on transport of polymer-modified zero valent iron nano-particles in
heterogeneous porous media. Journal of Colloid and Interface Science 370(1), 1-10.
Kim, H.N., Walker, S.L. and Bradford, S.A. (2010) Coupled factors influencing the
transport and retention of Cryptosporidium parvum oocysts in saturated porous
media. Water Research 44(4), 1213-1223.
Kozlova, N. and Santore, M.M. (2006) Manipulation of micrometer-scale adhesion by
tuning nanometer-scale surface features. Langmuir 22(3), 1135-1142.
Kuznar, Z.A. and Elimelech, M. (2006) Cryptosporidium oocyst surface macromolecules
significantly hinder oocyst attachment. Environmental Science & Technology 40(6),
1837-1842.

173
Li, X.Q., Zhang, P.F., Lin, C.L. and Johnson, W.P. (2005) Role of hydrodynamic drag on
microsphere deposition and re-entrainment in porous media under unfavorable
conditions. Environmental Science & Technology 39(11), 4012-4020.
Liu, X., Wazne, M., Chou, T., Xiao, R. and Xu, S. (2011) Influence of Ca(2+) and
Suwannee River Humic Acid on aggregation of silicon nanoparticles in aqueous
media. Water Research 45(1), 105-112.
Pang, L., Nowostawska, U., Ryan, J.N., Williamson, W.M., Walshe, G. and Hunter, K.A.
(2009) Modifying the surface charge of pathogen-sized microspheres for studying
pathogen transport in groundwater. Journal of Environmental Quality 38(6), 2210-
2217.
Pang, L., Nowostawska, U., Weaver, L., Hoffman, G., Karmacharya, A., Skinner, A. and
Karki, N. (2012) Biotin- and glycoprotein-coated microspheres: Potential
surrogates for studying filtration of Cryptosporidium parvum in porous media.
Environmental Science & Technology 46(21), 11779-11787.
Redman, J.A., Estes, M.K. and Grant, S.B. (2001a) Resolving macroscale and microscale
heterogeneity in virus filtration. Colloids and Surfaces A: Physicochemical and
Engineering Aspects 191(1–2), 57-70.
Redman, J.A., Grant, S.B., Olson, T.M. and Estes, M.K. (2001b) Pathogen filtration,
heterogeneity, and the potable reuse of wastewater. Environmental Science &
Technology 35(9), 1798-1805.

174
Schmid, K., Kaufmann, H., Isemura, S., Bauer, F., Emura, J., Motoyama, T., Ishiguro, M.
and Nanno, S. (1973) Sturcture of alpha1-acid glycoprotein - Complete amino acid
sequence, multiple amino acid substitutions, and homology with the
immunoglobulins. Biochemistry 12(14), 2711-2724.
Syngouna, V.I. and Chrysikopoulos, C.V. (2011) Transport of biocolloids in water
saturated columns packed with sand: Effect of grain size and pore water velocity.
Journal of Contaminant Hydrology 126(3–4), 301-314.
Torkzaban, S., Bradford, S.A. and Walker, S.L. (2007) Resolving the coupled effects of
hydrodynamics and DLVO forces on colloid attachment in porous media. Langmuir
23(19), 9652-9660.
Torkzaban, S., Tazehkand, S.S., Walker, S.L. and Bradford, S.A. (2008) Transport and
fate of bacteria in porous media: Coupled effects of chemical conditions and pore
space geometry. Water Resources Research 44(4).
Tufenkji, N. and Elimelech, M. (2004b) Deviation from the classical colloid filtration
theory in the presence of repulsive DLVO interactions. Langmuir 20(25), 10818-
10828.
Tufenkji, N. and Elimelech, M. (2005a) Breakdown of colloid filtration theory: Role of
the secondary energy minimum and surface charge heterogeneities. Langmuir 21(3),
841-852.

175
Tufenkji, N. and Elimelech, M. (2005b) Spatial distributions of Cryptosporidium oocysts
in porous media: Evidence for dual mode deposition. Environmental Science &
Technology 39(10), 3620-3629.
Tufenkji, N., Miller, G.F., Ryan, J.N., Harvey, R.W. and Elimelech, M. (2004) Transport
of Cryptosporidium oocysts in porous media: Role of straining and
physicochemical filtration. Environmental Science & Technology 38(22), 5932-
5938.
Xu, S., Liao, Q. and Saiers, J.E. (2008) Straining of nonspherical colloids in saturated
porous media. Environmental Science & Technology 42(3), 771-778.
Yang, H., Kim, H. and Tong, M. (2012a) Influence of humic acid on the transport
behavior of bacteria in quartz sand. Colloids and Surfaces B-Biointerfaces 91, 122-
129.
Yao, K.M., Habibian, M.T. and O'Melia, C.R. (1971) Water and wastewater filtration:
Concepts and applications. Environmental Science & Technology 5, 1105-1112.
Zhang, H., Ulrich, A.C. and Liu, Y. (2015) Retention and transport of an anaerobic
trichloroethene dechlorinating microbial culture in anaerobic porous media.
Colloids and Surfaces B: Biointerfaces 130, 110-118.

176
Chapter 6. Conclusions

177
6.1 Summary of findings
Lots of research has been conducted to understand the factors that influence the fate and
transport of microbial particles in different types of porous media under aerobic
conditions. In contrast, transport processes under anaerobic conditions have been
minimally explored. This dissertation aims at closing this knowledge gap by better
understanding microbial transport under different environmental scenarios.
The first investigation determined the role of solution ionic strength on the transport of
different microbial cells in porous media under strictly anaerobic conditions. Secondly,
the role of oxygen concentration on the growth and transport of a pathogenic facultative
bacterium in porous media was explored. Lastly, the filtration of a novel surrogate for
Cryptosporidium under various conditions that are commonly encountered in a water
treatment process was evaluated. Research findings are summarized below.
6.1.1. Chapter 3. Retention and transport of an anaerobic trichloroethene dechlorinating
microbial culture in porous media
In this chapter, an anaerobic mixed culture capable of complete reduction of TCE to
ethene was studied. Three distinct species within the mixed culture were tracked in the
experiments: Dehalococcoides, Geobacter and Methanomethylovorans. The goal of the
research was to understand how these three microbial species transport and deposit in
anaerobic porous media and if they are equally sensitive to changes in solution ionic
strength.

178
Firstly, reduced transport and increased cell deposition in the packed bed column was
observed for all three species when ionic strengths increased from 1 to 10, and 100 mM.
Interestingly and more importantly, the three species exhibited similar normalized
breakthrough concentrations (C/C0 of 0.95, 0.84, and 0.56 at 1, 10 and 100 mM,
respectively) and travel times (i.e., breakthrough plateau reached after 2 pore volumes of
cell suspension injection) in the columns and showed almost equal sensitivity to solution
ionic strength changes. This observation differed from what we had hypothesized where
the species would have different transport behaviors because of their distinct surface
properties. One possible explanation for the observed transport behavior includes surface
interactions (such as steric repulsion and polymer bridging) of these microorganisms with
other microbial species in the culture, which can either hinder or enhance their travel
ability. Overall, these microorganisms can travel at similar rates.
Similar transport and deposition behaviors among the microbial species in a mixed
culture enhance the efficiency and success of in situ bioremediation of TCE contaminated
plumes. This is especially true when successful bioremediation happens when the
dechlorinators (Dehalococcoides and Geobacter) and other microorganisms that support
nutrients for cell synthesis and electrons for redox reactions in the culture are all working
together.
6.1.2. Chapter 4. Comparison of the transport and deposition of Pseudomonas aeruginosa
under aerobic and anaerobic conditions
In this chapter, the role of oxygen tension on the growth and transport of a pathogenic
facultative bacterium P. aeruginosa was evaluated under aerobic and strictly anaerobic

179
conditions at different ionic strengths. Firstly, P. aeruginosa growth under anaerobic
conditions exhibited approxomately 1.19 and 1.23 times higher protein and
polysaccharides content as compared to growth under aerobic conditions as determined
by EPS analysis. This observation agreed with our hypothesis that growth under aerobic
and anaerobic conditions would produce different surface properties. Secondly, P.
aeruginosa transport was significantly retarded under aerobic conditions (C/C0 = 0.89,
0.61 and 0.44 at 1, 10 and 100 mM, respectively) as compared to anaerobic conditions
(C/C0 = 0.90, 0.74, 0.54 at 1, 10 and 100 mM, respectively). In addition, the bacterium
showed higher sensitivity to solution ionic strength changes under aerobic conditions as
shown by the reduced C/C0 when ionic strengths increased from 1 to 10, and 100 mM.
These observations supported our previous hypothesis that the differences in surface
properties would lead to different transport behaviors.
In practice, when predicting pathogen travel trajectory on a larger scale, it is important
to account for the gradient of dissolved oxygen concentration in natural aquifers, and
apply different deposition rates according to different oxygen concentrations.
6.1.3. Chapter 5. Filtration of Cryptosporidium oocysts surrogates in porous media:
Effects of flow rate, alum, and humic acid
In this chapter, the surface properties of glycoprotein modified microspheres were
examined to determine if they can be used as surrogates of viable Cryptosporidium. Then
the filtration of these microspheres was explored under different flow rates, together with
the effects of alum addition and HA adsorption on porous media surfaces.

180
As hypothesized, surface property measurement of the modified microspheres showed
good resemblance of the surrogates to viable Cryptosporidium, thus implying the high
possibility of utilizing these surrogates to perform studies to evaluate Cryptosporidium
removal, while eliminating personnel health hazards. Based on our results, removal was
best achieved when filtration was operated at a flow rate lower than 10.9 m/day, alum
addition of 5 mg/L and no HA adsorption on collector surfaces. This agreed with our
hypothesis.
Special attention should be paid when HA adsorbed on the collector surfaces because
of the increased transport as compared to conditions where no HA was adsorbed. The HA
in the filter bed may hamper the effective removal of Cryptosporidium during the
filtration process, which is usually considered a key process for removing protozoa
during water treatment.
6.2 Recommendations
The work in this dissertation points to several directions that deserve further
investigation, as follows:
(1) For in situ bioremediation applications, the large diversity of environmental
variables cannot be overlooked. Solution chemical composition, temperature,
solution pH, and surface interactions with the concurrent indigenous bacteria, are
all known to affect the fate of injected bacteria in the subsurface. In addition to the
three species in the mixed culture examined in this dissertation, transport studies
conducted with other microorganisms is also necessary for a more comprehensive
understanding. Use of porous media collected from natural aquifers can also enrich

181
the study. It would be interesting to explore the transport of the culture in the
presence of TCE at a longer trajectory and analyze the distribution of each species
in the porous media.
(2) In this dissertation, the fate of pathogenic bacteria in soil and groundwater was
based on P. aeruginosa; a wider selection of pathogens may be included when
exploring the effect of oxygen concentration on the travel ability in the subsurface.
Longer travel trajectory with continuous gradient of oxygen concentration and use
of various types of porous media is also an interesting aspect for future
investigation.
(3) In the water treatment application, the large diversity of environmental and
engineered variables, such as surface interactions with the concurrent bacteria in
raw water and filter bed, particulate matter, chemical composition and temperature
of the raw water are also important factors that influence the filter efficiency.
Studies evaluating these factors would also provide further validation of the
surrogates. It would also be interesting to investigate the removal rate at pilot scale
experiments in the presence of these variables.
182
References
CBC News (2010) Inside Walkerton: Canada's worst-ever E. coli contamination. The
shock, the investigation and the aftermath,URL
http://www.cbc.ca/news/canada/inside-walkerton-canada-s-worst-ever-e-coli-
contamination-1.887200 (last accessed 2015/09/28).
Abudalo, R.A., Ryan, J.N., Harvey, R.W., Metge, D.W. and Landkamer, L. (2010)
Influence of organic matter on the transport of Cryptosporidium parvum oocysts in
a ferric oxyhydroxide-coated quartz sand saturated porous medium. Water Research
44(4), 1104-1113.
Albinger, O., Biesemeyer, B.K., Arnold, R.G. and Logan, B.E. (1994) Effect of bacterial
heterogeneity on adhesion to uniform collectors by monoclonal populations. FEMS
Microbiology Letters 124(3), 321-326.
Alonso, A., Rojo, F. and Martinez, J.L. (1999) Environmental and clinical isolates of
Pseudomonas aeruginosa show pathogenic and biodegradative properties
irrespective of their origin. Environmental Microbiology 1(5), 421-430.
Amburgey, J.E. (2011) Removal of Cryptosporidium-sized polystyrene microspheres
from swimming pool water with a sand filter with and without added perlite filter
media. Journal of Environmental Engineering-Asce 137(12), 1205-1208.
Amburgey, J.E., Amirtharajah, A., York, M.T., Brouckaert, B.M., Spivey, N.C. and
Arrowood, M.J. (2005) Comparison of conventional and biological filter

183
performance for Cryptosporidium and microsphere removals. Journal American
Water Works Association 97(12), 77-91.
Baygents, J.C., Glynn, J.R., Albinger, O., Biesemeyer, B.K., Ogden, K.L. and Arnold,
R.G. (1998) Variation of surface charge density in monoclonal bacterial
populations: Implications for transport through porous media. Environmental
Science & Technology 32(11), 1596-1603.
Bergmire-Sweat, D., Morgan, J., Wilson, K., Von Alt, K., Marengo, L., Bennett, T., Lee,
Y., Tsang, V., MacKenzie, W. and Furness, B. (1999) Cryptosporidiosis at Brushy
Creek: Describing the epidemiology and causes of a large outbreak in Texas, 1998.
In Proceedings, International Conference on Emerging Infectious Diseases,
Milwaukee, WI. American Water Works Association, Denver, CO.
Bolster, C.H., Mills, A.L., Hornberger, G.M. and Herman, J.S. (1999) Spatial distribution
of deposited bacteria following miscible displacement experiments in intact cores.
Water Resources Research 35(6), 1797-1807.
Borriello, G., Werner, E., Roe, F., Kim, A.M., Ehrlich, G.D. and Stewart, P.S. (2004)
Oxygen limitation contributes to antibiotic tolerance of Pseudomonas aeruginosa in
biofilms. Antimicrobial Agents and Chemotherapy 48(7), 2659-2664.
Bradford, S.A. and Bettahar, M. (2005) Straining, attachment, and detachment of
Cryptosporidium oocysts in saturated porous media. Journal of Environmental
Quality 34(2), 469-478.

184
Bradford, S.A., Bettahar, M., Simunek, J. and van Genuchten, M.T. (2004) Straining and
attachment of colloids in physically heterogeneous porous media. Vadose Zone
Journal 3(2), 384-394.
Bradford, S.A., Simunek, J., Bettahar, M., Tadassa, Y.F., van Genuchten, M.T. and Yates,
S.R. (2005) Straining of colloids at textural interfaces. Water Resources Research
41(10).
Bradford, S.A., Simunek, J., Bettahar, M., van Genuchten, M.T. and Yates, S.R. (2003)
Modeling colloid attachment, straining, and exclusion in saturated porous media.
Environmental Science & Technology 37(10), 2242-2250.
Bradford, S.A. and Torkzaban, S. (2008) Colloid transport and retention in unsaturated
porous media: A review of interface-, collector-, and pore-scale processes and
models. Vadose Zone Journal 7(2), 667-681.
Bradford, S.A., Torkzaban, S. and Walker, S.L. (2007) Coupling of physical and
chemical mechanisms of colloid straining in saturated porous media. Water
Research 41(13), 3012-3024.
Bradford, S.A., Yates, S.R., Bettahar, M. and Simunek, J. (2002) Physical factors
affecting the transport and fate of colloids in saturated porous media. Water
Resources Research 38(12), 63-61-63-12.
Busch, P.L. and Stumm, W. (1968) Chemical interactions in the aggregation of bacteria
bioflocculation in waste treatment. Environmental Science & Technology 2(1), 49-
53.

185
Bustamante, H.A., Shanker, S.R., Pashley, R.M. and Karaman, M.E. (2001) Interaction
between Cryptosporidium oocysts and water treatment coagulants. Water Research
35(13), 3179-3189.
Camesano, T.A. and Logan, B.E. (1998) Influence of fluid velocity and cell concentration
on the transport of motile and nonmotile bacteria in porous media. Environmental
Science & Technology 32(11), 1699-1708.
Camesano, T.A., Unice, K.M. and Logan, B.E. (1999) Blocking and ripening of colloids
in porous media and their implications for bacterial transport. Colloids and Surfaces
A-Physicochemical and Engineering Aspects 160(3), 291-308.
Castro, F.D. and Tufenkji, N. (2008) Role of oxygen tension on the transport and
retention of two pathogenic bacteria in saturated porous media. Environmental
Science & Technology 42(24), 9178-9183.
CDC (2013) Surveillance for waterborne disease outbreaks associated with drinking
water and other nonrecreational water-United States, 2009-2010., pp. 714-720.
Chen, G., Bedi, R.S., Yan, Y.S. and Walker, S.L. (2010a) Initial colloid deposition on
bare and zeolite-coated stainless steel and aluminum: Influence of surface
roughness. Langmuir 26(15), 12605-12613.
Chen, G., Hong, Y. and Walker, S.L. (2010b) Colloidal and bacterial deposition: Role of
gravity. Langmuir 26(1), 314-319.

186
Chen, G. and Walker, S.L. (2007) Role of solution chemistry and ion valence on the
adhesion kinetics of groundwater and marine bacteria. Langmuir 23(13), 7162-7169.
Chen, G. and Walker, S.L. (2012) Fecal indicator bacteria transport and deposition in
saturated and unsaturated porous media. Environmental Science & Technology
46(16), 8782-8790.
Chen, K.L. and Elimelech, M. (2007) Influence of humic acid on the aggregation kinetics
of fullerene (C 60) nanoparticles in monovalent and divalent electrolyte solutions.
Journal of Colloid and Interface Science 309(1), 126-134.
Chung, J. (2012) Development of fluorescently labelled Cryptosporidium oocyst
surrogates to test the efficacy of sand filtration processes, Ph.d thesis, University of
New South Wales.
Clancy, J.L., Bukhari, Z., Hargy, T.M., Bolton, J.R., Dussert, B.W. and Marshall, M.M.
(2000) Using UV to inactivate Cryptosporidium. Journal American Water Works
Association 92(9), 97-104.
Costas, K., Knorr, R.S. and Condon, S.K. (2002) A case–control study of childhood
leukemia in Woburn, Massachusetts: The relationship between leukemia incidence
and exposure to public drinking water. Science of The Total Environment 300(1),
23-35.
Costerton, J.W., Lewandowski, Z., Caldwell, D.E., Korber, D.R. and Lappin-Scott, H.M.
(1995) Microbial biofilms. Annual Reviews in Microbiology 49(1), 711-745.

187
Craun, G.F., Brunkard, J.M., Yoder, J.S., Roberts, V.A., Carpenter, J., Wade, T.,
Calderon, R.L., Roberts, J.M., Beach, M.J. and Roy, S.L. (2010) Causes of
outbreaks associated with drinking water in the United States from 1971 to 2006.
Clinical Microbiology Reviews 23(3), 507-528.
Crittenden, J.C., Trussell, R.R., Hand, D.W., Howe, K.J. and Tchobanoglous, G. (2012)
MWH's Water Treatment: Principles and Design: Principles and Design, John
Wiley & Sons.
Cutter, L.A., van Schie, P.M. and Fletcher, M. (2003) Adhesion of anaerobic
microorganisms to solid surfaces and the effect of sequential attachment on
adhesion characteristics. Biofouling 19(1), 9-18.
Dai, X. and Hozalski, R.M. (2003) Evaluation of microspheres as surrogates for
Cryptosporidium parvum oocysts in filtration experiments. Environmental Science
& Technology 37(5), 1037-1042.
de Kerchove, A.J. and Elimelech, M. (2007) Impact of alginate conditioning film on
deposition kinetics of motile and nonmotile Pseudomonas aeruginosa strains.
Applied and Environmental Microbiology 73(16), 5227-5234.
De Kerchove, A.J. and Elimelech, M. (2008) Bacterial swimming motility enhances cell
deposition and surface coverage. Environmental Science & Technology 42(12),
4371-4377.
de Kievit, T.R. and Iglewski, B.H. (2000) Bacterial quorum sensing in pathogenic
relationships. Infection and Immunity 68(9), 4839-4849.

188
DeFlaun, M.F. and Condee, C.W. (1997) Electrokinetic transport of bacteria. Journal of
Hazardous Materials 55(1-3), 263-277.
DeFlaun, M.F., Oppenheimer, S.R., Streger, S., Condee, C.W. and Fletcher, M. (1999)
Alterations in adhesion, transport, and membrane characteristics in an adhesion-
deficient pseudomonad. Applied and Environmental Microbiology 65(2), 759-765.
Denyer, S.P., Davies, M.C., Evans, J.A., Finch, R.G., Smith, D.G.E., Wilcox, M.H. and
Williams, P. (1990) Influence of carbon-dioxide on the surface characteristics and
adherence potential of coagulase-negative staphylococci. Journal of Clinical
Microbiology 28(8), 1813-1817.
Derjaguin, B. and Landau, L. (1941) Theory of the stability of strongly charged
lyophobic sols and of the adhesion of strongly charged-particles in solutions of
electrolytes. Progress in Surface Science 43(1-4), 30-59.
Dong, H. and Lo, I.M.C. (2013) Influence of calcium ions on the colloidal stability of
surface-modified nano zero-valent iron in the absence or presence of humic acid.
Water Research 47(7), 2489-2496.
Dubois, M., Gilles, K.A., Hamilton, J.K., Rebers, P.A. and Smith, F. (1956) Colorimetric
method for determination of sugars and related substances. Analytical Chemistry
28(3), 350-356.
Duhamel, M. and Edwards, E.A. (2006) Microbial composition of chlorinated ethene-
degrading cultures dominated by Dehalococcoides. FEMS Microbiology Ecology
58(3), 538-549.

189
Duhamel, M. and Edwards, E.A. (2007) Growth and yields of dechlorinators, acetogens,
and methanogens during reductive dechlorination of chlorinated ethenes and
dihaloelimination of 1,2-dichloroethane. Environmental Science & Technology
41(7), 2303-2310.
Duhamel, M., Mo, K. and Edwards, E.A. (2004) Characterization of a highly enriched
Dehalococcoides-containing culture that grows on vinyl chloride and
trichloroethene. Applied and Environmental Microbiology 70(9), 5538-5545.
Duhamel, M., Wehr, S.D., Yu, L., Rizvi, H., Seepersad, D., Dworatzek, S., Cox, E.E. and
Edwards, E.A. (2002) Comparison of anaerobic dechlorinating enrichment cultures
maintained on tetrachloroethene, trichloroethene, cis-dichloroethene and vinyl
chloride. Water Research 36(17), 4193-4202.
Edwards, E.A. and Grbicgalic, D. (1994) Anaerobic degradation of toluene and o-xylene
by a methanogenic consortium. Applied and Environmental Microbiology 60(1),
313-322.
Elimelech, M. (1998) Particle Deposition and Aggregation : Measurement, Modelling,
and Simulation, Butterworth-Heinemann, Oxford, England.
Elimelech, M. and Omelia, C.R. (1990) Effect of particle-size on collision efficiency in
the deposition of brownian particles with electrostatic energy barriers. Langmuir
6(6), 1153-1163.

190
Ellery, W.N. and Schleyer, M.H. (1984) Comparison of homogenization and
ultrasonication as techniques in extracting attached sedimentary bacteria. Marine
Ecology Progress Series 15(3), 247-250.
Emelko, M.B. and Huck, P.M. (2004) Microspheres as surrogates for Cryptosporidium
filtration. Journal American Water Works Association 96(3), 94-105.
Fein, J.B., Boily, J.-F., Güçlü, K. and Kaulbach, E. (1999) Experimental study of humic
acid adsorption onto bacteria and Al-oxide mineral surfaces. Chemical Geology
162(1), 33-45.
Finch, G., Black, E., Gyürék, L. and Belosevic, M. (1993) Ozone inactivation of
Cryptosporidium parvum in demand-free phosphate buffer determined by in vitro
excystation and animal infectivity. Applied and Environmental Microbiology
59(12), 4203-4210.
Foppen, J.W., Liem, Y. and Schijven, J. (2008) Effect of humic acid on the attachment of
Escherichia coli in columns of goethite-coated sand. Water Research 42(1-2), 211-
219.
Foppen, J.W.A., Okletey, S. and Schijven, J.F. (2006) Effect of goethite coating and
humic acid on the transport of bacteriophage PRD1 in columns of saturated sand.
Journal of Contaminant Hydrology 85(3–4), 287-301.
Friis, A.K., Heimann, A.C., Jakobsen, R., Albrechtsen, H.-J., Cox, E. and Bjerg, P.L.
(2007) Temperature dependence of anaerobic TCE-dechlorination in a highly
enriched Dehalococcoides-containing culture. Water Research 41(2), 355-364.

191
Frolund, B., Griebe, T. and Nielsen, P.H. (1995) Enzymatic-activity in the activated-
sludge floc matrix. Applied Microbiology and Biotechnology 43(4), 755-761.
Frymier, P.D., Ford, R.M., Berg, H.C. and Cummings, P.T. (1995) 3-Dimensional
tracking of motile bacteria near a solid planar surface. Proceedings of the National
Academy of Sciences of the United States of America 92(13), 6195-6199.
Gitis, V. (2008) Rapid sand filtration of Cryptosporidium parvum: Effects of media depth
and coagulation. Water Science & Technology: Water Supply 8(2).
Gleick, P.H. (ed) (1993) Water in Crisis: A Guide to the World's Fresh Water Resources,
Oxford University Press, New York.
Gollnitz, W.D., Clancy, J.L. and Garner, S.C. (1997) Reduction of microscopic
particulates by aquifers. American Water Works Association Journal 89(11), 84-93.
Gomez-Suarez, C., Pasma, J., van der Borden, A.J., Wingender, J., Flemming, H.C.,
Busscher, H.J. and van der Mei, H.C. (2002) Influence of extracellular polymeric
substances on deposition and redeposition of Pseudomonas aeruginosa to surfaces.
Microbiology-Sgm 148, 1161-1169.
Gottinger, A.M., Bhat, S.V., McMartin, D.W. and Dahms, T.E.S. (2013) Fluorescent
microspheres as surrogates to assess oocyst removal efficacy from a modified slow
sand biofiltration water treatment system. Journal of Water Supply: Research and
Technology -- AQUA 62(3), 129-137.

192
Gregory, J. (1981) Approximate expressions for retarded vanderwaals interaction. Journal
of Colloid and Interface Science 83(1), 138-145.
Gross, M.J. and Logan, B.E. (1995) Influence of different chemical treatments on
transport of Alcaligenes paradoxus in porous-media. Applied and Environmental
Microbiology 61(5), 1750-1756.
Haferburg, D., Hommel, R., Claus, R. and Kleber, H.P. Extracellular microbial lipids as
biosurfactants. In Bioproducts, (1986) Fiechter, A. (ed), pp. 53-93.
Haggblom, M.M. and Bossert, I.D. (2003) Dehalogenation: Microbial Processes and
Environmental Applications, Springer.
Harvey, R., Metge, D., Sheets, R. and Jasperse, J. (2009) Fluorescent microspheres as
surrogates in evaluating the efficacy of riverbank filtration for removing
Cryptosporidium parvum oocysts and other pathogens. In Riverbank Filtration for
Water Security in Desert Countries. Ray, C. and Shamrukh, M. (eds), pp. 81-96.
Harvey, R.W., George, L.H., Smith, R.L. and LeBlanc, D.R. (1989) Transport of
microspheres and indigenous bacteria through a sandy aquifer: Results of natural-
and forced-gradient tracer experiments. Environmental Science & Technology
23(1), 51-56.
Harvey, R.W., Metge, D.W., Barber, L. and Aiken, G.R. (2010) Effects of altered
groundwater chemistry upon the pH-dependency and magnitude of bacterial
attachment during transport within an organically contaminated sandy aquifer.
Water Research 44(4), 1062-1071.
193
Harvey, R.W., Metge, D.W., Shapiro, A.M., Renken, R.A., Osborn, C.L., Ryan, J.N.,
Cunningham, K.J. and Landkamer, L. (2008) Pathogen and chemical transport in
the karst limestone of the Biscayne aquifer: 3. Use of microspheres to estimate the
transport potential of Cryptosporidium parvum oocysts. Water Resources Research
44(8).
Haznedaroglu, B.Z., Kim, H.N., Bradford, S.A. and Walker, S.L. (2009) Relative
transport behavior of Escherichia coli O157:H7 and Salmonella enterica serovar
pullorum in packed bed column systems: Influence of solution chemistry and cell
concentration. Environmental Science & Technology 43(6), 1838-1844.
He, J.Z., Ritalahti, K.M., Aiello, M.R. and Loffler, F.E. (2003a) Complete detoxification
of vinyl chloride by an anaerobic enrichment culture and identification of the
reductively dechlorinating population as a Dehalococcoides species. Applied and
Environmental Microbiology 69(2), 996-1003.
He, J.Z., Ritalahti, K.M., Yang, K.L., Koenigsberg, S.S. and Loffler, F.E. (2003b)
Detoxification of vinyl chloride to ethene coupled to growth of an anaerobic
bacterium. Nature 424(6944), 62-65.
Hermansson, M. (1999) The DLVO theory in microbial adhesion. Colloids and Surfaces
B-Biointerfaces 14(1-4), 105-119.
Hoek, E.M., Bhattacharjee, S. and Elimelech, M. (2003) Effect of membrane surface
roughness on colloid-membrane DLVO interactions. Langmuir 19(11), 4836-4847.

194
Hoek, E.M.V. and Agarwal, G.K. (2006) Extended DLVO interactions between spherical
particles and rough surfaces. Journal of Colloid and Interface Science 298(1), 50-58.
Hogg, R., Healy, T.W. and Fuersten.Dw (1966) Mutual coagulation of colloidal
dispersions. Transactions of the Faraday Society 62(522P), 1638-1651.
Hsu, B.-M., Huang, C. and Pan, J.R. (2001) Filtration behaviors of Giardia and
Cryptosporidium—ionic strength and pH effects. Water Research 35(16), 3777-
3782.
Huck, P.M., Coffey, B.M., Emelko, M.B., Maurizio, D.D., Slawson, R.M., Anderson,
W.B., Van Den Oever, J., Douglas, I.P. and O'Melia, C.R. (2002) Effects of filter
operation on Cryptosporidium removal. Journal-American Water Works
Association 94(6), 97-111.
Hwang, G., Kang, S., El-Din, M.G. and Liu, Y. (2012) Impact of an extracellular
polymeric substance (EPS) precoating on the initial adhesion of Burkholderia
cepacia and Pseudomonas aeruginosa. Biofouling 28(6), 525-538.
Israelachvili, J.N. (2011) Intermolecular and Surface Forces, 3rd ed, Academic Press,
Burlington, MA.
Jenneman, G.E., McInerney, M.J. and Knapp, R.M. (1985) Microbial penetration through
nutrient-saturated berea sandstone. Applied and Environmental Microbiology 50(2),
383-391.

195
Karamalidis, A., Evangelou, A., Karabika, E., Koukkou, A., Drainas, C. and Voudrias, E.
(2010) Laboratory scale bioremediation of petroleum-contaminated soil by
indigenous microorganisms and added Pseudomonas aeruginosa strain Spet.
Bioresource Technology 101(16), 6545-6552.
Karanis, P. and Kimura, A. (2002) Evaluation of three flocculation methods for the
purification of Cryptosporidium parvum oocysts from water samples. Letters in
Applied Microbiology 34(6), 444-449.
Kim, H.-J., Phenrat, T., Tilton, R.D. and Lowry, G.V. (2012) Effect of kaolinite, silica
fines and pH on transport of polymer-modified zero valent iron nano-particles in
heterogeneous porous media. Journal of Colloid and Interface Science 370(1), 1-10.
Kim, H.N., Bradford, S.A. and Walker, S.L. (2009) Escherichia coli O157:H7 transport
in saturated porous media: Role of solution chemistry and surface macromolecules.
Environmental Science & Technology 43(12), 4340-4347.
Kim, H.N., Walker, S.L. and Bradford, S.A. (2010) Coupled factors influencing the
transport and retention of Cryptosporidium parvum oocysts in saturated porous
media. Water Research 44(4), 1213-1223.
Kim, J. and Tobiason, J.E. (2004) Particles in filter effluent: The roles of deposition and
detachment. Environmental Science & Technology 38(22), 6132-6138.
Korber, D.R., Lawrence, J.R. and Caldwell, D.E. (1994) Effect of motility on surface
colonization and reproductive success of Pseudomonas-fluorescens in dual-dilution

196
continuous-culture and batch culture systems. Applied and Environmental
Microbiology 60(5), 1421-1429.
Kozlova, N. and Santore, M.M. (2006) Manipulation of micrometer-scale adhesion by
tuning nanometer-scale surface features. Langmuir 22(3), 1135-1142.
Kuznar, Z.A. and Elimelech, M. (2006) Cryptosporidium oocyst surface macromolecules
significantly hinder oocyst attachment. Environmental Science & Technology 40(6),
1837-1842.
Landini, P. and Zehnder, A.J. (2002) The global regulatory hns gene negatively affects
adhesion to solid surfaces by anaerobically grown Escherichia coli by modulating
expression of flagellar genes and lipopolysaccharide production. Journal of
Bacteriology 184(6), 1522-1529.
Lemming, G., Hauschild, M.Z., Chambon, J., Binning, P.J., Bulle, C., Margni, M. and
Bjerg, P.L. (2010) Environmental impacts of remediation of a trichloroethene-
contaminated site: Life cycle assessment of remediation alternatives.
Environmental Science & Technology 44(23), 9163-9169.
Lerner, R.N., Lu, Q., Zeng, H. and Liu, Y. (2012) The effects of biofilm on the transport
of stabilized zerovalent iron nanoparticles in saturated porous media. Water
Research 46(4), 975-985.
Li, J., McLellan, S. and Ogawa, S. (2006) Accumulation and fate of green fluorescent
labeled Escherichia coli in laboratory-scale drinking water biofilters. Water
Research 40(16), 3023-3028.

197
Li, X.Q., Scheibe, T.D. and Johnson, W.P. (2004) Apparent decreases in colloid
deposition rate coefficients with distance of transport under unfavorable deposition
conditions: A general phenomenon. Environmental Science & Technology 38(21),
5616-5625.
Li, X.Q., Zhang, P.F., Lin, C.L. and Johnson, W.P. (2005) Role of hydrodynamic drag on
microsphere deposition and re-entrainment in porous media under unfavorable
conditions. Environmental Science & Technology 39(11), 4012-4020.
Liu, Q., Lazouskaya, V., He, Q. and Jin, Y. (2010) Effect of particle shape on colloid
retention and release in saturated porous media. Journal of Environmental Quality
39(2), 500-508.
Liu, X., Wazne, M., Chou, T., Xiao, R. and Xu, S. (2011) Influence of Ca(2+) and
Suwannee River Humic Acid on aggregation of silicon nanoparticles in aqueous
media. Water Research 45(1), 105-112.
Liu, Y. (2013) Polymer Adhesion, Friction, and Lubrication, pp. 575-616, John Wiley &
Sons, Inc.
Liu, Y., Janjaroen, D., Kuhlenschmidt, M.S., Kuhlenschmidt, T.B. and Nguyen, T.H.
(2009) Deposition of Cryptosporidium parvum oocysts on natural organic matter
surfaces: Microscopic evidence for secondary minimum deposition in a radial
stagnation point flow cell. Langmuir 25(3), 1594-1605.

198
Liu, Y. and Li, J. (2008) Role of Pseudomonas aeruginosa biofilm in the initial adhesion,
growth and detachment of Escherichia coli in porous media. Environmental
Science & Technology 42(2), 443-449.
Liu, Y., Yang, C.-H. and Li, J. (2007) Influence of extracellular polymeric substances on
Pseudomonas aeruginosa transport and deposition profiles in porous media.
Environmental Science & Technology 41(1), 198-205.
Liu, Y., Yang, C.-H. and Li, J. (2008) Adhesion and retention of a bacterial
phytopathogen Erwinia chrysanthemi in biofilm-coated porous media.
Environmental Science & Technology 42(1), 159-165.
Loffler, F.E. and Edwards, E.A. (2006) Harnessing microbial activities for environmental
cleanup. Current Opinion in Biotechnology 17(3), 274-284.
Lomans, B.P., Maas, R., Luderer, R., den Camp, H., Pol, A., van der Drift, C. and Vogels,
G.D. (1999) Isolation and characterization of Methanomethylovorans hollandica
gen. nov., sp nov., isolated from freshwater sediment, a methylotrophic methanogen
able to grow on dimethyl sulfide and methanethiol. Applied and Environmental
Microbiology 65(8), 3641-3650.
Lowry, O.H., Rosebrough, N.J., Farr, A.L. and Randall, R.J. (1951) Protein measurement
with the folin phenol reagent. Journal of Biological Chemistry 193(1), 265-275.
Lu, Q., Wang, J., Faghihnejad, A., Zeng, H. and Liu, Y. (2011) Understanding the
molecular interactions of lipopolysaccharides during E. coli initial adhesion with a
surface forces apparatus. Soft Matter 7(19), 9366-9379.
199
Makin, S.A. and Beveridge, A.J. (1996) Pseudomonas aeruginosa PAO1 ceases to
express serotype-specific lipopolysaccharide at 45 degrees oC. Journal of
Bacteriology 178(11), 3350-3352.
Marcus, I.M., Herzberg, M., Walker, S.L. and Freger, V. (2012) Pseudomonas
aeruginosa attachment on QCM-D sensors: The role of cell and surface
hydrophobicities. Langmuir 28(15), 6396-6402.
Marshall, K., STOUT, R. and Mitchell, R. (1971) Mechanism of the initial events in the
sorption of marine bacteria to surfaces. Journal of General Microbiology 68(3),
337-348.
Martin, M.J., Logan, B.E., Johnson, W.P., Jewett, D.G. and Arnold, R.G. (1996) Scaling
bacterial filtration rates in different sized porous media. Journal of Environmental
Engineering 122(5), 407-415.
Martin, R.E., Bouwer, E.J. and Hanna, L.M. (1992) Application of clean-bed filtration
theory to bacterial deposition in porous-media. Environmental Science &
Technology 26(5), 1053-1058.
McCaulou, D.R., Bales, R.C. and Arnold, R.G. (1995) Effect of temperature-controlled
motility on transport of bacteria and microspheres through saturated sediment.
Water Resources Research 31(2), 271-280.
McDade, J.M., McGuire, T.M. and Newell, C.J. (2005) Analysis of DNAPL source-
depletion costs at 36 field sites. Remediation Journal 15(2), 9-18.
200
McEldowney, S. and Fletcher, M. (1986) Effect of growth-conditions and surface
characteristics of aquatic bacteria on their attachment to solid-surfaces. Journal of
General Microbiology 132, 513-523.
Mclaughlin, T. (2000) Walkerton E. coli outbreak declared over. The Globe and Mail,
URL http://www.theglobeandmail.com/news/national/walkerton-e-coli-outbreak-
declared-over/article1041067/ (last accessed 2015/09/28).
Muhammad, N., Sinha, R., Krishnan, E.R., Piao, H., Patterson, C.L., Cotruvo, J.,
Cumberland, S.L., Nero, V.P. and Delandra, C. (2008) Evaluating surrogates for
Cryptosporidium removal in point-of-use systems. Journal American Water Works
Association 100(12), 98-107.
Mundle, S.O.C., Johnson, T., Lacrampe-Couloume, G., Perez-de-Mora, A., Duhamel, M.,
Edwards, E.A., McMaster, M.L., Cox, E., Revesz, K. and Lollar, B.S. (2012)
Monitoring biodegradation of ethene and bioremediation of chlorinated ethenes at a
contaminated site using compound-specific isotope analysis (CSIA). Environmental
Science & Technology 46(3), 1731-1738.
Nelson, M.J.K., Montgomery, S.O., Oneill, E.J. and Pritchard, P.H. (1986) Aerobic
metabolism of trichloroethylene by a bacterial isolate. Applied and Environmental
Microbiology 52(2), 383-384.
Norde, W. and Lyklema, J. (1989) Protein adsorption and bacterial adhesion to solid
surfaces: A colloid-chemical approach. Colloids and Surfaces 38(1), 1-13.

201
Palmer, K.L., Brown, S.A. and Whiteley, M. (2007) Membrane-bound nitrate reductase is
required for anaerobic growth in cystic fibrosis sputum. Journal of Bacteriology
189(12), 4449-4455.
Pang, L., Nowostawska, U., Ryan, J.N., Williamson, W.M., Walshe, G. and Hunter, K.A.
(2009) Modifying the surface charge of pathogen-sized microspheres for studying
pathogen transport in groundwater. Journal of Environmental Quality 38(6), 2210-
2217.
Pang, L., Nowostawska, U., Weaver, L., Hoffman, G., Karmacharya, A., Skinner, A. and
Karki, N. (2012) Biotin- and glycoprotein-coated microspheres: Potential
surrogates for studying filtration of Cryptosporidium parvum in porous media.
Environmental Science & Technology 46(21), 11779-11787.
Parsek, M.R. and Fuqua, C. (2004) Biofilms 2003: Emerging themes and challenges in
studies of surface-associated microbial life. Journal of Bacteriology 186(14), 4427-
4440.
Pazmino, E., Trauscht, J., Dame, B. and Johnson, W.P. (2014) Power law size-distributed
heterogeneity explains colloid retention on soda lime glass in the presence of
energy barriers. Langmuir 30(19), 5412-5421.
Peale, J.G.D., Bakkom, E., Lakhwala, F., Mueller, J. and Molin, J. (2008) TCE plume
remediation via ISCR-enhanced bioremediation utilizing EHC® and KB-1
®.
Remediation Journal, 18(4), 19-31.

202
Pier, G.B., Grout, M., Zaidi, T.S., Olsen, J.C., Johnson, L.G., Yankaskas, J.R. and
Goldberg, J.B. (1996) Role of mutant CFTR in hypersusceptibility of cystic fibrosis
patients to lung infections. Science 271(5245), 64-67.
Pradier, C.M., Rubio, C., Poleunis, C., Bertrand, P., Marcus, P. and Compere, C. (2005)
Surface characterization of three marine bacterial strains by Fourier transform IR,
X-ray photoelectron spectroscopy, and time-of-flight secondary-ion mass
spectrometry, correlation with adhesion on stainless steel surfaces. Journal of
Physical Chemistry B 109(19), 9540-9549.
Pringle, J.H. and Fletcher, M. (1986) Influence of substratum hydration and adsorbed
macromolecules on bacterial attachment to surfaces. Applied and Environmental
Microbiology 51(6), 1321-1325.
Pringle, J.H., Fletcher, M. and Ellwood, D.C. (1983) Selection of Attachment mutants
during the continuous culture of Pseudomonas-fluorescens and relationship
between attachment ability and surface-composition. Journal of General
Microbiology 129, 2557-2569.
Redman, J.A., Estes, M.K. and Grant, S.B. (2001a) Resolving macroscale and microscale
heterogeneity in virus filtration. Colloids and Surfaces A: Physicochemical and
Engineering Aspects 191(1–2), 57-70.
Redman, J.A., Grant, S.B., Olson, T.M. and Estes, M.K. (2001b) Pathogen filtration,
heterogeneity, and the potable reuse of wastewater. Environmental Science &
Technology 35(9), 1798-1805.

203
Redman, J.A., Walker, S.L. and Elimelech, M. (2004) Bacterial adhesion and transport in
porous media: Role of the secondary energy minimum. Environmental Science &
Technology 38(6), 1777-1785.
Sabra, W., Lunsdorf, H. and Zeng, A.P. (2003) Alterations in the formation of
lipopolysaccharide and membrane vesicles on the surface of Pseudomonas
aeruginosa PAO1 under oxygen stress conditions. Microbiology-Sgm 149, 2789-
2795.
Saleh, N., Kim, H.-J., Phenrat, T., Matyjaszewski, K., Tilton, R.D. and Lowry, G.V.
(2008) Ionic strength and composition affect the mobility of surface-modified FeO
nanoparticles in water-saturated sand columns. Environmental Science &
Technology 42(9), 3349-3355.
Salerno, M.B., Flamm, M., Logan, B.E. and Velegol, D. (2006) Transport of rodlike
colloids through packed beds. Environmental Science & Technology 40(20), 6336-
6340.
Salerno, M.B., Li, X. and Logan, B.E. (2007) Adhesion characteristics of two
Burkholderia cepacia strains examined using colloid probe microscopy and
gradient force analysis. Colloids and Surfaces B-Biointerfaces 59(1), 46-51.
Schäfer, A., Harms, H. and Zehnder, A.J. (1998) Bacterial accumulation at the air-water
interface. Environmental Science & Technology 32(23), 3704-3712.
204
Schafer, A., Ustohal, P., Harms, H., Stauffer, F., Dracos, T. and Zehnder, A.J.B. (1998)
Transport of bacteria in unsaturated porous media. Journal of Contaminant
Hydrology 33(1-2), 149-169.
Scheutz, C., Broholm, M.M., Durant, N.D., Weeth, E.B., Jorgensen, T.H., Dennis, P.,
Jacobsen, C.S., Cox, E.E., Chambon, J.C. and Bjerg, P.L. (2010) Field evaluation
of biological enhanced reductive dechlorination of chloroethenes in clayey till.
Environmental Science & Technology 44(13), 5134-5141.
Schmid, K., Kaufmann, H., Isemura, S., Bauer, F., Emura, J., Motoyama, T., Ishiguro, M.
and Nanno, S. (1973) Sturcture of alpha1-acid glycoprotein - Complete amino acid
sequence, multiple amino acid substitutions, and homology with the
immunoglobulins. Biochemistry 12(14), 2711-2724.
Schobert, M. and Jahn, D. (2010) Anaerobic physiology of Pseudomonas aeruginosa in
the cystic fibrosis lung. International Journal of Medical Microbiology 300(8), 549-
556.
Seymour, M.B., Chen, G.X., Su, C.M. and Li, Y.S. (2013) Transport and retention of
colloids in porous media: Does shape really matter? Environmental Science &
Technology 47(15), 8391-8398.
Shapiro, J.A. and Dworkin, M. (1997) Bacteria as Multicellular Organisms, Oxford
University Press Oxford, UK.

205
Silliman, S.E., Dunlap, R., Fletcher, M. and Schneegurt, M.A. (2001) Bacterial transport
in heterogeneous porous media: Observations from laboratory experiments. Water
Resources Research 37(11), 2699-2707.
Simoni, S.F., Bosma, T.N.P., Harms, H. and Zehnder, A.J.B. (2000) Bivalent cations
increase both the subpopulation of adhering bacteria and their adhesion efficiency
in sand columns. Environmental Science & Technology 34(6), 1011-1017.
Simoni, S.F., Harms, H., Bosma, T.N.P. and Zehnder, A.J.B. (1998) Population
heterogeneity affects transport of bacteria through sand columns at low flow rates.
Environmental Science & Technology 32(14), 2100-2105.
Singh, P.K., Schaefer, A.L., Parsek, M.R., Moninger, T.O., Welsh, M.J. and Greenberg,
E.P. (2000) Quorum-sensing signals indicate that cystic fibrosis lungs are infected
with bacterial biofilms. Nature 407(6805), 762-764.
Steffan, R.J., Sperry, K.L., Walsh, M.T., Vainberg, S. and Condee, C.W. (1999) Field-
scale evaluation of in situ bioaugmentation for remediation of chlorinated solvents
in groundwater. Environmental Science & Technology 33(16), 2771-2781.
Sung, Y., Fletcher, K.F., Ritalaliti, K.M., Apkarian, R.P., Ramos-Hernandez, N., Sanford,
R.A., Mesbah, N.M. and Loffler, F.E. (2006) Geobacter lovleyi sp. nov. strain SZ, a
novel metal-reducing and tetrachloroethene-dechlorinating bacterium. Applied and
Environmental Microbiology 72(4), 2775-2782.
Sutherland, I.W. (1983) Microbial exopolysaccharides - their role in microbial adhesion
in aqueous systems. CRC Critical Reviews in Microbiology 10(2), 173-201.

206
Syngouna, V.I. and Chrysikopoulos, C.V. (2011) Transport of biocolloids in water
saturated columns packed with sand: Effect of grain size and pore water velocity.
Journal of Contaminant Hydrology 126(3–4), 301-314.
Tong, M. and Johnson, W.P. (2006) Excess colloid retention in porous media as a
function of colloid size, fluid velocity, and grain angularity. Environmental Science
& Technology 40(24), 7725-7731.
Tong, M. and Johnson, W.P. (2007) Colloid population heterogeneity drives
hyperexponential deviation from classic filtration theory. Environmental Science &
Technology 41(2), 493-499.
Tong, M.P., Camesano, T.A. and Johnson, W.P. (2005) Spatial variation in deposition
rate coefficients of an adhesion-deficient bacterial strain in quartz sand.
Environmental Science & Technology 39(10), 3679-3687.
Torkzaban, S., Bradford, S.A. and Walker, S.L. (2007) Resolving the coupled effects of
hydrodynamics and DLVO forces on colloid attachment in porous media. Langmuir
23(19), 9652-9660.
Torkzaban, S., Tazehkand, S.S., Walker, S.L. and Bradford, S.A. (2008) Transport and
fate of bacteria in porous media: Coupled effects of chemical conditions and pore
space geometry. Water Resources Research 44(4).
Tosteson, T.R., Revuelta, R., Zaidi, B.R., Imam, S.H. and Bard, R.F. (1985) Aggregation
adhesion enhancing macromolecules and the specificity of marine microbial surface
interactions. Journal of Colloid and Interface Science 104(1), 60-71.

207
Tufenkji, N. and Elimelech, M. (2004a) Correlation equation for predicting single-
collector efficiency in physicochemical filtration in saturated porous media.
Environmental Science & Technology 38(2), 529-536.
Tufenkji, N. and Elimelech, M. (2004b) Deviation from the classical colloid filtration
theory in the presence of repulsive DLVO interactions. Langmuir 20(25), 10818-
10828.
Tufenkji, N. and Elimelech, M. (2005a) Breakdown of colloid filtration theory: Role of
the secondary energy minimum and surface charge heterogeneities. Langmuir 21(3),
841-852.
Tufenkji, N. and Elimelech, M. (2005b) Spatial distributions of Cryptosporidium oocysts
in porous media: Evidence for dual mode deposition. Environmental Science &
Technology 39(10), 3620-3629.
Tufenkji, N., Miller, G.F., Ryan, J.N., Harvey, R.W. and Elimelech, M. (2004) Transport
of Cryptosporidium oocysts in porous media: Role of straining and
physicochemical filtration. Environmental Science & Technology 38(22), 5932-
5938.
Tufenkji, N., Redman, J.A. and Elimelech, M. (2003) Interpreting deposition patterns of
microbial particles in laboratory-scale column experiments. Environmental Science
& Technology 37(3), 616-623.
Tufenkji, N., Ryan, J.N. and Elimelech, M. (2002) The promise of bank filtration.
Environmental Science & Technology 36(21), 422A-428A.

208
van der Mei, H.C., de Vries, J. and Busscher, H.J. (2000) X-ray photoelectron
spectroscopy for the study of microbial cell surfaces. Surface Science Reports 39(1),
1-24.
van Schie, P.M. and Fletcher, M. (1999) Adhesion of biodegradative anaerobic bacteria
to solid surfaces. Applied and Environmental Microbiology 65(11), 5082-5088.
Verwey, E.J.W. (1948) Theory of the Stability of lyophobic colloids. Journal of Physical
and Colloid Chemistry 51(3), 631-636.
Vigeant, M.A.S. and Ford, R.M. (1997) Interactions between motile Escherichia coli and
glass in media with various ionic strengths, as observed with a three-dimensional-
tracking microscope. Applied and Environmental Microbiology 63(9), 3474-3479.
Walker, S.L., Redman, J.A. and Elimelech, M. (2004) Role of cell surface
lipopolysaccharides in Escherichia coli K12 adhesion and transport. Langmuir
20(18), 7736-7746.
Walker, S.L., Redman, J.A. and Elimelech, M. (2005) Influence of growth phase on
bacterial deposition: Interaction mechanisms in packed-bed column and radial
stagnation point flow systems. Environmental Science & Technology 39(17), 6405-
6411.
Wang, D., Bradford, S.A., Harvey, R.W., Gao, B., Cang, L. and Zhou, D. (2012) Humic
acid facilitates the transport of ARS-labeled hydroxyapatite nanoparticles in iron
oxyhydroxide-coated sand. Environmental Science & Technology 46(5), 2738-
2745.

209
Wang, L., Xu, S. and Li, J. (2011) Effects of Phosphate on the transport of Escherichia
coli O157:H7 in saturated quartz sand. Environmental Science & Technology
45(22), 9566-9573.
Wang, Y., Hammes, F., Dueggelin, M. and Egli, T. (2008) Influence of size, shape, and
flexibility on bacterial passage through micropore membrane filters. Environmental
Science & Technology 42(17), 6749-6754.
Weiss, L. and Harlos, J.P. (1972) Short-term interactions between cell surfaces. Progress
in Surface Science 1, Part 4, 355-405.
Weiss, T.H., Mills, A.L., Hornberger, G.M. and Herman, J.S. (1995) Effect of bacterial-
cell shape on transport of bacteria in porous-media. Environmental Science &
Technology 29(7), 1737-1740.
Williams, D.R., Rowe, J.J., Romero, P. and Eagon, R.G. (1978) Denitrifying
Pseudomonas aeruginosa: some parameters of growth and active transport. Applied
and Environmental Microbiology 36(2), 257-263.
Xie, B., Xu, Z., Guo, W. and Li, Q. (2008) Impact of natural organic matter on the
physicochemical properties of aqueous C60 nanoparticles. Environmental Science
& Technology 42(8), 2853-2859.
Xu, S., Liao, Q. and Saiers, J.E. (2008) Straining of nonspherical colloids in saturated
porous media. Environmental Science & Technology 42(3), 771-778.

210
Yang, H.-H., Morrow, J.B., Grasso, D., Vinopal, R.T. and Smets, B.F. (2006) Intestinal
versus external growth conditions change the surficial properties in a collection of
environmental Escherichia coli isolates. Environmental Science & Technology
40(22), 6976-6982.
Yang, H., Kim, H. and Tong, M. (2012a) Influence of humic acid on the transport
behavior of bacteria in quartz sand. Colloids and Surfaces B-Biointerfaces 91, 122-
129.
Yang, H., Tong, M. and Kim, H. (2012b) Influence of bentonite particles on
representative gram negative and gram positive bacterial deposition in porous
media. Environmental Science & Technology 46(21), 11627-11634.
Yao, K.M., Habibian, M.T. and O'Melia, C.R. (1971) Water and wastewater filtration:
Concepts and applications. Environmental Science & Technology 5, 1105-1112.
Yoon, S.S., Hennigan, R.F., Hilliard, G.M., Ochsner, U.A., Parvatiyar, K., Kamani, M.C.,
Allen, H.L., DeKievit, T.R., Gardner, P.R., Schwab, U., Rowe, J.J., Iglewski, B.H.,
McDermott, T.R., Mason, R.P., Wozniak, D.J., Hancock, R.E.W., Parsek, M.R.,
Noah, T.L., Boucher, R.C. and Hassett, D.J. (2002) Pseudomonas aeruginosa
anaerobic respiration in biofilms: Relationships to cystic fibrosis pathogenesis.
Developmental Cell 3(4), 593-603.
Zhang, H., Ulrich, A.C. and Liu, Y. (2015) Retention and transport of an anaerobic
trichloroethene dechlorinating microbial culture in anaerobic porous media.
Colloids and Surfaces B: Biointerfaces 130, 110-118.

211
Zhang, P.F., Johnson, W.P., Scheibe, T.D., Choi, K.H., Dobbs, F.C. and Mailloux, B.J.
(2001) Extended tailing of bacteria following breakthrough at the Narrow Channel
focus area, Oyster, Virginia. Water Resources Research 37(11), 2687-2698.
Zhang, X.Q., Bishop, P.L. and Kinkle, B.K. (1999) Comparison of extraction methods for
quantifying extracellular polymers in biofilms. Water Science and Technology
39(7), 211-218.
Zhao, W., Walker, S.L., Huang, Q. and Cai, P. (2014) Adhesion of bacterial pathogens to
soil colloidal particles: Influences of cell type, natural organic matter, and solution
chemistry. Water Research 53, 35-46.
Zhuang, J., Qi, J. and Jin, Y. (2005) Retention and transport of amphiphilic colloids under
unsaturated flow conditions: Effect of particle size and surface property.
Environmental Science & Technology 39(20), 7853-7859.

212
Appendices

213
Appendix A. Defined Mineral Medium (Chapter 3)
The medium had the following constituents per liter of ultrapure water:
(1) 10 ml of phosphate buffer (20.96 g of KH2PO4 per liter, 42.85 g of K2HPO4 per
liter);
(2) 10 ml of salt solution (53.5 g of NH4Cl per liter, 7.0 g of CaCl2·6H2O per liter, 2.0
g of FeCl2·4H2O per liter);
(3) 2 ml of trace mineral solution [0.3 g of H3BO3 per liter, 0.1 g of ZnCl2 per liter,
0.75 g of NiCl2·6H2O per liter, 1.0 g of MnCl2·4H2O per liter, 0.1 g of
CuCl2·2H2O per liter, 1.5 g of CoCl2·6H2O per liter, 0.02 g of Na2SeO3 per liter,
0.1 g of A12(SO4)3·16H2O per liter, 1 ml of H2SO4 per liter];
(4) 2 ml of MgSO4·7H2O solution (62.5 g/liter);
(5) 1 ml of redox indicator stock solution (1 g of resazurin per liter);
(6) 10 ml of saturated bicarbonate solution (260 g of NaHCO3 per liter);
(7) 10 ml of filter-sterilized vitamin stock solution (0.02 g of biotin per liter, 0.02 g of
folic acid per liter, 0.1 g of pyridoxine hydrochloride per liter, 0.05 g of riboflavin
per liter, 0.05 g of thiamine per liter, 0.05 g of nicotinic acid per liter, 0.05 g of
pantothenic acid per liter, 0.05 g of p-aminobenzoic acid per liter, 0.05 g of
cyanocobalamin per liter, 0.05 g of thioctic acid per liter, 1 g of
mercaptoethanesulfonic acid [coenzyme M] per liter);
(8) 10 ml of an amorphous ferrous sulfide solution [39.2 g of (NH4)2Fe(SO4)2·6H2O
per liter, 24.0 g of Na2S·9H2O per liter] that had been washed three times with
deionized water to remove free sulfide.

214
The bicarbonate, vitamins, and ferrous sulfide were added from sterile stock solutions
after the medium had been autoclaved and cooled while being gassed with N2-CO2 (80:20
[vol/vol]) filtered with sterile 0.22 µm filter. The pH of the medium was usually between
6.8 and 7.0.

215
Appendix B. Detailed Procedure for DNA Isolation (Chapter 3)
A PowerSoil® DNA Isolation Kit (Mo Bio Laboratories, Inc.) was used.
1. To the PowerBead Tubes provided in the kit, add an average of 0.3 gram of
porous media samples or an aliquot of 300 µL of liquid sample.
2. Gently vortex to mix.
3. Check Solution C1. If Solution C1 is precipitated, heat solution to 60 °C until
dissolved before use.
4. Add 60 µL of Solution C1 and invert several times or vortex briefly.
5. Secure PowerBead Tubes horizontally using the MO BIO Vortex Adapter tube
holder for the vortex. Vortex at maximum speed for 10 minutes.
6. Centrifuge tubes at 10,000 g for 30 second at room temperature. Make sure the
PowerBead Tubes rotate freely in the centrifuge without rubbing.
7. Transfer between 400 to 500 µL of the supernatant to a provided clean 2 mL
Collection Tube.
8. Add 250 µL of Solution C2 and vortex for 5 second. Incubate at 4 °C for 5 minute.
9. Centrifuge the tubes at room temperature for 1 min at 10,000 g.
10. Transfer up to, but no more than 600 µL of the supernatant to a provided clean 2
mL Collection Tube. Avoid the pellet.
11. Add 200 µL of Solution C3 and vortex briefly. Incubate at 4 °C for 5 minute.
12. Centrifuge the tubes at room temperature for 1 min at 10,000 g.
13. Transfer up to, but no more than 750 µL of the supernatant to a provided clean 2
mL Collection Tube. Avoid the pellet.

216
14. Shake to mix Solution C4 before use. Add 1200 µL of Solution C4 to the
supernatant and vortex for 5 second.
15. Load approximately 675 µL of the supernatant onto a Spin Filter and centrifuge
the tubes at room temperature for 1 min at 10,000 g. Discard the flow through and
repeat the centrifugation until all supernatant is processed.
16. Add 500 µL of Solution C5 and centrifuge at room temperature for 30 second at
10,000 g.
17. Discard the flow through.
18. Centrifuge again at room temperature for 1 min at 10,000 g.
19. Carefully place spin filter in a provided clean 2 mL Collection Tube. Avoid
splashing any Solution C5 onto the Spin Filter.
20. Add 100 µL of Solution C6 to the center of the white filter membrane. Centrifuge
the tubes at room temperature for 30 second at 10,000 g.
21. Discard the Spin Filter. Store the tube containing DNA at -20 °C.

217
Appendix C. Sequences of Targeted Genes from qPCR (Chapter 3)
Dehalococcoides
Targeting gene: chromosome 16S ribosomal RNA (16S rRNA)
Primer: 1f, 5’-GGA TGA ACG CTA GCG GCG-3’
259r, 5’-CAG ACC AGC TAC CGA TCG AA-3’
Size: 260 base pair
GGATGAACGCTAGCGGCGTGCCTTATGCATGCAAGTCGAACGGTCTTAAGCA
ATTAAGATAGTGGCGAACGGGTGAGTAACGCGTAAGTAACCACCTCTAAGTG
GGGGATAGCTTCGGGAAACTGAAGGTAATACCGCATGTGGTGGACCGACATA
TGTTGGTTCACTAAAGCCGTAAGGCGCTTGGTGAGGGGCTTGCGTCCGATTA
GCTAGTTGGTGGGGTAATGGCCTACCAAGGCTTCGATCGGTAGCTGGTCTG
Geobacter
Targeting gene: chromosome 16S ribosomal RNA
Primer: 73f, 5’-CTT GCT CTT TCA TTT AGT GG-3’
485r, 5’-AAG AAA ACC GGG TAT TAA CC-3’
Size: 413 base pair
CTTGCTCTTTCATTTAGTGGCGCACGGGTGAGTAACGCGTAGATAATCTGC
CTTGGACTCTGGGATAACATCTCGAAAGGGGTGCTAATACCGGATAAGCCCA

218
CGATGGCGTAAGTCATTGCGGGAAAAGGGGGCCTCTGAATATGCTCCTGATT
CAAGATGAGTCTGCGTACCATTAGCTAGTTGGTAGGGTAAGAGCCTACCAAG
GCGACGATGGTTAGCTGGTCTGAGAGGATGATCAGCCACACTGGAACTGAGA
CACGGTCCAGACTCCTACGGGAGGCAGCAGTGGGGAATTTTGCGCAATGGGG
GAAACCCTGACGCAGCAACGCCGCGTGAGTGATGAAGGCTTTCGGGTCGTAA
AGCTCTGTCTAGAGGGAAGAAATGATAGTCGGTTAATACCCGGTTTTCTT
Methanomethylovorans
Targeting gene: chromosome 16S ribosomal RNA
Primer: 166f, 5’-AAA GCT TTT GTG CCT AAG GA-3’
413R, 5’-ATG GAC AGC CAA CAT AGG AT-3’
Size: 223 base pair
AAAGCTTTTGTGCCTAAGGATGGGTCTGCGGTCTATCAGGTTGTAGTGGGTGT
AACGTACCTACTAGCCTACGACGGATACGGGTTGTGGGAGCAAGAGCCCGGA
GATGGATTCTGAGACATGAATCCAGGCCCTACGGGGCGCAGCAGGCGCGAA
AACTTTACAATGCGGGAAACCGCGATAAGGGGACACCGAGTGCCAGCATCCT
ATGTTGGCTGTCCAT

219
Appendix D. Parameter Values used in DLVO Calculations
Chapter 3 Chapter 4 Chapter 5
ε0 (F/m) 8.85E-12
εr (unitless) 79.99 (1 mM) 79.99
79.89 (10 mM)
78.90 (100 mM)
ap (E-07 m) 2.71 (Dehalococcoides) 4.80 (aerobic) 24.5
3.30 (Geobacter) 4.45 (anaerobic)
6.25 (Methanomethylovorans)
κ (1/m) 1.04E+08 (1 mM) 1.04E+08
3.28E+08 (10 mM)
1.04E+09 (100 mM)
h (nm) 0-150
ψp (E-02 V) Dehalococcoides Aerobic -1.99 (modified)
-2.53 (1 mM) -4.14 (1 mM) 3.44 (modified+alum)
-1.99 (10 mM) -3.03 (10 mM)
-1.09 (100 mM) -1.76 (100 mM)
Geobacter Anaerobic
-4.07 (1 mM) -3.87 (1 mM)
-2.70 (10 mM) -3.07 (10 mM)
-1.33 (100 mM) -1.52 (100 mM)
Methanomethylovorans
-4.97 (1 mM)
-3.82 (10 mM)
-2.53 (100 mM)
ψc (E-02 V) -5.10 (1 mM) Aerobic -3.53 (sand)
-5.07 (10 mM) -5.90 (1 mM) 2.62 (sand in alum)
-2.97 (100 mM) -5.65 (10 mM) -4.64 (sand+HA)
-1.76 (100 mM) 2.06 (sand+HA in alum)

220
Anaerobic
-5.10 (1 mM)
-5.07 (10 mM)
-2.97 (100 mM)
A (J) 4.16E-21 6.50E-21
λ (m) 1.00E-07