sand transport and deposition behaviour in subsea
TRANSCRIPT
energies
Article
Sand Transport and Deposition Behaviour in SubseaPipelines for Flow Assurance
Yan Yang 1, Haoping Peng 1 and Chuang Wen 2,*1 School of Petroleum Engineering, Changzhou University, Wujin District, Changzhou 213164, China;
[email protected] (Y.Y.); [email protected] (H.P.)2 Department of Mechanical Engineering, Technical University of Denmark, Nils Koppels Allé,
2800 Kgs. Lyngby, Denmark* Correspondence: [email protected]
Received: 5 October 2019; Accepted: 23 October 2019; Published: 25 October 2019�����������������
Abstract: Sand transport through tubing and pipeline could cause a series of problems to flowassurance, if not properly managed or controlled. The most serious problem is the accumulationand erosion in multiphase flow pipelines and the surface equipment. Therefore, the importance ofunderstanding the transport and deposition behaviour of sands through multiphase flow pipelinescannot be overemphasized. This study presents the sand transport and deposition characteristicsin the complicated multiphase flow pipeline. The numerical result shows that the slurry velocitypresents a uniform distribution in the multiphase flow pipeline at the sand concentration of 5% andthe sand diameter of 50 µm. However, the slurry velocity at the bottom of the pipeline is significantlysmaller than that at the top when the sand concentration and diameter reach 30% and 300 µm,respectively. It indicates that the sand deposition at the bottom of the pipe declines the slurry velocityand transport capacity. The deposition thickness is approximately 10% of the pipe diameter even atthe low concentration of 5% sand with a small sand diameter of 50 µm and a high slurry velocity of1.8 m/s. The sand deposition reaches about 30% of the pipe diameter at the same low concentrationand high slurry velocity when the sand diameter increases to 300 µm.
Keywords: sand transport; deposition; liquid-solid two-phase flow; particle flow; pipeline; flowassurance
1. Introduction
The demand for energy supply is a key issue for the global economy. The petroleum supply playsan important role in primary energy. In the petroleum supply networks, sand transport is generally asevere problem for most oil and gas reservoirs all over the world [1–3]. It is more important especiallyfor the subsea production systems considering the flow assurance. The deposition of solid sand in thepipe bottom and equipment can cause a series of risks. For instance, the formation of the sand bedin the pipeline decreases the flow area and correspondingly increases the frictional pressure losses.Moreover, sand transport can cause erosion and corrosion problems as a result of the impact on thepipe wall and the microbial attack under the sand bed. In addition, the slurry flow containing sandscould lead to equipment failure. Therefore, the deposition and transport of the sand in slurry flowsattract much attention, and it is also a very significant issue in the petroleum industry.
A series of computer-controlled experiments were conducted in a thin fluid (like water) and thekey parameter distribution was obtained at various flow rates, injected sand concentrations, and fluidviscosities [4–6]. Doron et al. [7] experimentally studied the transport behaviour of the coarse solids ina horizontal pipeline. Gillies and Shook [8] employed the traversing gamma-ray gauges to measurethe sand concentration in a horizontal pipeline with coarse solids nominally from 180 to 2400 µm.
Energies 2019, 12, 4070; doi:10.3390/en12214070 www.mdpi.com/journal/energies
Energies 2019, 12, 4070 2 of 12
Their results indicated that the maximal concentration gradient (0.47 in their studies) was irrelevantto the mean velocity. Gillies et al. [9] experimentally studied the sand transport characteristics in ahorizontal pipeline with viscous Newtonian fluids. Their results showed that a pressure gradient of2 kPa/m was required to transport sand in laminar flow. Kaushal et al. [10–13] conducted a series ofexperiments to study the sand transport characteristic in multiphase flow pipelines. The measurementof the pressure drop and concentration was experimentally observed in the liquid-solid slurry flow.Duan et al. [14] investigated experimentally the critical resuspension velocity and the critical depositionvelocity for different size sands in slurry flows. It indicated that the critical resuspension velocity wastwo to three times smaller than the critical deposition velocity. Najmi et al. [15] experimentally studiedthe critical flow rate of gas and liquid to keep particles moving in a horizontal pipeline in stratifiedand intermittent flow with a small liquid hold-up of about 0.02. The volume fraction of the solidphase (0.01–0.1%) was experimentally measured in a horizontal pipeline at a very low concentration.Rice et al. [16] utilized two kinds of particles including the glass and plastic solids to understand thesand transport behaviour in the multiphase flow pipeline.
A computational model was developed by Roco and Shook [17] to predict the quasi-uniformslurry flow with the range of sand volume concentration below 40%. Their simulated results ofconcentration and velocity were compared with experimental data and showed a good agreement.The sand transport process was investigated in a horizontal well by means of numerical simulations [18].Ebadian et al. [19,20] developed an algebraic slip mixture model to predict the sand transport behaviourwithin a horizontal pipeline. Their comparison of the pressure drop between the computationaland experimental results showed a good agreement. Danielson [21] considered the slip velocity todevelop a two-fluid model for the slurry flows, and a good agreement between the simulation andexperiment was obtained in the sand bed height. An analytical near-wall model was developed todescribe the liquid-solid two-phase flow, and the numerical result showed a good agreement with theexperimental concentration [22]. A two-fluid model was proposed to predict the fully suspended slurryflow, and it was validated by experimental data [23–25]. In another study, they proposed an improvedmathematical model for the slurry flow within a horizontal pipeline [26]. The comparison betweenthe simulation and experiment showed that the new model was more accurate than the previous one.Hadinoto [27] adapted the two-fluid flow model to predict the turbulence modulation characteristic ina vertical pipeline at a low solid volume fraction from 0.5% to 4.0%. The numerical and experimentalresults showed that the drag correlation significantly affected the accuracy of the computationalfluid dynamics (CFD simulation). The Euler-granular model was employed by Kaushal et al. [28] topredict the sand transport behaviour in a horizontal pipeline with fine particles at high concentrations.The concentration distributions of the numerical and experimental results were in good agreement.Soepyan et al. [29] developed a CFD model to predict the fluid velocity of the slurry flow in a horizontalpipeline at a low concentration by volume. Table 1 lists recent studies on sand transport and depositionin multiphase flow pipelines with a focus on low concentration conditions. These studies demonstratedthe importance of the effect of sands on the flow process even in low concentrations for multiphaseflow pipelines.
Table 1. Recent studies on sand transport and deposition in multiphase flow pipelines with a focus onlow concentration conditions.
References Sand Size (µm) Sand Concentration (%) Pipe Diameter (mm)
Dabirian et al. 2016 [30] 45–600 0.025–1% 97Najmi et al. 2016 [31] 20–300 0–1% 50Najmi et al. 2016 [32] 150–300 0.01–0.1% 50–100
Dabirian et al. 2018 [33] 150–600 0–1% 50Dabirian et al. 2018 [34] 45–600 0.025–1% 97Tebowei et al. 2018 [35] 255 0.04% 100
Fajemidupe et al. 2019 [36] 212–800 0–0.006% 50.4Leporini et al. 2019 [37] 100–1100 0.0065–0.056% 63Leporini et al. 2019 [38] 45–600 0.00161–0.0538 50–100
Energies 2019, 12, 4070 3 of 12
The purpose of this study is to evaluate the transportation and deposition process of the sandin multiphase flows, which will contribute to the flow assurance of the subsea pipeline system.The novelty of this work includes understanding the sand transportation and deposition behaviour inmultiphase flows under extreme conditions in a complicated pipeline system. This was done in thisstudy with the aim to introduce a numerical simulation to predict the sand transport process with thesand concentration up to 30%. The effect of the particle size and velocity on the sand deposition werecarried out with the Eulerian-Eulerian two-fluid model. The deposition and transport of sands aredescribed in detail in different cross-sections of the multiphase flow pipeline, which contributes tothe understanding of the flow behaviour of this liquid-solid two-phase flow system for oil and gasindustry. The key contribution of this work can be summarized as (a) Development and applicationof a computational fluid dynamics modelling that captures the sand transport process in complexmultiphase flow pipelines, (b) the baseline simulation result of liquid-sand two-phase flows have beenvalidated against experimental data, (c) case studies for the effect of the particle size and the inletvelocity has been carried out with the detailed analysis of flow behaviour.
2. Numerical Approaches
2.1. Governing Equations
The Eulerian two-fluid model was employed to predict the sand transport behaviour in subseamultiphase flow pipelines. In this simulation, the continuous phase was assumed as a Newtonianfluid and the water was utilized as the working fluid. Correspondingly, the mass and the momentumconservation equations were solved individually as follows.
The conservation of mass equation for phase q is [39]:
∂∂t(αqρq) + ∇ · (αqρquq) =
n∑s=1
(.
msq −.
mqs) (1)
where α is the phase volume fraction, ρq is the physical density of phase q, uq is the velocity of phase q,.
msq and.
mqs represents the mass transfer between the phase s and phase q. t is time.The conservation of momentum equation for phase q is described as follows [39]:
∂∂t (αqρquq) + ∇ · (αqρququq) = −αq∇p +∇ · τq + αqρqg+
+n∑
s=1
(Fsq +
.msqusq −
.mqsuqs
)+
(Fq + Fli f t,q + Fwl,q + Fum,q + Ftd,q
) (2)
where τ is the phase stress-strain tensor for phase q:
τq = αqµq(∇uq +∇uq
T)+ αq
(λq −
23µq
)∇ · uqI (3)
where g is the acceleration of gravity, µq and λq are the shear and bulk viscosity of phase q, I is unittensor, Fsq is an interaction force between phases, Fq is an external body force, Flift,q is a lift force, Fwl,q isa wall lubrication force, Fvm,q is a virtual mass force, and Ftd,q is a turbulent dispersion force, p is thepressure shared by all phases. uqs and usq are the interphase velocity.
The liquid-sand two-phase flow presents high turbulence because of the large velocity inmultiphase flow pipelines. In this paper, the standard k-ε turbulence model was employed to solvethe liquid-solid flow as a result of the robustness, economy, and reasonable accuracy. The turbulencekinetic energy, k, and its rate of dissipation, ε, are obtained from the following transport equations [39]:
∂∂t(ρk) +
∂∂xi
(ρkui) =∂∂x j
[(µ+
µt
σk
)∂k∂x j
]+ Gk + Gb − ρε−YM (4)

Energies 2019, 12, 4070 4 of 12
∂∂t(ρε) +
∂∂xi
(ρεui) =∂∂x j
[(µ+
µt
σε
)∂ε∂x j
]+ C1ε
εk(Gk + C3εGb) −C2ερ
ε2
k(5)
µt = ρCµk2
ε(6)
where Gk is the generation of turbulence kinetic energy due to the mean velocity gradients, Gb representsthe generation of turbulence kinetic energy due to buoyancy, YM represents the contribution of thefluctuating dilatation in compressible turbulence to the overall dissipation rate. where Cu, Cε1, Cε2 andCε3 are constants. σk and σε are the turbulent Prandtl numbers for k and ε, respectively. µt is theturbulent viscosity.
2.2. Numerical Schemes
The ANSYS FLUENT [39] software was used as a computational platform for the numericalstudy. The Eulerian multiphase flow model was employed to calculate the liquid-solid flow.The water (liquid) is the primary phase while the sand (solid) is the secondary phase in this study.The pressure-velocity coupling we used was the phase-coupled SIMPLE algorithm. The continuityequation, momentum equations, and turbulence equations were discretized with the second-orderupwind scheme [40,41].
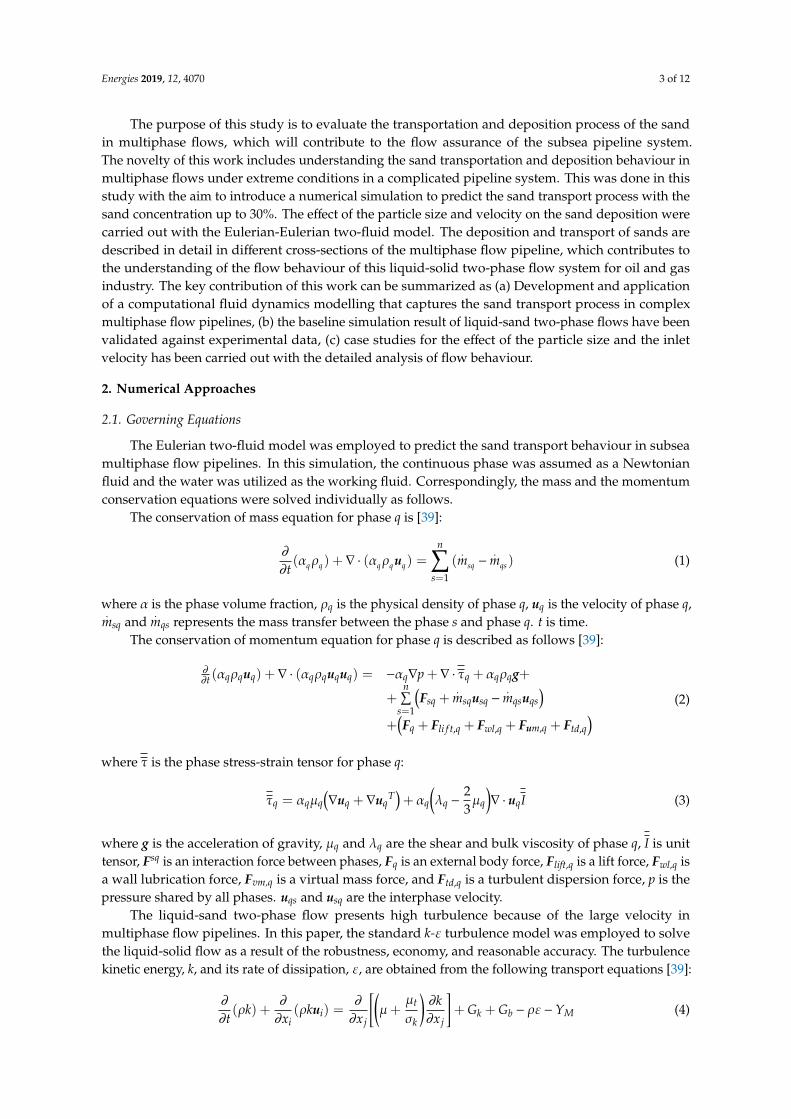
The numerical simulation was conducted in a horizontal pipeline. The pipe diameter and lengthwere 200 mm and 8000 mm, respectively. The structured mesh was employed for the numerical study.The pipe geometry and grid system were shown in Figure 1. The fine mesh near the wall region wasgenerated for exactly capturing the sand deposition and transport information. The velocity andoutflow conditions were assigned to the pipe inlet and outlet, respectively. During the simulation,the following error formula is used to estimate the rightness of calculations and has been added in therevised manuscript.
Rφ =
∑cells P
∣∣∣∑nb anbφnb + b− aPφP∣∣∣∑
cells P
∣∣∣aPφP∣∣∣ (7)
where φ is a general variable, P is the computational cell, Rφ is the computational residual, aP is thecentre coefficient, anb is the influence coefficient for the neighbouring cell, and b is the contribution ofthe constant part of the source term.
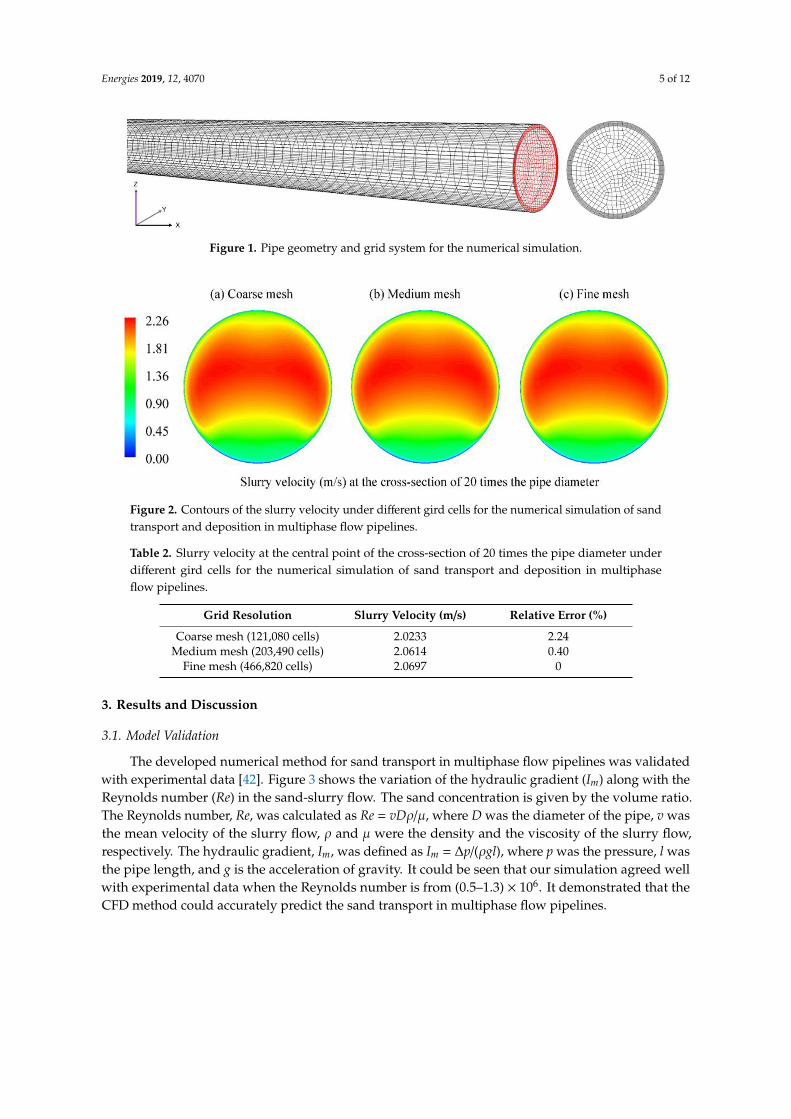
The resolution of the grid is a significant factor to influence the numerical result during thecomputational study of the sand transport and deposition in multiphase flow pipelines. The coarsemesh of 121,080 cells, the medium mesh of 203,490 cells and the fine mesh of 466,820 cells wereemployed here to test the sensitivity of the grid resolution on the numerical simulation. The slurryvelocity at the cross-section of 20 times the pipe diameter was selected as a rational parameter toevaluate the effect of the grid resolution on the flow behaviour. The comparison results were shownin Figure 2 and Table 2, respectively. From the contours of the slurry velocity in Figure 2, it can beobserved that these three different mesh cells predict almost the same distribution of the slurry velocityat the cross-section of 20 times the pipe diameter. Table 2 lists the computed slurry velocity at thecentral point of the cross-section of 20 times the pipe diameter under different gird cells. We cansee that the relative errors for coarse mesh and medium mesh are 0.40% and 2.24%, respectively.Therefore, the medium mesh of 203,490 cells was used for the numerical simulation of sand transportand deposition in multiphase flow pipelines considering the computational cost and accuracy.
Energies 2019, 12, 4070 5 of 12Energies 2019, 12, x FOR PEER REVIEW 5 of 12
Figure 1. Pipe geometry and grid system for the numerical simulation.
Figure 2. Contours of the slurry velocity under different gird cells for the numerical simulation of
sand transport and deposition in multiphase flow pipelines.
Table 2. Slurry velocity at the central point of the cross-section of 20 times the pipe diameter under
different gird cells for the numerical simulation of sand transport and deposition in multiphase flow
pipelines.
Grid Resolution Slurry Velocity (m/s) Relative Error (%)
Coarse mesh (121,080 cells) 2.0233 2.24
Medium mesh (203,490 cells) 2.0614 0.40
Fine mesh (466,820 cells) 2.0697 0
3. Results and Discussion
3.1. Model Validation
The developed numerical method for sand transport in multiphase flow pipelines was validated
with experimental data [42]. Figure 3 shows the variation of the hydraulic gradient (Im) along with
the Reynolds number (Re) in the sand-slurry flow. The sand concentration is given by the volume
ratio. The Reynolds number, Re, was calculated as Re = vDρ/μ, where D was the diameter of the pipe,
v was the mean velocity of the slurry flow, ρ and μ were the density and the viscosity of the slurry
flow, respectively. The hydraulic gradient, Im, was defined as Im = Δp/(ρgl), where p was the pressure,
l was the pipe length, and g is the acceleration of gravity. It could be seen that our simulation agreed
well with experimental data when the Reynolds number is from (0.5–1.3) × 106. It demonstrated that
the CFD method could accurately predict the sand transport in multiphase flow pipelines.
Figure 1. Pipe geometry and grid system for the numerical simulation.
Energies 2019, 12, x FOR PEER REVIEW 5 of 12
Figure 1. Pipe geometry and grid system for the numerical simulation.
Figure 2. Contours of the slurry velocity under different gird cells for the numerical simulation of
sand transport and deposition in multiphase flow pipelines.
Table 2. Slurry velocity at the central point of the cross-section of 20 times the pipe diameter under
different gird cells for the numerical simulation of sand transport and deposition in multiphase flow
pipelines.
Grid Resolution Slurry Velocity (m/s) Relative Error (%)
Coarse mesh (121,080 cells) 2.0233 2.24
Medium mesh (203,490 cells) 2.0614 0.40
Fine mesh (466,820 cells) 2.0697 0
3. Results and Discussion
3.1. Model Validation
The developed numerical method for sand transport in multiphase flow pipelines was validated
with experimental data [42]. Figure 3 shows the variation of the hydraulic gradient (Im) along with
the Reynolds number (Re) in the sand-slurry flow. The sand concentration is given by the volume
ratio. The Reynolds number, Re, was calculated as Re = vDρ/μ, where D was the diameter of the pipe,
v was the mean velocity of the slurry flow, ρ and μ were the density and the viscosity of the slurry
flow, respectively. The hydraulic gradient, Im, was defined as Im = Δp/(ρgl), where p was the pressure,
l was the pipe length, and g is the acceleration of gravity. It could be seen that our simulation agreed
well with experimental data when the Reynolds number is from (0.5–1.3) × 106. It demonstrated that
the CFD method could accurately predict the sand transport in multiphase flow pipelines.
Figure 2. Contours of the slurry velocity under different gird cells for the numerical simulation of sandtransport and deposition in multiphase flow pipelines.
Table 2. Slurry velocity at the central point of the cross-section of 20 times the pipe diameter underdifferent gird cells for the numerical simulation of sand transport and deposition in multiphaseflow pipelines.
Grid Resolution Slurry Velocity (m/s) Relative Error (%)
Coarse mesh (121,080 cells) 2.0233 2.24Medium mesh (203,490 cells) 2.0614 0.40
Fine mesh (466,820 cells) 2.0697 0
3. Results and Discussion
3.1. Model Validation
The developed numerical method for sand transport in multiphase flow pipelines was validatedwith experimental data [42]. Figure 3 shows the variation of the hydraulic gradient (Im) along with theReynolds number (Re) in the sand-slurry flow. The sand concentration is given by the volume ratio.The Reynolds number, Re, was calculated as Re = vDρ/µ, where D was the diameter of the pipe, v wasthe mean velocity of the slurry flow, ρ and µ were the density and the viscosity of the slurry flow,respectively. The hydraulic gradient, Im, was defined as Im = ∆p/(ρgl), where p was the pressure, l wasthe pipe length, and g is the acceleration of gravity. It could be seen that our simulation agreed wellwith experimental data when the Reynolds number is from (0.5–1.3) × 106. It demonstrated that theCFD method could accurately predict the sand transport in multiphase flow pipelines.

Energies 2019, 12, 4070 6 of 12Energies 2019, 12, x FOR PEER REVIEW 6 of 12
Figure 3. Effect of Reynolds number on the hydraulic gradient in sand-slurry flows (a) Set-up for
experiments [32] and (b) comparison between experiments [32] and simulations.
3.2. Slurry Velocity
The sand content in multiphase flow pipelines is usually very small. However, the sand content
of up to 30% is employed in this simulation for accelerated transport and deposition considering
some extreme circumstances. Figures 4 and 5 present the liquid velocities at different cross-sections
of multiphase flow pipelines in various slurry flows with the inlet velocity of 1.8 m/s. The detailed
inputs for the numerical stet-up are listed in Table 3.
Table 3. Detailed inputs for the numerical simulation of sand transport and deposition.
Numerical Inputs Value
Diameter of the Pipe (mm) 200
Length of the Pipe (mm) 8000
Sand size (μm) 50, 300
Sand concentration (%) 5, 30
Inlet velocity of the slurry flow 1.8
Figure 4. Liquid velocity at different cross-sections, vin = 1.8 m/s, d = 50 µm, c = 5%.
Figure 3. Effect of Reynolds number on the hydraulic gradient in sand-slurry flows (a) Set-up forexperiments [32] and (b) comparison between experiments [32] and simulations.
3.2. Slurry Velocity
The sand content in multiphase flow pipelines is usually very small. However, the sand contentof up to 30% is employed in this simulation for accelerated transport and deposition consideringsome extreme circumstances. Figures 4 and 5 present the liquid velocities at different cross-sections ofmultiphase flow pipelines in various slurry flows with the inlet velocity of 1.8 m/s. The detailed inputsfor the numerical stet-up are listed in Table 3.
Table 3. Detailed inputs for the numerical simulation of sand transport and deposition.
Numerical Inputs Value
Diameter of the Pipe (mm) 200Length of the Pipe (mm) 8000
Sand size (µm) 50, 300Sand concentration (%) 5, 30
Inlet velocity of the slurry flow 1.8
Energies 2019, 12, x FOR PEER REVIEW 6 of 12
Figure 3. Effect of Reynolds number on the hydraulic gradient in sand-slurry flows (a) Set-up for
experiments [32] and (b) comparison between experiments [32] and simulations.
3.2. Slurry Velocity
The sand content in multiphase flow pipelines is usually very small. However, the sand content
of up to 30% is employed in this simulation for accelerated transport and deposition considering
some extreme circumstances. Figures 4 and 5 present the liquid velocities at different cross-sections
of multiphase flow pipelines in various slurry flows with the inlet velocity of 1.8 m/s. The detailed
inputs for the numerical stet-up are listed in Table 3.
Table 3. Detailed inputs for the numerical simulation of sand transport and deposition.
Numerical Inputs Value
Diameter of the Pipe (mm) 200
Length of the Pipe (mm) 8000
Sand size (μm) 50, 300
Sand concentration (%) 5, 30
Inlet velocity of the slurry flow 1.8
Figure 4. Liquid velocity at different cross-sections, vin = 1.8 m/s, d = 50 µm, c = 5%. Figure 4. Liquid velocity at different cross-sections, vin = 1.8 m/s, d = 50 µm, c = 5%.

Energies 2019, 12, 4070 7 of 12Energies 2019, 12, x FOR PEER REVIEW 7 of 12
Figure 5. Liquid velocity at different cross-sections, vin = 1.8 m/s, d = 300 µm, c = 30%.
Under the condition of the lower concentration of the fine sand (d = 50 µm, c = 5%), we could see
from Figure 4 that the slurry velocities generally presented a uniform distribution in the turbulence
area. Correspondingly, the vertical slurry velocity was symmetrical about the central axis. However,
it could be seen from Figure 5 that the slurry velocities showed an extraordinarily nonuniform
distribution in the higher concentration of the coarse sand (d = 300 µm, c = 30%). In this higher
concentration condition, the slurry velocities near the pipe top area were obviously larger than those
close to the bottom area of the pipe. One of the major reasons was that the sands deposited in the
pipe bottom in the slurry flow because of the large density difference between the liquid and the sand.
In addition, the slurry velocities near the pipe wall area declined sharply due to the strong viscous
shear stress in the turbulent boundary layer and non-slip boundary condition. This indicated that the
liquids consumed more energy to carry these solid sands.
3.3. Sand Concentration
Figure 6 shows the sand concentration at different cross-sections away from the inlet of the
pipeline. The initial computational condition included the sand concentration of 5%, the sand
diameter of 50 µm and the slurry velocity of 1.8 m/s, respectively. It can be seen from these
concentration contours that the sand can hardly settle in the pipe bottom within the distance of 10
times the pipe diameter from the pipe inlet (Figure 6a). After that, the sand begins to deposit as a
result of the effect of the gravitational force along with the flow direction. In these simulation cases,
the sand deposition was observed at the cross-section of 20 times the pipe diameter (Figure 6b). The
deposition of the solid sand can be obviously found when the distance from the pipe inlet reaches 30
times the pipe diameter (Figure 6c). In other words, the thickness of the sand deposition is very small
and it accordingly could be ignored, when the sand travelled less than 10 times the pipe diameter.
Nevertheless, the deposition thickness reached approximately 10% of the pipe diameter, when the
sand travelled about 30 times the pipe diameter in this simulation case.
Figure 5. Liquid velocity at different cross-sections, vin = 1.8 m/s, d = 300 µm, c = 30%.
Under the condition of the lower concentration of the fine sand (d = 50 µm, c = 5%), we could seefrom Figure 4 that the slurry velocities generally presented a uniform distribution in the turbulence area.Correspondingly, the vertical slurry velocity was symmetrical about the central axis. However, it couldbe seen from Figure 5 that the slurry velocities showed an extraordinarily nonuniform distributionin the higher concentration of the coarse sand (d = 300 µm, c = 30%). In this higher concentrationcondition, the slurry velocities near the pipe top area were obviously larger than those close to thebottom area of the pipe. One of the major reasons was that the sands deposited in the pipe bottom inthe slurry flow because of the large density difference between the liquid and the sand. In addition,the slurry velocities near the pipe wall area declined sharply due to the strong viscous shear stressin the turbulent boundary layer and non-slip boundary condition. This indicated that the liquidsconsumed more energy to carry these solid sands.
3.3. Sand Concentration
Figure 6 shows the sand concentration at different cross-sections away from the inlet of thepipeline. The initial computational condition included the sand concentration of 5%, the sand diameterof 50 µm and the slurry velocity of 1.8 m/s, respectively. It can be seen from these concentrationcontours that the sand can hardly settle in the pipe bottom within the distance of 10 times the pipediameter from the pipe inlet (Figure 6a). After that, the sand begins to deposit as a result of the effectof the gravitational force along with the flow direction. In these simulation cases, the sand depositionwas observed at the cross-section of 20 times the pipe diameter (Figure 6b). The deposition of the solidsand can be obviously found when the distance from the pipe inlet reaches 30 times the pipe diameter(Figure 6c). In other words, the thickness of the sand deposition is very small and it accordingly couldbe ignored, when the sand travelled less than 10 times the pipe diameter. Nevertheless, the depositionthickness reached approximately 10% of the pipe diameter, when the sand travelled about 30 times thepipe diameter in this simulation case.

Energies 2019, 12, 4070 8 of 12Energies 2019, 12, x FOR PEER REVIEW 8 of 12
Figure 6. Sand concentration contours at different cross-sections of the multiphase flow pipeline.
3.4. Effect of the Particle Size
The effect of the particle size on the sand deposition was numerically simulated at the inlet
velocity of 1.8 m/s with a sand concentration of 5%. The detailed inputs for the numerical stet-up are
listed in Table 4. The sand diameter is assumed to be 50 μm, 150 μm, and 300 μm, respectively. The
results of the sand concentration are shown in Figure 7 at the cross-section of 30 times the pipe
diameter. We can see that the height of the sand bed in the pipe bottom is small when the particle
diameter is less than 50 μm. However, the height of the sand bed increases rapidly and it is even
approximately equal to one-third of the pipe diameter when the sand diameter reaches 300 μm.
Under this condition, the slurry flow cannot carry the coarse sand and correspondingly the severe
deposition occurs in this low velocity of 1.8 m/s. It indicates that the sands cannot be carried by the
liquid and the deposition will inhibit the flow assurance, especially for the subsea multiphase flow
pipeline system.
Table 4. Detailed inputs for the numerical simulation of sand transport and deposition under the
condition of different particle sizes.
Numerical Inputs Value
Diameter of the Pipe (mm) 200
Length of the Pipe (mm) 8000
Sand size (μm) 50, 150, 300
Sand concentration (%) 5
Inlet velocity of the slurry flow 1.8
Figure 6. Sand concentration contours at different cross-sections of the multiphase flow pipeline.
3.4. Effect of the Particle Size
The effect of the particle size on the sand deposition was numerically simulated at the inlet velocityof 1.8 m/s with a sand concentration of 5%. The detailed inputs for the numerical stet-up are listed inTable 4. The sand diameter is assumed to be 50 µm, 150 µm, and 300 µm, respectively. The resultsof the sand concentration are shown in Figure 7 at the cross-section of 30 times the pipe diameter.We can see that the height of the sand bed in the pipe bottom is small when the particle diameter isless than 50 µm. However, the height of the sand bed increases rapidly and it is even approximatelyequal to one-third of the pipe diameter when the sand diameter reaches 300 µm. Under this condition,the slurry flow cannot carry the coarse sand and correspondingly the severe deposition occurs in thislow velocity of 1.8 m/s. It indicates that the sands cannot be carried by the liquid and the depositionwill inhibit the flow assurance, especially for the subsea multiphase flow pipeline system.
Table 4. Detailed inputs for the numerical simulation of sand transport and deposition under thecondition of different particle sizes.
Numerical Inputs Value
Diameter of the Pipe (mm) 200Length of the Pipe (mm) 8000
Sand size (µm) 50, 150, 300Sand concentration (%) 5
Inlet velocity of the slurry flow 1.8
Energies 2019, 12, x FOR PEER REVIEW 8 of 12
Figure 6. Sand concentration contours at different cross-sections of the multiphase flow pipeline.
3.4. Effect of the Particle Size
The effect of the particle size on the sand deposition was numerically simulated at the inlet
velocity of 1.8 m/s with a sand concentration of 5%. The detailed inputs for the numerical stet-up are
listed in Table 4. The sand diameter is assumed to be 50 μm, 150 μm, and 300 μm, respectively. The
results of the sand concentration are shown in Figure 7 at the cross-section of 30 times the pipe
diameter. We can see that the height of the sand bed in the pipe bottom is small when the particle
diameter is less than 50 μm. However, the height of the sand bed increases rapidly and it is even
approximately equal to one-third of the pipe diameter when the sand diameter reaches 300 μm.
Under this condition, the slurry flow cannot carry the coarse sand and correspondingly the severe
deposition occurs in this low velocity of 1.8 m/s. It indicates that the sands cannot be carried by the
liquid and the deposition will inhibit the flow assurance, especially for the subsea multiphase flow
pipeline system.
Table 4. Detailed inputs for the numerical simulation of sand transport and deposition under the
condition of different particle sizes.
Numerical Inputs Value
Diameter of the Pipe (mm) 200
Length of the Pipe (mm) 8000
Sand size (μm) 50, 150, 300
Sand concentration (%) 5
Inlet velocity of the slurry flow 1.8
Figure 7. Sand concentration contours at the cross-section of 30 times the pipe diameter under thecondition of different sand sizes (vin = 1.8 m/s, c = 5%).
Energies 2019, 12, 4070 9 of 12
3.5. Effect of the Inlet Velocity
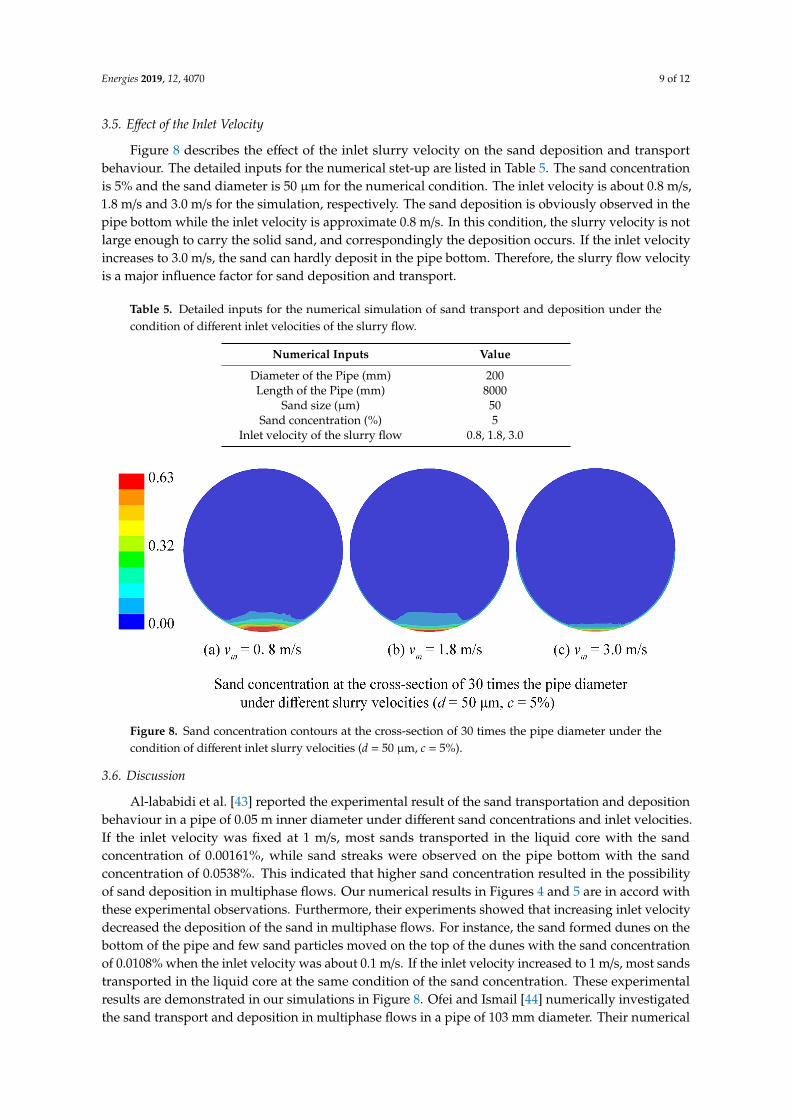
Figure 8 describes the effect of the inlet slurry velocity on the sand deposition and transportbehaviour. The detailed inputs for the numerical stet-up are listed in Table 5. The sand concentrationis 5% and the sand diameter is 50 µm for the numerical condition. The inlet velocity is about 0.8 m/s,1.8 m/s and 3.0 m/s for the simulation, respectively. The sand deposition is obviously observed in thepipe bottom while the inlet velocity is approximate 0.8 m/s. In this condition, the slurry velocity is notlarge enough to carry the solid sand, and correspondingly the deposition occurs. If the inlet velocityincreases to 3.0 m/s, the sand can hardly deposit in the pipe bottom. Therefore, the slurry flow velocityis a major influence factor for sand deposition and transport.
Table 5. Detailed inputs for the numerical simulation of sand transport and deposition under thecondition of different inlet velocities of the slurry flow.
Numerical Inputs Value
Diameter of the Pipe (mm) 200Length of the Pipe (mm) 8000
Sand size (µm) 50Sand concentration (%) 5
Inlet velocity of the slurry flow 0.8, 1.8, 3.0
Energies 2019, 12, x FOR PEER REVIEW 9 of 12
Figure 7. Sand concentration contours at the cross-section of 30 times the pipe diameter under the
condition of different sand sizes (vin = 1.8 m/s, c = 5%).
3.5. Effect of the Inlet Velocity
Figure 8 describes the effect of the inlet slurry velocity on the sand deposition and transport
behaviour. The detailed inputs for the numerical stet-up are listed in Table 5. The sand concentration
is 5% and the sand diameter is 50 μm for the numerical condition. The inlet velocity is about 0.8 m/s,
1.8 m/s and 3.0 m/s for the simulation, respectively. The sand deposition is obviously observed in the
pipe bottom while the inlet velocity is approximate 0.8 m/s. In this condition, the slurry velocity is
not large enough to carry the solid sand, and correspondingly the deposition occurs. If the inlet
velocity increases to 3.0 m/s, the sand can hardly deposit in the pipe bottom. Therefore, the slurry
flow velocity is a major influence factor for sand deposition and transport.
Table 5. Detailed inputs for the numerical simulation of sand transport and deposition under the
condition of different inlet velocities of the slurry flow.
Numerical Inputs Value
Diameter of the Pipe (mm) 200
Length of the Pipe (mm) 8000
Sand size (μm) 50
Sand concentration (%) 5
Inlet velocity of the slurry flow 0.8, 1.8, 3.0
Figure 8. Sand concentration contours at the cross-section of 30 times the pipe diameter under the
condition of different inlet slurry velocities (d = 50 μm, c = 5%).
3.6. Discussion
Al-lababidi et al. [43] reported the experimental result of the sand transportation and deposition
behaviour in a pipe of 0.05 m inner diameter under different sand concentrations and inlet velocities.
If the inlet velocity was fixed at 1 m/s, most sands transported in the liquid core with the sand
concentration of 0.00161%, while sand streaks were observed on the pipe bottom with the sand
concentration of 0.0538%. This indicated that higher sand concentration resulted in the possibility of
sand deposition in multiphase flows. Our numerical results in Figures 4 and 5 are in accord with
these experimental observations. Furthermore, their experiments showed that increasing inlet
velocity decreased the deposition of the sand in multiphase flows. For instance, the sand formed
dunes on the bottom of the pipe and few sand particles moved on the top of the dunes with the sand
concentration of 0.0108% when the inlet velocity was about 0.1 m/s. If the inlet velocity increased to
Figure 8. Sand concentration contours at the cross-section of 30 times the pipe diameter under thecondition of different inlet slurry velocities (d = 50 µm, c = 5%).
3.6. Discussion
Al-lababidi et al. [43] reported the experimental result of the sand transportation and depositionbehaviour in a pipe of 0.05 m inner diameter under different sand concentrations and inlet velocities.If the inlet velocity was fixed at 1 m/s, most sands transported in the liquid core with the sandconcentration of 0.00161%, while sand streaks were observed on the pipe bottom with the sandconcentration of 0.0538%. This indicated that higher sand concentration resulted in the possibilityof sand deposition in multiphase flows. Our numerical results in Figures 4 and 5 are in accord withthese experimental observations. Furthermore, their experiments showed that increasing inlet velocitydecreased the deposition of the sand in multiphase flows. For instance, the sand formed dunes on thebottom of the pipe and few sand particles moved on the top of the dunes with the sand concentrationof 0.0108% when the inlet velocity was about 0.1 m/s. If the inlet velocity increased to 1 m/s, most sandstransported in the liquid core at the same condition of the sand concentration. These experimentalresults are demonstrated in our simulations in Figure 8. Ofei and Ismail [44] numerically investigatedthe sand transport and deposition in multiphase flows in a pipe of 103 mm diameter. Their numerical

Energies 2019, 12, 4070 10 of 12
results showed that the maximum sand concentrations deposited on the pipe bottom were 15.1%,21.5%, 25.8%, and 30.7% for the particle size of dp = 90 µm, 150 µm, 210 µm, and 270 µm, respectively.This illustrated that larger sand particles could accumulate on the pipe bottom and lead to the safetyissue of the pipe operation. Our results in Figure 7 agree well with this trend of the particle size effectin point view of the qualitative analysis.
4. Conclusions
The Eulerian two-fluid model was developed to predict the transport and deposition behaviour ofsands in multiphase flow pipelines. The numerical result shows that the slurry velocities at the verticalcross-section presented an extraordinarily non-uniform distribution in a higher concentration of thecoarse sand compared to the condition of lower concentration of the fine sand. The sand could hardlysettle in the pipe bottom at the cross-section of 10 times the pipe diameter, while the deposition wasobviously observed at the cross-section of 30 times the pipe diameter. If the sand diameter was 300 µm,the height of the sand bed would increase rapidly and it even approximately equal to one-third of thepipe diameter. For the sand diameter of 50 µm with a concentration of 5% slurry flow, the depositionwas obviously observed in the pipe bottom with the inlet velocity of 0.8 m/s. The sand could hardlydeposit in the pipe bottom if the inlet velocity increased to 3.0 m/s.
For the future work, we are carrying out the numerical and experimental studies on gas-liquid-solidmultiphase flows in inclined pipelines, which will focus on the sand transport and deposition behaviourin this complicated pipeline system. The fluid flow analysis will be integrated to study the particleerosion issue, which is expected to contribute to the flow assurance of the complex oil and gaspipeline system.
Author Contributions: Conceptualization, Y.Y. and C.W.; formal analysis, Y.Y. and C.W.; writing—original draftpreparation, Y.Y.; writing—review and editing, Y.Y., H.P., and C.W.; all authors read and approved thefinal manuscript.
Funding: This research was funded by the National Natural Science Foundation of China (No. 51606015).
Conflicts of Interest: The authors declare no conflict of interest.
References
1. Dotto, G.L.; dos Santos, J.N.; Rosa, R.; Pinto, L.A.A.; Pavan, F.A.; Lima, E.C. Fixed bed adsorption ofMethylene Blue by ultrasonic surface modified chitin supported on sand. Chem. Eng. Res. Des. 2005, 100,302–310. [CrossRef]
2. Danielson, T.J. Transient multiphase flow: Past, present, and future with flow assurance perspective. EnergyFuels 2012, 26, 4137–4144. [CrossRef]
3. Zorgani, E.; Al-Awadi, H.; Yan, W.; Al-Lababid, S.; Yeung, H.; Fairhurst, C.P. Viscosity effects on sand flowregimes and transport velocity in horizontal pipelines. Exp. Therm. Fluid Sci. 2018, 92, 89–96. [CrossRef]
4. Medlin, W.L.; Sexton, J.H.; Zumwalt, G.L. Sand transport experiments in thin fluids. In Proceedings of theSPE Annual Technical Conference and Exhibition, Las Vegas, NV, USA, 22–26 September, 1985.
5. Gao, H.; Guo, L.J.; Zhang, X.M. Liquid-solid separation phenomena of two-phase turbulent flow in curvedpipes. Int. J. Heat Mass Transf. 2002, 45, 4995–5005. [CrossRef]
6. Kassai, M. Effectiveness and humidification capacity investigation of liquid-to-air membrane energyexchanger under low heat capacity ratios at winter air conditions. J. Therm. Sci. 2015, 24, 391–397. [CrossRef]
7. Doron, P.; Granica, D.; Barnea, D. Slurry flow in horizontal pipes—Experimental and modeling. Int. J.Multiph. Flow 1987, 13, 535–547. [CrossRef]
8. Gillies, R.G.; Shook, C.A. Concentration distributions of sand slurries in horizontal pipe flow. Part. Sci.Technol. 1994, 12, 45–69. [CrossRef]
9. Gillies, R.G.; Hill, K.B.; Mckibben, M.J.; Shook, C.A. Solids transport by laminar Newtonian flows. PowderTechnol. 1999, 104, 269–277. [CrossRef]
10. Kaushal, D.R.; Tomita, Y. Solids concentration profiles and pressure drop in pipeline flow of multisizedparticulate slurries. Int. J. Multiph. Flow 2002, 28, 1697–1717. [CrossRef]

Energies 2019, 12, 4070 11 of 12
11. Kaushal, D.R.; Tomita, Y. Comparative study of pressure drop in multisized particulate slurry flow throughpipe and rectangular duct. Int. J. Multiph. Flow 2003, 29, 1473–1487. [CrossRef]
12. Kaushal, D.R.; Sato, K.; Toyota, T.; Funatsu, K.; Tomita, Y. Effect of particle size distribution on pressuredrop and concentration profile in pipeline flow of highly concentrated slurry. Int. J. Multiph. Flow 2005, 31,809–823. [CrossRef]
13. Kaushal, D.R.; Tomita, Y. Experimental investigation for near-wall lift of coarser particles in slurry pipelineusing γ-ray densitometer. Powder Technol. 2007, 172, 177–187. [CrossRef]
14. Duan, M.; Miska, S.Z.; Yu, M.; Takach, N.E.; Ahmed, R.M.; Zettner, C.M. Critical conditions for effectivesand-sized solids transport in horizontal and high-angle wells. SPE Dril. Com. 2009, 24, 229–238. [CrossRef]
15. Najmi, K.; Hill, A.L.; McLaury, B.S.; Shirazi, S.A.; Cremaschi, S. Experimental study of low concentration sandtransport in multiphase air–water horizontal pipelines. J. Energy Res. Technol. 2015, 137, 032908. [CrossRef]
16. Rice, H.P.; Fairweather, M.; Peakall, J.; Hunter, T.N.; Mahmoud, B.; Biggs, S.R. Measurement of particleconcentration in horizontal, multiphase pipe flow using acoustic methods: Limiting concentration and theeffect of attenuation. Chem. Eng. Sci. 2015, 126, 745–758. [CrossRef]
17. Roco, M.C.; Shook, C.A. Modeling of slurry flow: The effect of particle size. Can. J. Chem. Eng. 1983, 61,494–503. [CrossRef]
18. Doan, Q.; Ali, S.M.; George, A.E.; Oguztoreli, M. Simulation of sand transport in a horizontal well. InProceedings of the International Conference on Horizontal Well Technology, Calgary, AB, Canada, 18–20November 1996; Richardson, Texas, USA, 1996.
19. Ling, J.; Skudarnov, P.V.; Lin, C.X.; Ebadian, M.A. Numerical investigations of liquid-solid slurry flows in afully developed turbulent flow region. Int. J. Heat Fluid Flow 2003, 24, 389–398. [CrossRef]
20. Lin, C.X.; Ebadian, M.A. A numerical study of developing slurry flow in the entrance region of a horizontalpipe. Comput. Fluids 2008, 37, 965–974. [CrossRef]
21. Danielson, T.J. Sand transport modeling in multiphase pipelines. In Proceedings of the Offshore TechnologyConference, Houston, TX, USA, 30 April–3 May 2007.
22. Wilson, K.C.; Sanders, R.S.; Gillies, R.G.; Shook, C.A. Verification of the near-wall model for slurry flow.Powder Technol. 2010, 197, 247–253. [CrossRef]
23. Messa, G.V.; Malin, M.; Malavasi, S. Numerical prediction of fully-suspended slurry flow in horizontal pipes.Powder Technol. 2014, 256, 61–70. [CrossRef]
24. Shi, D.P.; Luo, Z.H.; Zheng, Z.W. Numerical simulation of liquid-solid two-phase flow in a tubular looppolymerization reactor. Powder Technol. 2010, 198, 135–143. [CrossRef]
25. Kassai, M. Experimental investigation on the effectiveness of sorption energy recovery wheel in ventilationsystem. Exp. Heat Transfer 2018, 31, 106–120. [CrossRef]
26. Messa, G.V.; Malavasi, S. Improvements in the numerical prediction of fully-suspended slurry flow inhorizontal pipes. Powder Technol. 2015, 270, 358–367. [CrossRef]
27. Hadinoto, K. Predicting turbulence modulations at different Reynolds numbers in dilute-phase turbulentliquid–particle flow simulations. Chem. Eng. Sci. 2010, 65, 5297–5308. [CrossRef]
28. Kaushal, D.R.; Thinglas, T.; Tomita, Y.; Kuchii, S.; Tsukamoto, H. CFD modeling for pipeline flow of fineparticles at high concentration. Int. J. Multiph. Flow 2012, 43, 85–100. [CrossRef]
29. Soepyan, F.B.; Cremaschi, S.; Sarica, C.; Subramani, H.J.; Kouba, G.E. Solids transport models comparisonand fine-tuning for horizontal, low concentration flow in single-phase carrier fluid. AIChE J. 2014, 60, 76–122.[CrossRef]
30. Dabirian, R.; Mohan, R.; Shoham, O.; Kouba, G. Critical sand deposition velocity for gas-liquid stratifiedflow in horizontal pipes. J. Nat. Gas Sci. Eng. 2016, 33, 527–537. [CrossRef]
31. Najmi, K.; McLaury, B.S.; Shirazi, S.A.; Cremaschi, S. The effect of viscosity on low concentration particletransport in single-phase (liquid) horizontal pipes. J. Energy Res. Technol. 2016, 138, 032902. [CrossRef]
32. Najmi, K.; McLaury, B.S.; Shirazi, S.A.; Cremaschi, S. Low concentration sand transport in multiphase viscoushorizontal pipes: An experimental study and modeling guideline. AIChE J. 2016, 62, 1821–1833. [CrossRef]
33. Dabirian, R.; Arabnejad Khanouki, H.; Mohan, R.S.; Shoham, O. Numerical Simulation and Modeling ofCritical Sand-Deposition Velocity for Solid/Liquid Flow. SPE Prod. Oper. 2018, 33, 866–878. [CrossRef]
34. Dabirian, R.; Mohan, R.; Shoham, O.; Kouba, G. Sand Transport in Slightly Upward Inclined MultiphaseFlow. J. Energy Res. Technol. 2018, 140, 072901. [CrossRef]

Energies 2019, 12, 4070 12 of 12
35. Tebowei, R.; Hossain, M.; Islam, S.Z.; Droubi, M.G.; Oluyemi, G. Investigation of sand transport in anundulated pipe using computational fluid dynamics. J. Pet. Sci. Eng. 2018, 162, 747–762. [CrossRef]
36. Fajemidupe, O.T.; Aliyu, A.M.; Baba, Y.D.; Archibong-Eso, A.; Yeung, H. Sand minimum transport conditionsin gas–solid–liquid three-phase stratified flow in a horizontal pipe at low particle concentrations. Chem. Eng.Res. Des. 2019, 143, 114–126. [CrossRef]
37. Leporini, M.; Marchetti, B.; Corvaro, F.; di Giovine, G.; Polonara, F.; Terenzi, A. Sand transport in multiphaseflow mixtures in a horizontal pipeline: An experimental investigation. Petroleum 2019, 5, 161–170. [CrossRef]
38. Leporini, M.; Terenzi, A.; Marchetti, B.; Corvaro, F.; Polonara, F. On the numerical simulation of sandtransport in liquid and multiphase pipelines. J. Pet. Sci. Eng. 2019, 175, 519–535. [CrossRef]
39. ANSYS Fluent. 18.0 ANSYS Fluent Theory Guide 18.0; ANSYS Fluent: Canonsburg, PA, USA, 2017.40. Yang, Y.; Zhu, X.; Yan, Y.; Ding, H.; Wen, C. Performance of supersonic steam ejectors considering the
nonequilibrium condensation phenomenon for efficient energy utilisation. Appl. Energy 2019, 242, 157–167.[CrossRef]
41. Wen, C.; Karvounis, N.; Walther, J.H.; Yan, Y.; Feng, Y.; Yang, Y. An efficient approach to separate CO2 usingsupersonic flows for carbon capture and storage. Appl. Energy 2019, 238, 311–319. [CrossRef]
42. Kim, C.; Lee, M.; Han, C. Hydraulic transport of sand-water mixtures in pipelines Part I. Experiment. J. Mech.Sci. Technol. 2008, 22, 2534–2541. [CrossRef]
43. Al-Lababidi, S.; Yan, W.; Yeung, H. Sand transportations and deposition characteristics in multiphase flowsin pipelines. J. Energy Res. Technol. 2012, 134, 034501. [CrossRef]
44. Ofei, T.N.; Ismail, A.Y. Eulerian-Eulerian simulation of particle-liquid slurry flow in horizontal pipe. J. Pet.Eng. 2016, 2016, 5743471. [CrossRef]
© 2019 by the authors. Licensee MDPI, Basel, Switzerland. This article is an open accessarticle distributed under the terms and conditions of the Creative Commons Attribution(CC BY) license (http://creativecommons.org/licenses/by/4.0/).